Embed Size (px)
Citation preview

George Putnam Balanced Fund
FUND SYMBOL CLASS A
PGEOX
Annual report 7 | 31 | 21
Asset allocation funds invest in a mix of many different types of investments to help weather changing market environments.

George Putnam Balanced FundAnnual report 7 | 31 | 21
Message from the Trustees 1
About the fund 2
Interview with your fund’s portfolio managers 5
Your fund’s performance 10
Your fund’s expenses 14
Consider these risks before investing 16
Terms and definitions 17
Other information for shareholders 18
Important notice regarding Putnam’s privacy policy 20
Trustee approval of management contract 21
Audited financial statements 25
Report of Independent Registered Public Accounting Firm 26
Federal tax information 68
About the Trustees 69
Officers 71
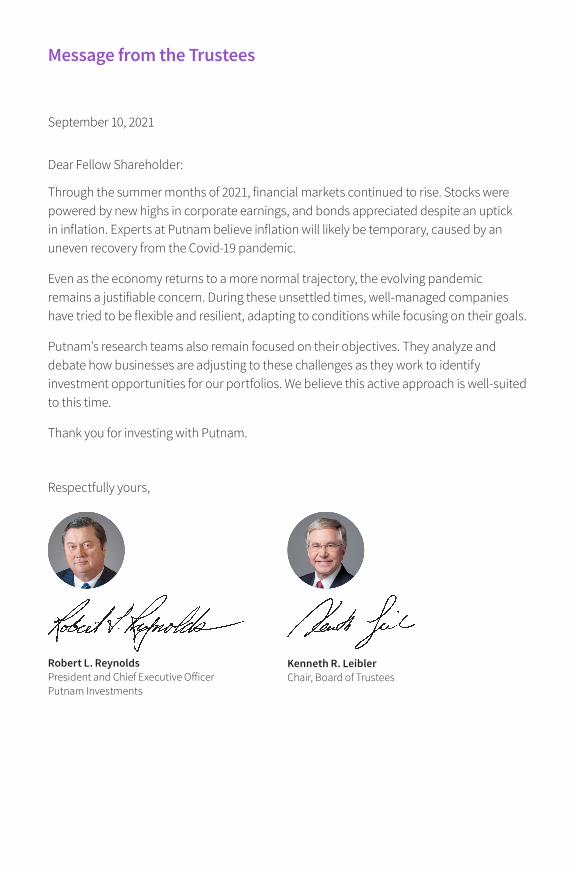
September 10, 2021
Dear Fellow Shareholder:
Through the summer months of 2021, financial markets continued to rise. Stocks were powered by new highs in corporate earnings, and bonds appreciated despite an uptick in inflation. Experts at Putnam believe inflation will likely be temporary, caused by an uneven recovery from the Covid-19 pandemic.
Even as the economy returns to a more normal trajectory, the evolving pandemic remains a justifiable concern. During these unsettled times, well-managed companies have tried to be flexible and resilient, adapting to conditions while focusing on their goals.
Putnam’s research teams also remain focused on their objectives. They analyze and debate how businesses are adjusting to these challenges as they work to identify investment opportunities for our portfolios. We believe this active approach is well-suited to this time.
Thank you for investing with Putnam.
Respectfully yours,
Robert L. ReynoldsPresident and Chief Executive OfficerPutnam Investments
Kenneth R. LeiblerChair, Board of Trustees
Message from the Trustees

About the fund
A mix of stocks and bonds in a classic balanced portfolio George Putnam Balanced Fund was introduced in 1937, at a time when many investors considered the stock market to be risky. Named for the founder of Putnam Investments, the fund offered an innovative concept for the time — a diversified portfolio with bonds to balance the risk of stocks.
A balanced approach, grounded in researchThe fund’s classic balanced approach continues to serve investors today, under the leadership of seasoned portfolio managers who use fundamental research to find opportunities and manage risk.
Kathryn B. LakinPortfolio Manager Director of Equity Research Industry since 2008 At Putnam since 2012
Paul D. Scanlon, CFAPortfolio Manager Co-Head of Corporate and Tax-exempt CreditIndustry since 1986At Putnam since 1999
Andrew C. BensonPortfolio Manager Industry since 2008 At Putnam since 2008
The fund’s diversification and balanced approach are designed to moderate volatility for investors.
2 George Putnam Balanced Fund
Diversification does not guarantee a profit or ensure against loss. It is possible to lose money in a diversified portfolio.

Experienced managers pursue a broad range of opportunitiesThe fund’s typical allocation is 60% stocks and 40% bonds. In managing the stock portion of the portfolio, Kate Lakin pursues a risk-aware style, investing in stocks across all sectors that may have value or growth characteristics. For the fund’s fixed-income investments, Paul Scanlon and Andrew Benson assemble a mix of government and investment-grade bonds. Historically, government bonds have shown relatively low correlation with stocks, which can help to dampen the impact of stock market downturns on fund performance.
Providing the benefits of balanced investing since 1937Growth of a $10,000 investment since fund inception, 11/5/37 through 7/31/21
’47 ’57’37 ’67 ’77 ’87 ’97 ’07 ’17 7/31/21
$11,982,9478.83%
annualized returnbefore sales charge
Data are historical. Past performance is not a guarantee of future results. More recent returns may be less or more than those shown. Investment return and principal value will fluctuate, and you may have a gain or a loss when you sell your shares. For the most recent month-end performance, visit putnam.com. Performance assumes reinvestment of distributions and does not account for taxes. Returns for class A shares do not reflect a sales charge of 5.75%. Had a sales charge been reflected, returns would have been lower. Returns for other classes of shares may vary. The period illustrated is longer than the investment horizon of many investors.
The chart is plotted on a logarithmic scale so that comparable percentage changes appear similar.
George Putnam Balanced Fund 3

Performance history as of 7/31/21
Annualized total return (%) comparison
LIFE OF FUND†
(since 11/5/37)10 YEARS 5 YEARS 3 YEARS 1 YEAR
8.83 10.56 10.85
15.35
8.2112.35 11.98
17.35
9.5113.80 13.82
18.16
10.45
20.84 20.50
36.45
20.99
The fund — class A sharesbefore sales chargeGeorge Putnam BalancedFund (PGEOX)
Fund’s primarybenchmarkGeorge PutnamBlended Index*
Fund’s secondarybenchmarkS&P 500 Index
Fund’s Lipper peergroup averageBalanced Funds
Current performance may be lower or higher than the quoted past performance, which cannot guarantee future results. Share price, principal value, and return will fluctuate, and you may have a gain or a loss when you sell your shares. Performance of class A shares assumes reinvestment of distributions and does not account for taxes. Fund returns in the bar chart do not reflect a sales charge of 5.75%; had they, returns would have been lower. See below and pages 10–13 for additional performance information. For a portion of the periods, the fund had expense limitations, without which returns would have been lower. To obtain the most recent month-end performance, visit putnam.com.
Returns for periods of less than one year are not annualized. All Bloomberg indices provided by Bloomberg Index Services Limited. Lipper peer group average provided by Lipper, a Refinitiv company. * George Putnam Blended Index is an unmanaged index administered by Putnam Management, 60% of which is the
S&P 500 Index and 40% of which is the Bloomberg U.S. Aggregate Bond Index. † The fund’s benchmarks (George Putnam Blended Index and S&P 500 Index) were introduced on 12/31/78 and 12/31/69,
respectively, and its Lipper group (Balanced Funds) was introduced on 12/31/59; they all post-date the inception of the fund’s class A shares.
Recent broad market index and fund performance
36.45%
20.84%
20.50%
0.08%
–0.70%
Fund’s secondary benchmark (equity only) (S&P 500 Index)
George Putnam Balanced Fund (class A shares before sales charge)
Fund’s primary benchmark (George Putnam Blended Index)
Cash (ICE BofA U.S. 3-Month Treasury Bill Index)
U.S. bonds (Bloomberg U.S. Aggregate Bond Index)
This comparison shows your fund’s performance in the context of broad market indexes for the 12 months ended 7/31/21. See above and pages 10–13 for additional fund performance information. Index descriptions can be found on pages 17–18.All Bloomberg indices provided by Bloomberg Index Services Limited.
4 George Putnam Balanced Fund
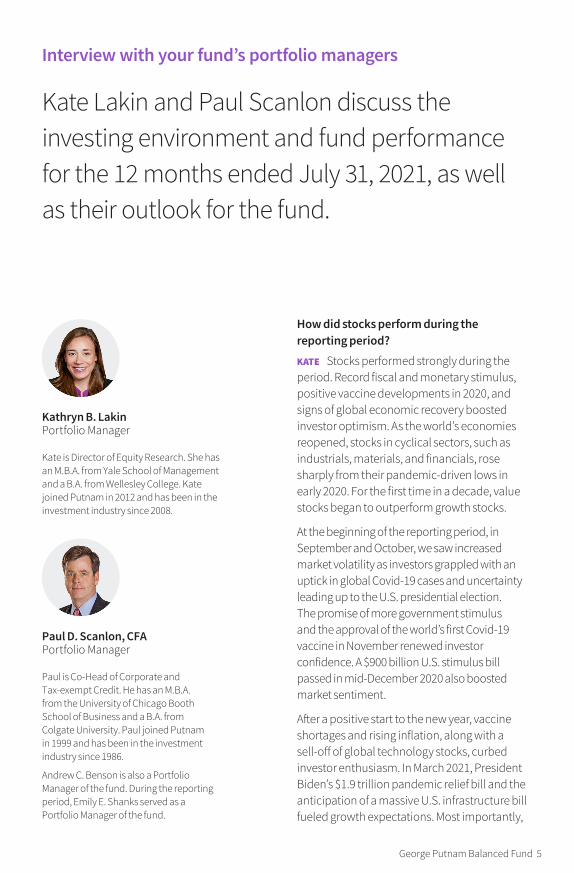
Interview with your fund’s portfolio managers
Kathryn B. LakinPortfolio Manager
Kate is Director of Equity Research. She has an M.B.A. from Yale School of Management and a B.A. from Wellesley College. Kate joined Putnam in 2012 and has been in the investment industry since 2008.
Paul D. Scanlon, CFAPortfolio Manager
Paul is Co-Head of Corporate and Tax-exempt Credit. He has an M.B.A. from the University of Chicago Booth School of Business and a B.A. from Colgate University. Paul joined Putnam in 1999 and has been in the investment industry since 1986.
Andrew C. Benson is also a Portfolio Manager of the fund. During the reporting period, Emily E. Shanks served as a Portfolio Manager of the fund.
How did stocks perform during the reporting period?KATE Stocks performed strongly during the period. Record fiscal and monetary stimulus, positive vaccine developments in 2020, and signs of global economic recovery boosted investor optimism. As the world’s economies reopened, stocks in cyclical sectors, such as industrials, materials, and financials, rose sharply from their pandemic-driven lows in early 2020. For the first time in a decade, value stocks began to outperform growth stocks.
At the beginning of the reporting period, in September and October, we saw increased market volatility as investors grappled with an uptick in global Covid-19 cases and uncertainty leading up to the U.S. presidential election. The promise of more government stimulus and the approval of the world’s first Covid-19 vaccine in November renewed investor confidence. A $900 billion U.S. stimulus bill passed in mid-December 2020 also boosted market sentiment.
After a positive start to the new year, vaccine shortages and rising inflation, along with a sell-off of global technology stocks, curbed investor enthusiasm. In March 2021, President Biden’s $1.9 trillion pandemic relief bill and the anticipation of a massive U.S. infrastructure bill fueled growth expectations. Most importantly,
Kate Lakin and Paul Scanlon discuss the investing environment and fund performance for the 12 months ended July 31, 2021, as well as their outlook for the fund.
Interview with your fund’s portfolio managersPerformance history as of 7/31/21
Annualized total return (%) comparison
LIFE OF FUND†
(since 11/5/37)10 YEARS 5 YEARS 3 YEARS 1 YEAR
8.83 10.56 10.85
15.35
8.2112.35 11.98
17.35
9.5113.80 13.82
18.16
10.45
20.84 20.50
36.45
20.99
The fund — class A sharesbefore sales chargeGeorge Putnam BalancedFund (PGEOX)
Fund’s primarybenchmarkGeorge PutnamBlended Index*
Fund’s secondarybenchmarkS&P 500 Index
Fund’s Lipper peergroup averageBalanced Funds
Current performance may be lower or higher than the quoted past performance, which cannot guarantee future results. Share price, principal value, and return will fluctuate, and you may have a gain or a loss when you sell your shares. Performance of class A shares assumes reinvestment of distributions and does not account for taxes. Fund returns in the bar chart do not reflect a sales charge of 5.75%; had they, returns would have been lower. See below and pages 10–13 for additional performance information. For a portion of the periods, the fund had expense limitations, without which returns would have been lower. To obtain the most recent month-end performance, visit putnam.com.
Returns for periods of less than one year are not annualized. All Bloomberg indices provided by Bloomberg Index Services Limited. Lipper peer group average provided by Lipper, a Refinitiv company. * George Putnam Blended Index is an unmanaged index administered by Putnam Management, 60% of which is the
S&P 500 Index and 40% of which is the Bloomberg U.S. Aggregate Bond Index. † The fund’s benchmarks (George Putnam Blended Index and S&P 500 Index) were introduced on 12/31/78 and 12/31/69,
respectively, and its Lipper group (Balanced Funds) was introduced on 12/31/59; they all post-date the inception of the fund’s class A shares.
Recent broad market index and fund performance
36.45%
20.84%
20.50%
0.08%
–0.70%
Fund’s secondary benchmark (equity only) (S&P 500 Index)
George Putnam Balanced Fund (class A shares before sales charge)
Fund’s primary benchmark (George Putnam Blended Index)
Cash (ICE BofA U.S. 3-Month Treasury Bill Index)
U.S. bonds (Bloomberg U.S. Aggregate Bond Index)
This comparison shows your fund’s performance in the context of broad market indexes for the 12 months ended 7/31/21. See above and pages 10–13 for additional fund performance information. Index descriptions can be found on pages 17–18.All Bloomberg indices provided by Bloomberg Index Services Limited.
George Putnam Balanced Fund 5

Top 10 equity holdingsHOLDING (PERCENTAGE OF FUND’S NET ASSETS)
INDUSTRY
OVER/UNDERWEIGHT VS. BENCHMARK
Microsoft Corp. (3.9%) Software
Alphabet, Inc. (3.3%) Interactive media and services
Amazon.com, Inc. (3.0%) Internet and direct marketing retail
Apple, Inc. (2.5%) Technology hardware, storage, and peripherals
Facebook, Inc. (1.9%) Interactive media and services
Citigroup, Inc. (1.3%) Banks
PayPal Holdings, Inc. (1.3%) IT services
NVIDIA Corp. (1.2%) Semiconductors and semiconductor equipment
Home Depot, Inc. (1.2%) Specialty retailFidelity National Information Services, Inc. (1.1%) IT services 0.9%
–1.9%
–0.9%
–0.8%
–3.6%
0.9%
0.4%
–0.1%
0.3%
–0.4%
This table shows the fund’s top 10 equity holdings by percentage of the fund’s net assets as of 7/31/21. Short-term investments and derivatives, if any, are excluded. Summary information may differ from the portfolio schedule included in the financial statements due to the use of different classifications of securities for presentation purposes. Holdings may vary over time.
Sector allocations
Information technology stocks 15.6%
Corporate bonds and notes 14.2
U.S. Treasuries 13.1
Consumer discretionary stocks 9.3
Health-care stocks 8.2
Agency pass-through securities 7.2
Communication services stocks 6.5
Financials stocks 6.5
Industrial stocks 5.4
Other sectors 10.5
Cash and net other assets 3.5
Allocations are shown as a percentage of the fund’s net assets as of 7/31/21. Cash and net other assets, if any, represent the market value weights of cash, derivatives, short-term securities, and other unclassified assets in the portfolio. Summary information may differ from the portfolio schedule included in the financial statements due to the inclusion of derivative securities, any interest accruals, the exclusion of as-of trades, if any, the use of different classifications of securities for presentation purposes, and rounding. Holdings and allocations may vary over time.
6 George Putnam Balanced Fund

in our view, better-than-expected corporate earnings helped stocks advance on strong fundamentals, which moved well past pre-pandemic levels during the period.
How did bonds perform during the period?PAUL The Federal Reserve [Fed] was steadfast in its efforts to support the U.S. economy. Borrowing costs remained low, with short-term interest rates held in the range of 0.00% to 0.25%. In December 2020, the central bank pledged to buy at least $120 billion in bonds each month to help improve liquidity until its goals for full employment and target inflation were met. Credit markets performed well overall, with spreads tightening across the quality spectrum. [Bond prices rise as spreads tighten and fall as spreads widen.]
Stimulus-fueled growth and inflation expec-tations drove yields higher on all but the very short-term government debt during the first quarter of calendar 2021. The Fed took a more hawkish stance in June 2021 when it signaled it may raise short-term interest rates sooner than anticipated. The Fed tempered its tone in July 2021, suggesting it needed to see more progress in the U.S. jobs market before tight-ening monetary policy. Against this backdrop, the yield on the benchmark 10-year U.S. Treasury note rose to 1.24% at period-end from 0.56% at the start of the period. Investment-grade [IG] corporate bonds, as measured by the Bloomberg U.S. Aggregate Bond Index, posted a loss of 0.70% for the period.
How did the fund perform for the period?KATE The fund’s class A shares returned 20.84%, outperforming its primary benchmark, the George Putnam Blended Index, which returned 20.50% for the period.
Could you highlight some stocks that contributed to performance relative to the primary benchmark?KATE Investment bank and financial services firm The Goldman Sachs Group was a top contributor over the period. As companies
rushed to capitalize on improving economic conditions, IPO [initial public offering] and M&A [merger and acquisition] deal flow increased, creating a healthy backlog for Goldman’s investment banking division. The company also benefited from the sale of older equity investments, a surge in trading activity, and increased transactional volume from its retail bank Marcus.
Alternative asset manager KKR & Co., which is not held in the primary benchmark, was another highlight. The company’s February 2021 acquisition of Global Atlantic Financial Group, a retirement and life insurance provider, added $90 billion to KKR’s assets under management. Along with strong asset growth, robust M&A activity and a secular shift toward alternative investments provided tailwinds for the stock. KKR raised $59 billion in capital in the second quarter of 2021 — more than all it raised in calendar 2020.
NXP Semiconductors, a Dutch global semi-conductor chip manufacturer, was another top performer. NXP supplies embedded connectivity solutions that help power inno-vative applications for internet, automotive, industrials, mobile, and communications infra-structure end markets. As global production lines reopened, NXP benefited from accelerated demand and higher chip prices, which boosted its earnings and cash flows.
What about detractors from performance?KATE Fidelity National Information Services [FIS] was the fund’s top detractor. U.S.-based FIS delivers payment-processing solutions to merchants, banks, and capital markets worldwide. The firm’s brick-and-mortar
While corporate earnings momentum is encouraging, we believe many segments of the economy still have room for growth. Kate Lakin
George Putnam Balanced Fund 7

business, which closed during pandemic lockdowns, struggled to recover despite improved economic conditions. Increased competition in the financial technology and electronic payment sectors, and FIS’s ability to compete, also began to weigh on investors. However, we think FIS’s challenges are reflected in its stock price, and the company has room for appreciation. We continue to own the stock.
An underweight position in entertainment and media giant The Walt Disney Company also dampened relative results. The company’s pivot into digital streaming [the Disney+ service was launched in November 2019] has helped offset some revenue weakness from legacy Disney parks and experiences. We believe, however, that Disney is at risk of product canni-balization [when a new product takes sales from an existing product], which could cut into future profits. For this reason, we maintain an underweight position in the stock.
Our decision not to own financial services firm JPMorgan Chase, which performed strongly during the period, also detracted from relative results. The reopening of the economy caused a rise in transactional volume that benefited JPMorgan’s consumer and business banking division. As the largest U.S. bank by market value, however, JPMorgan remains overvalued, in our view, and we prefer other banks.
How did the fund’s corporate bond investments perform for the period?PAUL Allocations to corporate bonds repre-sented roughly 14% of the fund’s total assets for the period. U.S. IG corporate bonds were a positive contributor to performance, as spreads across the sector continued to tighten significantly.
Top performers in our bond portfolio included those issued in the technology and utility distribution sectors. In addition, issuers in the banking and life insurance industries performed
Portfolio composition comparison
60.3%61.1%
Common stocks/Equity sector
as of 1/31/21
as of 7/31/21
0.5%0.8%
Commercial mortgage-backed securities
2.1%3.5%
Cash and netother assets
6.2%7.2%
Agency pass-through securities
15.9%13.1%
Treasuries
14.8%14.2%
Corporate bonds and notes
This chart shows how the fund’s top weightings have changed over the past six months. Allocations are shown as a percentage of the fund’s net assets. Current period summary information may differ from the portfolio schedule included in the financial statements due to the inclusion of derivative securities, any interest accruals, the exclusion of as-of trades, if any, the use of different classifications of securities for presentation purposes, and rounding. Holdings and allocations may vary over time.
8 George Putnam Balanced Fund

well. Positive performance was marginally offset by positioning within pharmaceuticals and media, specifically in the cable industry.
What is your outlook for the IG corporate bond market?PAUL We have a constructive outlook for IG corporate bonds for the remainder of 2021. Our positive outlook for fundamentals and techni-cals supports our neutral view on valuation. Our view on positive fundamentals is underpinned by the broad distribution of vaccines and ample U.S. stimulus. IG corporates have benefited from shedding a record number of fallen angels [companies downgraded from IG to sub-IG] in 2020, as well as extensive cost improvements implemented during the pandemic.
We believe that balance sheets are healthy, with leverage at or near its peak, and liquidity metrics are strong following record issuance in calendar 2020. At the same time, we are mindful of potential risks, including delays in vaccine distribution and the spread of new Covid-19 variants, which could create a more volatile operating environment for weaker companies. Increased M&A activity also could increase immediate leverage.
IG market technicals are robust, in our view. On the supply side, new issuance in July 2021 totaled $101.1 billion, up 7% year-over-year. Year-to-date [as of period-end] new issuance reached $1.1 trillion, a decline of 26% year-over-year. On the demand side, retail inflows totaled $21.7 billion in July. International insti-tutional demand persists, given low hedging costs and low interest rates globally. Valuations, while less attractive than they were, should continue to be supported by robust demand from liability-based and foreign institutional investors, in our view.
What is your outlook for stocks and the fund?KATE Overall, we have a positive outlook for equities for the remainder of 2021. We are encouraged by the record number of
companies that have beat analysts’ earnings estimates for the first quarter of 2021. This trend has also continued into the second quarter. While corporate earnings momentum is encouraging, we believe many segments of the economy still have room for growth.
Additional government stimulus and strong consumer spending should propel economic recoveries, in our view. Yet, as inflation concerns rise, we will continue to monitor the impact of a more hawkish Fed policy. New variants and rising cases of Covid-19 worldwide continue to present challenges to the economy, along with the safety and health of our society.
For the fund, our analysts use bottom-up, fundamental research to identify companies with the potential for capital appreciation. Our focus on individual companies and our limited factor exposures provide greater downside protection, in our view, against broader risks of the global economy.
Kate and Paul, thanks for your time and for bringing us up to date.
The views expressed in this report are exclusively those of Putnam Management and are subject to change. They are not meant as investment advice.
Please note that the holdings discussed in this report may not have been held by the fund for the entire period. Portfolio composition is subject to review in accordance with the fund’s investment strategy and may vary in the future. Current and future portfolio holdings are subject to risk.
Of special interestDuring the period, income earned by the fund declined due to falling interest rates and lower dividend payments made by companies held in the portfolio. As a result, the fund reduced its quarterly distribution rate for class A shares from $0.071 to $0.047 in August 2020 and from $0.047 to $0.036 in February 2021. Similar decreases were made to other share classes of the fund.
George Putnam Balanced Fund 9

Your fund’s performanceThis section shows your fund’s performance, price, and distribution information for periods ended July 31, 2021, the end of its most recent fiscal year. In accordance with regulatory requirements for mutual funds, we also include performance information as of the most recent calendar quarter-end and expense information taken from the fund’s current prospectus. Performance should always be considered in light of a fund’s investment strategy. Data represent past performance. Past performance does not guarantee future results. More recent returns may be less or more than those shown. Investment return and principal value will fluctuate, and you may have a gain or a loss when you sell your shares. Performance information does not reflect any deduction for taxes a shareholder may owe on fund distributions or on the redemption of fund shares. For the most recent month-end performance, please visit the Individual Investors section at putnam.com or call Putnam at 1-800-225-1581. Class R, R5, R6, and Y shares are not available to all investors. See the Terms and definitions section in this report for definitions of the share classes offered by your fund.
Fund performance Total return for periods ended 7/31/21
Annual average
(life of fund) 10 yearsAnnual average 5 years
Annual average 3 years
Annual average 1 year
Class A (11/5/37)
Before sales charge 8.83% 172.90% 10.56% 78.99% 12.35% 47.38% 13.80% 20.84%
After sales charge 8.76 157.21 9.91 68.70 11.03 38.90 11.58 13.89
Class B (4/27/92)
Before CDSC 8.73 156.81 9.89 72.41 11.51 44.04 12.93 19.89
After CDSC 8.73 156.81 9.89 70.41 11.25 41.04 12.15 14.89
Class C (7/26/99)
Before CDSC 8.76 156.99 9.90 72.34 11.50 44.09 12.95 19.90
After CDSC 8.76 156.99 9.90 72.34 11.50 44.09 12.95 18.90
Class M (12/1/94)
Before sales charge 8.12 159.46 10.00 74.50 11.78 45.15 13.22 20.20
After sales charge 8.07 150.37 9.61 68.39 10.98 40.07 11.89 15.99
Class R (1/21/03)
Net asset value 8.56 166.03 10.28 76.79 12.07 46.21 13.50 20.50
Class R5 (12/2/13)
Net asset value 8.93 180.03 10.85 81.42 12.65 48.51 14.09 21.11
Class R6 (12/2/13)
Net asset value 8.94 181.98 10.92 82.24 12.75 48.91 14.19 21.22
Class Y (3/31/94)
Net asset value 8.93 179.66 10.83 81.21 12.63 48.51 14.09 21.13
Current performance may be lower or higher than the quoted past performance, which cannot guarantee future results. After-sales-charge returns for class A and M shares reflect the deduction of the maximum 5.75% and 3.50% sales charge, respectively, levied at the time of purchase. Class B share returns after contingent deferred sales charge (CDSC) reflect the applicable CDSC, which is 5% in the first year, declining over time to 1% in the sixth year, and is eliminated thereafter. Class C share returns after CDSC reflect a 1% CDSC for the first year that is eliminated thereafter. Class R, R5, R6, and Y shares have no initial sales charge or CDSC. Performance for class B, C, M, R, and Y shares before their inception is derived from the historical performance of class A shares, adjusted for the applicable sales charge (or CDSC) and the higher operating expenses for such shares, except for class Y shares, for which 12b-1 fees are not applicable. Performance for class R5 and R6 shares prior to their inception is derived from the historical performance of class Y shares and has not been adjusted for the lower investor servicing fees applicable to class R5 and R6 shares; had it, returns would have been higher.
10 George Putnam Balanced Fund

For a portion of the periods, the fund had expense limitations, without which returns would have been lower.
Class B and C share performance reflects conversion to class A shares after eight years.
Comparative index returns For periods ended 7/31/21
Annual average
(life of fund) 10 yearsAnnual average 5 years
Annual average 3 years
Annual average 1 year
George Putnam Blended Index† —* 180.17% 10.85% 76.07% 11.98% 47.44% 13.82% 20.50%
Bloomberg U.S. Aggregate Bond Index —* 38.97 3.35 16.64 3.13 18.18 5.73 –0.70
S&P 500 Index —* 316.89 15.35 122.51 17.35 64.96 18.16 36.45
Lipper Balanced Funds category average‡ —* 122.53 8.21 57.99 9.51 34.92 10.45 20.99
Index and Lipper results should be compared with fund performance before sales charge, before CDSC, or at net asset value.
All Bloomberg indices provided by Bloomberg Index Services Limited. Lipper peer group average provided by Lipper, a Refinitiv company. * The fund’s benchmarks (George Putnam Blended Index and S&P 500 Index) were introduced on 12/31/78 and
12/31/69, respectively, the Bloomberg U.S. Aggregate Bond Index was introduced on 12/31/75, and its Lipper group (Balanced Funds) was introduced on 12/31/59; they all post-date the inception of the fund’s class A shares.
† George Putnam Blended Index is an unmanaged index administered by Putnam Management, 60% of which is the S&P 500 Index and 40% of which is the Bloomberg U.S. Aggregate Bond Index.
‡ Over the 1-year, 3-year, 5-year, and 10-year periods ended 7/31/21, there were 525, 505, 477, and 389 funds, respectively, in this Lipper category.
Change in the value of a $10,000 investment ($9,425 after sales charge)Cumulative total return from 7/31/11 to 7/31/21
Past performance does not indicate future results. At the end of the same time period, a $10,000 investment in the fund’s class B and C shares would have been valued at $25,681 and $25,699, respectively, and no contingent deferred sales charges would apply. A $10,000 investment in the fund’s class M shares ($9,650 after sales charge) would have been valued at $25,037. A $10,000 investment in the fund’s class R, R5, R6, and Y shares would have been valued at $26,603, $28,003, $28,198, and $27,966, respectively.
$5,000
$10,000
$15,000
$20,000
’11 ’12 ’13 ’14 ’15 ’16 ’17 ’18 ’19 ’20 ’21
$28,017
$13,897
$41,689
George Putnam Balanced Fund class A shares a�er sales charge
George Putnam Blended Index
S&P 500 Index
Bloomberg U.S. Aggregate Bond Index
$9,425
$25,721
George Putnam Balanced Fund 11

Fund price and distribution information For the 12-month period ended 7/31/21
Distributions Class A Class B Class C Class M Class R Class R 5 Class R 6 Class Y
Number 4 4 4 4 4 4 4 4
Income $0.154565 $0.000435 $0.005565 $0.044565 $0.102565 $0.148565 $0.229565 $0.211565
Capital gains
Long-term gains 0.883000 0.883000 0.883000 0.883000 0.883000 0.883000 0.883000 0.883000
Short-term gains 0.364435 0.364435 0.364435 0.364435 0.364435 0.364435 0.364435 0.364435
Total $1.402000 $1.247870 $1.253000 $1.292000 $1.350000 $1.396000 $1.477000 $1.459000
Share value
Before sales
charge
After sales
charge
Net asset value
Net asset value
Before sales
charge
After sales
charge
Net asset value
Net asset value
Net asset value
Net asset value
7/31/20 $21.68 $23.00 $21.41 $21.48 $21.34 $22.11 $21.60 $21.89 $21.79 $21.78
7/31/21 24.62 26.12 24.27 24.35 24.20 25.08 24.51 24.94 24.75 24.74
Current rate (end of period)
Before sales
charge
After sales
charge
Net asset value
Net asset value
Before sales
charge
After sales
charge
Net asset value
Net asset value
Net asset value
Net asset value
Current dividend rate 1 0.58% 0.55% — — 0.12% 0.11% 0.33% 0.79% 0.89% 0.82%
Current 30-day SEC yield 2 N/A 0.36 –0.35% –0.35% N/A –0.10 0.14 0.63 0.71 0.63
The classification of distributions, if any, is an estimate. Before-sales-charge share value and current dividend rate for class A and M shares, if applicable, do not take into account any sales charge levied at the time of purchase. After-sales-charge share value, current dividend rate, and current 30-day SEC yield, if applicable, are calculated assuming that the maximum sales charge (5.75% for class A shares and 3.50% for class M shares) was levied at the time of purchase. Final distribution information will appear on your year-end tax forms.
1 Most recent distribution, including any return of capital and excluding capital gains, annualized and divided by share price before or after sales charge at period-end.
2 Based only on investment income and calculated using the maximum offering price for each share class, in accordance with SEC guidelines.
12 George Putnam Balanced Fund

Fund performance as of most recent calendar quarter Total return for periods ended 6/30/21
Annual average
(life of fund) 10 yearsAnnual average 5 years
Annual average 3 years
Annual average 1 year
Class A (11/5/37)
Before sales charge 8.82% 163.60% 10.18% 80.71% 12.56% 48.20% 14.01% 23.41%
After sales charge 8.74 148.44 9.53 70.32 11.24 39.68 11.78 16.31
Class B (4/27/92)
Before CDSC 8.71 148.22 9.52 74.08 11.73 44.96 13.17 22.57
After CDSC 8.71 148.22 9.52 72.08 11.47 41.96 12.39 17.57
Class C (7/26/99)
Before CDSC 8.74 148.30 9.52 74.04 11.72 44.87 13.15 22.52
After CDSC 8.74 148.30 9.52 74.04 11.72 44.87 13.15 21.52
Class M (12/1/94)
Before sales charge 8.10 150.69 9.63 76.23 12.00 46.02 13.45 22.78
After sales charge 8.06 141.91 9.24 70.06 11.20 40.91 12.11 18.49
Class R (1/21/03)
Net asset value 8.55 157.03 9.90 78.56 12.29 47.10 13.73 23.12
Class R5 (12/2/13)
Net asset value 8.91 170.67 10.47 83.22 12.87 49.37 14.31 23.74
Class R6 (12/2/13)
Net asset value 8.92 172.52 10.54 84.02 12.97 49.76 14.41 23.85
Class Y (3/31/94)
Net asset value 8.91 170.27 10.45 82.98 12.84 49.35 14.31 23.71
See the discussion following the fund performance table on page 10 for information about the calculation of fund performance.
George Putnam Balanced Fund 13

Your fund’s expensesAs a mutual fund investor, you pay ongoing expenses, such as management fees, distribution fees (12b-1 fees), and other expenses. Using the following information, you can estimate how these expenses affect your investment and compare them with the expenses of other funds. You may also pay one-time transaction expenses, including sales charges (loads) and redemption fees, which are not shown in this section and would have resulted in higher total expenses. For more information, see your fund’s prospectus or talk to your financial representative.
Expense ratiosClass A Class B Class C Class M Class R Class R5 Class R6 Class Y
Total annual operating expenses for the fiscal year ended 7/31/20 0.97% 1.72% 1.72% 1.47% 1.22% 0.72% 0.62% 0.72%
Annualized expense ratio for the six-month period ended 7/31/21* 0.93% 1.68% 1.68% 1.43% 1.18% 0.70% 0.60% 0.68%
Fiscal year expense information in this table is taken from the most recent prospectus, is subject to change, and may differ from that shown for the annualized expense ratio and in the financial highlights of this report.
Expenses are shown as a percentage of average net assets. * Expense ratios for each class are for the fund’s most recent fiscal half year. As a result of this, ratios may differ from
expense ratios based on one-year data in the financial highlights.
Expenses per $1,000The following table shows the expenses you would have paid on a $1,000 investment in each class of the fund from 2/1/21 to 7/31/21. It also shows how much a $1,000 investment would be worth at the close of the period, assuming actual returns and expenses.
Class A Class B Class C Class M Class R Class R5 Class R6 Class Y
Expenses paid per $1,000*† $4.86 $8.77 $8.77 $7.47 $6.17 $3.66 $3.14 $3.56
Ending value (after expenses) $1,109.40 $1,105.20 $1,105.30 $1,106.80 $1,108.10 $1,110.70 $1,111.60 $1,110.70
* Expenses for each share class are calculated using the fund’s annualized expense ratio for each class, which represents the ongoing expenses as a percentage of average net assets for the six months ended 7/31/21. The expense ratio may differ for each share class.
† Expenses are calculated by multiplying the expense ratio by the average account value for the period; then multiplying the result by the number of days in the period (181); and then dividing that result by the number of days in the year (365).
14 George Putnam Balanced Fund

Estimate the expenses you paidTo estimate the ongoing expenses you paid for the six months ended 7/31/21, use the following calculation method. To find the value of your investment on 2/1/21, call Putnam at 1-800-225-1581.
How to calculate the expenses you paid
Value of your investment on 2/1/21 ÷ $1,000 x Expenses paid per $1,000 = Total expenses paid
Example Based on a $10,000 investment in class A shares of your fund.
$10,000 ÷ $1,000 x $4.86 (see preceding table) = $48.60
Compare expenses using the SEC’s methodThe Securities and Exchange Commission (SEC) has established guidelines to help investors assess fund expenses. Per these guidelines, the following table shows your fund’s expenses based on a $1,000 investment, assuming a hypothetical 5% annualized return. You can use this information to compare the ongoing expenses (but not transaction expenses or total costs) of investing in the fund with those of other funds. All mutual fund shareholder reports will provide this information to help you make this comparison. Please note that you cannot use this information to estimate your actual ending account balance and expenses paid during the period.
Class A Class B Class C Class M Class R Class R5 Class R6 Class Y
Expenses paid per $1,000*† $4.66 $8.40 $8.40 $7.15 $5.91 $3.51 $3.01 $3.41
Ending value (after expenses) $1,020.18 $1,016.46 $1,016.46 $1,017.70 $1,018.94 $1,021.32 $1,021.82 $1,021.42
* Expenses for each share class are calculated using the fund’s annualized expense ratio for each class, which represents the ongoing expenses as a percentage of average net assets for the six months ended 7/31/21. The expense ratio may differ for each share class.
† Expenses are calculated by multiplying the expense ratio by the average account value for the six-month period; then multiplying the result by the number of days in the six-month period (181); and then dividing that result by the number of days in the year (365).
George Putnam Balanced Fund 15

Consider these risks before investingThe value of investments in the fund’s portfolio may fall or fail to rise over extended periods of time for a variety of reasons, including general economic, political, or financial market conditions; investor sentiment and market perceptions; government actions; geopolitical events or changes; and factors related to a specific issuer, geography, industry, or sector. These and other factors may lead to increased volatility and reduced liquidity in the fund’s portfolio holdings. Growth stocks may be more susceptible to earnings disappointments, and value stocks may fail to rebound. Bond investments are subject to interest-rate risk (the risk of bond prices falling if interest rates rise) and credit risk (the risk of an issuer defaulting on interest or principal payments). Interest-rate risk is generally greater for longer-term bonds, and credit risk is generally greater for below-investment-grade bonds. Risks associated with derivatives include increased investment exposure (which may be considered leverage) and, in the case of over-the-counter instruments, the potential inability to terminate or sell derivatives positions and the potential failure of the other party to the instrument to meet its obligations.
Our investment techniques, analyses, and judgments may not produce the outcome we intend. The investments we select for the fund may not perform as well as other securities that we do not select for the fund. We, or the fund’s other service providers, may experience disruptions or operating errors that could have a negative effect on the fund.
You can lose money by investing in the fund.
16 George Putnam Balanced Fund

Terms and definitions
Important termsTotal return shows how the value of the fund’s shares changed over time, assuming you held the shares through the entire period and reinvested all distributions in the fund.
Before sales charge, or net asset value, is the price, or value, of one share of a mutual fund, without a sales charge. Before-sales-charge figures fluctuate with market conditions, and are calculated by dividing the net assets of each class of shares by the number of outstanding shares in the class.
After sales charge is the price of a mutual fund share plus the maximum sales charge levied at the time of purchase. After-sales-charge perfor-mance figures shown here assume the 5.75% maximum sales charge for class A shares and 3.50% for class M shares.
Contingent deferred sales charge (CDSC) is generally a charge applied at the time of the redemption of class B or C shares and assumes redemption at the end of the period. Your fund’s class B CDSC declines over time from a 5% maximum during the first year to 1% during the sixth year. After the sixth year, the CDSC no longer applies. The CDSC for class C shares is 1% for one year after purchase.
Current rate is the annual rate of return earned from dividends or interest of an investment. Current rate is expressed as a percentage of the price of a security, fund share, or principal investment.
Share classesClass A shares are generally subject to an initial sales charge and no CDSC (except on certain redemptions of shares bought without an initial sales charge).
Class B shares are closed to new investments and are only available by exchange from another Putnam fund or through dividend and/
or capital gains reinvestment. They are not subject to an initial sales charge and may be subject to a CDSC.
Class C shares are not subject to an initial sales charge and are subject to a CDSC only if the shares are redeemed during the first year.
Class M shares are closed to new investments except through certain eligible employer sponsored retirement plans and certain eligible plan record-keepers. They have a lower initial sales charge and a higher 12b-1 fee than class A shares and no CDSC.
Class R shares are not subject to an initial sales charge or CDSC and are only available to employer-sponsored retirement plans.
Class R5 shares are not subject to an initial sales charge or CDSC and carry no 12b-1 fee. They are only available to employer-sponsored retirement plans.
Class R6 shares are not subject to an initial sales charge or CDSC and carry no 12b-1 fee. They are generally only available to employer-sponsored retirement plans, corporate and institutional clients, and clients in other approved programs.
Class Y shares are not subject to an initial sales charge or CDSC and carry no 12b-1 fee. They are generally only available to corporate and institutional clients and clients in other approved programs.
Comparative indexesBloomberg U.S. Aggregate Bond Index is an unmanaged index of U.S. investment-grade fixed-income securities.
ICE BofA (Intercontinental Exchange Bank of America) U.S. 3-Month Treasury Bill Index is an unmanaged index that seeks to measure the performance of U.S. Treasury bills available in the marketplace.
George Putnam Balanced Fund 17

George Putnam Blended Index is an unmanaged index administered by Putnam Management, LLC, 60% of which is the S&P 500 Index and 40% of which is the Bloomberg U.S. Aggregate Bond Index.
S&P 500 Index is an unmanaged index of common stock performance.Indexes assume reinvestment of all distributions and do not account for fees. Securities and performance of a fund and an index will differ. You cannot invest directly in an index.
BLOOMBERG® is a trademark and service mark of Bloomberg Finance L.P. and its affiliates (collectively “Bloomberg”). Bloomberg or Bloomberg’s licensors own all proprietary rights in the Bloomberg Indices. Neither Bloomberg nor Bloomberg’s licensors approve or endorse this material, or guarantee the accuracy or completeness of any information herein, or make any warranty, express or implied, as to the results to be obtained therefrom and, to the maximum extent allowed by law, neither shall have any liability or responsibility for injury or damages arising in connection therewith.
ICE Data Indices, LLC (“ICE BofA”), used with permission. ICE BofA permits use of the ICE BofA indices and related data on an “as is” basis; makes no warranties regarding same; does not guarantee the suitability, quality, accu-racy, timeliness, and/or completeness of the ICE BofA indices or any data included in, related to, or derived therefrom; assumes no liability in connection with the use of the foregoing; and does not sponsor, endorse, or recommend Putnam Investments, or any of its products or services.
Lipper, a Refinitiv company, is a third-party industry-ranking entity that ranks mutual funds. Its rankings do not reflect sales charges. Lipper rankings are based on total return at net asset value relative to other funds that have similar current investment styles or objectives as determined by Lipper. Lipper may change a fund’s category assignment at its discretion. Lipper category averages reflect performance trends for funds within a category.
Other information for shareholders
Proxy votingPutnam is committed to managing our mutual funds in the best interests of our shareholders. The Putnam funds’ proxy voting guidelines and procedures, as well as information regarding how your fund voted proxies relating to portfolio securities during the 12-month period ended June 30, 2021, are available in the Individual Investors section of putnam.com and on the Securities and Exchange Commis-sion (SEC) website, www.sec.gov. If you have questions about finding forms on the SEC’s website, you may call the SEC at 1-800-SEC-0330. You may also obtain the Putnam funds’ proxy voting guidelines and procedures at no charge by calling Putnam’s Shareholder Services at 1-800-225-1581.
Fund portfolio holdingsThe fund will file a complete schedule of its portfolio holdings with the SEC for the first and third quarters of each fiscal year on
Form N-PORT within 60 days of the end of such fiscal quarter. Shareholders may obtain the fund’s Form N-PORT on the SEC’s website at www.sec.gov.
Prior to its use of Form N-PORT, the fund filed its complete schedule of its portfolio holdings with the SEC on Form N-Q, which is available online at www.sec.gov.
Trustee and employee fund ownershipPutnam employees and members of the Board of Trustees place their faith, confidence, and, most importantly, investment dollars in Putnam mutual funds. As of July 31, 2021, Putnam employees had approximately $569,000,000 and the Trustees had approxi-mately $80,000,000 invested in Putnam mutual funds. These amounts include investments by the Trustees’ and employees’ immediate family members as well as investments through retirement and deferred compensation plans.
18 George Putnam Balanced Fund

Liquidity risk management programPutnam, as the administrator of the fund’s liquidity risk management program (appointed by the Board of Trustees), presented the most recent annual report on the program to the Trustees in April 2021. The report covered the structure of the program, including the program documents and related policies and procedures adopted to comply with Rule 22e-4 under the Investment Company Act of 1940, and reviewed the operation of the program from January 2020 through December 2020. The report included a description of the annual liquidity assessment of the fund that Putnam performed in November 2020. The
report noted that there were no material compliance exceptions identified under Rule 22e-4 during the period. The report included a review of the governance of the program and the methodology for classification of the fund’s investments. The report also included a discussion of liquidity monitoring during the period, including during the market liquidity challenges caused by the Covid-19 pandemic, and the impact those challenges had on the liquidity of the fund’s investments. Putnam concluded that the program has been operating effectively and adequately to ensure compliance with Rule 22e-4.
George Putnam Balanced Fund 19
Important notice regarding Putnam’s privacy policy
In order to conduct business with our shareholders, we must obtain certain personal information such as account holders’ names, addresses, Social Security numbers, and dates of birth. Using this information, we are able to maintain accurate records of accounts and transactions.
It is our policy to protect the confidentiality of our shareholder information, whether or not a shareholder currently owns shares of our funds. In particular, it is our policy not to sell information about you or your accounts to outside marketing firms. We have safeguards in place designed to prevent unauthorized access
to our computer systems and procedures to protect personal information from unauthorized use.
Under certain circumstances, we must share account information with outside vendors who provide services to us, such as mailings and proxy solicitations. In these cases, the service providers enter into confidentiality agreements with us, and we provide only the information necessary to process transactions and perform other services related to your account. Finally, it is our policy to share account information with your financial representative, if you’ve listed one on your Putnam account.
20 George Putnam Balanced Fund

Trustee approval of management contract
Trustee approval of management contract
General conclusionsThe Board of Trustees of The Putnam Funds oversees the management of each fund and, as required by law, determines annually whether to approve the continuance of your fund’s management contract with Putnam Investment Management, LLC (“Putnam Management”) and the sub-management contract with respect to your fund between Putnam Management and its affiliate, Putnam Investments Limited (“PIL”). The Board, with the assistance of its Contract Commit-tee, requests and evaluates all information it deems reasonably necessary under the circum-stances in connection with its annual contract review. The Contract Committee consists solely of Trustees who are not “interested persons” (as this term is defined in the Investment Company Act of 1940, as amended (the “1940 Act”)) of The Putnam Funds (“Independent Trustees”).
At the outset of the review process, members of the Board’s independent staff and independent legal counsel considered any possible changes to the annual contract review materials furnished to the Contract Committee during the course of the previous year’s review and, as applicable, identified those changes to Putnam Management. Following these discussions and in consultation with the Contract Committee, the Independent Trustees’ independent legal counsel requested that Putnam Management and its affiliates furnish specified information, together with any additional information that Putnam Management considered relevant, to the Contract Commit-tee. Over the course of several months ending in June 2021, the Contract Committee met on a number of occasions with representatives of Putnam Management, and separately in executive session, to consider the information that Putnam Management provided. Throughout this process, the Contract Committee was assisted by the members of the Board’s independent staff and by independent legal counsel for The Putnam Funds and the Independent Trustees.
In May 2021, the Contract Committee met in executive session to discuss and consider its recommendations with respect to the contin-uance of the contracts. At the Trustees’ June 2021 meeting, the Contract Committee met in executive session with the other Independent Trustees to review a summary of the key financial, performance and other data that the Contract
Committee considered in the course of its review. The Contract Committee then presented its written report, which summarized the key factors that the Committee had considered and set forth its recommendations. The Contract Committee recommended, and the Independent Trustees approved, the continuance of your fund’s manage-ment and sub-management contracts, effective July 1, 2021. (Because PIL is an affiliate of Putnam Management and Putnam Management remains fully responsible for all services provided by PIL, the Trustees have not attempted to evaluate PIL as a separate entity, and all subsequent refer-ences to Putnam Management below should be deemed to include reference to PIL as necessary or appropriate in the context.)
The Independent Trustees’ approval was based on the following conclusions:
• That the fee schedule in effect for your fund repre-sented reasonable compensation in light of the nature and quality of the services being provided to the fund, the fees paid by competitive funds, the costs incurred by Putnam Management in providing services to the fund, and the appli-cation of certain reductions and waivers noted below; and
• That the fee schedule in effect for your fund represented an appropriate sharing between fund shareholders and Putnam Management of any economies of scale as may exist in the management of the fund at current asset levels.
These conclusions were based on a comprehen-sive consideration of all information provided to the Trustees and were not the result of any single factor. Some of the factors that figured particularly in the Trustees’ deliberations and how the Trust-ees considered these factors are described below, although individual Trustees may have evaluated the information presented differently, giving differ-ent weights to various factors. It is also important to recognize that the management arrangements for your fund and the other Putnam funds are the result of many years of review and discussion between the Independent Trustees and Putnam Management, that some aspects of the arrange-ments may receive greater scrutiny in some years than others and that the Trustees’ conclusions may be based, in part, on their consideration of fee arrangements in previous years. For example, with certain exceptions primarily involving newly
George Putnam Balanced Fund 21
launched or repositioned funds, the current fee arrangements under the vast majority of the funds’ management contracts were first implemented at the beginning of 2010 following extensive review by the Contract Committee and discussions with representatives of Putnam Management, as well as approval by shareholders.
Management fee schedules and total expensesThe Trustees reviewed the management fee schedules in effect for all Putnam funds, including fee levels and breakpoints. Under its manage-ment contract, your fund has the benefit of breakpoints in its management fee schedule that provide shareholders with reduced fee levels as assets under management in the Putnam family of funds increase. The Trustees also reviewed the total expenses of each Putnam fund, recognizing that in most cases management fees repre-sented the major, but not the sole, determinant of total costs to fund shareholders. (Two funds have implemented so-called “all-in” manage-ment fees covering substantially all routine fund operating costs.)
In reviewing fees and expenses, the Trustees generally focus their attention on material changes in circumstances — for example, changes in assets under management, changes in a fund’s investment strategy, changes in Putnam Management’s operating costs or profitability, or changes in competitive practices in the mutual fund industry — that suggest that consideration of fee changes might be warranted. The Trustees concluded that the circumstances did not indicate that changes to the management fee schedule for your fund would be appropriate at this time.
As in the past, the Trustees also focused on the competitiveness of each fund’s total expense ratio. The Trustees and Putnam Management and the funds’ investor servicing agent, Putnam Investor Services, Inc. (“PSERV”), have imple-mented expense limitations that were in effect during your fund’s fiscal year ending in 2020. These expense limitations were: (i) a contrac-tual expense limitation applicable to specified open-end funds, including your fund, of 25 basis points on investor servicing fees and expenses and (ii) a contractual expense limitation appli-cable to specified open-end funds, including your fund, of 20 basis points on so-called “other expenses” (i.e., all expenses exclusive of manage-ment fees, distribution fees, investor servicing fees, investment-related expenses, interest,
taxes, brokerage commissions, acquired fund fees and expenses and extraordinary expenses). These expense limitations attempt to maintain competitive expense levels for the funds. Most funds, including your fund, had sufficiently low expenses that these expense limitations were not operative during their fiscal years ending in 2020. Putnam Management and PSERV have agreed to maintain these expense limitations until at least November 30, 2022. Putnam Management and PSERV’s commitment to these expense limitation arrangements, which were intended to support an effort to have fund expenses meet competitive standards, was an important factor in the Trustees’ decision to approve the continuance of your fund’s management and sub-management contracts.
The Trustees reviewed comparative fee and expense information for a custom group of competitive funds selected by Broadridge Financial Solutions, Inc. (“Broadridge”). This comparative information included your fund’s percentile ranking for effective management fees and total expenses (excluding any applicable 12b-1 fees), which provides a general indication of your fund’s relative standing. In the custom peer group, your fund ranked in the first quintile in effective management fees (determined for your fund and the other funds in the custom peer group based on fund asset size and the applicable contractual management fee schedule) and in the second quintile in total expenses (excluding any applicable 12b-1 fees) as of December 31, 2020. The first quintile represents the least expensive funds and the fifth quintile the most expensive funds. The fee and expense data reported by Broadridge as of December 31, 2020 reflected the most recent fiscal year-end data available in Broadridge’s database at that time.
In connection with their review of fund manage-ment fees and total expenses, the Trustees also reviewed the costs of the services provided and the profits realized by Putnam Management and its affiliates from their contractual relationships with the funds. This information included trends in revenues, expenses and profitability of Putnam Management and its affiliates relating to the investment management, investor servicing and distribution services provided to the funds. In this regard, the Trustees also reviewed an analy-sis of the revenues, expenses and profitability of Putnam Management and its affiliates, allocated on a fund-by-fund basis, with respect to the funds’ management, distribution and investor servicing
22 George Putnam Balanced Fund

contracts. For each fund, the analysis presented information about revenues, expenses and profit-ability for each of the agreements separately and for the agreements taken together on a combined basis. The Trustees concluded that, at current asset levels, the fee schedules in place for the Putnam funds, including the fee schedule for your fund, represented reasonable compensation for the services being provided and represented an appropriate sharing between fund sharehold-ers and Putnam Management of any economies of scale as may exist in the management of the Putnam funds at that time.
The information examined by the Trustees in connection with their annual contract review for the Putnam funds included information regarding services provided and fees charged by Putnam Management and its affiliates to other clients, including defined benefit pension and profit-sharing plans, sub-advised mutual funds, private funds sponsored by affiliates of Putnam Management, model-only separately managed accounts and Putnam Management’s newly launched exchange-traded funds. This information included, in cases where a product’s investment strategy corresponds with a fund’s strategy, comparisons of those fees with fees charged to the Putnam funds, as well as an assess-ment of the differences in the services provided to these clients as compared to the services provided to the Putnam funds. The Trustees observed that the differences in fee rates between these clients and the Putnam funds are by no means uniform when examined by individual asset sectors, suggesting that differences in the pricing of investment management services to these types of clients may reflect, among other things, historical competitive forces operating in separate marketplaces. The Trustees consid-ered the fact that in many cases fee rates across different asset classes are higher on average for mutual funds than for other clients, and the Trust-ees also considered the differences between the services that Putnam Management provides to the Putnam funds and those that it provides to its other clients. The Trustees did not rely on these comparisons to any significant extent in conclud-ing that the management fees paid by your fund are reasonable.
Investment performanceThe quality of the investment process provided by Putnam Management represented a major factor in the Trustees’ evaluation of the quality of
services provided by Putnam Management under your fund’s management contract. The Trustees were assisted in their review of Putnam Manage-ment’s investment process and performance by the work of the investment oversight committees of the Trustees and the full Board of Trustees, which meet on a regular basis with individual portfolio managers and with senior management of Putnam Management’s Investment Division throughout the year. The Trustees concluded that Putnam Management generally provides a high-quality investment process — based on the experience and skills of the individuals assigned to the management of fund portfolios, the resources made available to them and in general Putnam Management’s ability to attract and retain high-quality personnel — but also recognized that this does not guarantee favorable investment results for every fund in every time period.
The Trustees considered that, in the aggregate, The Putnam Funds generally performed well in 2020, which Putnam Management characterized as a challenging year with significant volatility and varied market dynamics. On an asset-weighted basis, the Putnam funds ranked in the second quartile of their peers as determined by Lipper Inc. (“Lipper”) for the year ended December 31, 2020 and, on an asset-weighted-basis, delivered a gross return that was 2.3% ahead of their benchmarks in 2020. In addition to the performance of the individual Putnam funds, the Trustees considered, as they had in prior years, the performance of The Putnam Fund complex versus competitor fund complexes. In this regard, the Trustees observed that The Putnam Funds’ relative performance, as reported in the Barron’s/Lipper Fund Families survey, continued to be exceptionally strong over the long term, with The Putnam Funds ranking as the 3rd best performing mutual fund complex out of 44 complexes for the ten-year period, with 2020 marking the fourth consecutive year that The Putnam Funds have ranked in the top ten fund complexes for the ten-year period. The Trustees noted that The Putnam Funds’ performance was solid over the one- and five-year periods, with The Putnam Funds ranking 22nd out of 53 complexes and 14th out of 50 complexes, respectively. In addition to the Barron’s/Lipper Fund Families Survey, the Trustees also considered the funds’ ratings assigned by Morningstar Inc., noting that 26 of the funds were four- or five-star rated at the end of 2020 (representing an increase of four funds year-over-year) and that this included seven funds that had achieved a five-star rating (representing
George Putnam Balanced Fund 23

an increase of two funds year-over-year). They also noted, however, the disappointing investment performance of some funds for periods ended December 31, 2020 and considered information provided by Putnam Management regarding the factors contributing to the underperformance and actions being taken to improve the performance of these particular funds. The Trustees indicated their intention to continue to monitor closely the performance of those funds and evaluate whether additional actions to address areas of underperformance may be warranted.
For purposes of the Trustees’ evaluation of the Putnam funds’ investment performance, the Trustees generally focus on a competitive indus-try ranking of each fund’s total net return over a one-year, three-year and five-year period. For a number of Putnam funds with relatively unique investment mandates for which Putnam Manage-ment informed the Trustees that meaningful competitive performance rankings are not consid-ered to be available, the Trustees evaluated performance based on their total gross and net returns and comparisons of those returns to the returns of selected investment benchmarks. In the case of your fund, the Trustees considered that its class A share cumulative total return performance at net asset value was in the following quartiles of its Lipper peer group (Lipper Balanced Funds) for the one-year, three-year and five-year periods ended December 31, 2020 (the first quartile repre-senting the best-performing funds and the fourth quartile the worst-performing funds):
One-year period 1stThree-year period 1stFive-year period 1st
For the three-year and five-year periods ended December 31, 2020, your fund’s performance was in the top decile of its Lipper peer group. Over the one-year, three-year and five-year periods ended December 31, 2020, there were 529, 511 and 478 funds, respectively, in your fund’s Lipper peer group. (When considering performance informa-tion, shareholders should be mindful that past performance is not a guarantee of future results.)
The Trustees considered Putnam Management’s continued efforts to support fund performance through certain initiatives, including structuring compensation for portfolio managers to enhance accountability for fund performance, emphasiz-ing accountability in the portfolio management process and affirming its commitment to a fundamental-driven approach to investing. The
Trustees noted further that Putnam Management had made selective hires and internal promotions in 2020 to strengthen its investment team.
Brokerage and soft-dollar allocations; investor servicingThe Trustees considered various potential benefits that Putnam Management may receive in connection with the services it provides under the management contract with your fund. These include benefits related to brokerage allocation and the use of soft dollars, whereby a portion of the commissions paid by a fund for brokerage may be used to acquire research services that are expected to be useful to Putnam Management in managing the assets of the fund and of other clients. Subject to policies established by the Trustees, soft dollars generated by these means are used predomi-nantly to acquire brokerage and research services (including third-party research and market data) that enhance Putnam Management’s investment capabilities and supplement Putnam Manage-ment’s internal research efforts. The Trustees indicated their continued intent to monitor regula-tory and industry developments in this area with the assistance of their Brokerage Committee. In addition, with the assistance of their Brokerage Committee, the Trustees indicated their contin-ued intent to monitor the allocation of the Putnam funds’ brokerage in order to ensure that the princi-ple of seeking best price and execution remains paramount in the portfolio trading process.
Putnam Management may also receive benefits from payments that the funds make to Putnam Management’s affiliates for investor or distribution services. In conjunction with the annual review of your fund’s management and sub-management contracts, the Trustees reviewed your fund’s investor servicing agreement with PSERV and its distributor’s contract and distribution plans with Putnam Retail Management Limited Partnership (“PRM”), both of which are affiliates of Putnam Management. The Trustees concluded that the fees payable by the funds to PSERV and PRM, as applicable, for such services are fair and reason-able in relation to the nature and quality of such services, the fees paid by competitive funds and the costs incurred by PSERV and PRM, as appli-cable, in providing such services. Furthermore, the Trustees were of the view that the investor services provided by PSERV were required for the operation of the funds, and that they were of a quality at least equal to those provided by other providers.
24 George Putnam Balanced Fund

Audited financial statements
George Putnam Balanced Fund 25
Audited financial statements
These sections of the report, as well as the accompanying Notes, preceded by the Report of Independent Registered Public Accounting Firm, constitute the fund’s audited financial statements.
The fund’s portfolio lists all the fund’s invest-ments and their values as of the last day of the reporting period. Holdings are organized by asset type and industry sector, country, or state to show areas of concentration and diversification.
Statement of assets and liabilities shows how the fund’s net assets and share price are determined. All investment and non-investment assets are added together. Any unpaid expenses and other liabilities are subtracted from this total. The result is divided by the number of shares to determine the net asset value per share, which is calculated separately for each class of shares. (For funds with preferred shares, the amount subtracted from total assets includes the liquidation preference of preferred shares.)
Statement of operations shows the fund’s net investment gain or loss. This is done by first adding up all the fund’s earnings — from dividends and interest income — and subtracting its operating expenses to determine net investment income (or
loss). Then, any net gain or loss the fund realized on the sales of its holdings — as well as any unreal-ized gains or losses over the period — is added to or subtracted from the net investment result to determine the fund’s net gain or loss for the fiscal period.
Statement of changes in net assets shows how the fund’s net assets were affected by the fund’s net investment gain or loss, by distributions to shareholders, and by changes in the number of the fund’s shares. It lists distributions and their sources (net investment income or realized capital gains) over the current reporting period and the most recent fiscal year-end. The distributions listed here may not match the sources listed in the Statement of operations because the distributions are deter-mined on a tax basis and may be paid in a different period from the one in which they were earned.
Financial highlights provide an overview of the fund’s investment results, per-share distributions, expense ratios, net investment income ratios, and portfolio turnover in one summary table, reflecting the five most recent reporting periods. In a semiannual report, the highlights table also includes the current reporting period.
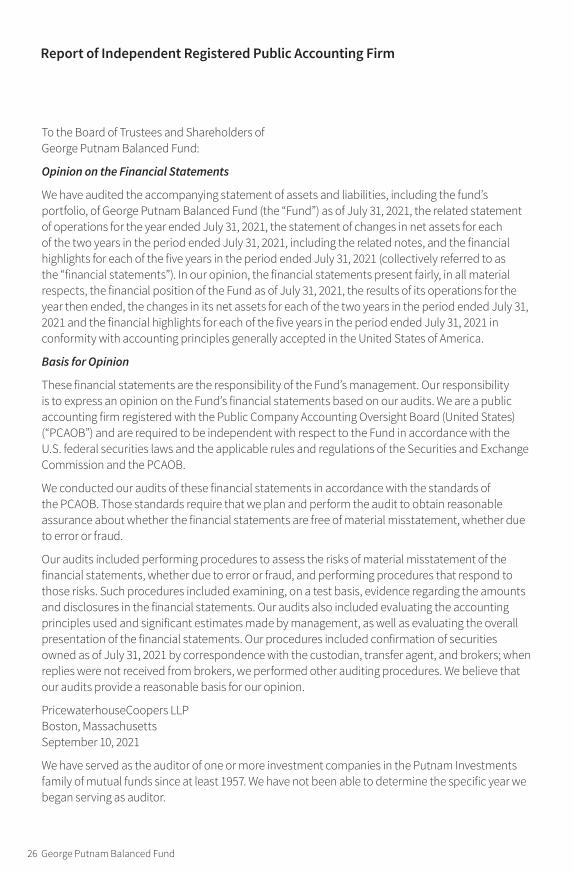
Report of Independent Registered Public Accounting Firm
To the Board of Trustees and Shareholders of George Putnam Balanced Fund:
Opinion on the Financial Statements
We have audited the accompanying statement of assets and liabilities, including the fund’s portfolio, of George Putnam Balanced Fund (the “Fund”) as of July 31, 2021, the related statement of operations for the year ended July 31, 2021, the statement of changes in net assets for each of the two years in the period ended July 31, 2021, including the related notes, and the financial highlights for each of the five years in the period ended July 31, 2021 (collectively referred to as the “financial statements”). In our opinion, the financial statements present fairly, in all material respects, the financial position of the Fund as of July 31, 2021, the results of its operations for the year then ended, the changes in its net assets for each of the two years in the period ended July 31, 2021 and the financial highlights for each of the five years in the period ended July 31, 2021 in conformity with accounting principles generally accepted in the United States of America.
Basis for Opinion
These financial statements are the responsibility of the Fund’s management. Our responsibility is to express an opinion on the Fund’s financial statements based on our audits. We are a public accounting firm registered with the Public Company Accounting Oversight Board (United States) (“PCAOB”) and are required to be independent with respect to the Fund in accordance with the U.S. federal securities laws and the applicable rules and regulations of the Securities and Exchange Commission and the PCAOB.
We conducted our audits of these financial statements in accordance with the standards of the PCAOB. Those standards require that we plan and perform the audit to obtain reasonable assurance about whether the financial statements are free of material misstatement, whether due to error or fraud.
Our audits included performing procedures to assess the risks of material misstatement of the financial statements, whether due to error or fraud, and performing procedures that respond to those risks. Such procedures included examining, on a test basis, evidence regarding the amounts and disclosures in the financial statements. Our audits also included evaluating the accounting principles used and significant estimates made by management, as well as evaluating the overall presentation of the financial statements. Our procedures included confirmation of securities owned as of July 31, 2021 by correspondence with the custodian, transfer agent, and brokers; when replies were not received from brokers, we performed other auditing procedures. We believe that our audits provide a reasonable basis for our opinion.
PricewaterhouseCoopers LLP Boston, Massachusetts September 10, 2021
We have served as the auditor of one or more investment companies in the Putnam Investments family of mutual funds since at least 1957. We have not been able to determine the specific year we began serving as auditor.
26 George Putnam Balanced Fund

George Putnam Balanced Fund 27
COMMON STOCKS (61.1%)* Shares ValueAutomotive (1.4%)Climate Change Crisis Real Impact I Acquisition Corp. Class A (acquired 1/22/21, cost $5,038,970) (Private) † ∆∆ F P2 503,897 $5,686,982General Motors Co. † 41,922 2,382,846Tesla, Inc. † 21,715 14,922,548United Rentals, Inc. † 12,616 4,157,603
27,149,979Basic materials (1.4%)Alamos Gold, Inc. Class A (Canada) S 174,239 1,414,821Anglo American PLC (United Kingdom) 36,270 1,608,501Corteva, Inc. 54,454 2,329,542Diversey Holdings, Ltd. † 54,977 917,016Dow, Inc. 29,974 1,863,184DuPont de Nemours, Inc. 20,830 1,563,292Eastman Chemical Co. 14,214 1,602,202Fortune Brands Home & Security, Inc. 10,375 1,011,251Freeport-McMoRan, Inc. (Indonesia) 57,117 2,176,158Linde PLC 12,748 3,918,608Newmont Corp. 40,909 2,569,903Sherwin-Williams Co. (The) 18,986 5,525,496
26,499,974Capital goods (4.0%)Avery Dennison Corp. 21,895 4,612,839Ball Corp. 23,052 1,864,446Boeing Co. (The) † 8,849 2,004,122CAE, Inc. (Canada) † 53,243 1,624,688Deere & Co. 13,558 4,902,437Eaton Corp. PLC 62,183 9,828,023Emerson Electric Co. 58,199 5,871,697General Dynamics Corp. 15,326 3,004,356Honeywell International, Inc. 40,817 9,542,606Ingersoll Rand, Inc. † 51,369 2,510,403Johnson Controls International PLC 119,244 8,516,406Northrop Grumman Corp. 20,219 7,339,901Otis Worldwide Corp. 68,359 6,121,548Raytheon Technologies Corp. 116,608 10,139,066
77,882,538Commercial and consumer services (3.0%)Aramark 63,802 2,241,364Booking Holdings, Inc. † 2,809 6,118,732CoStar Group, Inc. † 37,710 3,350,534Ecolab, Inc. 8,639 1,907,750Mastercard, Inc. Class A 51,874 20,020,252PayPal Holdings, Inc. † 88,306 24,330,952
57,969,584Communication services (0.1%)T-Mobile US, Inc. † 10,705 1,541,734
1,541,734
The fund’s portfolio 7/31/21

28 George Putnam Balanced Fund
COMMON STOCKS (61.1%)* cont. Shares ValueComputers (2.5%)Apple, Inc. 331,734 $48,386,721
48,386,721Conglomerates (0.2%)General Electric Co. 238,955 3,094,467
3,094,467Consumer staples (3.7%)Altria Group, Inc. 73,025 3,508,121Bunge, Ltd. 9,565 742,531Chipotle Mexican Grill, Inc. † 3,009 5,607,091Coca-Cola Co. (The) 146,520 8,356,036Constellation Brands, Inc. Class A 4,966 1,114,072Costco Wholesale Corp. 5,209 2,238,411McCormick & Co., Inc. (non-voting shares) 39,344 3,311,584Molson Coors Beverage Co. Class B † S 61,475 3,005,513PepsiCo, Inc. 98,142 15,403,387Procter & Gamble Co. (The) 132,443 18,837,368Sea, Ltd. ADR (Thailand) † 31,996 8,836,015
70,960,129Electronics (2.4%)NVIDIA Corp. 117,688 22,947,983NXP Semiconductors NV 60,823 12,553,259ON Semiconductor Corp. † 137,912 5,386,843Vontier Corp. 157,337 5,089,852
45,977,937Energy (1.6%)Cairn Energy PLC (United Kingdom) 891,540 1,582,511Cenovus Energy, Inc. (Canada) 1,094,882 9,135,718Exxon Mobil Corp. 239,578 13,792,505Phillips 66 1,518 111,467Royal Dutch Shell PLC Class A (United Kingdom) 192,999 3,871,655TotalEnergies SE (France) 64,185 2,794,317
31,288,173Financials (7.8%)AIA Group, Ltd. (Hong Kong) 299,400 3,591,412American International Group, Inc. 205,410 9,726,164Apollo Global Management, Inc. 134,133 7,895,068Assured Guaranty, Ltd. 262,063 12,529,232AXA SA (France) 284,534 7,385,119Berkshire Hathaway, Inc. Class B † 13,108 3,647,825Boston Properties, Inc. R 25,718 3,018,779Citigroup, Inc. 365,081 24,686,777Gaming and Leisure Properties, Inc. R 227,734 10,780,928Goldman Sachs Group, Inc. (The) 51,939 19,470,892Hartford Financial Services Group, Inc. (The) 31,672 2,014,973KKR & Co., Inc. Class A 169,075 10,780,222Morgan Stanley 80,613 7,737,236Prudential PLC (United Kingdom) 497,487 9,380,298Quilter PLC (United Kingdom) 2,491,998 5,556,063Visa, Inc. Class A 61,305 15,104,939
153,305,927

George Putnam Balanced Fund 29
COMMON STOCKS (61.1%)* cont. Shares ValueGaming and lottery (0.8%)Evolution AB (Sweden) 67,663 $11,787,026Penn National Gaming, Inc. † S 40,711 2,783,818
14,570,844Health care (8.1%)Abbott Laboratories 74,138 8,969,215AbbVie, Inc. 112,419 13,074,330Amgen, Inc. 12,550 3,031,327Anthem, Inc. 11,369 4,365,810Bio-Rad Laboratories, Inc. Class A † 8,939 6,610,480Biogen, Inc. † 15,967 5,216,898Boston Scientific Corp. † 119,091 5,430,550Bristol-Myers Squibb Co. 55,132 3,741,809Cigna Corp. 28,412 6,520,270Cooper Cos., Inc. (The) 7,786 3,283,901CVS Health Corp. 38,318 3,155,870Danaher Corp. 36,354 10,814,951DexCom, Inc. † 7,723 3,981,284Edwards Lifesciences Corp. † 37,506 4,210,799Eli Lilly and Co. 29,236 7,118,966Gilead Sciences, Inc. 36,732 2,508,428Intuitive Surgical, Inc. † 4,063 4,028,302Ironwood Pharmaceuticals, Inc. † 302,041 4,008,084Johnson & Johnson 53,066 9,137,965McKesson Corp. 10,205 2,080,085Medtronic PLC 32,068 4,210,849Merck & Co., Inc. 62,388 4,795,766Pfizer, Inc. 119,693 5,124,057Regeneron Pharmaceuticals, Inc. † 9,271 5,327,209Thermo Fisher Scientific, Inc. 21,175 11,434,712UnitedHealth Group, Inc. 32,890 13,557,916Zimmer Biomet Holdings, Inc. 16,894 2,760,817
158,500,650Homebuilding (0.2%)PulteGroup, Inc. 73,080 4,009,900
4,009,900Lodging/Tourism (0.3%)Hilton Worldwide Holdings, Inc. † 42,768 5,621,854
5,621,854Media (0.2%)Walt Disney Co. (The) † 23,263 4,094,753
4,094,753Miscellaneous (0.1%)Soaring Eagle (acquired 5/11/21, cost $1,206,000) (Private) † ∆∆ F P1 120,600 1,071,290
1,071,290Retail (6.6%)Advance Auto Parts, Inc. 8,025 1,701,769Amazon.com, Inc. † 17,650 58,731,964BJ’s Wholesale Club Holdings, Inc. † S 20,430 1,034,575Burlington Stores, Inc. † 3,802 1,272,910

30 George Putnam Balanced Fund
COMMON STOCKS (61.1%)* cont. Shares ValueRetail cont.CarMax, Inc. † 31,443 $4,211,790Home Depot, Inc. (The) 69,192 22,708,122L Brands, Inc. 25,282 2,024,330lululemon athletica, Inc. (Canada) † 3,381 1,352,975Nike, Inc. Class B 41,361 6,928,381O’Reilly Automotive, Inc. † 4,215 2,545,186Target Corp. 45,002 11,747,772TJX Cos., Inc. (The) 51,518 3,544,954Walmart, Inc. 82,762 11,797,723
129,602,451Semiconductor (0.5%)Applied Materials, Inc. 64,099 8,969,373
8,969,373Software (6.6%)Activision Blizzard, Inc. 107,701 9,005,958Adobe, Inc. † 30,748 19,113,879Intuit, Inc. 22,278 11,806,672Microsoft Corp. 265,212 75,561,551Oracle Corp. 152,055 13,250,073
128,738,133Technology services (6.3%)Alphabet, Inc. Class A † 24,060 64,830,392Facebook, Inc. Class A † 104,174 37,117,196Fidelity National Information Services, Inc. 139,799 20,837,041
122,784,629Textiles (0.1%)Levi Strauss & Co. Class A 39,230 1,079,610
1,079,610Toys (0.1%)Hasbro, Inc. 18,068 1,796,682
1,796,682Transportation (1.2%)CSX Corp. 101,028 3,265,225Southwest Airlines Co. † 52,789 2,666,900Union Pacific Corp. 75,820 16,586,383
22,518,508Utilities and power (1.9%)Ameren Corp. 38,157 3,202,135CenterPoint Energy, Inc. 77,218 1,965,970Exelon Corp. 166,681 7,800,671NextEra Energy, Inc. 106,597 8,303,906NRG Energy, Inc. 391,238 16,134,655
37,407,337Total common stocks (cost $842,532,032) $1,184,823,177

George Putnam Balanced Fund 31
U.S. GOVERNMENT AND AGENCY MORTGAGE OBLIGATIONS (7.7%)*
Principal amount Value
U.S. Government Guaranteed Mortgage Obligations (1.4%)Government National Mortgage Association Pass-Through Certificates
5.00%, with due dates from 2/20/49 to 10/20/49 2,397,600 $2,638,5694.50%, with due dates from 3/20/49 to 10/20/49 514,358 563,8674.00%, 4/15/43 2,663,707 2,944,6453.50%, with due dates from 11/15/47 to 4/20/51 13,152,379 14,378,8033.00%, with due dates from 7/20/46 to 10/20/46 3,600,622 3,820,5132.00%, 1/20/51 1,977,526 2,027,378
26,373,775U.S. Government Agency Mortgage Obligations (6.3%)Federal Home Loan Mortgage Corporation Pass-Through Certificates
6.00%, 3/1/35 825 9644.00%, with due dates from 7/1/42 to 7/1/49 3,964,642 4,279,1863.50%, with due dates from 12/1/42 to 4/1/43 343,074 377,5843.00%, with due dates from 3/1/43 to 2/1/47 1,492,635 1,581,3552.50%, with due dates from 7/1/50 to 2/1/51 1,718,342 1,803,260
Federal National Mortgage Association Pass-Through Certificates5.50%, with due dates from 7/1/33 to 11/1/38 972,235 1,118,3085.00%, with due dates from 8/1/33 to 1/1/39 287,131 323,9094.50%, with due dates from 5/1/48 to 2/1/49 3,290,303 3,602,4074.00%, with due dates from 9/1/45 to 4/1/49 3,375,662 3,632,7113.50%, 5/1/56 1,148,887 1,258,3473.50%, with due dates from 5/1/43 to 12/1/49 8,441,841 8,992,9723.00%, with due dates from 2/1/43 to 3/1/47 4,571,526 4,904,8633.00%, 12/1/30 1,551,610 1,634,3552.50%, with due dates from 7/1/50 to 7/1/51 51,858,207 54,290,8992.00%, 10/1/50 11,909,058 12,154,1102.00%, with due dates from 10/1/27 to 8/1/28 3,799,439 3,944,962
Uniform Mortgage-Backed Securities4.50%, TBA, 8/1/51 3,000,000 3,234,2584.00%, TBA, 9/1/51 1,000,000 1,068,9064.00%, TBA, 8/1/51 3,000,000 3,204,9613.50%, TBA, 9/1/51 2,000,000 2,115,1583.50%, TBA, 8/1/51 2,000,000 2,119,4543.00%, TBA, 9/1/51 1,000,000 1,046,1323.00%, TBA, 8/1/51 1,000,000 1,048,2032.50%, TBA, 9/1/51 1,000,000 1,039,4922.50%, TBA, 8/1/51 2,000,000 2,083,5162.00%, TBA, 8/1/51 2,000,000 2,039,723
122,899,995Total U.S. government and agency mortgage obligations (cost $146,630,108) $149,273,770
U.S. TREASURY OBLIGATIONS (13.0%)*Principal
amount ValueU.S. Treasury Bonds
3.125%, 11/15/41 i $500,000 $617,2353.00%, 2/15/47 11,500,000 14,106,4322.75%, 8/15/42 # ∆ 25,180,000 29,211,4591.25%, 5/15/50 10,760,000 9,159,030

32 George Putnam Balanced Fund
U.S. TREASURY OBLIGATIONS (13.0%)* cont.Principal
amount ValueU.S. Treasury Notes
2.75%, 2/15/24 $23,410,000 $24,881,1452.375%, 8/15/24 29,030,000 30,801,4372.25%, 11/15/27 12,740,000 13,796,2582.125%, 12/31/22 11,770,000 12,099,8992.00%, 11/30/22 i 159,000 163,5061.75%, 11/15/29 i 9,000 9,4921.625%, 2/15/26 9,670,000 10,099,6341.625%, 10/31/23 18,870,000 19,458,8801.50%, 2/15/30 12,010,000 12,355,7571.50%, 3/31/23 22,000,000 22,491,0841.125%, 2/28/25 29,610,000 30,297,0440.25%, 6/15/23 23,390,000 23,423,806
Total U.S. treasury obligations (cost $250,738,270) $252,972,098
CORPORATE BONDS AND NOTES (14.1%)*Principal
amount ValueBasic materials (0.8%)Celanese US Holdings, LLC company guaranty sr. unsec. notes 3.50%, 5/8/24 (Germany) $289,000 $309,045Celanese US Holdings, LLC company guaranty sr. unsec. notes 1.40%, 8/5/26 (Germany) 750,000 751,622CF Industries, Inc. 144A company guaranty sr. notes 4.50%, 12/1/26 1,595,000 1,847,365Georgia-Pacific, LLC 144A sr. unsec. sub. notes 2.10%, 4/30/27 1,525,000 1,592,397Glencore Funding, LLC 144A company guaranty sr. unsec. notes 2.50%, 9/1/30 1,998,000 2,015,288Huntsman International, LLC sr. unsec. notes 4.50%, 5/1/29 1,600,000 1,844,101International Flavors & Fragrances, Inc. sr. unsec. notes 4.45%, 9/26/28 625,000 733,943International Flavors & Fragrances, Inc. 144A company guaranty sr. unsec. bonds 3.468%, 12/1/50 204,000 222,003International Flavors & Fragrances, Inc. 144A sr. unsec. notes 2.30%, 11/1/30 356,000 364,248International Paper Co. sr. unsec. notes 8.70%, 6/15/38 10,000 17,094Nutrien, Ltd. sr. unsec. notes 2.95%, 5/13/30 (Canada) 1,305,000 1,403,001Sherwin-Williams Co. (The) sr. unsec. unsub. bonds 3.45%, 6/1/27 801,000 890,172WestRock MWV, LLC company guaranty sr. unsec. unsub. notes 8.20%, 1/15/30 1,040,000 1,484,843WestRock MWV, LLC company guaranty sr. unsec. unsub. notes 7.95%, 2/15/31 187,000 270,156Weyerhaeuser Co. sr. unsec. unsub. notes 7.375%, 3/15/32 R 553,000 805,229
14,550,507Capital goods (0.6%)Berry Global, Inc. 144A company guaranty sr. notes 1.65%, 1/15/27 1,045,000 1,046,066Berry Global, Inc. 144A company guaranty sr. unsub. notes 1.57%, 1/15/26 1,225,000 1,232,105Boeing Co. (The) sr. unsec. bonds 5.93%, 5/1/60 670,000 926,918Boeing Co. (The) sr. unsec. notes 4.875%, 5/1/25 685,000 768,134Johnson Controls International PLC sr. unsec. unsub. bonds 4.50%, 2/15/47 1,145,000 1,463,038

George Putnam Balanced Fund 33
CORPORATE BONDS AND NOTES (14.1%)* cont.Principal
amount ValueCapital goods cont.L3Harris Technologies, Inc. sr. unsec. bonds 1.80%, 1/15/31 $480,000 $473,218L3Harris Technologies, Inc. sr. unsec. notes 3.85%, 12/15/26 940,000 1,060,991L3Harris Technologies, Inc. sr. unsec. sub. notes 4.40%, 6/15/28 510,000 595,973Northrop Grumman Corp. sr. unsec. unsub. notes 3.25%, 1/15/28 1,619,000 1,780,457Oshkosh Corp. sr. unsec. unsub. notes 3.10%, 3/1/30 164,000 176,659Otis Worldwide Corp. sr. unsec. notes 2.565%, 2/15/30 695,000 734,292Waste Connections, Inc. sr. unsec. sub. bonds 3.50%, 5/1/29 1,010,000 1,127,745
11,385,596Communication services (1.6%)American Tower Corp. sr. unsec. bonds 2.70%, 4/15/31 R 1,953,000 2,047,861American Tower Corp. sr. unsec. notes 2.90%, 1/15/30 R 921,000 979,647American Tower Corp. sr. unsec. sub. notes 2.75%, 1/15/27 R 686,000 730,268AT&T, Inc. company guaranty sr. unsec. unsub. notes 2.30%, 6/1/27 1,227,000 1,284,667AT&T, Inc. sr. unsec. unsub. bonds 3.30%, 2/1/52 1,700,000 1,692,865AT&T, Inc. sr. unsec. unsub. bonds 2.25%, 2/1/32 1,107,000 1,103,683AT&T, Inc. sr. unsec. unsub. notes 4.75%, 5/15/46 132,000 162,117AT&T, Inc. 144A sr. unsec. bonds 3.55%, 9/15/55 62,000 64,043AT&T, Inc. 144A sr. unsec. unsub. bonds 2.55%, 12/1/33 2,013,000 2,030,782CC Holdings GS V, LLC/Crown Castle GS III Corp. company guaranty sr. notes 3.849%, 4/15/23 240,000 253,655Charter Communications Operating, LLC/Charter Communications Operating Capital Corp. company guaranty sr. bonds 2.80%, 4/1/31 291,000 301,871Charter Communications Operating, LLC/Charter Communications Operating Capital Corp. company guaranty sr. notes 3.75%, 2/15/28 274,000 304,771Charter Communications Operating, LLC/Charter Communications Operating Capital Corp. company guaranty sr. sub. bonds 6.484%, 10/23/45 1,055,000 1,484,128Charter Communications Operating, LLC/Charter Communications Operating Capital Corp. sr. bonds 3.70%, 4/1/51 65,000 65,739Charter Communications Operating, LLC/Charter Communications Operating Capital Corp. company guaranty sr. sub. bonds 5.375%, 5/1/47 506,000 625,956Comcast Corp. company guaranty sr. unsec. unsub. bonds 3.999%, 11/1/49 921,000 1,106,074Comcast Corp. company guaranty sr. unsec. unsub. bonds 2.35%, 1/15/27 481,000 509,245Comcast Corp. company guaranty sr. unsec. unsub. notes 6.50%, 11/15/35 268,000 394,827Comcast Corp. company guaranty sr. unsec. unsub. notes 3.15%, 3/1/26 9,000 9,816Comcast Corp. sr. unsec. bonds 3.45%, 2/1/50 1,618,000 1,806,042Cox Communications, Inc. 144A company guaranty sr. unsec. bonds 2.95%, 10/1/50 766,000 728,977Cox Communications, Inc. 144A sr. unsec. bonds 3.50%, 8/15/27 637,000 706,696Cox Communications, Inc. 144A sr. unsec. notes 3.35%, 9/15/26 551,000 602,501Crown Castle International Corp. sr. unsec. bonds 3.80%, 2/15/28 R 458,000 514,713Crown Castle International Corp. sr. unsec. bonds 3.65%, 9/1/27 R 549,000 612,072Crown Castle International Corp. sr. unsec. notes 4.75%, 5/15/47 R 185,000 233,406

34 George Putnam Balanced Fund
CORPORATE BONDS AND NOTES (14.1%)* cont.Principal
amount ValueCommunication services cont.Crown Castle International Corp. sr. unsec. sub. bonds 3.30%, 7/1/30 R $205,000 $223,247Crown Castle International Corp. sr. unsec. sub. bonds 2.25%, 1/15/31 1,275,000 1,278,543Equinix, Inc. sr. unsec. sub. notes 3.20%, 11/18/29 R 1,483,000 1,614,655Rogers Communications, Inc. company guaranty sr. unsec. bonds 8.75%, 5/1/32 (Canada) 95,000 147,295Rogers Communications, Inc. company guaranty sr. unsec. unsub. notes 4.50%, 3/15/43 (Canada) 215,000 253,459Sprint Spectrum Co., LLC/Sprint Spectrum Co. II, LLC/Sprint Spectrum Co. III, LLC 144A company guaranty sr. notes 3.36%, 9/20/21 59,688 59,896T-Mobile USA, Inc. company guaranty sr. notes 3.875%, 4/15/30 48,000 54,196T-Mobile USA, Inc. company guaranty sr. notes 3.75%, 4/15/27 1,762,000 1,964,419T-Mobile USA, Inc. company guaranty sr. notes 2.55%, 2/15/31 695,000 711,437Verizon Communications, Inc. sr. unsec. bonds 3.70%, 3/22/61 960,000 1,060,490Verizon Communications, Inc. sr. unsec. notes 3.15%, 3/22/30 700,000 762,684Verizon Communications, Inc. sr. unsec. notes 2.55%, 3/21/31 480,000 499,059Verizon Communications, Inc. sr. unsec. unsub. notes 4.329%, 9/21/28 1,904,000 2,233,164Videotron, Ltd./Videotron Ltee. 144A sr. unsec. notes 5.125%, 4/15/27 (Canada) 490,000 510,825
31,729,791Conglomerates (—%)General Electric Co. jr. unsec. sub. FRN (BBA LIBOR USD 3 Month + 3.33%), 3.449%, perpetual maturity 689,000 673,498
673,498Consumer cyclicals (1.2%)Alimentation Couche-Tard, Inc. 144A company guaranty sr. unsec. notes 3.55%, 7/26/27 (Canada) 995,000 1,105,694Alimentation Couche-Tard, Inc. 144A sr. unsec. notes 2.95%, 1/25/30 (Canada) 919,000 972,373Amazon.com, Inc. sr. unsec. notes 4.05%, 8/22/47 1,105,000 1,365,345Amazon.com, Inc. sr. unsec. notes 3.15%, 8/22/27 654,000 725,725Amazon.com, Inc. sr. unsec. unsub. notes 1.50%, 6/3/30 600,000 594,156Autonation, Inc. company guaranty sr. unsec. notes 4.50%, 10/1/25 255,000 284,371Autonation, Inc. sr. unsec. bonds 2.40%, 8/1/31 454,000 456,540BMW US Capital, LLC 144A company guaranty sr. unsec. notes 3.95%, 8/14/28 671,000 773,998BMW US Capital, LLC 144A company guaranty sr. unsec. notes 3.40%, 8/13/21 390,000 390,344Discovery Communications, LLC company guaranty sr. unsec. unsub. notes 3.625%, 5/15/30 473,000 521,509General Motors Co. sr. unsec. bonds 5.95%, 4/1/49 553,000 757,163General Motors Co. sr. unsec. bonds 5.20%, 4/1/45 225,000 281,356General Motors Financial Co., Inc. company guaranty sr. unsec. notes 4.00%, 10/6/26 287,000 318,416General Motors Financial Co., Inc. company guaranty sr. unsec. unsub. notes 4.30%, 7/13/25 252,000 279,654General Motors Financial Co., Inc. company guaranty sr. unsec. unsub. notes 4.00%, 1/15/25 175,000 191,317

George Putnam Balanced Fund 35
CORPORATE BONDS AND NOTES (14.1%)* cont.Principal
amount ValueConsumer cyclicals cont.Global Payments, Inc. sr. unsec. notes 2.90%, 5/15/30 $889,000 $944,551IHS Markit, Ltd. 144A company guaranty notes 4.75%, 2/15/25 (United Kingdom) 1,415,000 1,579,494IHS Markit, Ltd. 144A company guaranty sr. unsec. notes 4.00%, 3/1/26 (United Kingdom) 350,000 388,938Interpublic Group of Cos., Inc. (The) sr. unsec. sub. bonds 4.65%, 10/1/28 1,668,000 1,979,211Lennar Corp. company guaranty sr. unsec. unsub. notes 4.75%, 11/29/27 1,449,000 1,688,390Moody’s Corp. sr. unsec. bonds 2.55%, 8/18/60 585,000 537,512Omnicom Group, Inc. company guaranty sr. unsec. unsub. notes 3.60%, 4/15/26 416,000 462,109Omnicom Group, Inc. sr. unsec. sub. notes 2.45%, 4/30/30 1,330,000 1,375,115QVC, Inc. company guaranty sr. notes 4.85%, 4/1/24 390,000 422,663S&P Global, Inc. company guaranty sr. unsec. bonds 2.50%, 12/1/29 1,550,000 1,655,952S&P Global, Inc. company guaranty sr. unsec. notes 1.25%, 8/15/30 423,000 406,946Sirius XM Radio, Inc. 144A sr. unsec. bonds 5.00%, 8/1/27 1,115,000 1,167,963ViacomCBS, Inc. company guaranty sr. unsec. bonds 4.20%, 6/1/29 360,000 419,535ViacomCBS, Inc. company guaranty sr. unsec. unsub. bonds 2.90%, 1/15/27 457,000 491,380ViacomCBS, Inc. company guaranty sr. unsec. unsub. notes 4.00%, 1/15/26 198,000 221,065ViacomCBS, Inc. sr. unsec. notes 4.20%, 5/19/32 8,000 9,359Walt Disney Co. (The) company guaranty sr. unsec. bonds 4.75%, 9/15/44 30,000 40,095
22,808,239Consumer staples (1.0%)Anheuser-Busch InBev Worldwide, Inc. company guaranty sr. unsec. unsub. bonds 5.55%, 1/23/49 1,172,000 1,646,229Anheuser-Busch InBev Worldwide, Inc. company guaranty sr. unsec. unsub. bonds 4.95%, 1/15/42 200,000 256,612Anheuser-Busch InBev Worldwide, Inc. company guaranty sr. unsec. unsub. bonds 4.60%, 4/15/48 1,389,000 1,730,545Anheuser-Busch InBev Worldwide, Inc. company guaranty sr. unsec. unsub. notes 4.75%, 1/23/29 827,000 994,764Ashtead Capital, Inc. 144A notes 4.375%, 8/15/27 1,155,000 1,209,863Ashtead Capital, Inc. 144A notes 4.00%, 5/1/28 1,190,000 1,252,475CVS Pass-Through Trust 144A sr. mtge. notes 7.507%, 1/10/32 503,319 640,163ERAC USA Finance, LLC 144A company guaranty sr. unsec. notes 7.00%, 10/15/37 1,434,000 2,177,770ERAC USA Finance, LLC 144A company guaranty sr. unsec. notes 5.625%, 3/15/42 566,000 791,689Keurig Dr Pepper, Inc. company guaranty sr. unsec. bonds 3.20%, 5/1/30 187,000 205,939Keurig Dr Pepper, Inc. company guaranty sr. unsec. notes 2.25%, 3/15/31 905,000 926,314Keurig Dr Pepper, Inc. company guaranty sr. unsec. unsub. notes 4.597%, 5/25/28 717,000 849,733Kraft Heinz Foods Co. company guaranty sr. unsec. bonds 4.375%, 6/1/46 1,090,000 1,255,952

36 George Putnam Balanced Fund
CORPORATE BONDS AND NOTES (14.1%)* cont.Principal
amount ValueConsumer staples cont.Kraft Heinz Foods Co. company guaranty sr. unsec. sub. notes 4.875%, 10/1/49 $925,000 $1,153,702Kraft Heinz Foods Co. company guaranty sr. unsec. sub. notes 3.875%, 5/15/27 215,000 238,117Lamb Weston Holdings, Inc. 144A company guaranty sr. unsec. unsub. notes 4.875%, 11/1/26 816,000 841,949Mondelez International Holdings Netherlands BV 144A company guaranty sr. unsec. unsub. notes 2.00%, 10/28/21 (Netherlands) 1,000,000 1,002,690Netflix, Inc. sr. unsec. unsub. notes 4.375%, 11/15/26 1,660,000 1,883,170
19,057,676Energy (0.5%)BG Energy Capital PLC 144A company guaranty sr. unsec. unsub. notes 4.00%, 10/15/21 (United Kingdom) 250,000 251,750BP Capital Markets America, Inc. company guaranty sr. unsec. notes 3.119%, 5/4/26 770,000 839,237BP Capital Markets America, Inc. company guaranty sr. unsec. unsub. notes 3.937%, 9/21/28 690,000 793,243Cheniere Corpus Christi Holdings, LLC company guaranty sr. notes 5.125%, 6/30/27 1,245,000 1,458,348ConocoPhillips 144A company guaranty sr. unsec. notes 3.75%, 10/1/27 999,000 1,137,128Diamondback Energy, Inc. company guaranty sr. unsec. notes 3.25%, 12/1/26 780,000 842,237Equinor ASA company guaranty sr. unsec. notes 5.10%, 8/17/40 (Norway) 550,000 743,626Sabine Pass Liquefaction, LLC sr. bonds 4.20%, 3/15/28 175,000 198,484Sabine Pass Liquefaction, LLC sr. notes 5.00%, 3/15/27 878,000 1,023,459Transcanada Trust company guaranty jr. unsec. sub. FRB 5.30%, 3/15/77 (Canada) 1,285,000 1,379,576
8,667,088Financials (4.6%)Air Lease Corp. sr. unsec. notes Ser. MTN, 3.00%, 2/1/30 1,625,000 1,679,383Air Lease Corp. sr. unsec. sub. bonds 4.625%, 10/1/28 328,000 375,538Air Lease Corp. sr. unsec. sub. notes 3.25%, 10/1/29 928,000 980,493American International Group, Inc. jr. unsec. sub. FRB 8.175%, 5/15/58 107,000 158,761Aon PLC company guaranty sr. unsec. unsub. notes 4.25%, 12/12/42 1,265,000 1,505,859Ares Capital Corp. sr. unsec. sub. notes 3.875%, 1/15/26 1,555,000 1,678,348Australia & New Zealand Banking Group, Ltd. 144A unsec. sub. FRB 2.57%, 11/25/35 (Australia) 920,000 906,401Australia & New Zealand Banking Group, Ltd./United Kingdom 144A jr. unsec. sub. FRB 6.75%, perpetual maturity (United Kingdom) 200,000 235,000Banco Santander SA unsec. sub. notes 5.179%, 11/19/25 (Spain) 1,200,000 1,375,560Bank of America Corp. jr. unsec. sub. bonds Ser. JJ, 5.125%, perpetual maturity 1,135,000 1,210,239Bank of America Corp. jr. unsec. sub. FRN Ser. AA, 6.10%, perpetual maturity 314,000 348,933Bank of America Corp. sr. unsec. FRN Ser. MTN, 2.496%, 2/13/31 715,000 736,776

George Putnam Balanced Fund 37
CORPORATE BONDS AND NOTES (14.1%)* cont.Principal
amount ValueFinancials cont.Bank of America Corp. unsec. sub. FRN (BBA LIBOR USD 3 Month + 0.76%), 0.879%, 9/15/26 $275,000 $273,353Bank of America Corp. unsec. sub. notes 6.11%, 1/29/37 600,000 833,953Bank of Montreal unsec. sub. FRN 3.803%, 12/15/32 (Canada) 390,000 433,949Bank of Nova Scotia (The) sr. unsec. notes 2.00%, 11/15/22 (Canada) 3,100,000 3,169,001Berkshire Hathaway Finance Corp. company guaranty sr. unsec. bonds 2.85%, 10/15/50 5,000 5,125Berkshire Hathaway Finance Corp. company guaranty sr. unsec. notes 4.30%, 5/15/43 808,000 1,025,796BNP Paribas SA 144A jr. unsec. sub. FRN 4.625%, perpetual maturity (replace maturity with perpetual maturity) (France) 305,000 317,139BNP Paribas SA 144A unsec. sub. FRB 2.588%, 8/12/35 (France) 695,000 686,203BPCE SA 144A unsec. sub. notes 5.15%, 7/21/24 (France) 810,000 901,208BPCE SA 144A unsec. sub. notes 4.50%, 3/15/25 (France) 1,060,000 1,176,027Camden Property Trust sr. unsec. unsub. notes 4.875%, 6/15/23 R 1,213,000 1,294,192Cantor Fitzgerald LP 144A unsec. notes 6.50%, 6/17/22 824,000 865,222Capital One Financial Corp. unsec. sub. FRB 2.359%, 7/29/32 1,447,000 1,460,310Capital One Financial Corp. unsec. sub. notes 4.20%, 10/29/25 227,000 254,982CIT Bank NA sr. unsec. FRN Ser. BKNT, 2.969%, 9/27/25 250,000 263,438CIT Group, Inc. sr. unsec. unsub. notes 5.25%, 3/7/25 1,894,000 2,135,485Citigroup, Inc. jr. unsec. sub. FRN 3.875%, perpetual maturity (replace maturity with perpetual maturity) 1,580,000 1,625,425Citigroup, Inc. sr. unsec. FRB 3.668%, 7/24/28 10,000 11,096Citigroup, Inc. unsec. sub. bonds 4.75%, 5/18/46 1,540,000 1,981,828Citigroup, Inc. unsec. sub. bonds 4.45%, 9/29/27 2,634,000 3,039,334CNO Financial Group, Inc. sr. unsec. unsub. notes 5.25%, 5/30/25 241,000 274,234Commonwealth Bank of Australia 144A unsec. sub. notes 2.688%, 3/11/31 (Australia) 535,000 543,200Cooperatieve Centrale Raiffeisen-Boerenleenbank BA/Netherlands company guaranty unsec. sub. notes 4.625%, 12/1/23 (Netherlands) 250,000 272,816Cooperative Rabobank UA company guaranty unsec. sub. notes 3.75%, 7/21/26 (Netherlands) 285,000 315,204Credit Agricole SA 144A unsec. sub. FRN 4.00%, 1/10/33 (France) 340,000 371,450Credit Suisse AG sr. unsec. notes 1.00%, 5/5/23 3,100,000 3,133,773Credit Suisse Group AG 144A sr. unsec. bonds 3.869%, 1/12/29 (Switzerland) 443,000 492,032Credit Suisse Group AG 144A sr. unsec. FRN 2.193%, 6/5/26 (Switzerland) 320,000 328,843Credit Suisse Group AG 144A unsec. sub. notes 6.50%, 8/8/23 (Switzerland) 729,000 803,480Deutsche Bank AG unsec. sub. FRB 3.729%, 1/14/32 (Germany) 1,730,000 1,780,670Digital Realty Trust LP company guaranty sr. unsec. bonds 4.45%, 7/15/28 R 1,395,000 1,637,646Fairfax Financial Holdings, Ltd. sr. unsec. notes 4.85%, 4/17/28 (Canada) 1,225,000 1,428,407Fairfax US, Inc. 144A company guaranty sr. unsec. notes 4.875%, 8/13/24 330,000 361,444Fifth Third Bancorp jr. unsec. sub. FRB 5.10%, perpetual maturity 217,000 224,270
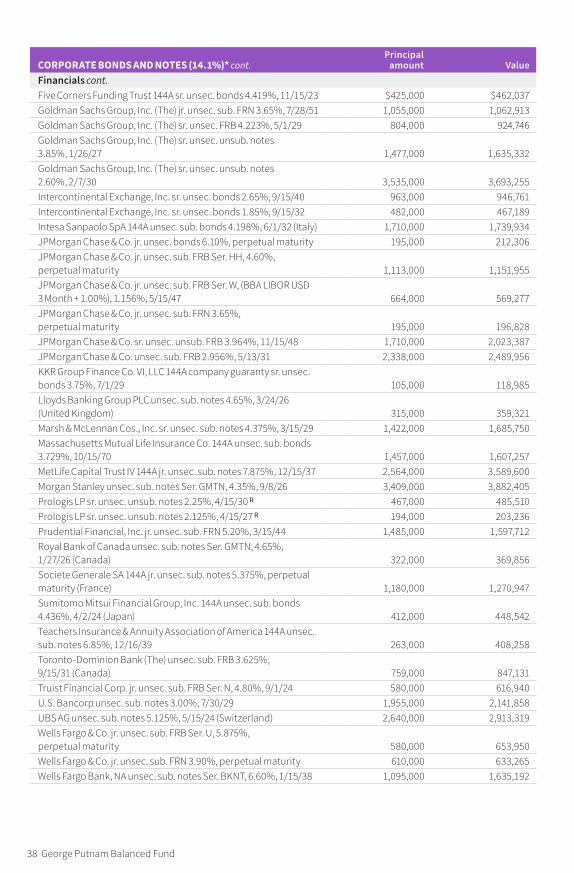
38 George Putnam Balanced Fund
CORPORATE BONDS AND NOTES (14.1%)* cont.Principal
amount ValueFinancials cont.Five Corners Funding Trust 144A sr. unsec. bonds 4.419%, 11/15/23 $425,000 $462,037Goldman Sachs Group, Inc. (The) jr. unsec. sub. FRN 3.65%, 7/28/51 1,055,000 1,062,913Goldman Sachs Group, Inc. (The) sr. unsec. FRB 4.223%, 5/1/29 804,000 924,746Goldman Sachs Group, Inc. (The) sr. unsec. unsub. notes 3.85%, 1/26/27 1,477,000 1,635,332Goldman Sachs Group, Inc. (The) sr. unsec. unsub. notes 2.60%, 2/7/30 3,535,000 3,693,255Intercontinental Exchange, Inc. sr. unsec. bonds 2.65%, 9/15/40 963,000 946,761Intercontinental Exchange, Inc. sr. unsec. bonds 1.85%, 9/15/32 482,000 467,189Intesa Sanpaolo SpA 144A unsec. sub. bonds 4.198%, 6/1/32 (Italy) 1,710,000 1,739,934JPMorgan Chase & Co. jr. unsec. bonds 6.10%, perpetual maturity 195,000 212,306JPMorgan Chase & Co. jr. unsec. sub. FRB Ser. HH, 4.60%, perpetual maturity 1,113,000 1,151,955JPMorgan Chase & Co. jr. unsec. sub. FRB Ser. W, (BBA LIBOR USD 3 Month + 1.00%), 1.156%, 5/15/47 664,000 569,277JPMorgan Chase & Co. jr. unsec. sub. FRN 3.65%, perpetual maturity 195,000 196,828JPMorgan Chase & Co. sr. unsec. unsub. FRB 3.964%, 11/15/48 1,710,000 2,023,387JPMorgan Chase & Co. unsec. sub. FRB 2.956%, 5/13/31 2,338,000 2,489,956KKR Group Finance Co. VI, LLC 144A company guaranty sr. unsec. bonds 3.75%, 7/1/29 105,000 118,985Lloyds Banking Group PLC unsec. sub. notes 4.65%, 3/24/26 (United Kingdom) 315,000 359,321Marsh & McLennan Cos., Inc. sr. unsec. sub. notes 4.375%, 3/15/29 1,422,000 1,685,750Massachusetts Mutual Life Insurance Co. 144A unsec. sub. bonds 3.729%, 10/15/70 1,457,000 1,607,257MetLife Capital Trust IV 144A jr. unsec. sub. notes 7.875%, 12/15/37 2,564,000 3,589,600Morgan Stanley unsec. sub. notes Ser. GMTN, 4.35%, 9/8/26 3,409,000 3,882,405Prologis LP sr. unsec. unsub. notes 2.25%, 4/15/30 R 467,000 485,510Prologis LP sr. unsec. unsub. notes 2.125%, 4/15/27 R 194,000 203,236Prudential Financial, Inc. jr. unsec. sub. FRN 5.20%, 3/15/44 1,485,000 1,597,712Royal Bank of Canada unsec. sub. notes Ser. GMTN, 4.65%, 1/27/26 (Canada) 322,000 369,856Societe Generale SA 144A jr. unsec. sub. notes 5.375%, perpetual maturity (France) 1,180,000 1,270,947Sumitomo Mitsui Financial Group, Inc. 144A unsec. sub. bonds 4.436%, 4/2/24 (Japan) 412,000 448,542Teachers Insurance & Annuity Association of America 144A unsec. sub. notes 6.85%, 12/16/39 263,000 408,258Toronto-Dominion Bank (The) unsec. sub. FRB 3.625%, 9/15/31 (Canada) 759,000 847,131Truist Financial Corp. jr. unsec. sub. FRB Ser. N, 4.80%, 9/1/24 580,000 616,940U.S. Bancorp unsec. sub. notes 3.00%, 7/30/29 1,955,000 2,141,858UBS AG unsec. sub. notes 5.125%, 5/15/24 (Switzerland) 2,640,000 2,913,319Wells Fargo & Co. jr. unsec. sub. FRB Ser. U, 5.875%, perpetual maturity 580,000 653,950Wells Fargo & Co. jr. unsec. sub. FRN 3.90%, perpetual maturity 610,000 633,265Wells Fargo Bank, NA unsec. sub. notes Ser. BKNT, 6.60%, 1/15/38 1,095,000 1,635,192

George Putnam Balanced Fund 39
CORPORATE BONDS AND NOTES (14.1%)* cont.Principal
amount ValueFinancials cont.Westpac Banking Corp. unsec. sub. bonds 4.421%, 7/24/39 (Australia) $670,000 $808,191Westpac Banking Corp. unsec. sub. bonds 2.963%, 11/16/40 (Australia) 597,000 600,825
89,365,752Health care (1.4%)AbbVie, Inc. sr. unsec. notes 3.20%, 11/21/29 2,440,000 2,678,746Amgen, Inc. sr. unsec. bonds 4.663%, 6/15/51 710,000 938,422Amgen, Inc. sr. unsec. unsub. notes 2.60%, 8/19/26 273,000 291,088Becton Dickinson and Co. sr. unsec. notes 2.823%, 5/20/30 820,000 872,122Bristol-Myers Squibb Co. sr. unsec. notes 2.75%, 2/15/23 3,100,000 3,215,923Bristol-Myers Squibb Co. sr. unsec. sub. notes 3.40%, 7/26/29 2,325,000 2,633,421Cigna Corp. company guaranty sr. unsec. unsub. notes 3.75%, 7/15/23 1,008,000 1,070,464CVS Health Corp. sr. unsec. unsub. notes 4.78%, 3/25/38 1,600,000 2,008,552CVS Health Corp. sr. unsec. unsub. notes 3.70%, 3/9/23 98,000 102,953CVS Pass-Through Trust 144A sr. mtge. notes 4.704%, 1/10/36 536,687 615,294DH Europe Finance II Sarl company guaranty sr. unsec. bonds 3.40%, 11/15/49 (Luxembourg) 1,425,000 1,594,606DH Europe Finance II Sarl company guaranty sr. unsec. notes 2.60%, 11/15/29 (Luxembourg) 600,000 637,113HCA, Inc. company guaranty sr. bonds 5.25%, 6/15/26 143,000 166,601HCA, Inc. company guaranty sr. bonds 3.50%, 7/15/51 341,000 352,088HCA, Inc. company guaranty sr. notes 4.125%, 6/15/29 505,000 576,396HCA, Inc. company guaranty sr. sub. bonds 5.50%, 6/15/47 270,000 359,108HCA, Inc. company guaranty sr. sub. notes 5.00%, 3/15/24 475,000 525,482Service Corp. International sr. unsec. notes 4.625%, 12/15/27 185,000 194,713Service Corp. International sr. unsec. notes 3.375%, 8/15/30 165,000 164,571Service Corp. International sr. unsec. sub. notes 4.00%, 5/15/31 1,335,000 1,378,187UnitedHealth Group, Inc. sr. unsec. unsub. notes 2.00%, 5/15/30 1,602,000 1,639,717Viatris, Inc. 144A company guaranty sr. unsec. bonds 4.00%, 6/22/50 2,820,000 3,052,822Viatris, Inc. 144A company guaranty sr. unsec. notes 2.30%, 6/22/27 565,000 581,202Zoetis, Inc. sr. unsec. notes 3.90%, 8/20/28 1,210,000 1,393,304Zoetis, Inc. sr. unsec. sub. notes 2.00%, 5/15/30 306,000 310,058
27,352,953Technology (1.5%)Alphabet, Inc. sr. unsec. bonds 2.25%, 8/15/60 1,200,000 1,087,536Alphabet, Inc. sr. unsec. notes 1.998%, 8/15/26 748,000 787,542Apple, Inc. sr. unsec. bonds 2.80%, 2/8/61 3,480,000 3,450,072Apple, Inc. sr. unsec. notes 1.65%, 5/11/30 15,000 15,055Apple, Inc. sr. unsec. unsub. notes 4.375%, 5/13/45 342,000 437,547Apple, Inc. sr. unsec. unsub. notes 3.85%, 5/4/43 486,000 585,981Broadcom, Inc. company guaranty sr. unsec. bonds 4.15%, 11/15/30 2,637,000 2,989,006Broadcom, Inc. 144A company guaranty sr. unsec. bonds 3.75%, 2/15/51 676,000 714,053Cisco Systems, Inc./California sr. unsec. unsub. notes 3.625%, 3/4/24 3,100,000 3,355,805

40 George Putnam Balanced Fund
CORPORATE BONDS AND NOTES (14.1%)* cont.Principal
amount ValueTechnology cont.Dell International, LLC/EMC Corp. company guaranty sr. bonds 8.35%, 7/15/46 $271,000 $443,613Fidelity National Information Services, Inc. sr. unsec. bonds 2.25%, 3/1/31 1,875,000 1,905,505Fiserv, Inc. sr. unsec. bonds 3.50%, 7/1/29 540,000 603,137Fiserv, Inc. sr. unsec. sub. bonds 4.20%, 10/1/28 1,295,000 1,501,031Microchip Technology, Inc. company guaranty sr. notes 4.333%, 6/1/23 710,000 754,852Microsoft Corp. sr. unsec. unsub. bonds 2.921%, 3/17/52 1,150,000 1,239,185Oracle Corp. sr. unsec. bonds 3.65%, 3/25/41 1,750,000 1,898,576Salesforce.com, Inc. sr. unsec. bonds 3.05%, 7/15/61 1,463,000 1,522,838Salesforce.com, Inc. sr. unsec. bonds 2.90%, 7/15/51 1,462,000 1,499,425Sensata Technologies, Inc. 144A company guaranty sr. unsec. notes 3.75%, 2/15/31 1,310,000 1,319,825ServiceNow, Inc. sr. unsec. notes 1.40%, 9/1/30 1,520,000 1,454,204VMware, Inc. sr. unsec. unsub. bonds 2.20%, 8/15/31 1,766,000 1,763,102
29,327,890Transportation (—%)Penske Truck Leasing Co. LP/PTL Finance Corp. 144A sr. unsec. bonds 3.40%, 11/15/26 595,000 652,614
652,614Utilities and power (0.9%)AES Corp. (The) 144A sr. unsec. bonds 2.45%, 1/15/31 1,045,000 1,056,604American Electric Power Co., Inc. sr. unsec. unsub. notes Ser. J, 4.30%, 12/1/28 528,000 614,297Appalachian Power Co. sr. unsec. unsub. notes Ser. L, 5.80%, 10/1/35 560,000 741,666Commonwealth Edison Co. sr. mtge. bonds 5.875%, 2/1/33 610,000 828,407Consolidated Edison Co. of New York, Inc. sr. unsec. unsub. notes 4.20%, 3/15/42 255,000 303,537Duke Energy Carolinas, LLC sr. mtge. notes 4.25%, 12/15/41 520,000 641,293Duke Energy Ohio, Inc. sr. bonds 3.65%, 2/1/29 280,000 315,626El Paso Natural Gas Co., LLC company guaranty sr. unsec. unsub. notes 8.375%, 6/15/32 490,000 738,941Enbridge, Inc. sr. unsec. unsub. bonds 4.25%, 12/1/26 (Canada) 416,000 471,409Energy Transfer LP jr. unsec. sub. FRN 6.625%, perpetual maturity 2,076,000 2,039,462Energy Transfer Operating LP sr. unsec. unsub. notes 7.60%, 2/1/24 470,000 534,612Energy Transfer Operating LP sr. unsec. unsub. notes 6.50%, 2/1/42 137,000 180,093Enterprise Products Operating, LLC company guaranty sr. unsec. notes 2.80%, 1/31/30 1,704,000 1,827,601Enterprise Products Operating, LLC company guaranty sr. unsec. unsub. bonds 4.25%, 2/15/48 560,000 653,230IPALCO Enterprises, Inc. sr. notes 4.25%, 5/1/30 813,000 925,593IPALCO Enterprises, Inc. sr. sub. notes 3.70%, 9/1/24 340,000 366,836Kinder Morgan Energy Partners LP company guaranty sr. unsec. notes 5.40%, 9/1/44 199,000 252,517NRG Energy, Inc. 144A company guaranty sr. notes 3.75%, 6/15/24 620,000 662,053Oncor Electric Delivery Co., LLC sr. notes 5.75%, 3/15/29 445,000 565,056Pacific Gas and Electric Co. notes 2.10%, 8/1/27 235,000 228,610PacifiCorp sr. bonds 2.70%, 9/15/30 656,000 700,261

George Putnam Balanced Fund 41
CORPORATE BONDS AND NOTES (14.1%)* cont.Principal
amount ValueUtilities and power cont.Vistra Operations Co., LLC 144A company guaranty sr. notes 4.30%, 7/15/29 $442,000 $483,630Vistra Operations Co., LLC 144A company guaranty sr. notes 3.55%, 7/15/24 523,000 555,905WEC Energy Group, Inc. jr. unsec. sub. FRN Ser. A, (BBA LIBOR USD 3 Month + 2.11%), 2.268%, 5/15/67 1,945,000 1,818,575
17,505,814Total corporate bonds and notes (cost $253,631,659) $273,077,418
MORTGAGE-BACKED SECURITIES (0.9%)*Principal
amount ValueBANK Ser. 19-BN19, Class AS, 3.446%, 8/15/61 $797,000 $882,485Citigroup Commercial Mortgage Trust
Ser. 14-GC21, Class C, 4.78%, 5/10/47 W 508,000 529,683Ser. 14-GC21, Class AS, 4.026%, 5/10/47 617,000 658,958Ser. 18-B2, Class A4, 4.009%, 3/10/51 1,749,000 2,005,813
COMM Mortgage TrustFRB Ser. 12-LC4, Class C, 5.553%, 12/10/44 W 241,000 225,138FRB Ser. 14-CR18, Class C, 4.756%, 7/15/47 W 2,392,000 2,453,697Ser. 13-CR13, Class AM, 4.449%, 11/10/46 W 777,000 835,409Ser. 12-CR1, Class AM, 3.912%, 5/15/45 1,046,000 1,062,895
Eagle Re, Ltd. 144A FRB Ser. 18-1, Class M1, (1 Month US LIBOR + 1.70%), 1.789%, 11/25/28 (Bermuda) 261,538 262,231Federal National Mortgage Association
Connecticut Avenue Securities FRB Ser. 16-C01, Class 1M2, (1 Month US LIBOR + 6.75%), 6.839%, 8/25/28 486,073 514,507Connecticut Avenue Securities FRB Ser. 16-C02, Class 1M2, (1 Month US LIBOR + 6.00%), 6.089%, 9/25/28 50,531 53,069Connecticut Avenue Securities FRB Ser. 17-C01, Class 1EB1, (1 Month US LIBOR + 1.25%), 1.339%, 7/25/29 260,000 260,975REMICs Ser. 01-79, Class BI, IO, 0.268%, 3/25/45 W 416,671 2,083
FIRSTPLUS Home Loan Owner Trust Ser. 97-3, Class B1, 7.79%, 11/10/23 (In default) † 194,241 19Home Re, Ltd. 144A FRB Ser. 18-1, Class M1, (1 Month US LIBOR + 1.60%), 1.689%, 10/25/28 (Bermuda) 175,194 175,548JPMorgan Chase Commercial Mortgage Securities Trust FRB Ser. 12-C6, Class D, 5.141%, 5/15/45 W 772,000 708,277JPMorgan Chase Commercial Mortgage Securities Trust 144A FRB Ser. 12-C8, Class D, 4.669%, 10/15/45 W 404,000 384,354Morgan Stanley Bank of America Merrill Lynch Trust Ser. 16-C28, Class A4, 3.544%, 1/15/49 3,360,000 3,678,149Morgan Stanley Capital I Trust Ser. 18-L1, Class A4, 4.407%, 10/15/51 W 875,000 1,028,413Morgan Stanley Capital I Trust 144A FRB Ser. 12-C4, Class D, 5.409%, 3/15/45 W 1,794,000 1,629,704TIAA Real Estate CDO, Ltd. 144A Ser. 03-1A, Class E, 8.00%, 12/28/38 (In default) † 2,032,334 20Total mortgage-backed securities (cost $18,530,068) $17,351,427

42 George Putnam Balanced Fund
MUNICIPAL BONDS AND NOTES (0.1%)*Principal
amount ValueCA State G.O. Bonds, (Build America Bonds), 7.50%, 4/1/34 $215,000 $344,039North TX, Tollway Auth. Rev. Bonds, (Build America Bonds), 6.718%, 1/1/49 350,000 596,106OH State U. Rev. Bonds, (Build America Bonds), 4.91%, 6/1/40 275,000 375,210Total municipal bonds and notes (cost $841,125) $1,315,355
SHORT-TERM INVESTMENTS (4.5%)* Shares ValuePutnam Cash Collateral Pool, LLC 0.09% d 5,789,325 $5,789,325Putnam Short Term Investment Fund Class P 0.09% L 82,200,848 82,200,848State Street Institutional U.S. Government Money Market Fund, Premier Class 0.03% P 300,000 300,000Total short-term investments (cost $88,290,173) $88,290,173
TOTAL INVESTMENTSTotal investments (cost $1,601,193,435) $1,967,103,418
Key to holding’s abbreviations
ADR American Depository Receipts: represents ownership of foreign securities on deposit with a custodian bank
BKNT Bank NoteFRB Floating Rate Bonds: the rate shown is the current interest rate at the close of the reporting period.
Rates may be subject to a cap or floor. For certain securities, the rate may represent a fixed rate currently in place at the close of the reporting period.
FRN Floating Rate Notes: the rate shown is the current interest rate or yield at the close of the reporting period. Rates may be subject to a cap or floor. For certain securities, the rate may represent a fixed rate currently in place at the close of the reporting period.
GMTN Global Medium Term NotesG.O. Bonds General Obligation BondsIO Interest OnlyMTN Medium Term NotesTBA To Be Announced Commitments
Notes to the fund’s portfolioUnless noted otherwise, the notes to the fund’s portfolio are for the close of the fund’s reporting period, which ran from August 1, 2020 through July 31, 2021 (the reporting period). Within the following notes to the portfolio, references to “Putnam Management” represent Putnam Investment Management, LLC, the fund’s manager, an indirect wholly-owned subsidiary of Putnam Investments, LLC and references to “ASC 820” represent Accounting Standards Codification 820 Fair Value Measurements and Disclosures.
* Percentages indicated are based on net assets of $1,940,601,858. † This security is non-income-producing.
∆∆ This security is restricted with regard to public resale. The total fair value of this security and any other restricted securities (excluding 144A securities), if any, held at the close of the reporting period was $6,758,272, or less than 0.1% of net assets.
# This security, in part or in entirety, was pledged and segregated with the broker to cover margin requirements for futures contracts at the close of the reporting period. Collateral at period end totaled $1,841,312 and is included in Investments in securities on the Statement of assets and liabilities (Notes 1 and 8).
∆ This security, in part or in entirety, was pledged and segregated with the custodian for collateral on certain derivative contracts at the close of the reporting period. Collateral at period end totaled $306,103 and is included in Investments in securities on the Statement of assets and liabilities (Notes 1 and 8).
d Affiliated company. See Notes 1 and 5 to the financial statements regarding securities lending. The rate quoted in the security description is the annualized 7-day yield of the fund at the close of the reporting period.

F This security is valued by Putnam Management at fair value following procedures approved by the Trustees. Securities are classified as Level 3 for ASC 820 based on the securities’ valuation inputs (Note 1).
i This security was pledged, or purchased with cash that was pledged, to the fund for collateral on certain derivative contracts (Note 1).
L Affiliated company (Note 5). The rate quoted in the security description is the annualized 7-day yield of the fund at the close of the reporting period.
P This security was pledged, or purchased with cash that was pledged, to the fund for collateral on certain derivative contracts. The rate quoted in the security description is the annualized 7-day yield of the fund at the close of the reporting period.
R Real Estate Investment Trust. S Security on loan, in part or in entirety, at the close of the reporting period (Note 1). W The rate shown represents the weighted average coupon associated with the underlying mortgage pools. Rates may
be subject to a cap or floor.P1 The investment is an irrevocable commitment made in a private investment transaction to purchase shares of a special
purpose acquisition corporation upon consummation of a merger or other identified acquisition transaction in the aggregate amount of $1,206,000, the deferred settlement of which is included as a payable as a purchase of delayed delivery securities.
P2 Represents an investment in the shares of a special purpose acquisition corporation that are subject to certain restrictions on transfer and awaiting finalization of a resale registration statement that the company has filed with the SEC.At the close of the reporting period, the fund maintained liquid assets totaling $20,323,988 to cover certain derivative contracts, delayed delivery securities and the settlement of certain securities.Unless otherwise noted, the rates quoted in Short-term investments security descriptions represent the weighted average yield to maturity.Debt obligations are considered secured unless otherwise indicated.144A after the name of an issuer represents securities exempt from registration under Rule 144A of the Securities Act of 1933, as amended. These securities may be resold in transactions exempt from registration, normally to qualified institutional buyers.See Note 1 to the financial statements regarding TBA commitments.The dates shown on debt obligations are the original maturity dates.
FORWARD CURRENCY CONTRACTS at 7/31/21 (aggregate face value $110,238,043 )
Counterparty CurrencyContract
type*Delivery
date ValueAggregate face value
Unrealized appreciation/ (depreciation)
Bank of America N.A.British Pound Sell 9/15/21 $4,330,865 $4,458,948 $128,083
Swedish Krona Sell 9/15/21 1,484,694 1,547,601 62,907Barclays Bank PLC
British Pound Sell 9/15/21 12,223,149 12,439,944 216,795Canadian Dollar Sell 10/20/21 2,768,638 2,757,627 (11,011 )
Euro Sell 9/15/21 6,568,103 6,755,205 187,102Swedish Krona Sell 9/15/21 7,841,238 8,171,172 329,934
Citibank, N.A.British Pound Buy 9/15/21 4,958,656 5,045,661 (87,005 )
Canadian Dollar Sell 10/20/21 6,173,510 6,149,783 (23,727 )Danish Krone Buy 9/15/21 3,211,157 3,229,910 (18,753 )Danish Krone Sell 9/15/21 3,205,763 3,292,287 86,524
Euro Sell 9/15/21 3,311,358 3,406,235 94,877Goldman Sachs International
British Pound Sell 9/15/21 9,115,335 9,276,716 161,381Canadian Dollar Sell 10/20/21 3,285,127 3,271,940 (13,187 )
George Putnam Balanced Fund 43

44 George Putnam Balanced Fund
FORWARD CURRENCY CONTRACTS at 7/31/21 (aggregate face value $110,238,043 ) cont.
Counterparty CurrencyContract
type*Delivery
date ValueAggregate face value
Unrealized appreciation/ (depreciation)
HSBC Bank USA, National AssociationBritish Pound Buy 9/15/21 $2,829,228 $2,879,116 $(49,888 )
Euro Sell 9/15/21 2,439,086 2,508,763 69,677JPMorgan Chase Bank N.A.
British Pound Buy 9/15/21 5,284,089 5,377,534 (93,445 )Canadian Dollar Sell 10/20/21 1,272,549 1,267,443 (5,106 )
State Street Bank and Trust Co.British Pound Buy 9/15/21 854,385 869,519 (15,134 )
Canadian Dollar Buy 10/20/21 78,227 77,912 315Hong Kong Dollar Sell 8/18/21 2,478,510 2,480,056 1,546
UBS AGBritish Pound Buy 9/15/21 4,534,661 4,614,859 (80,198 )
Canadian Dollar Sell 10/20/21 3,664,560 3,649,869 (14,691 )Euro Buy 9/15/21 863,249 887,760 (24,511 )
Swedish Krona Sell 9/15/21 1,484,705 1,547,726 63,021WestPac Banking Corp.
British Pound Sell 9/15/21 11,307,736 11,507,656 199,920Canadian Dollar Buy 10/20/21 1,886,181 1,878,741 7,440
Euro Buy 9/15/21 863,368 888,060 (24,692 )Unrealized appreciation 1,609,522Unrealized (depreciation) (461,348 )Total $1,148,174
* The exchange currency for all contracts listed is the United States Dollar.
FUTURES CONTRACTS OUTSTANDING at 7/31/21
Number of contracts
Notional amount Value
Expiration date
Unrealized appreciation/ (depreciation)
S&P 500 Index E-Mini (Long) 144 31,645,872 31,604,400 Sep-21 674,668Unrealized appreciation 674,668Unrealized (depreciation) —Total $674,668
TBA SALE COMMITMENTS OUTSTANDING at 7/31/21 (proceeds receivable $10,536,074 )
AgencyPrincipal
amountSettlement date Value
Government National Mortgage Association, 4.00%, 8/1/51 5,000,000 8/19/2021 5,285,335Uniform Mortgage-Backed Securities, 4.00%, 8/1/51 1,000,000 8/12/2021 1,068,320Uniform Mortgage-Backed Securities, 3.50%, 8/1/51 2,000,000 8/12/2021 2,119,454Uniform Mortgage-Backed Securities, 3.00%, 8/1/51 1,000,000 8/12/2021 1,048,203Uniform Mortgage-Backed Securities, 2.50%, 8/1/51 1,000,000 8/12/2021 1,041,758Total $10,563,070

George Putnam Balanced Fund 45
The accompanying notes are an integral part of these financial statements.
ASC 820 establishes a three-level hierarchy for disclosure of fair value measurements. The valuation hierarchy is based upon the transparency of inputs to the valuation of the fund’s investments. The three levels are defined as follows:
Level 1: Valuations based on quoted prices for identical securities in active markets.Level 2: Valuations based on quoted prices in markets that are not active or for which all significant inputs are observable, either directly or indirectly.Level 3: Valuations based on inputs that are unobservable and significant to the fair value measurement.
The following is a summary of the inputs used to value the fund’s net assets as of the close of the reporting period:
Valuation inputsInvestments in securities: Level 1 Level 2 Level 3Common stocks*:
Basic materials $26,499,974 $— $—
Capital goods 77,882,538 — —
Communication services 1,541,734 — —
Conglomerates 3,094,467 — —
Consumer cyclicals 240,208,675 — 5,686,982
Consumer staples 70,960,129 — —
Energy 31,288,173 — —
Financials 149,714,515 3,591,412 —
Health care 158,500,650 — —
Miscellaneous — — 1,071,290
Technology 354,856,793 — —
Transportation 22,518,508 — —
Utilities and power 37,407,337 — — Total common stocks 1,174,473,493 3,591,412 6,758,272
Corporate bonds and notes — 273,077,418 — Mortgage-backed securities — 17,351,427 — Municipal bonds and notes — 1,315,355 — U.S. government and agency mortgage obligations — 149,273,770 — U.S. treasury obligations — 252,972,098 — Short-term investments 300,000 87,990,173 — Totals by level $1,174,773,493 $785,571,653 $6,758,272
Valuation inputsOther financial instruments: Level 1 Level 2 Level 3
Forward currency contracts $— $1,148,174 $—
Futures contracts 674,668 — —
TBA sale commitments — (10,563,070 ) — Totals by level $674,668 $(9,414,896 ) $—
* Common stock classifications are presented at the sector level, which may differ from the fund’s portfolio presentation.
At the start and close of the reporting period, Level 3 investments in securities represented less than 1% of the fund’s net assets and were not considered a significant portion of the fund’s portfolio.

Statement of assets and liabilities 7/31/21
ASSETSInvestment in securities, at value, including $5,610,727 of securities on loan (Notes 1 and 8):
Unaffiliated issuers (identified cost $1,513,203,262) $1,879,113,245 Affiliated issuers (identified cost $87,990,173) (Notes 1 and 5) 87,990,173
Cash 505,001 Foreign currency (cost $306) (Note 1) 305 Dividends, interest and other receivables 5,744,722 Receivable for shares of the fund sold 1,903,311 Receivable for investments sold 3,326,963 Receivable for sales of TBA securities (Note 1) 8,428,160 Unrealized appreciation on forward currency contracts (Note 1) 1,609,522 Prepaid assets 74,428 Total assets 1,988,695,830
LIABILITIESPayable for investments purchased 7,581,432Payable for purchases of delayed delivery securities (Note 1) 1,206,000Payable for purchases of TBA securities (Note 1) 16,826,951 Payable for shares of the fund repurchased 1,957,784 Payable for compensation of Manager (Note 2) 834,815 Payable for custodian fees (Note 2) 30,561 Payable for investor servicing fees (Note 2) 392,108 Payable for Trustee compensation and expenses (Note 2) 539,301 Payable for administrative services (Note 2) 5,371 Payable for distribution fees (Note 2) 448,724 Payable for variation margin on futures contracts (Note 1) 160,607 Unrealized depreciation on forward currency contracts (Note 1) 461,348 TBA sale commitments, at value (proceeds receivable $10,536,074) (Note 1) 10,563,070 Collateral on securities loaned, at value (Note 1) 5,789,325 Collateral on certain derivative contracts and TBA commitments, at value (Notes 1 and 8) 1,090,233 Other accrued expenses 206,342 Total liabilities 48,093,972
Net assets $1,940,601,858
REPRESENTED BYPaid-in capital (Unlimited shares authorized) (Notes 1 and 4) $1,459,573,676Total distributable earnings (Note 1) 481,028,182Total — Representing net assets applicable to capital shares outstanding $1,940,601,858
(Continued on next page)
46 George Putnam Balanced Fund

The accompanying notes are an integral part of these financial statements.
Statement of assets and liabilities cont.
COMPUTATION OF NET ASSET VALUE AND OFFERING PRICENet asset value and redemption price per class A share ($1,383,459,224 divided by 56,189,245 shares) $24.62 Offering price per class A share (100/94.25 of $24.62)* $26.12 Net asset value and offering price per class B share ($11,732,080 divided by 483,355 shares)** $24.27 Net asset value and offering price per class C share ($128,299,967 divided by 5,268,773 shares)** $24.35 Net asset value and redemption price per class M share ($59,886,621 divided by 2,474,210 shares) $24.20 Offering price per class M share (100/96.50 of $24.20)* $25.08 Net asset value, offering price and redemption price per class R share ($2,000,984 divided by 81,638 shares) $24.51 Net asset value, offering price and redemption price per class R5 share ($21,495 divided by 862 shares) $24.94 Net asset value, offering price and redemption price per class R6 share ($69,238,989 divided by 2,797,780 shares) $24.75 Net asset value, offering price and redemption price per class Y share ($285,962,498 divided by 11,559,442 shares) $24.74
*On single retail sales of less than $50,000. On sales of $50,000 or more the offering price is reduced.**Redemption price per share is equal to net asset value less any applicable contingent deferred sales charge.
George Putnam Balanced Fund 47

The accompanying notes are an integral part of these financial statements.
Statement of operations Year ended 7/31/21
INVESTMENT INCOMEDividends (net of foreign tax of $163,383) $14,404,159 Interest (including interest income of $124,116 from investments in affiliated issuers) (Note 5) 13,701,452 Securities lending (net of expenses) (Notes 1 and 5) 5,406 Total investment income 28,111,017
EXPENSESCompensation of Manager (Note 2) 8,900,545 Investor servicing fees (Note 2) 2,251,401 Custodian fees (Note 2) 66,635 Trustee compensation and expenses (Note 2) 74,604 Distribution fees (Note 2) 4,788,573 Administrative services (Note 2) 44,697 Other 553,730 Total expenses 16,680,185
Expense reduction (Note 2) (2,078)Net expenses 16,678,107
Net investment income 11,432,910
REALIZED AND UNREALIZED GAIN (LOSS)Net realized gain (loss) on:
Securities from unaffiliated issuers (Notes 1 and 3) 134,611,440 Foreign currency transactions (Note 1) 9,624 Forward currency contracts (Note 1) (3,466,748)Futures contracts (Note 1) 5,666,274 Written options (Note 1) 23,016
Total net realized gain 136,843,606 Change in net unrealized appreciation (depreciation) on:
Securities from unaffiliated issuers and TBA sale commitments 176,274,416 Assets and liabilities in foreign currencies 242 Forward currency contracts 2,516,109 Futures contracts 450,167
Total change in net unrealized appreciation 179,240,934
Net gain on investments 316,084,540
Net increase in net assets resulting from operations $327,517,450
48 George Putnam Balanced Fund
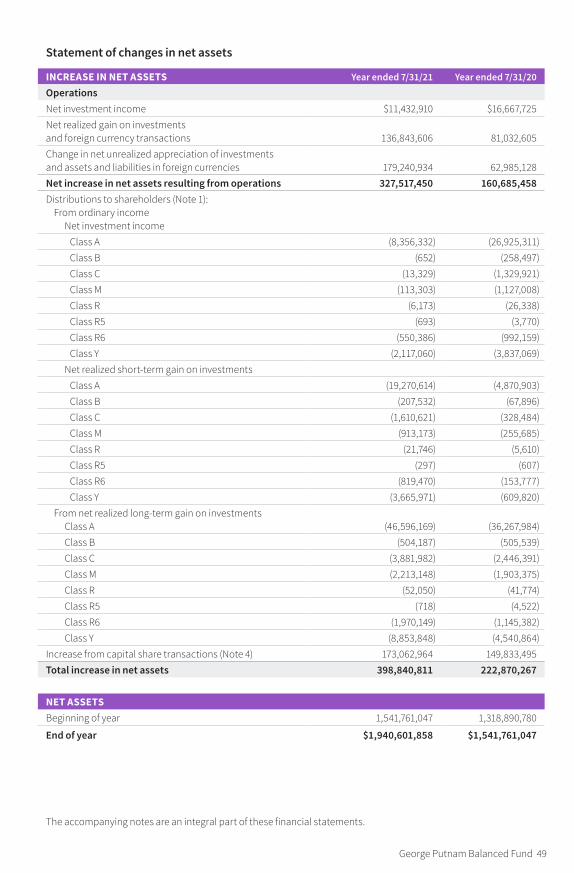
The accompanying notes are an integral part of these financial statements.
Statement of changes in net assets
INCREASE IN NET ASSETS Year ended 7/31/21 Year ended 7/31/20OperationsNet investment income $11,432,910 $16,667,725 Net realized gain on investments and foreign currency transactions 136,843,606 81,032,605 Change in net unrealized appreciation of investments and assets and liabilities in foreign currencies 179,240,934 62,985,128 Net increase in net assets resulting from operations 327,517,450 160,685,458 Distributions to shareholders (Note 1):
From ordinary incomeNet investment income
Class A (8,356,332) (26,925,311)Class B (652) (258,497)Class C (13,329) (1,329,921)Class M (113,303) (1,127,008)Class R (6,173) (26,338)Class R5 (693) (3,770)Class R6 (550,386) (992,159)Class Y (2,117,060) (3,837,069)
Net realized short-term gain on investmentsClass A (19,270,614) (4,870,903)Class B (207,532) (67,896)Class C (1,610,621) (328,484)Class M (913,173) (255,685)Class R (21,746) (5,610)Class R5 (297) (607)Class R6 (819,470) (153,777)Class Y (3,665,971) (609,820)
From net realized long-term gain on investmentsClass A (46,596,169) (36,267,984)Class B (504,187) (505,539)Class C (3,881,982) (2,446,391)Class M (2,213,148) (1,903,375)Class R (52,050) (41,774)Class R5 (718) (4,522)Class R6 (1,970,149) (1,145,382)Class Y (8,853,848) (4,540,864)
Increase from capital share transactions (Note 4) 173,062,964 149,833,495 Total increase in net assets 398,840,811 222,870,267
NET ASSETSBeginning of year 1,541,761,047 1,318,890,780
End of year $1,940,601,858 $1,541,761,047
George Putnam Balanced Fund 49

Fund _FundCode, — NumbCols Columns — This section modified: 8/20/21 2:01:47 PM Fund _FundCode, — NumbCols Columns — This section modified: 8/20/21 2:01:47 PM
50 George Putnam Balanced Fund
The accompanying notes are an integral part of these financial statements.
See notes to financial highlights at the end of this section.
Financial highlights (For a common share outstanding throughout the period)
INVESTMENT OPERATIONS LESS DISTRIBUTIONS RATIOS AND SUPPLEMENTAL DATA
Period ended
Net asset value,
beginning of period
Net investment income (loss ) a
Net realized and unrealized
gain (loss) on investments
Total from investment operations
From net investment
income
From net realized gain
on investments Total
dis tri bu tions
Net asset value, end of period
Total return at net asset value (% ) b
Net assets, end of period
(in thousands )
Ratio of expenses to average
net assets (% ) c
Ratio of net investment
income (loss) to average
net assets (% )
Portfolio turnover
(% ) d
Class A July 31, 2021 $21.68 .16 4.19 4.35 (.16 ) (1.25 ) (1.41 ) $24.62 20.84 $1,383,459 .94 .68 93 July 31, 2020 20.63 .25 2.13 2.38 (.52 ) (.81 ) (1.33 ) 21.68 12.04 1,147,249 .97 1.23 97 July 31, 2019 20.62 .28 1.37 1.65 (.28 ) (1.36 ) (1.64 ) 20.63 8.86 1,041,441 .98 1.44 143 July 31, 2018 19.09 .23 1.53 1.76 (.23 ) — (.23 ) 20.62 9.28 1,004,781 .99 1.18 179 July 31, 2017 17.38 .23 1.69 1.92 (.21 ) — (.21 ) 19.09 11.14 972,570 1.01 1.29 204 Class BJuly 31, 2021 $21.41 (.01 ) 4.12 4.11 — f (1.25 ) (1.25 ) $24.27 19.89 $11,732 1.69 (.06 ) 93 July 31, 2020 20.38 .10 2.11 2.21 (.37 ) (.81 ) (1.18 ) 21.41 11.23 13,533 1.72 .49 97 July 31, 2019 20.39 .14 1.34 1.48 (.13 ) (1.36 ) (1.49 ) 20.38 8.02 14,844 1.73 .70 143 July 31, 2018 18.87 .08 1.52 1.60 (.08 ) — (.08 ) 20.39 8.49 17,258 1.74 .43 179 July 31, 2017 17.18 .10 1.67 1.77 (.08 ) — (.08 ) 18.87 10.33 20,188 1.76 .55 204 Class CJuly 31, 2021 $21.48 (.02 ) 4.15 4.13 (.01 ) (1.25 ) (1.26 ) $24.35 19.90 $128,300 1.69 (.07 ) 93 July 31, 2020 20.46 .09 2.12 2.21 (.38 ) (.81 ) (1.19 ) 21.48 11.20 86,199 1.72 .47 97 July 31, 2019 20.47 .13 1.36 1.49 (.14 ) (1.36 ) (1.50 ) 20.46 8.06 61,417 1.73 .68 143 July 31, 2018 18.95 .08 1.52 1.60 (.08 ) — (.08 ) 20.47 8.45 40,002 1.74 .43 179 July 31, 2017 17.26 .10 1.67 1.77 (.08 ) — (.08 ) 18.95 10.29 45,970 1.76 .54 204 Class MJuly 31, 2021 $21.34 .04 4.12 4.16 (.05 ) (1.25 ) (1.30 ) $24.20 20.20 $59,887 1.44 .19 93 July 31, 2020 20.32 .15 2.09 2.24 (.41 ) (.81 ) (1.22 ) 21.34 11.46 54,871 1.47 .75 97 July 31, 2019 20.33 .18 1.35 1.53 (.18 ) (1.36 ) (1.54 ) 20.32 8.34 65,488 1.48 .94 143 July 31, 2018 18.82 .13 1.52 1.65 (.14 ) — (.14 ) 20.33 8.77 70,239 1.49 .68 179 July 31, 2017 17.15 .14 1.66 1.80 (.13 ) — (.13 ) 18.82 10.53 70,919 1.51 .79 204 Class RJuly 31, 2021 $21.60 .10 4.16 4.26 (.10 ) (1.25 ) (1.35 ) $24.51 20.50 $2,001 1.19 .43 93 July 31, 2020 20.56 .20 2.12 2.32 (.47 ) (.81 ) (1.28 ) 21.60 11.76 1,113 1.22 .98 97 July 31, 2019 20.56 .23 1.36 1.59 (.23 ) (1.36 ) (1.59 ) 20.56 8.58 999 1.23 1.19 143 July 31, 2018 19.03 .18 1.53 1.71 (.18 ) — (.18 ) 20.56 9.02 838 1.24 .93 179 July 31, 2017 17.33 .18 1.70 1.88 (.18 ) — (.18 ) 19.03 10.90 1,090 1.26 .99 204 Class R5July 31, 2021 $21.89 .21 4.24 4.45 (.15 ) (1.25 ) (1.40 ) $24.94 21.11 $21 .71 .92 93 July 31, 2020 20.82 .29 2.17 2.46 (.58 ) (.81 ) (1.39 ) 21.89 12.33 223 .72 1.41 97 July 31, 2019 20.79 .32 1.40 1.72 (.33 ) (1.36 ) (1.69 ) 20.82 9.17 16 .72 1.56 143 July 31, 2018 19.24 .27 e 1.56 1.83 (.28 ) — (.28 ) 20.79 9.60 14 .73 1.30 e 179 July 31, 2017 17.45 .30 e 1.69 1.99 (.20 ) — (.20 ) 19.24 11.46 13 .74 1.71 e 204

Fund _FundCode, — NumbCols Columns — This section modified: 8/20/21 2:01:47 PM Fund _FundCode, — NumbCols Columns — This section modified: 8/20/21 2:01:47 PM
George Putnam Balanced Fund 51
Financial highlights (For a common share outstanding throughout the period)
INVESTMENT OPERATIONS LESS DISTRIBUTIONS RATIOS AND SUPPLEMENTAL DATA
Period ended
Net asset value,
beginning of period
Net investment income (loss ) a
Net realized and unrealized
gain (loss) on investments
Total from investment operations
From net investment
income
From net realized gain
on investments Total
dis tri bu tions
Net asset value, end of period
Total return at net asset value (% ) b
Net assets, end of period
(in thousands )
Ratio of expenses to average
net assets (% ) c
Ratio of net investment
income (loss) to average
net assets (% )
Portfolio turnover
(% ) d
Class A July 31, 2021 $21.68 .16 4.19 4.35 (.16 ) (1.25 ) (1.41 ) $24.62 20.84 $1,383,459 .94 .68 93 July 31, 2020 20.63 .25 2.13 2.38 (.52 ) (.81 ) (1.33 ) 21.68 12.04 1,147,249 .97 1.23 97 July 31, 2019 20.62 .28 1.37 1.65 (.28 ) (1.36 ) (1.64 ) 20.63 8.86 1,041,441 .98 1.44 143 July 31, 2018 19.09 .23 1.53 1.76 (.23 ) — (.23 ) 20.62 9.28 1,004,781 .99 1.18 179 July 31, 2017 17.38 .23 1.69 1.92 (.21 ) — (.21 ) 19.09 11.14 972,570 1.01 1.29 204 Class BJuly 31, 2021 $21.41 (.01 ) 4.12 4.11 — f (1.25 ) (1.25 ) $24.27 19.89 $11,732 1.69 (.06 ) 93 July 31, 2020 20.38 .10 2.11 2.21 (.37 ) (.81 ) (1.18 ) 21.41 11.23 13,533 1.72 .49 97 July 31, 2019 20.39 .14 1.34 1.48 (.13 ) (1.36 ) (1.49 ) 20.38 8.02 14,844 1.73 .70 143 July 31, 2018 18.87 .08 1.52 1.60 (.08 ) — (.08 ) 20.39 8.49 17,258 1.74 .43 179 July 31, 2017 17.18 .10 1.67 1.77 (.08 ) — (.08 ) 18.87 10.33 20,188 1.76 .55 204 Class CJuly 31, 2021 $21.48 (.02 ) 4.15 4.13 (.01 ) (1.25 ) (1.26 ) $24.35 19.90 $128,300 1.69 (.07 ) 93 July 31, 2020 20.46 .09 2.12 2.21 (.38 ) (.81 ) (1.19 ) 21.48 11.20 86,199 1.72 .47 97 July 31, 2019 20.47 .13 1.36 1.49 (.14 ) (1.36 ) (1.50 ) 20.46 8.06 61,417 1.73 .68 143 July 31, 2018 18.95 .08 1.52 1.60 (.08 ) — (.08 ) 20.47 8.45 40,002 1.74 .43 179 July 31, 2017 17.26 .10 1.67 1.77 (.08 ) — (.08 ) 18.95 10.29 45,970 1.76 .54 204 Class MJuly 31, 2021 $21.34 .04 4.12 4.16 (.05 ) (1.25 ) (1.30 ) $24.20 20.20 $59,887 1.44 .19 93 July 31, 2020 20.32 .15 2.09 2.24 (.41 ) (.81 ) (1.22 ) 21.34 11.46 54,871 1.47 .75 97 July 31, 2019 20.33 .18 1.35 1.53 (.18 ) (1.36 ) (1.54 ) 20.32 8.34 65,488 1.48 .94 143 July 31, 2018 18.82 .13 1.52 1.65 (.14 ) — (.14 ) 20.33 8.77 70,239 1.49 .68 179 July 31, 2017 17.15 .14 1.66 1.80 (.13 ) — (.13 ) 18.82 10.53 70,919 1.51 .79 204 Class RJuly 31, 2021 $21.60 .10 4.16 4.26 (.10 ) (1.25 ) (1.35 ) $24.51 20.50 $2,001 1.19 .43 93 July 31, 2020 20.56 .20 2.12 2.32 (.47 ) (.81 ) (1.28 ) 21.60 11.76 1,113 1.22 .98 97 July 31, 2019 20.56 .23 1.36 1.59 (.23 ) (1.36 ) (1.59 ) 20.56 8.58 999 1.23 1.19 143 July 31, 2018 19.03 .18 1.53 1.71 (.18 ) — (.18 ) 20.56 9.02 838 1.24 .93 179 July 31, 2017 17.33 .18 1.70 1.88 (.18 ) — (.18 ) 19.03 10.90 1,090 1.26 .99 204 Class R5July 31, 2021 $21.89 .21 4.24 4.45 (.15 ) (1.25 ) (1.40 ) $24.94 21.11 $21 .71 .92 93 July 31, 2020 20.82 .29 2.17 2.46 (.58 ) (.81 ) (1.39 ) 21.89 12.33 223 .72 1.41 97 July 31, 2019 20.79 .32 1.40 1.72 (.33 ) (1.36 ) (1.69 ) 20.82 9.17 16 .72 1.56 143 July 31, 2018 19.24 .27 e 1.56 1.83 (.28 ) — (.28 ) 20.79 9.60 14 .73 1.30 e 179 July 31, 2017 17.45 .30 e 1.69 1.99 (.20 ) — (.20 ) 19.24 11.46 13 .74 1.71 e 204

Fund _FundCode, — NumbCols Columns — This section modified: 8/20/21 2:01:47 PM Fund _FundCode, — NumbCols Columns — This section modified: 8/20/21 2:01:47 PM
52 George Putnam Balanced Fund
Financial highlights cont.
The accompanying notes are an integral part of these financial statements.
a Per share net investment income (loss) has been determined on the basis of the weighted average number of shares outstanding during the period.
b Total return assumes dividend reinvestment and does not reflect the effect of sales charges. c Includes amounts paid through expense offset and/or brokerage/service arrangements, if any (Note 2). Also excludes
acquired fund fees and expenses, if any. d Portfolio turnover includes TBA purchase and sales transactions. e The net investment income ratio and per share amount shown for the period ended may not correspond with the
expected class specific differences for the period due to the timing of redemptions out of the class. f Amount represents less than $0.01 per share.
INVESTMENT OPERATIONS LESS DISTRIBUTIONS RATIOS AND SUPPLEMENTAL DATA
Period ended
Net asset value,
beginning of period
Net investment income (loss ) a
Net realized and unrealized
gain (loss) on investments
Total from investment operations
From net investment
income
From net realized gain
on investments Total
dis tri bu tions
Net asset value, end of period
Total return at net asset value (% ) b
Net assets, end of period
(in thousands )
Ratio of expenses to average
net assets (% ) c
Ratio of net investment
income (loss) to average
net assets (% )
Portfolio turnover
(% ) d
Class R6July 31, 2021 $21.79 .23 4.21 4.44 (.23 ) (1.25 ) (1.48 ) $24.75 21.22 $69,239 .61 1.01 93 July 31, 2020 20.73 .32 2.15 2.47 (.60 ) (.81 ) (1.41 ) 21.79 12.42 46,529 .62 1.56 97 July 31, 2019 20.71 .36 1.37 1.73 (.35 ) (1.36 ) (1.71 ) 20.73 9.27 29,859 .62 1.80 143 July 31, 2018 19.17 .31 1.53 1.84 (.30 ) — (.30 ) 20.71 9.69 19,694 .63 1.54 179 July 31, 2017 17.45 .30 1.70 2.00 (.28 ) — (.28 ) 19.17 11.57 11,738 .64 1.64 204 Class YJuly 31, 2021 $21.78 .21 4.21 4.42 (.21 ) (1.25 ) (1.46 ) $24.74 21.13 $285,962 .69 .93 93 July 31, 2020 20.72 .30 2.15 2.45 (.58 ) (.81 ) (1.39 ) 21.78 12.32 192,044 .72 1.45 97 July 31, 2019 20.70 .33 1.38 1.71 (.33 ) (1.36 ) (1.69 ) 20.72 9.15 104,828 .73 1.68 143 July 31, 2018 19.16 .28 1.54 1.82 (.28 ) — (.28 ) 20.70 9.56 81,989 .74 1.43 179 July 31, 2017 17.45 .28 1.69 1.97 (.26 ) — (.26 ) 19.16 11.37 77,716 .76 1.54 204

Fund _FundCode, — NumbCols Columns — This section modified: 8/20/21 2:01:47 PM Fund _FundCode, — NumbCols Columns — This section modified: 8/20/21 2:01:47 PM
George Putnam Balanced Fund 53
INVESTMENT OPERATIONS LESS DISTRIBUTIONS RATIOS AND SUPPLEMENTAL DATA
Period ended
Net asset value,
beginning of period
Net investment income (loss ) a
Net realized and unrealized
gain (loss) on investments
Total from investment operations
From net investment
income
From net realized gain
on investments Total
dis tri bu tions
Net asset value, end of period
Total return at net asset value (% ) b
Net assets, end of period
(in thousands )
Ratio of expenses to average
net assets (% ) c
Ratio of net investment
income (loss) to average
net assets (% )
Portfolio turnover
(% ) d
Class R6July 31, 2021 $21.79 .23 4.21 4.44 (.23 ) (1.25 ) (1.48 ) $24.75 21.22 $69,239 .61 1.01 93 July 31, 2020 20.73 .32 2.15 2.47 (.60 ) (.81 ) (1.41 ) 21.79 12.42 46,529 .62 1.56 97 July 31, 2019 20.71 .36 1.37 1.73 (.35 ) (1.36 ) (1.71 ) 20.73 9.27 29,859 .62 1.80 143 July 31, 2018 19.17 .31 1.53 1.84 (.30 ) — (.30 ) 20.71 9.69 19,694 .63 1.54 179 July 31, 2017 17.45 .30 1.70 2.00 (.28 ) — (.28 ) 19.17 11.57 11,738 .64 1.64 204 Class YJuly 31, 2021 $21.78 .21 4.21 4.42 (.21 ) (1.25 ) (1.46 ) $24.74 21.13 $285,962 .69 .93 93 July 31, 2020 20.72 .30 2.15 2.45 (.58 ) (.81 ) (1.39 ) 21.78 12.32 192,044 .72 1.45 97 July 31, 2019 20.70 .33 1.38 1.71 (.33 ) (1.36 ) (1.69 ) 20.72 9.15 104,828 .73 1.68 143 July 31, 2018 19.16 .28 1.54 1.82 (.28 ) — (.28 ) 20.70 9.56 81,989 .74 1.43 179 July 31, 2017 17.45 .28 1.69 1.97 (.26 ) — (.26 ) 19.16 11.37 77,716 .76 1.54 204

54 George Putnam Balanced Fund
Notes to financial statements 7/31/21
Within the following Notes to financial statements, references to “State Street” represent State Street Bank and Trust Company, references to “the SEC” represent the Securities and Exchange Commission, references to “Putnam Management” represent Putnam Investment Management, LLC, the fund’s manager, an indirect wholly-owned subsidiary of Putnam Investments, LLC and references to “OTC”, if any, represent over-the-counter. Unless otherwise noted, the “reporting period” represents the period from August 1, 2020 through July 31, 2021.
George Putnam Balanced Fund (the fund) is a Massachusetts business trust, which is registered under the Invest-ment Company Act of 1940, as amended, as a diversified open-end management investment company. The goal of the fund is to seek to provide a balanced investment composed of a well-diversified portfolio of stocks and bonds which produce both capital growth and current income. The fund invests mainly in a combination of bonds and common stocks (growth or value stocks or both) of large U.S. companies, with a greater focus on common stocks. For example, Putnam Management may purchase stocks of companies with stock prices that reflect a value lower than that which Putnam Management places on the company. Putnam Management may also consider other factors that Putnam Management believes will cause the stock price to rise. The fund buys bonds of governments and private companies that are mostly investment-grade in quality with intermediate- to long-term maturities (three years or longer). Putnam Management may consider, among other factors, a compa-ny’s valuation, financial strength, growth potential, competitive position in its industry, projected future earnings, cash flows and dividends when deciding whether to buy or sell equity investments, and, among other factors, credit, interest rate and prepayment risks, as well as general market conditions, when deciding whether to buy or sell fixed-income investments. The fund may also use derivatives, such as futures, options, warrants and swap contracts, for both hedging and non-hedging purposes.
The fund offers class A, class B, class C, class M, class R, class R5, class R6 and class Y shares. Purchases of class B shares are closed to new and existing investors except by exchange from class B shares of another Putnam fund or through dividend and/or capital gains reinvestment. Class A and class M shares are sold with a maximum front-end sales charge of 5.75% and 3.50%, respectively. Class A shares generally are not subject to a contingent deferred sales charge, and class M, class R, class R5, class R6 and class Y shares are not subject to a contingent deferred sales charge. Class B shares, which convert to class A shares after approximately eight years, are not subject to a front-end sales charge and are subject to a contingent deferred sales charge if those shares are redeemed within six years of purchase. Class C shares are subject to a one-year 1.00% contingent deferred sales charge and generally convert to class A shares after approximately eight years. Prior to March 1, 2021, class C shares generally converted to class A shares after approximately ten years. Class M shares of the fund are closed to new purchases except (1) through employer-sponsored retirement plans (for these purposes, employer-sponsored retirement plans do not include SEP IRAs, SIMPLE IRAs or SARSEPs) to the extent class A shares are not available through the plan (Eligible Plans) that had open positions in the fund’s Class M shares with Putnam Investor Services on November 25, 2019 (the Effective Date), or (2) by clients of administrators or other service providers of Eligible Plans that had open positions on behalf of their clients in the fund’s Class M shares with Putnam Investor Services on the Effective Date, and in either case maintained the open position through the Effective Date. Class R shares, which are not available to all investors, are sold at net asset value. The expenses for class A, class B, class C, class M and class R shares may differ based on the distribution fee of each class, which is identified in Note 2. Class R5, class R6 and class Y shares, which are sold at net asset value, are generally subject to the same expenses as class A, class B, class C, class M and class R shares, but do not bear a distribution fee, and in the case of class R5 and class R6 shares, bear a lower investor servicing fee, which is identified in Note 2. Class R5, class R6 and class Y shares are not available to all investors.
In the normal course of business, the fund enters into contracts that may include agreements to indemnify another party under given circumstances. The fund’s maximum exposure under these arrangements is unknown as this would involve future claims that may be, but have not yet been, made against the fund. However, the fund’s management team expects the risk of material loss to be remote.
The fund has entered into contractual arrangements with an investment adviser, administrator, distributor, share-holder servicing agent and custodian, who each provide services to the fund. Unless expressly stated otherwise, shareholders are not parties to, or intended beneficiaries of these contractual arrangements, and these contrac-tual arrangements are not intended to create any shareholder right to enforce them against the service providers or to seek any remedy under them against the service providers, either directly or on behalf of the fund.
Under the fund’s Amended and Restated Agreement and Declaration of Trust, any claims asserted against or on behalf of the Putnam Funds, including claims against Trustees and Officers, must be brought in state and federal courts located within the Commonwealth of Massachusetts.
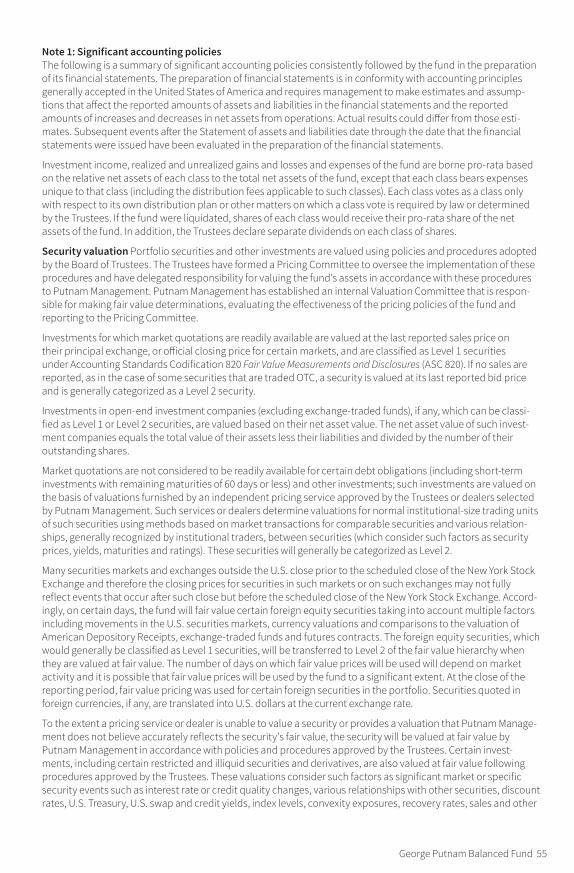
George Putnam Balanced Fund 55
Note 1: Significant accounting policiesThe following is a summary of significant accounting policies consistently followed by the fund in the preparation of its financial statements. The preparation of financial statements is in conformity with accounting principles generally accepted in the United States of America and requires management to make estimates and assump-tions that affect the reported amounts of assets and liabilities in the financial statements and the reported amounts of increases and decreases in net assets from operations. Actual results could differ from those esti-mates. Subsequent events after the Statement of assets and liabilities date through the date that the financial statements were issued have been evaluated in the preparation of the financial statements.
Investment income, realized and unrealized gains and losses and expenses of the fund are borne pro-rata based on the relative net assets of each class to the total net assets of the fund, except that each class bears expenses unique to that class (including the distribution fees applicable to such classes). Each class votes as a class only with respect to its own distribution plan or other matters on which a class vote is required by law or determined by the Trustees. If the fund were liquidated, shares of each class would receive their pro-rata share of the net assets of the fund. In addition, the Trustees declare separate dividends on each class of shares.
Security valuation Portfolio securities and other investments are valued using policies and procedures adopted by the Board of Trustees. The Trustees have formed a Pricing Committee to oversee the implementation of these procedures and have delegated responsibility for valuing the fund’s assets in accordance with these procedures to Putnam Management. Putnam Management has established an internal Valuation Committee that is respon-sible for making fair value determinations, evaluating the effectiveness of the pricing policies of the fund and reporting to the Pricing Committee.
Investments for which market quotations are readily available are valued at the last reported sales price on their principal exchange, or official closing price for certain markets, and are classified as Level 1 securities under Accounting Standards Codification 820 Fair Value Measurements and Disclosures (ASC 820). If no sales are reported, as in the case of some securities that are traded OTC, a security is valued at its last reported bid price and is generally categorized as a Level 2 security.
Investments in open-end investment companies (excluding exchange-traded funds), if any, which can be classi-fied as Level 1 or Level 2 securities, are valued based on their net asset value. The net asset value of such invest-ment companies equals the total value of their assets less their liabilities and divided by the number of their outstanding shares.
Market quotations are not considered to be readily available for certain debt obligations (including short-term investments with remaining maturities of 60 days or less) and other investments; such investments are valued on the basis of valuations furnished by an independent pricing service approved by the Trustees or dealers selected by Putnam Management. Such services or dealers determine valuations for normal institutional-size trading units of such securities using methods based on market transactions for comparable securities and various relation-ships, generally recognized by institutional traders, between securities (which consider such factors as security prices, yields, maturities and ratings). These securities will generally be categorized as Level 2.
Many securities markets and exchanges outside the U.S. close prior to the scheduled close of the New York Stock Exchange and therefore the closing prices for securities in such markets or on such exchanges may not fully reflect events that occur after such close but before the scheduled close of the New York Stock Exchange. Accord-ingly, on certain days, the fund will fair value certain foreign equity securities taking into account multiple factors including movements in the U.S. securities markets, currency valuations and comparisons to the valuation of American Depository Receipts, exchange-traded funds and futures contracts. The foreign equity securities, which would generally be classified as Level 1 securities, will be transferred to Level 2 of the fair value hierarchy when they are valued at fair value. The number of days on which fair value prices will be used will depend on market activity and it is possible that fair value prices will be used by the fund to a significant extent. At the close of the reporting period, fair value pricing was used for certain foreign securities in the portfolio. Securities quoted in foreign currencies, if any, are translated into U.S. dollars at the current exchange rate.
To the extent a pricing service or dealer is unable to value a security or provides a valuation that Putnam Manage-ment does not believe accurately reflects the security’s fair value, the security will be valued at fair value by Putnam Management in accordance with policies and procedures approved by the Trustees. Certain invest-ments, including certain restricted and illiquid securities and derivatives, are also valued at fair value following procedures approved by the Trustees. These valuations consider such factors as significant market or specific security events such as interest rate or credit quality changes, various relationships with other securities, discount rates, U.S. Treasury, U.S. swap and credit yields, index levels, convexity exposures, recovery rates, sales and other

56 George Putnam Balanced Fund
multiples and resale restrictions. These securities are classified as Level 2 or as Level 3 depending on the priority of the significant inputs.
To assess the continuing appropriateness of fair valuations, the Valuation Committee reviews and affirms the reasonableness of such valuations on a regular basis after considering all relevant information that is reasonably available. Such valuations and procedures are reviewed periodically by the Trustees. Certain securities may be valued on the basis of a price provided by a single source. The fair value of securities is generally determined as the amount that the fund could reasonably expect to realize from an orderly disposition of such securities over a reasonable period of time. By its nature, a fair value price is a good faith estimate of the value of a security in a current sale and does not reflect an actual market price, which may be different by a material amount.
Security transactions and related investment income Security transactions are recorded on the trade date (the date the order to buy or sell is executed). Gains or losses on securities sold are determined on the identified cost basis.
Interest income, net of any applicable withholding taxes, if any, and including amortization and accretion of premiums and discounts on debt securities, is recorded on the accrual basis. Dividend income, net of any appli-cable withholding taxes, is recognized on the ex-dividend date except that certain dividends from foreign securi-ties, if any, are recognized as soon as the fund is informed of the ex-dividend date. Non-cash dividends, if any, are recorded at the fair value of the securities received. Dividends representing a return of capital or capital gains, if any, are reflected as a reduction of cost and/or as a realized gain.
Securities purchased or sold on a delayed delivery basis may be settled at a future date beyond customary settle-ment time; interest income is accrued based on the terms of the securities. Losses may arise due to changes in the fair value of the underlying securities or if the counterparty does not perform under the contract.
Stripped securities The fund may invest in stripped securities which represent a participation in securities that may be structured in classes with rights to receive different portions of the interest and principal. Interest-only securities receive all of the interest and principal-only securities receive all of the principal. If the interest-only securities experience greater than anticipated prepayments of principal, the fund may fail to recoup fully its initial investment in these securities. Conversely, principal-only securities increase in value if prepayments are greater than anticipated and decline if prepayments are slower than anticipated. The fair value of these securities is highly sensitive to changes in interest rates.
Foreign currency translation The accounting records of the fund are maintained in U.S. dollars. The fair value of foreign securities, currency holdings, and other assets and liabilities is recorded in the books and records of the fund after translation to U.S. dollars based on the exchange rates on that day. The cost of each security is deter-mined using historical exchange rates. Income and withholding taxes are translated at prevailing exchange rates when earned or incurred. The fund does not isolate that portion of realized or unrealized gains or losses resulting from changes in the foreign exchange rate on investments from fluctuations arising from changes in the market prices of the securities. Such gains and losses are included with the net realized and unrealized gain or loss on investments. Net realized gains and losses on foreign currency transactions represent net realized exchange gains or losses on disposition of foreign currencies, currency gains and losses realized between the trade and settlement dates on securities transactions and the difference between the amount of investment income and foreign withholding taxes recorded on the fund’s books and the U.S. dollar equivalent amounts actually received or paid. Net unrealized appreciation and depreciation of assets and liabilities in foreign currencies arise from changes in the value of assets and liabilities other than investments at the period end, resulting from changes in the exchange rate.
Options contracts The fund uses options contracts to hedge against changes in values of securities it owns, owned or expects to own.
The potential risk to the fund is that the change in value of options contracts may not correspond to the change in value of the hedged instruments. In addition, losses may arise from changes in the value of the underlying instru-ments if there is an illiquid secondary market for the contracts, if interest or exchange rates move unexpectedly or if the counterparty to the contract is unable to perform. Realized gains and losses on purchased options are included in realized gains and losses on investment securities. If a written call option is exercised, the premium originally received is recorded as an addition to sales proceeds. If a written put option is exercised, the premium originally received is recorded as a reduction to the cost of investments.
Exchange-traded options are valued at the last sale price or, if no sales are reported, the last bid price for purchased options and the last ask price for written options. OTC traded options are valued using prices supplied by dealers.

George Putnam Balanced Fund 57
Options on swaps are similar to options on securities except that the premium paid or received is to buy or grant the right to enter into a previously agreed upon interest rate or credit default contract. Forward premium swap option contracts include premiums that have extended settlement dates. The delayed settlement of the premiums is factored into the daily valuation of the option contracts. In the case of interest rate cap and floor contracts, in return for a premium, ongoing payments between two parties are based on interest rates exceeding a specified rate, in the case of a cap contract, or falling below a specified rate in the case of a floor contract.
Written option contracts outstanding at period end, if any, are listed after the fund’s portfolio.
Futures contracts The fund uses futures contracts to equitize cash.
The potential risk to the fund is that the change in value of futures contracts may not correspond to the change in value of the hedged instruments. In addition, losses may arise from changes in the value of the underlying instru-ments, if there is an illiquid secondary market for the contracts, if interest or exchange rates move unexpectedly or if the counterparty to the contract is unable to perform. With futures, there is minimal counterparty credit risk to the fund since futures are exchange traded and the exchange’s clearinghouse, as counterparty to all exchange traded futures, guarantees the futures against default. Risks may exceed amounts recognized on the State-ment of assets and liabilities. When the contract is closed, the fund records a realized gain or loss equal to the difference between the value of the contract at the time it was opened and the value at the time it was closed.
Futures contracts are valued at the quoted daily settlement prices established by the exchange on which they trade. The fund and the broker agree to exchange an amount of cash equal to the daily fluctuation in the value of the futures contract. Such receipts or payments are known as “variation margin.”
Futures contracts outstanding at period end, if any, are listed after the fund’s portfolio.
Forward currency contracts The fund buys and sells forward currency contracts, which are agreements between two parties to buy and sell currencies at a set price on a future date. These contracts are used to hedge foreign exchange risk.
The U.S. dollar value of forward currency contracts is determined using current forward currency exchange rates supplied by a quotation service. The fair value of the contract will fluctuate with changes in currency exchange rates. The contract is marked to market daily and the change in fair value is recorded as an unrealized gain or loss. The fund records a realized gain or loss equal to the difference between the value of the contract at the time it was opened and the value at the time it was closed when the contract matures or by delivery of the currency. The fund could be exposed to risk if the value of the currency changes unfavorably, if the counterparties to the contracts are unable to meet the terms of their contracts or if the fund is unable to enter into a closing position. Risks may exceed amounts recognized on the Statement of assets and liabilities.
Forward currency contracts outstanding at period end, if any, are listed after the fund’s portfolio.
TBA commitments The fund may enter into TBA (to be announced) commitments to purchase securities for a fixed unit price at a future date beyond customary settlement time. Although the unit price and par amount have been established, the actual securities have not been specified. However, it is anticipated that the amount of the commitments will not significantly differ from the principal amount. The fund holds, and maintains until settle-ment date, cash or high-grade debt obligations in an amount sufficient to meet the purchase price, or the fund may enter into offsetting contracts for the forward sale of other securities it owns. Income on the securities will not be earned until settlement date.
The fund may also enter into TBA sale commitments to hedge its portfolio positions, to sell mortgage-backed securities it owns under delayed delivery arrangements or to take a short position in mortgage-backed securi-ties. Proceeds of TBA sale commitments are not received until the contractual settlement date. During the time a TBA sale commitment is outstanding, either equivalent deliverable securities or an offsetting TBA purchase commitment deliverable on or before the sale commitment date are held as “cover” for the transaction, or other liquid assets in an amount equal to the notional value of the TBA sale commitment are segregated. If the TBA sale commitment is closed through the acquisition of an offsetting TBA purchase commitment, the fund realizes a gain or loss. If the fund delivers securities under the commitment, the fund realizes a gain or a loss from the sale of the securities based upon the unit price established at the date the commitment was entered into.
TBA commitments, which are accounted for as purchase and sale transactions, may be considered securities themselves, and involve a risk of loss due to changes in the value of the security prior to the settlement date as well as the risk that the counterparty to the transaction will not perform its obligations. Counterparty risk is mitigated by having a master agreement between the fund and the counterparty.

58 George Putnam Balanced Fund
Unsettled TBA commitments are valued at their fair value according to the procedures described under “Security valuation” above. The contract is marked to market daily and the change in fair value is recorded by the fund as an unrealized gain or loss. Based on market circumstances, Putnam Management will determine whether to take delivery of the underlying securities or to dispose of the TBA commitments prior to settlement.
TBA purchase commitments outstanding at period end, if any, are listed within the fund’s portfolio and TBA sale commitments outstanding at period end, if any, are listed after the fund’s portfolio.
Master agreements The fund is a party to ISDA (International Swaps and Derivatives Association, Inc.) Master Agreements that govern OTC derivative and foreign exchange contracts and Master Securities Forward Transac-tion Agreements that govern transactions involving mortgage-backed and other asset-backed securities that may result in delayed delivery (Master Agreements) with certain counterparties entered into from time to time. The Master Agreements may contain provisions regarding, among other things, the parties’ general obligations, repre-sentations, agreements, collateral requirements, events of default and early termination. With respect to certain counterparties, in accordance with the terms of the Master Agreements, collateral pledged to the fund is held in a segregated account by the fund’s custodian and, with respect to those amounts which can be sold or repledged, are presented in the fund’s portfolio.
Collateral pledged by the fund is segregated by the fund’s custodian and identified in the fund’s portfolio. Collat-eral can be in the form of cash or debt securities issued by the U.S. Government or related agencies or other secu-rities as agreed to by the fund and the applicable counterparty. Collateral requirements are determined based on the fund’s net position with each counterparty.
With respect to ISDA Master Agreements, termination events applicable to the fund may occur upon a decline in the fund’s net assets below a specified threshold over a certain period of time. Termination events applicable to counterparties may occur upon a decline in the counterparty’s long-term or short-term credit ratings below a specified level. In each case, upon occurrence, the other party may elect to terminate early and cause settle-ment of all derivative and foreign exchange contracts outstanding, including the payment of any losses and costs resulting from such early termination, as reasonably determined by the terminating party. Any decision by one or more of the fund’s counterparties to elect early termination could impact the fund’s future derivative activity.
At the close of the reporting period, the fund had a net liability position of $168,203 on open derivative contracts subject to the Master Agreements. Collateral pledged by the fund at period end for these agreements totaled $306,103 and may include amounts related to unsettled agreements.
Securities lending The fund may lend securities, through its agent, to qualified borrowers in order to earn addi-tional income. The loans are collateralized by cash in an amount at least equal to the fair value of the securities loaned. The fair value of securities loaned is determined daily and any additional required collateral is allocated to the fund on the next business day. The remaining maturities of the securities lending transactions are consid-ered overnight and continuous. The risk of borrower default will be borne by the fund’s agent; the fund will bear the risk of loss with respect to the investment of the cash collateral. Income from securities lending, net of expenses, is included in investment income on the Statement of operations. Cash collateral is invested in Putnam Cash Collateral Pool, LLC, a limited liability company managed by an affiliate of Putnam Management. Invest-ments in Putnam Cash Collateral Pool, LLC are valued at its closing net asset value each business day. There are no management fees charged to Putnam Cash Collateral Pool, LLC. At the close of the reporting period, the fund received cash collateral of $5,789,325 and the value of securities loaned amounted to $5,610,727.
Interfund lending The fund, along with other Putnam funds, may participate in an interfund lending program pursuant to an exemptive order issued by the SEC. This program allows the fund to borrow from or lend to other Putnam funds that permit such transactions. Interfund lending transactions are subject to each fund’s investment policies and borrowing and lending limits. Interest earned or paid on the interfund lending transac-tion will be based on the average of certain current market rates. During the reporting period, the fund did not utilize the program.
Lines of credit The fund participates, along with other Putnam funds, in a $317.5 million unsecured committed line of credit and a $235.5 million unsecured uncommitted line of credit, both provided by State Street. Borrow-ings may be made for temporary or emergency purposes, including the funding of shareholder redemption requests and trade settlements. Interest is charged to the fund based on the fund’s borrowing at a rate equal to 1.25% plus the higher of (1) the Federal Funds rate and (2) the Overnight Bank Funding Rate for the committed

George Putnam Balanced Fund 59
line of credit and 1.30% plus the higher of (1) the Federal Funds rate and (2) the Overnight Bank Funding Rate for the uncommitted line of credit. A closing fee equal to 0.04% of the committed line of credit and 0.04% of the uncommitted line of credit has been paid by the participating funds. In addition, a commitment fee of 0.21% per annum on any unutilized portion of the committed line of credit is allocated to the participating funds based on their relative net assets and paid quarterly. During the reporting period, the fund had no borrowings against these arrangements.
Federal taxes It is the policy of the fund to distribute all of its taxable income within the prescribed time period and otherwise comply with the provisions of the Internal Revenue Code of 1986, as amended (the Code), appli-cable to regulated investment companies. It is also the intention of the fund to distribute an amount sufficient to avoid imposition of any excise tax under Section 4982 of the Code.
The fund is subject to the provisions of Accounting Standards Codification 740 Income Taxes (ASC 740). ASC 740 sets forth a minimum threshold for financial statement recognition of the benefit of a tax position taken or expected to be taken in a tax return. The fund did not have a liability to record for any unrecognized tax benefits in the accompanying financial statements. No provision has been made for federal taxes on income, capital gains or unrealized appreciation on securities held nor for excise tax on income and capital gains. Each of the fund’s federal tax returns for the prior three fiscal years remains subject to examination by the Internal Revenue Service.
The fund may also be subject to taxes imposed by governments of countries in which it invests. Such taxes are generally based on either income or gains earned or repatriated. The fund accrues and applies such taxes to net investment income, net realized gains and net unrealized gains as income and/or capital gains are earned. In some cases, the fund may be entitled to reclaim all or a portion of such taxes, and such reclaim amounts, if any, are reflected as an asset on the fund’s books. In many cases, however, the fund may not receive such amounts for an extended period of time, depending on the country of investment.
Distributions to shareholders Distributions to shareholders from net investment income are recorded by the fund on the ex-dividend date. Distributions from capital gains, if any, are recorded on the ex-dividend date and paid at least annually. The amount and character of income and gains to be distributed are determined in accordance with income tax regulations, which may differ from generally accepted accounting principles. These differences include temporary and/or permanent differences from losses on wash sale transactions, from foreign currency gains and losses, from unrealized gains and losses on passive investment companies, from interest-only securities, from redesignation of taxable distributions, and from partnership income. Reclassifications are made to the fund’s capital accounts to reflect income and gains available for distribution (or available capital loss carryovers) under income tax regulations. At the close of the reporting period, the fund reclassified $2,719,936 to increase distributions in excess of net investment income, $191 to decrease paid-in capital and $2,720,127 to increase accumulated net realized gain.
Tax cost of investments includes adjustments to net unrealized appreciation (depreciation) which may not neces-sarily be final tax cost basis adjustments, but closely approximate the tax basis unrealized gains and losses that may be realized and distributed to shareholders. The tax basis components of distributable earnings and the federal tax cost as of the close of the reporting period were as follows:
Unrealized appreciation $378,679,150
Unrealized depreciation (16,197,237 )
Net unrealized appreciation 362,481,913
Undistributed long-term gains 75,349,669
Undistributed short-term gains 43,195,448
Cost for federal income tax purposes $1,595,881,277

60 George Putnam Balanced Fund
Note 2: Management fee, administrative services and other transactionsThe fund pays Putnam Management a management fee (based on the fund’s average net assets and computed and paid monthly) at annual rates that may vary based on the average of the aggregate net assets of all open-end mutual funds sponsored by Putnam Management (excluding net assets of funds that are invested in, or that are invested in by, other Putnam funds to the extent necessary to avoid “double counting” of those assets). Such annual rates may vary as follows:
0.680 % of the first $5 billion,
0.630 % of the next $5 billion,
0.580 % of the next $10 billion,
0.530 % of the next $10 billion,
0.480 % of the next $50 billion,
0.460 % of the next $50 billion,
0.450 % of the next $100 billion and
0.445 % of any excess thereafter.
For the reporting period, the management fee represented an effective rate (excluding the impact from any expense waivers in effect) of 0.513% of the fund’s average net assets.
Putnam Management has contractually agreed, through November 30, 2022, to waive fees and/or reimburse the fund’s expenses to the extent necessary to limit the cumulative expenses of the fund, exclusive of brokerage, interest, taxes, investment-related expenses, extraordinary expenses, acquired fund fees and expenses and payments under the fund’s investor servicing contract, investment management contract and distribution plans, on a fiscal year-to-date basis to an annual rate of 0.20% of the fund’s average net assets over such fiscal year-to-date period. During the reporting period, the fund’s expenses were not reduced as a result of this limit.
Putnam Investments Limited (PIL), an affiliate of Putnam Management, is authorized by the Trustees to manage a separate portion of the assets of the fund as determined by Putnam Management from time to time. PIL did not manage any portion of the assets of the fund during the reporting period. If Putnam Management were to engage the services of PIL, Putnam Management would pay a quarterly sub-management fee to PIL for its services at an annual rate of 0.40% of the average net assets of the portion of the fund managed by PIL.
The fund reimburses Putnam Management an allocated amount for the compensation and related expenses of certain officers of the fund and their staff who provide administrative services to the fund. The aggregate amount of all such reimbursements is determined annually by the Trustees.
Custodial functions for the fund’s assets are provided by State Street. Custody fees are based on the fund’s asset level, the number of its security holdings and transaction volumes.
Putnam Investor Services, Inc., an affiliate of Putnam Management, provides investor servicing agent functions to the fund. Putnam Investor Services, Inc. received fees for investor servicing for class A, class B, class C, class M, class R, class R5, class R6, and class Y shares that included (1) a per account fee for each direct and underlying non-defined contribution account (retail account) of the fund; (2) a specified rate of the fund’s assets attributable to defined contribution plan accounts; and (3) a specified rate based on the average net assets in retail accounts. Putnam Investor Services, Inc. has agreed that the aggregate investor servicing fees for each fund’s retail and defined contribution accounts for these share classes will not exceed an annual rate of 0.25% of the fund’s average assets attributable to such accounts.
Class R5 shares paid a monthly fee based on the average net assets of class R5 shares at an annual rate of 0.15%.
Class R6 shares paid a monthly fee based on the average net assets of class R6 shares at an annual rate of 0.05%.
During the reporting period, the expenses for each class of shares related to investor servicing fees were as follows:
Class A $1,670,156
Class B 16,839
Class C 142,965
Class M 75,625
Class R 2,083
Class R5 109
Class R6 28,589
Class Y 315,035
Total $2,251,401
The fund has entered into expense offset arrangements with Putnam Investor Services, Inc. and State Street whereby Putnam Investor Services, Inc.’s and State Street’s fees are reduced by credits allowed on cash balances. For the reporting period, the fund’s expenses were reduced by $2,078 under the expense offset arrangements.

George Putnam Balanced Fund 61
Each Independent Trustee of the fund receives an annual Trustee fee, of which $1,236, as a quarterly retainer, has been allocated to the fund, and an additional fee for each Trustees meeting attended. Trustees also are reimbursed for expenses they incur relating to their services as Trustees.
The fund has adopted a Trustee Fee Deferral Plan (the Deferral Plan) which allows the Trustees to defer the receipt of all or a portion of Trustees fees payable on or after July 1, 1995. The deferred fees remain invested in certain Putnam funds until distribution in accordance with the Deferral Plan.
The fund has adopted an unfunded noncontributory defined benefit pension plan (the Pension Plan) covering all Trustees of the fund who have served as a Trustee for at least five years and were first elected prior to 2004. Benefits under the Pension Plan are equal to 50% of the Trustee’s average annual attendance and retainer fees for the three years ended December 31, 2005. The retirement benefit is payable during a Trustee’s lifetime, beginning the year following retirement, for the number of years of service through December 31, 2006. Pension expense for the fund is included in Trustee compensation and expenses in the Statement of operations. Accrued pension liability is included in Payable for Trustee compensation and expenses in the Statement of assets and liabilities. The Trustees have terminated the Pension Plan with respect to any Trustee first elected after 2003.
The fund has adopted distribution plans (the Plans) with respect to the following share classes pursuant to Rule 12b–1 under the Investment Company Act of 1940. The purpose of the Plans is to compensate Putnam Retail Management Limited Partnership, an indirect wholly-owned subsidiary of Putnam Investments, LLC, for services provided and expenses incurred in distributing shares of the fund. The Plans provide payments by the fund to Putnam Retail Management Limited Partnership at an annual rate of up to the following amounts (Maximum %) of the average net assets attributable to each class. The Trustees have approved payment by the fund at the following annual rate (Approved %) of the average net assets attributable to each class. During the reporting period, the class-specific expenses related to distribution fees were as follows:
Maximum % Approved % Amount
Class A 0.35 % 0.25 % $3,147,553
Class B 1.00 % 1.00 % 126,536
Class C 1.00 % 1.00 % 1,079,470
Class M 1.00 % 0.75 % 427,094
Class R 1.00 % 0.50 % 7,920
Total $4,788,573
For the reporting period, Putnam Retail Management Limited Partnership, acting as underwriter, received net commissions of $282,003 and $0 from the sale of class A and class M shares, respectively, and received $885 and $1,209 in contingent deferred sales charges from redemptions of class B and class C shares, respectively.
A deferred sales charge of up to 1.00% is assessed on certain redemptions of class A shares. For the reporting period, Putnam Retail Management Limited Partnership, acting as underwriter, received $2,452 on class A redemptions.
Note 3: Purchases and sales of securitiesDuring the reporting period, the cost of purchases and the proceeds from sales, excluding short-term investments, were as follows:
Cost of purchases Proceeds from sales
Investments in securities, including TBA commitments (Long-term ) $1,447,603,256 $1,408,030,895
U.S. government securities (Long-term ) 173,150,350 134,466,709
Total $1,620,753,606 $1,542,497,604
The fund may purchase or sell investments from or to other Putnam funds in the ordinary course of business, which can reduce the fund’s transaction costs, at prices determined in accordance with SEC requirements and policies approved by the Trustees. During the reporting period, purchases or sales of long-term securities from or to other Putnam funds, if any, did not represent more than 5% of the fund’s total cost of purchases and/or total proceeds from sales.

62 George Putnam Balanced Fund
Note 4: Capital sharesAt the close of the reporting period, there were an unlimited number of shares of beneficial interest autho-rized. Transactions, including, if applicable, direct exchanges pursuant to share conversions, in capital shares were as follows:
YEAR ENDED 7/31/21 YEAR ENDED 7/31/20
Class A Shares Amount Shares Amount
Shares sold 6,062,227 $138,585,225 5,949,720 $122,072,098
Shares issued in connection with reinvestment of distributions 3,207,940 70,563,323 3,153,067 64,215,869
9,270,167 209,148,548 9,102,787 186,287,967
Shares repurchased (5,986,865 ) (136,606,939 ) (6,667,341 ) (134,653,072 )
Net increase 3,283,302 $72,541,609 2,435,446 $51,634,895
YEAR ENDED 7/31/21 YEAR ENDED 7/31/20
Class B Shares Amount Shares Amount
Shares sold 57,135 $1,269,694 75,547 $1,516,319
Shares issued in connection with reinvestment of distributions 31,370 679,274 39,410 793,439
88,505 1,948,968 114,957 2,309,758
Shares repurchased (237,282 ) (5,335,059 ) (211,001 ) (4,231,306 )
Net decrease (148,777 ) $(3,386,091 ) (96,044 ) $(1,921,548 )
YEAR ENDED 7/31/21 YEAR ENDED 7/31/20
Class C Shares Amount Shares Amount
Shares sold 2,215,371 $49,933,757 2,113,901 $42,949,300
Shares issued in connection with reinvestment of distributions 251,565 5,464,820 195,953 3,959,050
2,466,936 55,398,577 2,309,854 46,908,350
Shares repurchased (1,211,368 ) (27,264,281 ) (1,298,265 ) (26,075,668 )
Net increase 1,255,568 $28,134,296 1,011,589 $20,832,682
YEAR ENDED 7/31/21 YEAR ENDED 7/31/20
Class M Shares Amount Shares Amount
Shares sold 272,934 $6,211,182 333,377 $6,752,046
Shares issued in connection with reinvestment of distributions 150,097 3,239,624 163,750 3,285,468
423,031 9,450,806 497,127 10,037,514
Shares repurchased (519,919 ) (11,698,206 ) (1,149,141 ) (23,419,166 )
Net decrease (96,888 ) $(2,247,400 ) (652,014 ) $(13,381,652 )

George Putnam Balanced Fund 63
YEAR ENDED 7/31/21 YEAR ENDED 7/31/20
Class R Shares Amount Shares Amount
Shares sold 46,778 $1,052,559 22,363 $457,310
Shares issued in connection with reinvestment of distributions 3,653 79,969 3,631 73,684
50,431 1,132,528 25,994 530,994
Shares repurchased (20,319 ) (463,754 ) (23,044 ) (475,413 )
Net increase 30,112 $668,774 2,950 $55,581
YEAR ENDED 7/31/21 YEAR ENDED 7/31/20
Class R5 Shares Amount Shares Amount
Shares sold 365 $8,138 9,715 $202,525
Shares issued in connection with reinvestment of distributions 76 1,708 433 8,899
441 9,846 10,148 211,424
Shares repurchased (9,750 ) (213,009 ) (736 ) (15,482 )
Net increase (decrease ) (9,309 ) $(203,163 ) 9,412 $195,942
YEAR ENDED 7/31/21 YEAR ENDED 7/31/20
Class R6 Shares Amount Shares Amount
Shares sold 1,166,883 $26,844,836 997,914 $20,524,054
Shares issued in connection with reinvestment of distributions 150,816 3,340,005 112,053 2,291,317
1,317,699 30,184,841 1,109,967 22,815,371
Shares repurchased (655,468 ) (15,138,673 ) (415,009 ) (8,444,053 )
Net increase 662,231 $15,046,168 694,958 $14,371,318
YEAR ENDED 7/31/21 YEAR ENDED 7/31/20
Class Y Shares Amount Shares Amount
Shares sold 5,348,339 $122,882,010 5,262,848 $107,995,062
Shares issued in connection with reinvestment of distributions 659,425 14,590,013 438,058 8,957,741
6,007,764 137,472,023 5,700,906 116,952,803
Shares repurchased (3,265,279 ) (74,963,252 ) (1,942,861 ) (38,906,526 )
Net increase 2,742,485 $62,508,771 3,758,045 $78,046,277
At the close of the reporting period, Putnam Investments, LLC owned 862 class R5 shares of the fund (100% of class R5 shares outstanding), valued at $21,495.

64 George Putnam Balanced Fund
Note 5: Affiliated transactionsTransactions during the reporting period with any company which is under common ownership or control were as follows:
Name of affiliateFair value as
of 7/31/20Purchase
costSale
proceedsInvestment
income
Shares outstanding
and fair value as
of 7/31/21
Short-term investments
Putnam Cash Collateral Pool, LLC * $7,020,885 $157,947,433 $159,178,993 $12,746 $5,789,325
Putnam Short Term Investment Fund * * 82,721,675 340,797,563 341,318,390 124,116 82,200,848
Total Short-term investments $89,742,560 $498,744,996 $500,497,383 $136,862 $87,990,173
* No management fees are charged to Putnam Cash Collateral Pool, LLC (Note 1). Investment income shown is included in securities lending income on the Statement of operations. There were no realized or unrealized gains or losses during the period.
** Management fees charged to Putnam Short Term Investment Fund have been waived by Putnam Management. There were no realized or unrealized gains or losses during the period.
Note 6: Market, credit and other risksIn the normal course of business, the fund trades financial instruments and enters into financial transactions where risk of potential loss exists due to changes in the market (market risk) or failure of the contracting party to the transaction to perform (credit risk). The fund may be exposed to additional credit risk that an institution or other entity with which the fund has unsettled or open transactions will default. Investments in foreign securi-ties involve certain risks, including those related to economic instability, unfavorable political developments, and currency fluctuations. The fund may invest a significant portion of its assets in securitized debt instruments, including mortgage-backed and asset-backed investments. The yields and values of these investments are sensi-tive to changes in interest rates, the rate of principal payments on the underlying assets and the market’s percep-tion of the issuers. The market for these investments may be volatile and limited, which may make them difficult to buy or sell.
On July 27, 2017, the United Kingdom’s Financial Conduct Authority (“FCA”), which regulates LIBOR, announced a desire to phase out the use of LIBOR by the end of 2021. On March 5, 2021, the FCA and LIBOR’s administrator, ICE Benchmark Administration, announced that most LIBOR settings will no longer be published after the end of 2021 and a majority of U.S. dollar LIBOR settings will no longer be published after June 30, 2023. LIBOR has historically been a common benchmark interest rate index used to make adjustments to variable-rate loans. It is used throughout global banking and financial industries to determine interest rates for a variety of financial instruments and borrowing arrangements. The transition process might lead to increased volatility and illiquidity in markets that currently rely on LIBOR to determine interest rates. It could also lead to a reduction in the value of some LIBOR-based investments and reduce the effectiveness of new hedges placed against existing LIBOR-based investments. While some LIBOR-based instruments may contemplate a scenario where LIBOR is no longer avail-able by providing for an alternative rate-setting methodology, not all may have such provisions and there may be significant uncertainty regarding the effectiveness of any such alternative methodologies. Since the usefulness of LIBOR as a benchmark could deteriorate during the transition period, these effects could occur prior to the date on which the applicable rate ceases to be published.
Beginning in January 2020, global financial markets have experienced, and may continue to experience, signifi-cant volatility resulting from the spread of a virus known as Covid–19. The outbreak of Covid–19 has resulted in travel and border restrictions, quarantines, supply chain disruptions, lower consumer demand, and general market uncertainty. The effects of Covid–19 have adversely affected, and may continue to adversely affect, the global economy, the economies of certain nations, and individual issuers, all of which may negatively impact the fund’s performance.

George Putnam Balanced Fund 65
Note 7: Summary of derivative activityThe volume of activity for the reporting period for any derivative type that was held during the period is listed below and was based on an average of the holdings at the end of each fiscal quarter:
Purchased equity option contracts (contract amount ) $2,000
Written equity option contracts (contract amount ) $2,000
Futures contracts (number of contracts ) 70
Forward currency contracts (contract amount ) $100,000,000
The following is a summary of the fair value of derivative instruments as of the close of the reporting period:
Fair value of derivative instruments as of the close of the reporting periodASSET DERIVATIVES LIABILITY DERIVATIVES
Derivatives not accounted for as hedging instruments under ASC 815
Statement of assets and
liabilities location Fair value
Statement of assets and
liabilities location Fair value
Foreign exchange contracts Receivables $1,609,522 Payables $461,348
Equity contracts Receivables 674,668 * Payables —
Total $2,284,190 $461,348
* Includes cumulative appreciation/depreciation of futures contracts as reported in the fund’s portfolio. Only current day’s variation margin is reported within the Statement of assets and liabilities.
The following is a summary of realized and change in unrealized gains or losses of derivative instruments in the Statement of operations for the reporting period (Note 1):
Amount of realized gain or (loss ) on derivatives recognized in net gain or (loss ) on investmentsDerivatives not accounted for as hedging instruments under ASC 815 Options Futures
Forward currency
contracts Total
Foreign exchange contracts $— $— $(3,466,748 ) $(3,466,748 )
Equity contracts (86,569 ) 5,666,274 — 5,579,705
Total $(86,569 ) $5,666,274 $(3,466,748 ) $2,112,957
Change in unrealized appreciation or (depreciation ) on derivatives recognized in net gain or (loss ) on investments
Derivatives not accounted for as hedging instruments under ASC 815 Futures
Forward currency
contracts Total
Foreign exchange contracts $— $2,516,109 $2,516,109
Equity contracts 450,167 — 450,167
Total $450,167 $2,516,109 $2,966,276
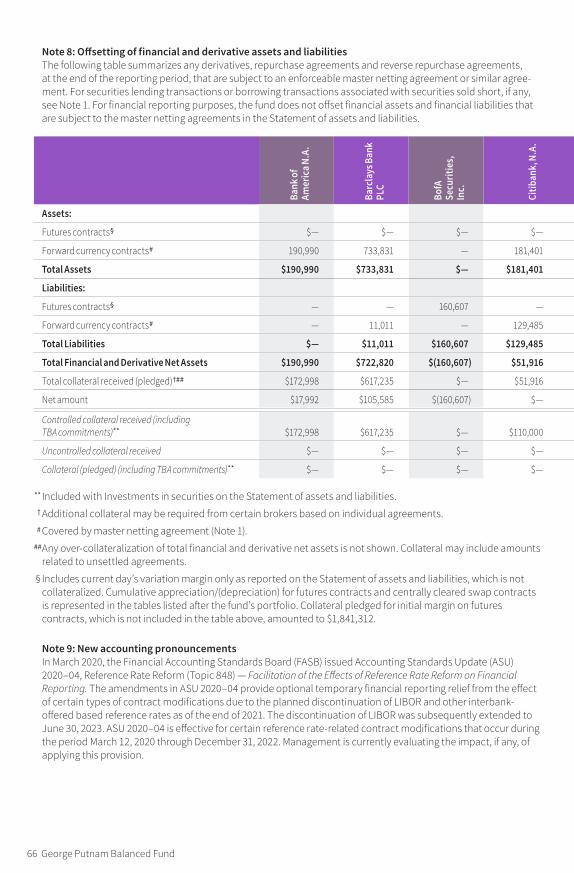
66 George Putnam Balanced Fund
Note 8: Offsetting of financial and derivative assets and liabilitiesThe following table summarizes any derivatives, repurchase agreements and reverse repurchase agreements, at the end of the reporting period, that are subject to an enforceable master netting agreement or similar agree-ment. For securities lending transactions or borrowing transactions associated with securities sold short, if any, see Note 1. For financial reporting purposes, the fund does not offset financial assets and financial liabilities that are subject to the master netting agreements in the Statement of assets and liabilities.
Bank
of
Amer
ica N
.A.
Barc
lays
Ban
k PL
C
BofA
Se
curit
ies,
In
c.
Citib
ank,
N.A
.
Gold
man
Sa
chs
Inte
rnat
iona
l
HSBC
Ban
k US
A, N
atio
nal
Asso
ciat
ion
JPM
orga
n Ch
ase B
ank
N.A.
Stat
e Str
eet
Bank
and
Trus
t Co.
UBS A
G
Wes
tPac
Ba
nkin
g Cor
p.
Tota
l
Assets:
Futures contracts§ $— $— $— $— $— $— $— $— $— $— $—
Forward currency contracts# 190,990 733,831 — 181,401 161,381 69,677 — 1,861 63,021 207,360 1,609,522
Total Assets $190,990 $733,831 $— $181,401 $161,381 $69,677 $— $1,861 $63,021 $207,360 $1,609,522
Liabilities:
Futures contracts§ — — 160,607 — — — — — — — 160,607
Forward currency contracts# — 11,011 — 129,485 13,187 49,888 98,551 15,134 119,400 24,692 461,348
Total Liabilities $— $11,011 $160,607 $129,485 $13,187 $49,888 $98,551 $15,134 $119,400 $24,692 $621,955
Total Financial and Derivative Net Assets $190,990 $722,820 $(160,607) $51,916 $148,194 $19,789 $(98,551) $(13,273) $(56,379) $182,668 $987,567
Total collateral received (pledged)†## $172,998 $617,235 $— $51,916 $148,194 $— $(98,551) $(13,273) $(56,379) $—
Net amount $17,992 $105,585 $(160,607) $— $— $19,789 $— $— $— $182,668
Controlled collateral received (including TBA commitments)** $172,998 $617,235 $— $110,000 $190,000 $— $— $— $— $— $1,090,233
Uncontrolled collateral received $— $— $— $— $— $— $— $— $— $— $—
Collateral (pledged) (including TBA commitments)** $— $— $— $— $— $— $(151,292) $(19,938) $(134,873) $— $(306,103)
** Included with Investments in securities on the Statement of assets and liabilities. † Additional collateral may be required from certain brokers based on individual agreements. # Covered by master netting agreement (Note 1). ## Any over-collateralization of total financial and derivative net assets is not shown. Collateral may include amounts
related to unsettled agreements. § Includes current day’s variation margin only as reported on the Statement of assets and liabilities, which is not
collateralized. Cumulative appreciation/(depreciation) for futures contracts and centrally cleared swap contracts is represented in the tables listed after the fund’s portfolio. Collateral pledged for initial margin on futures contracts, which is not included in the table above, amounted to $1,841,312.
Note 9: New accounting pronouncementsIn March 2020, the Financial Accounting Standards Board (FASB) issued Accounting Standards Update (ASU) 2020–04, Reference Rate Reform (Topic 848) — Facilitation of the Effects of Reference Rate Reform on Financial Reporting. The amendments in ASU 2020–04 provide optional temporary financial reporting relief from the effect of certain types of contract modifications due to the planned discontinuation of LIBOR and other interbank-offered based reference rates as of the end of 2021. The discontinuation of LIBOR was subsequently extended to June 30, 2023. ASU 2020–04 is effective for certain reference rate-related contract modifications that occur during the period March 12, 2020 through December 31, 2022. Management is currently evaluating the impact, if any, of applying this provision.

George Putnam Balanced Fund 67
Note 8: Offsetting of financial and derivative assets and liabilitiesThe following table summarizes any derivatives, repurchase agreements and reverse repurchase agreements, at the end of the reporting period, that are subject to an enforceable master netting agreement or similar agree-ment. For securities lending transactions or borrowing transactions associated with securities sold short, if any, see Note 1. For financial reporting purposes, the fund does not offset financial assets and financial liabilities that are subject to the master netting agreements in the Statement of assets and liabilities.
Bank
of
Amer
ica N
.A.
Barc
lays
Ban
k PL
C
BofA
Se
curit
ies,
In
c.
Citib
ank,
N.A
.
Gold
man
Sa
chs
Inte
rnat
iona
l
HSBC
Ban
k US
A, N
atio
nal
Asso
ciat
ion
JPM
orga
n Ch
ase B
ank
N.A.
Stat
e Str
eet
Bank
and
Trus
t Co.
UBS A
G
Wes
tPac
Ba
nkin
g Cor
p.
Tota
l
Assets:
Futures contracts§ $— $— $— $— $— $— $— $— $— $— $—
Forward currency contracts# 190,990 733,831 — 181,401 161,381 69,677 — 1,861 63,021 207,360 1,609,522
Total Assets $190,990 $733,831 $— $181,401 $161,381 $69,677 $— $1,861 $63,021 $207,360 $1,609,522
Liabilities:
Futures contracts§ — — 160,607 — — — — — — — 160,607
Forward currency contracts# — 11,011 — 129,485 13,187 49,888 98,551 15,134 119,400 24,692 461,348
Total Liabilities $— $11,011 $160,607 $129,485 $13,187 $49,888 $98,551 $15,134 $119,400 $24,692 $621,955
Total Financial and Derivative Net Assets $190,990 $722,820 $(160,607) $51,916 $148,194 $19,789 $(98,551) $(13,273) $(56,379) $182,668 $987,567
Total collateral received (pledged)†## $172,998 $617,235 $— $51,916 $148,194 $— $(98,551) $(13,273) $(56,379) $—
Net amount $17,992 $105,585 $(160,607) $— $— $19,789 $— $— $— $182,668
Controlled collateral received (including TBA commitments)** $172,998 $617,235 $— $110,000 $190,000 $— $— $— $— $— $1,090,233
Uncontrolled collateral received $— $— $— $— $— $— $— $— $— $— $—
Collateral (pledged) (including TBA commitments)** $— $— $— $— $— $— $(151,292) $(19,938) $(134,873) $— $(306,103)
** Included with Investments in securities on the Statement of assets and liabilities. † Additional collateral may be required from certain brokers based on individual agreements. # Covered by master netting agreement (Note 1). ## Any over-collateralization of total financial and derivative net assets is not shown. Collateral may include amounts
related to unsettled agreements. § Includes current day’s variation margin only as reported on the Statement of assets and liabilities, which is not
collateralized. Cumulative appreciation/(depreciation) for futures contracts and centrally cleared swap contracts is represented in the tables listed after the fund’s portfolio. Collateral pledged for initial margin on futures contracts, which is not included in the table above, amounted to $1,841,312.
Note 9: New accounting pronouncementsIn March 2020, the Financial Accounting Standards Board (FASB) issued Accounting Standards Update (ASU) 2020–04, Reference Rate Reform (Topic 848) — Facilitation of the Effects of Reference Rate Reform on Financial Reporting. The amendments in ASU 2020–04 provide optional temporary financial reporting relief from the effect of certain types of contract modifications due to the planned discontinuation of LIBOR and other interbank-offered based reference rates as of the end of 2021. The discontinuation of LIBOR was subsequently extended to June 30, 2023. ASU 2020–04 is effective for certain reference rate-related contract modifications that occur during the period March 12, 2020 through December 31, 2022. Management is currently evaluating the impact, if any, of applying this provision.

68 George Putnam Balanced Fund
Federal tax information
The Form 1099 that will be mailed to you in January 2022 will show the tax status of all distributions paid to your account in calendar 2021.
Pursuant to §852 of the Internal Revenue Code, as amended, the fund hereby designates $92,926,165 as a capital gain dividend with respect to the taxable year ended July 31, 2021, or, if subsequently determined to be different, the net capital gain of such year.
The fund designated 17.57% of ordinary income distributions as qualifying for the dividends received deduction for corporations.
For the reporting period, the fund hereby designates 20.23%, or the maximum amount allow-able, of its taxable ordinary income distributions as qualified dividends taxed at the individual net capital gain rates.
For the reporting period, pursuant to §871(k) of the Internal Revenue Code, the fund hereby desig-nates $5,855,341 of distributions paid as qualifying to be taxed as interest-related dividends, and $25,614,386 to be taxed as short-term capital gain dividends for nonresident alien shareholders.

About the TrusteesINDEPENDENT TRUSTEES
Liaquat Ahamed Born 1952, Trustee since 2012Principal occupations during past five years: Author; won Pulitzer Prize for Lords of Finance: The Bankers Who Broke
the World.
Other directorships: Chairman of the Sun Valley Writers Conference, a literary not-for-profit organization, and a Trustee of the Journal of Philosophy.
Ravi AkhouryBorn 1947, Trustee since 2009Principal occupations during past five years: Private investor
Other directorships: Director of English Helper, Inc., a private software company; Trustee of the Rubin Museum, serving on the Investment Committee; and previously a Director of RAGE Frameworks, Inc.
Barbara M. Baumann Born 1955, Trustee since 2010Principal occupations during past five years: President of Cross Creek Energy Corporation, a strategic
consultant to domestic energy firms and direct investor in energy projects.
Other directorships: Director of Devon Energy Corporation, a publicly traded independent natural gas and oil exploration and production company; Director of National Fuel Gas Company, a publicly traded energy company that engages in the production, gathering, transportation, distribution, and marketing of natural gas; Senior Advisor to the energy private equity firm First Reserve; Director of Ascent Resources, LLC, a private independent exploration and production company; Director of Texas American Resources Company II, a private, independent oil and gas exploration and production company; member of the Finance Committee of the Children’s Hospital of Colorado; member of the Investment Committee of the Board of The Denver Foundation; and previously a Director of publicly traded companies Buckeye Partners LP, UNS Energy Corporation, CVR Energy Company, and SM Energy Corporation.
Katinka DomotorffyBorn 1975, Trustee since 2012Principal occupations during past five years: Voting member of the Investment Committees of the Anne Ray Foundation
and Margaret A. Cargill Foundation, part of the Margaret A. Cargill Philanthropies.
Other directorships: Director of the Great Lakes Science Center and of College Now Greater Cleveland.
Catharine Bond HillBorn 1954, Trustee since 2017Principal occupations during past five years: Managing Director of Ithaka S+R, a not-for-profit service that
helps the academic community navigate economic and technological change. From 2006 to 2016, the 10th president of Vassar College.
Other directorships: Director of Yale-NUS College and Trustee of Yale University.
Paul L. JoskowBorn 1947, Trustee since 1997Principal occupations during past five years: The Elizabeth and James Killian Professor of Economics, Emeritus at the
Massachusetts Institute of Technology (MIT). From 2008 to 2017, the President of the Alfred P. Sloan Foundation, a philanthropic institution focused primarily on research and education on issues related to science, technology, and economic performance.
Other directorships: Vice Chair of the Board of Directors of the Whitehead Institute for Biomedical Research, a non-profit biomedical research institute; a Director of Exelon Corporation, an energy company focused on power services; and a member Emeritus of the Board of Advisors of the Boston Symphony Orchestra.
Kenneth R. LeiblerBorn 1949, Trustee since 2006 Vice Chair from 2016 to 2018, and Chair since 2018Principal occupations during past
five years: Vice Chairman Emeritus of the Board of Trustees of Beth Israel Deaconess Hospital in Boston. Member of the Investment Committee of the Boston Arts Academy Foundation.
Other directorships: Director of Eversource Corporation, which operates New England’s largest energy delivery system; previously the Chairman of the Boston Options Exchange, an electronic market place for the trading of listed derivatives securities; previously the Chairman and Chief Executive Officer of the Boston Stock Exchange; and previously the President and Chief Operating Officer of the American Stock Exchange.
George Putnam Balanced Fund 69

George Putnam, IIIBorn 1951, Trustee since 1984Principal occupations during past five years: Chairman of New Generation Research, Inc., a publisher of financial
advisory and other research services, and President of New Generation Advisors, LLC, a registered investment adviser to private funds.
Other directorships: Director of The Boston Family Office, LLC, a registered investment advisor; a Trustee of the Gloucester Marine Genomics Institute; previously a Trustee of the Marine Biological Laboratory; and previously a Trustee of Epiphany School.
Manoj P. SinghBorn 1952, Trustee since 2017Principal occupations during past five years: Until 2015, Chief Operating Officer and Global Managing Director at
Deloitte Touche Tohmatsu, Ltd., a global professional services organization, serving on the Deloitte U.S. Board of Directors and the boards of Deloitte member firms in China, Mexico, and Southeast Asia.
Other directorships: Director of Abt Associates, a global research firm working in the fields of health, social and environmental policy, and international development; Trustee of Carnegie Mellon University; Director of Pratham USA, an organization dedicated to children’s education in India; member of the advisory board of Altimetrik, a business transformation and technology solutions firm; and Director of DXC Technology, a global IT services and consulting company.
Mona K. SutphenBorn 1967, Trustee since 2020Principal occupations during past five years: Senior Advisor at The Vistria Group, a private investment firm focused
on middle-market companies in the healthcare, education, and financial services industries. From 2014 to 2018, Partner at Macro Advisory Partners, a global consulting firm.
Other directorships: Director of Unitek Learning, a private nursing and medical services education provider in the United States; Director of Pattern Energy Group LP, a private renewable energy company; previous Director of Pattern Energy, a publicly traded renewable energy company; Board Member, International Rescue Committee; Co-Chair of the Board of Human Rights First; Trustee of Mount Holyoke College; and member of the Advisory Board for the Center on Global Energy Policy at Columbia University’s School of International and Public Affairs.
INTERESTED TRUSTEE
Robert L. Reynolds*
Trustee since 2008 and President and Chief Executive Officer of Putnam Investments since 2008
Principal occupations during past five years: President and Chief Executive Officer of Putnam Investments; President and Chief Executive Officer of Great-West Financial, a financial services company that provides retirement savings plans, life insurance, and annuity and executive benefits products; President and Chief Executive Officer of Great-West Lifeco U.S. Inc., a holding company that owns Putnam Investments and Great-West Financial; and member of Putnam Investments’ and Great-West Financial’s Board of Directors.
Other directorships: Director of West Virginia University Foundation; director of the Concord Museum; director of Dana-Farber Cancer Institute; Chairman of Massachusetts Competitive Partnership; director of Boston Chamber of Commerce; member of the Chief Executives Club of Boston; member of the National Innovation Initiative; member of the Massachusetts General Hospital President’s Council; member of the Council on Competitiveness; and previously the President of the Commercial Club of Boston.
* Mr. Reynolds is an “interested person” (as defined in the Investment Company Act of 1940) of the fund and Putnam Investments. He is President and Chief Executive Officer of Putnam Investments, as well as the President of your fund and each of the other Putnam funds.
The address of each Trustee is 100 Federal Street, Boston, MA 02110.
As of July 31, 2021, there were 100 Putnam funds. All Trustees serve as Trustees of all Putnam funds.
Each Trustee serves for an indefinite term, until his or her resignation, retirement at age 75, removal, or death.
70 George Putnam Balanced Fund

The principal occupations of the officers for the past five years have been with the employers as shown above, although in some cases they have held different positions with such employers. The address of each officer is 100 Federal Street, Boston, MA 02110.
OfficersIn addition to Robert L. Reynolds, the other officers of the fund are shown below:
James F. Clark (Born 1974)Vice President and Chief Compliance OfficerSince 2016Chief Compliance Officer and Chief Risk Officer, Putnam Investments and Chief Compliance Officer, Putnam Management
Nancy E. Florek (Born 1957)Vice President, Director of Proxy Voting and Corporate Governance, Assistant Clerk, and Assistant TreasurerSince 2000
Michael J. Higgins (Born 1976)Vice President, Treasurer, and ClerkSince 2010
Jonathan S. Horwitz (Born 1955)Executive Vice President, Principal Executive Officer, and Compliance LiaisonSince 2004
Richard T. Kircher (Born 1962)Vice President and BSA Compliance OfficerSince 2019Assistant Director, Operational Compliance, Putnam Investments and Putnam Retail Management
Susan G. Malloy (Born 1957)Vice President and Assistant TreasurerSince 2007Head of Accounting and Middle Office Services, Putnam Investments and Putnam Management
Denere P. Poulack (Born 1968)Assistant Vice President, Assistant Clerk, and Assistant TreasurerSince 2004
Janet C. Smith (Born 1965)Vice President, Principal Financial Officer, Principal Accounting Officer, and Assistant TreasurerSince 2007Head of Fund Administration Services, Putnam Investments and Putnam Management
Stephen J. Tate (Born 1974)Vice President and Chief Legal OfficerSince 2021General Counsel, Putnam Investments, Putnam Management, and Putnam Retail Management
Mark C. Trenchard (Born 1962)Vice PresidentSince 2002Director of Operational Compliance, Putnam Investments and Putnam Retail Management
George Putnam Balanced Fund 71

72 George Putnam Balanced Fund
Putnam family of fundsThe following is a list of Putnam’s open-end mutual funds offered to the public. Investors should carefully consider the investment objective, risks, charges, and expenses of a fund before investing. For a prospectus, or a summary prospectus if available, containing this and other information for any Putnam fund or product, contact your financial advisor or call Putnam Investor Services at 1-800-225-1581. Please read the prospectus carefully before investing.
BlendEmerging Markets Equity FundFocused Equity FundFocused International Equity FundInternational Capital Opportunities FundInternational Equity FundMulti-Cap Core FundResearch Fund
Global SectorGlobal Health Care FundGlobal Technology Fund
GrowthGrowth Opportunities FundSmall Cap Growth FundSustainable Future FundSustainable Leaders Fund
ValueInternational Value Fund Large Cap Value Fund Small Cap Value Fund
IncomeConvertible Securities FundDiversified Income TrustFloating Rate Income FundGlobal Income TrustGovernment Money Market Fund*
High Yield FundIncome FundMoney Market Fund†
Mortgage Opportunities Fund Mortgage Securities FundShort Duration Bond FundUltra Short Duration Income Fund
Tax-free IncomeIntermediate-Term Municipal Income FundShort-Term Municipal Income FundStrategic Intermediate Municipal FundTax Exempt Income FundTax-Free High Yield Fund
State tax-free income funds‡: California, Massachusetts, Minnesota, New Jersey, New York, Ohio, and Pennsylvania.

George Putnam Balanced Fund 73
Absolute ReturnFixed Income Absolute Return FundMulti-Asset Absolute Return Fund
Putnam PanAgora§
Putnam PanAgora Risk Parity Fund
Asset AllocationDynamic Risk Allocation FundGeorge Putnam Balanced Fund
Dynamic Asset Allocation Balanced FundDynamic Asset Allocation Conservative FundDynamic Asset Allocation Growth Fund
Asset Allocation (cont.)Putnam Retirement Advantage Maturity FundPutnam Retirement Advantage 2065 Fund Putnam Retirement Advantage 2060 FundPutnam Retirement Advantage 2055 FundPutnam Retirement Advantage 2050 FundPutnam Retirement Advantage 2045 FundPutnam Retirement Advantage 2040 FundPutnam Retirement Advantage 2035 FundPutnam Retirement Advantage 2030 FundPutnam Retirement Advantage 2025 Fund
RetirementReady® Maturity FundRetirementReady® 2065 Fund RetirementReady® 2060 Fund RetirementReady® 2055 FundRetirementReady® 2050 FundRetirementReady® 2045 FundRetirementReady® 2040 FundRetirementReady® 2035 FundRetirementReady® 2030 FundRetirementReady® 2025 Fund
* You could lose money by investing in the fund. Although the fund seeks to preserve the value of your investment at $1.00 per share, it cannot guarantee it will do so. An investment in the fund is not insured or guaranteed by the Federal Deposit Insurance Corporation or any other government agency. The fund’s sponsor has no legal obligation to provide financial support to the fund, and you should not expect that the sponsor will provide financial support to the fund at any time.
† You could lose money by investing in the fund. Although the fund seeks to preserve the value of your investment at $1.00 per share, it cannot guarantee it will do so. The fund may impose a fee upon sale of your shares or may temporarily suspend your ability to sell shares if the fund’s liquidity falls below required minimums because of market conditions or other factors. An investment in the fund is not insured or guaranteed by the Federal Deposit Insurance Corporation or any other government agency. The fund’s sponsor has no legal obligation to provide financial support to the fund, and you should not expect that the sponsor will provide financial support to the fund at any time.
‡ Not available in all states.
§ Sub-advised by PanAgora Asset Management.Check your account balances and the most recent month-end performance in the Individual Investors section at putnam.com.

74 George Putnam Balanced Fund
Services for shareholders
Investor services
Systematic investment plan Tell us how much you wish to invest regularly — weekly, semimonthly, or monthly — and the amount you choose will be transferred automatically from your checking or savings account. There’s no additional fee for this service, and you can suspend it at any time. This plan may be a great way to save for college expenses or to plan for your retirement.
Please note that regular investing does not guarantee a profit or protect against loss in a declining market. Before arranging a system-atic investment plan, consider your financial ability to continue making purchases in periods when prices are low.
Systematic exchange You can make regular transfers from one Putnam fund to another Putnam fund. There are no additional fees for this service, and you can cancel or change your options at any time.
Dividends PLUS You can choose to have the dividend distributions from one of your Putnam funds automatically reinvested in another Putnam fund at no additional charge.
Free exchange privilege You can exchange money between Putnam funds free of charge, as long as they are the same class of shares. A signature guarantee is required if you are exchanging more than $500,000. The fund reserves the right to revise or terminate the exchange privilege.
Reinstatement privilege If you’ve sold Putnam shares or received a check for a divi-dend or capital gain, you may reinvest the proceeds with Putnam within 90 days of the
transaction and they will be reinvested at the fund’s current net asset value — with no sales charge. However, reinstatement of class B shares may have special tax consequences. Ask your financial or tax representative for details.
Check-writing service You have ready access to many Putnam accounts. It’s as simple as writing a check, and there are no special fees or service charges. For more information about the check-writing service, call Putnam or visit our website.
Dollar cost averaging When you’re investing for long-term goals, it’s time, not timing, that counts. Investing on a systematic basis is a better strategy than trying to figure out when the markets will go up or down. This means investing the same amount of money regularly over a long period. This method of investing is called dollar cost averaging. When a fund’s share price declines, your investment dollars buy more shares at lower prices. When it increases, they buy fewer shares. Over time, you will pay a lower average price per share.
For more information
Visit the Individual Investors section at putnam.com A secure section of our website contains complete information on your account, including balances and transac-tions, updated daily. You may also conduct transactions, such as exchanges, additional investments, and address changes. Log on today to get your password.
Call us toll free at 1-800-225-1581 Ask a helpful Putnam representative or your financial advisor for details about any of these or other services, or see your prospectus.
Fund informationFounded over 80 years ago, Putnam Investments was built around the concept that a balance between risk and reward is the hallmark of a well-rounded financial program. We manage funds across income, value, blend, growth, sustainable, asset allocation, absolute return, and global sector categories.
Investment ManagerPutnam Investment Management, LLC 100 Federal Street Boston, MA 02110
Investment Sub-AdvisorPutnam Investments Limited 16 St James’s Street London, England SW1A 1ER
Marketing ServicesPutnam Retail Management 100 Federal Street Boston, MA 02110
CustodianState Street Bank and Trust Company
Legal CounselRopes & Gray LLP
Independent Registered Public Accounting FirmPricewaterhouseCoopers LLP
TrusteesKenneth R. Leibler, Chair Liaquat Ahamed Ravi Akhoury Barbara M. Baumann Katinka Domotorffy Catharine Bond Hill Paul L. Joskow George Putnam, III Robert L. Reynolds Manoj P. Singh Mona K. Sutphen
OfficersRobert L. Reynolds President
James F. Clark Vice President, Chief Compliance Officer, and Chief Risk Officer
Nancy E. Florek Vice President, Director of Proxy Voting and Corporate Governance, Assistant Clerk, and Assistant Treasurer
Michael J. Higgins Vice President, Treasurer, and Clerk
Jonathan S. Horwitz Executive Vice President, Principal Executive Officer, and Compliance Liaison
Richard T. Kircher Vice President and BSA Compliance Officer
Susan G. Malloy Vice President and Assistant Treasurer
Denere P. Poulack Assistant Vice President, Assistant Clerk, and Assistant Treasurer
Janet C. Smith Vice President, Principal Financial Officer, Principal Accounting Officer, and Assistant Treasurer
Stephen J. Tate Vice President and Chief Legal Officer
Mark C. Trenchard Vice President
George Putnam Balanced Fund 75

76 George Putnam Balanced Fund
This report is for the information of shareholders of George Putnam Balanced Fund. It may also be used as sales literature when preceded or accompanied by the current prospectus, the most recent copy of Putnam’s Quarterly Performance Summary, and Putnam’s Quarterly Ranking Summary. For more recent performance, please visit putnam.com. Investors should carefully consider the investment objectives, risks, charges, and expenses of a fund, which are described in its prospectus. For this and other information or to request a prospectus or summary prospectus, call 1-800-225-1581 toll free. Please read the prospectus carefully before investing. The fund’s Statement of Additional Information contains additional information about the fund’s Trustees and is available without charge upon request by calling 1-800-225-1581.


AN02
1 32
6892
9/
21