Embed Size (px)
Citation preview

Georgiaby
Teresa ConcannonMushtaq HussainDaniel HudgensJames G TitusThe Likelihood of Shore Protection.U.S. Environmental Protection AgencyFebruary 2010.
The following document can be cited as:
Concannon, T., M Hussain, D. Hudgens, and J.G. Titus. 2010. “Georgia.” In James G. Titus,Daniel L Trescott, and Daniel E. Hudgens (editors). The Likelihood of Shore Protection alongthe Atlantic Coast of the United States. Volume 2: New England and the Southeast. Report tothe U.S. Environmental Protection Agency. Washington, D.C.
The opinions expressed herein are solely those of the authors and do not necessarily represent theofficial opinion of the Environmental Protection Agency.
The primary referring page for this document ishttp://risingsea.net/ERL/GA.html

255
Chapter 4: GEORGIA
Prepared by:
Teresa Concannon
Mushtaq Hussain
Daniel Hudgens
James G Titus

256
CONTENTS
CONTENTS ..................................................................................................................................................... 256
INTRODUCTION ............................................................................................................................................ 258
PURPOSE OF THIS STUDY ................................................................................................................................. 258 REPORT OUTLINE ............................................................................................................................................ 263
METHODS ....................................................................................................................................................... 264
INITIAL PHASE ............................................................................................................................................... 264 STAKEHOLDER REVIEW ................................................................................................................................. 264 FINAL REVIEW ............................................................................................................................................... 266 CAVEATS AND UNCERTAINTIES ....................................................................................................................... 266
STATE POLICIES ........................................................................................................................................... 267
Shore Protection Act ................................................................................................................................... 267 Coastal Marshlands Protection Act ............................................................................................................. 267 Soil Erosion and Sedimentation Act ............................................................................................................. 268 Georgia Ports Authority Act ........................................................................................................................ 268
STUDY AREA .................................................................................................................................................. 269 GENERAL STATEWIDE ASSUMPTIONS ............................................................................................................ 269 DATA AND MAP CREATION ............................................................................................................................ 273
COUNTY-SPECIFIC RESPONSES: THE DRAFT MAPS ............................................................................ 274
CHATHAM COUNTY ......................................................................................................................................... 274 Stakeholder Review ..................................................................................................................................... 277
BRYAN COUNTY ............................................................................................................................................. 278 Initial Meeting ............................................................................................................................................ 278 Stakeholder Review ..................................................................................................................................... 279
LIBERTY COUNTY ........................................................................................................................................... 281 Initial Meeting ............................................................................................................................................ 281 Stakeholder Review ..................................................................................................................................... 281
MCINTOSH COUNTY ........................................................................................................................................ 282 Initial Meeting ............................................................................................................................................ 282 Stakeholder Review ..................................................................................................................................... 283
GLYNN COUNTY ............................................................................................................................................. 285 Initial Meeting ............................................................................................................................................ 285 Stakeholder Review ..................................................................................................................................... 286
CAMDEN COUNTY ........................................................................................................................................... 288 Initial Meeting ............................................................................................................................................ 288 Stakeholder Review ..................................................................................................................................... 289

257
FINAL REVIEW .............................................................................................................................................. 291
PURPOSE ........................................................................................................................................................ 291 Likelihood of Shore Protection for Residential Land, Utilities, and Infrastructure ........................................ 291 Identifying Lands Likely to be Developed and Therefore Likely to be Protected............................................ 292 "Undevelopable” and “Undeveloped” Lands .............................................................................................. 294 Isolated Forests .......................................................................................................................................... 294 Map Revisions ............................................................................................................................................ 294
CHATHAM COUNTY ....................................................................................................................................... 296 BRYAN COUNTY ............................................................................................................................................. 299 LIBERTY COUNTY .......................................................................................................................................... 301 MCINTOSH COUNTY ...................................................................................................................................... 304 GLYNN COUNTY ............................................................................................................................................ 306 CAMDEN COUNTY .......................................................................................................................................... 310
APPENDIX A ................................................................................................................................................... 313
ACKNOWLEDGMENTS ................................................................................................................................ 322

258
INTRODUCTION
Georgia’s coastline is buffered by a network of 13 barrier islands. These islands contain all of
Georgia’s 88 miles of ocean beaches and protect the extensive salt marshes that line the
mainland coast. Many of the islands are parks, refuges, or preserves.1 Several barrier islands and
some lands inland of the salt marshes are developed. The City of Savannah and many smaller
communities are located in low-lying areas. With more than 2,300 miles of tidally influenced
shoreline and 380,000 coastal residents, Georgia is vulnerable to the impacts of sea level rise.
Nearly 1,100 square miles of Georgia's coast is located below 3.5 meters in elevation (of which
nearly 675 square miles are located below 1.5 meters in elevation). 2
(See Figure 1.) As sea level
rises, much of this area will be inundated unless the state or private property owners armor or
elevate the land. In this report, we examine the likelihood that coastal lands in Georgia will be
protected from rising sea level by characterizing the likely response of Georgia residents and
state and local governments.
Purpose of this Study
This study develops maps that distinguish the areas likely to be protected from erosion and
inundation as the sea rises, from those areas that are likely to be left to retreat naturally. The
natural retreat may occur either because the cost of holding back the sea is greater than the value
of the land or because environmental policies favor natural shorelines over the structures and fill
material required to hold back the sea. This report is part of a national effort by the U.S.
Environmental Protection Agency (EPA) to encourage the long-term thinking required to deal
with the impacts of sea level rise issues. The nature of rising sea level prevents the issue from
being a top priority; but it does give us time to reflect upon how to address the impacts. Maps
that illustrate the areas that might ultimately be submerged convey a sense of what is at stake, but
they also leave people with the impression that submergence is beyond their control. Maps that
illustrate alternative visions of the future may promote a more constructive dialogue.
For each state, EPA is evaluating potential responses to sea level rise, with attention focused on
developing maps that indicate the lands that would probably be protected from erosion and
inundation as the sea rises. These maps are intended for two very different audiences:
1 These marshes account for approximately one-third of all remaining salt marshes along the East Coast. NOAA
Office of Ocean and Coastal Resource Management and Georgia Department of Natural Resources, State of Georgia
Coastal Management Program and Draft Environmental Impact Statement, August 1997.
2 Titus J.G. and C. Richman, "Maps of Lands Vulnerable to Sea Level Rise: Modeled Elevations along the U.S.
Atlantic and Gulf Coasts," Climate Research, 2001.

259
Figure 1. Lands Close to Sea Level in Georgia. Source: Titus and Richman (2001)

260
State and Local Planners and Others Concerned about Long-Term
Consequences. Whether one is trying to ensure that a small town survives,
that coastal wetlands are able to migrate inland, or some mix of both, the
most cost-effective means of preparing for sea level rise often requires
implementation several decades before developed areas are threatened.3
EPA seeks to accelerate the process by which coastal governments and
private organizations plan for sea level rise. The first step in preparing for
sea level rise is to decide which areas will be elevated or protected with
dikes, and which areas will be abandoned to the sea.
National and International Policy Makers. National and international
policies regarding the possible need to reduce greenhouse gas emissions
require assessments of the possible impacts of sea level rise, and such an
assessment depends to a large degree on the extent to which local coastal
area governments will permit or undertake sea level rise protection
efforts.4 Moreover, the United Nations Framework Convention on Climate
Change, signed by President Bush in 1992, commits the United States to
taking appropriate measures to adapt to the consequences of global
warming.
This study analyzes state and local coastal management and development patterns to the extent
that they are foreseeable. The maps that accompany this study illustrate the areas that local
planning officials expect to be protected from erosion and inundation by rising sea level. The
maps are not meant to indicate whether people will hold back the sea forever5, which would
depend on cost factors and scientific uncertainties outside the scope of this analysis6. Instead, the
maps are meant to define the initial response to sea level rise over the next several decades.
Those judgments incorporate state policies and regulations, local concerns, land-use data, and
general planning judgment. Although EPA hopes that this report can be used to estimate the
cumulative impacts of shoreline armoring, this analysis does not analyze whether hard structures,
soft engineering, or some hybrid of the two approaches is most likely. Those decisions will
depend on a variety of factors, including both economics and the evolution of shore protection
methods in Georgia.
3 Titus, J.G., "Rising Seas, Coastal Erosion and the Takings Clause: How to Save Wetlands and Beaches Without
Hurting Property Owners," Maryland Law Review, 57:1279-1399, 1998.
4 Titus, J.G., et al., "Greenhouse Effect and Sea level rise: The Cost of Holding Back the Sea,‖ Coastal Management,
19:171-204, 1991; and Yohe, G., "The Cost of Not Holding Back the Sea. Toward a National Sample of Economic
Vulnerability," Coastal Management 18:403-431. 1990.
5The analysis in the final review section, however, identifies those areas that would be protected under almost any
conceivable sea level rise scenario.
6For example, the sea could rise 10–20 feet over a period of several centuries if one of the world’s ice sheets were to
melt. See, e.g., IPCC (2001).

261
Within the study area, our maps use the following colors:
• Brown—areas that will almost certainly be protected if and when the sea rises enough to threaten it.
• Red—areas that will probably be protected, but where it is still reasonably possible that shores might retreat naturally if development patterns change or scientists were to demonstrate an ecological imperative to allow wetlands and beaches to migrate inland.
• Blue—areas that probably will not be protected, generally because property values are unlikely to justify protection of private lands, but in some cases because managers of publicly owned lands are likely to choose not to hold back the sea.
• Light Green—areas where existing policies would preclude holding back the sea. These areas include both publicly and privately owned lands held for conservation purposes.
Outside the study area, we generally show nontidal wetlands as purple and tidal wetlands as dark green. Table 1 shows preliminary estimates of the area of land close to sea level, including both dry land and nontidal wetlands but not tidal wetlands. Map 1 illustrates our statewide results.
Table 1. Area of Land Close to Sea Level by County (square kilometers)
Elevation relative to spring high water (meters) County 0.50 1.00 1.50 2.00 2.50 3.00 3.50 4.00 4.50 5.00Bryan * 23.1 37.5 58.2 99.8 122.3 176.2 215.5 251.3 310.2Camden * 148.4 191.9 228.3 326.0 386.2 510.6 601.5 782.8 873.9Chatham * 150.5 191.4 253.8 312.2 364.8 427.2 475.3 533.0 628.4Glynn * 74.0 119.1 165.5 315.6 368.0 459.5 577.7 635.5 663.2Liberty * 50.3 81.5 163.7 199.1 236.8 299.5 340.0 389.6 529.9McIntosh * 101.6 152.8 183.3 267.1 299.6 377.4 486.5 543.8 612.5Brantley * 0.1 0.1 0.6 1.1 3.0 7.0 11.4 16.5 21.4Charlton * 11.3 13.3 27.4 31.5 52.6 56.9 76.1 81.0 100.2Effingham * 1.0 1.1 1.4 2.0 3.2 4.9 7.3 13.5 18.8Long * 0.0 0.0 0.0 2.0 6.1 18.3 27.3 36.7 76.2Screven * 0.0 0.0 0.0 0.0 0.0 0.0 0.0 0.0 0.0Wayne * 0.1 1.0 1.9 8.2 10.7 19.8 23.5 29.6 33.6Total * 560.3 789.9 1083.9 1564.7 1853.4 2357.4 2842.1 3313.4 3868.4
* Given the precision error of the data and the lack of an error assessment, the authors recommended against reporting the area of land vulnerable to a 50 cm rise in sea level.
Source: TItus et al. (2009), using National Elevation Dataset and approach of Titus and Wang (2008).

262
Map 1. Likelihood of Shore Protection in Georgia. The darker shades represent land that is
either less than 2 meters above spring high water or within 300 meters of the shoreline.

263
Report Outline
The sections that follow describe the:
Methods by which we assess the likely sea level rise responses;
State policies that affect the management of coastal lands;
County-specific policies and trends that affect the likelihood of shore
protection, and other issues we discussed with county officials; and
Problems identified and map revisions made as a result of a final review of
the study by the EPA project manager.

264
METHODS
This study involved three phases:
1. In the initial phase, we met with state and local officials to create draft maps and
prepare a draft version of this report.
2. We then carried out a stakeholder review to ensure that the draft maps conveyed
planner expectation, and revised the maps accordingly.
3. We conducted a final review to ensure that the definitions of categories in our maps
conformed with the approach used by other states, while remaining consistent with the
assumptions provided by county planners.
Initial Phase
To understand Georgia’s likely sea level rise responses, we first researched state and county laws
and development plans to determine the policies that affect sea level rise responses.
Next, York Phillips, Teresa Concannon, and John Henry at Coastal Georgia RDC conducted
interviews with state regulators and county planners to investigate existing and anticipated
coastal policies and land uses. First, Phillips, Concannon, and Hudgens met with state and Glynn
County officials, who helped us define reasonable assumptions for the likelihood of protecting
specific land-use categories. Phillips and Concannon created a table7 listing those assumptions,
which the other counties reviewed when she met with them. Because the other counties
concurred with those assumptions, we used them as the basis for a set of draft maps that
characterized the likelihood that dry lands will be protected from rising sea level.
Local officials’ knowledge about local priorities and wishes allow us to glean broad policy
directions based upon land use. The procedure in the interviews was to discuss areas of
importance in each county that would merit some protection from a change in sea level. We also
discussed public access to the water, economic conditions, areas of cultural or historical
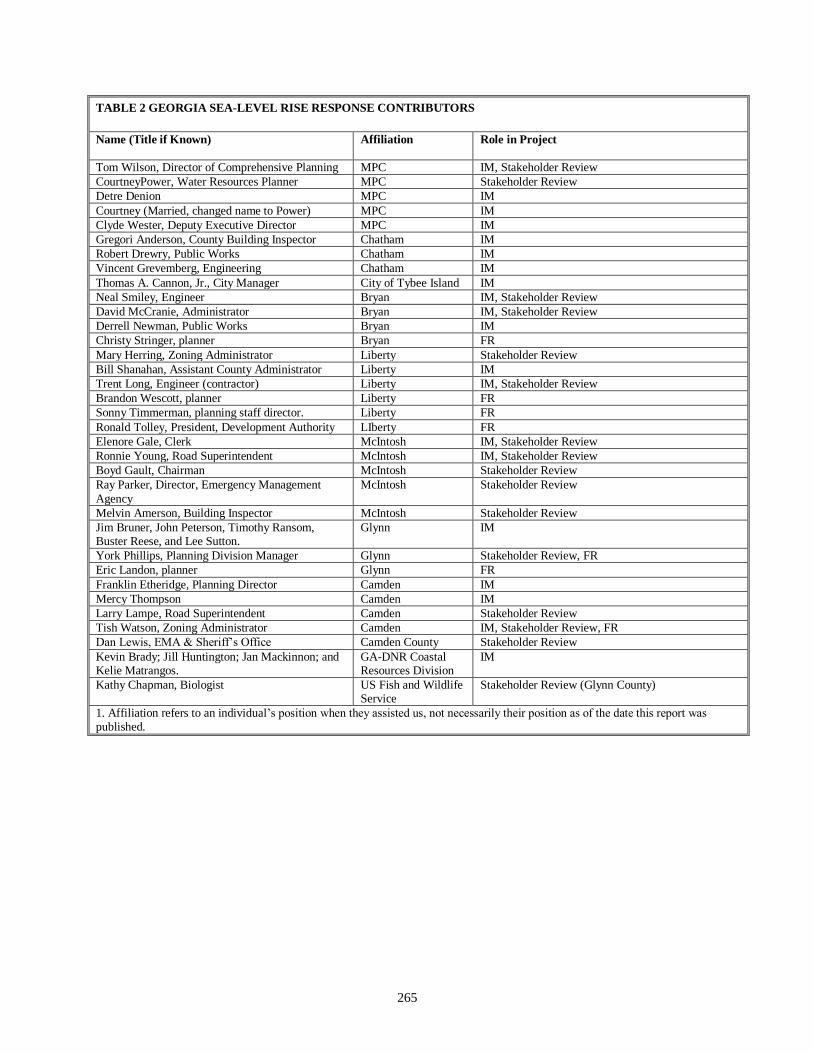
importance, and flood prone areas. Table 2 lists the participants.
After the meetings, the GIS department of Coastal Georgia RDC created draft maps and
Hudgens prepared a draft report, which explained the study up to that time.
Stakeholder Review
Nelson and Concannon conducted stakeholder review meetings with each county, obtaining
comments on the draft report and suggested revisions for the draft maps. Although the requested
changes to the report were relatively minor, most counties provided significant input to the map
revisions.
7 After revisions, that table is now the first two columns of Table 3 (excluding notes and text enclosed in
parentheses).
265
TABLE 2 GEORGIA SEA-LEVEL RISE RESPONSE CONTRIBUTORS
Name (Title if Known) Affiliation Role in Project
Tom Wilson, Director of Comprehensive Planning MPC IM, Stakeholder Review
CourtneyPower, Water Resources Planner MPC Stakeholder Review
Detre Denion MPC IM
Courtney (Married, changed name to Power) MPC IM
Clyde Wester, Deputy Executive Director MPC IM
Gregori Anderson, County Building Inspector Chatham IM
Robert Drewry, Public Works Chatham IM
Vincent Grevemberg, Engineering Chatham IM
Thomas A. Cannon, Jr., City Manager City of Tybee Island IM
Neal Smiley, Engineer Bryan IM, Stakeholder Review
David McCranie, Administrator Bryan IM, Stakeholder Review
Derrell Newman, Public Works Bryan IM
Christy Stringer, planner Bryan FR
Mary Herring, Zoning Administrator Liberty Stakeholder Review
Bill Shanahan, Assistant County Administrator Liberty IM
Trent Long, Engineer (contractor) Liberty IM, Stakeholder Review
Brandon Wescott, planner Liberty FR
Sonny Timmerman, planning staff director. Liberty FR
Ronald Tolley, President, Development Authority LIberty FR
Elenore Gale, Clerk McIntosh IM, Stakeholder Review
Ronnie Young, Road Superintendent McIntosh IM, Stakeholder Review
Boyd Gault, Chairman McIntosh Stakeholder Review
Ray Parker, Director, Emergency Management
Agency
McIntosh Stakeholder Review
Melvin Amerson, Building Inspector McIntosh Stakeholder Review
Jim Bruner, John Peterson, Timothy Ransom, Buster Reese, and Lee Sutton.
Glynn IM
York Phillips, Planning Division Manager Glynn Stakeholder Review, FR
Eric Landon, planner Glynn FR
Franklin Etheridge, Planning Director Camden IM
Mercy Thompson Camden IM
Larry Lampe, Road Superintendent Camden Stakeholder Review
Tish Watson, Zoning Administrator Camden IM, Stakeholder Review, FR
Dan Lewis, EMA & Sheriff’s Office Camden County Stakeholder Review
Kevin Brady; Jill Huntington; Jan Mackinnon; and Kelie Matrangos.
GA-DNR Coastal Resources Division
IM
Kathy Chapman, Biologist US Fish and Wildlife Service
Stakeholder Review (Glynn County)
1. Affiliation refers to an individual’s position when they assisted us, not necessarily their position as of the date this report was published.
266
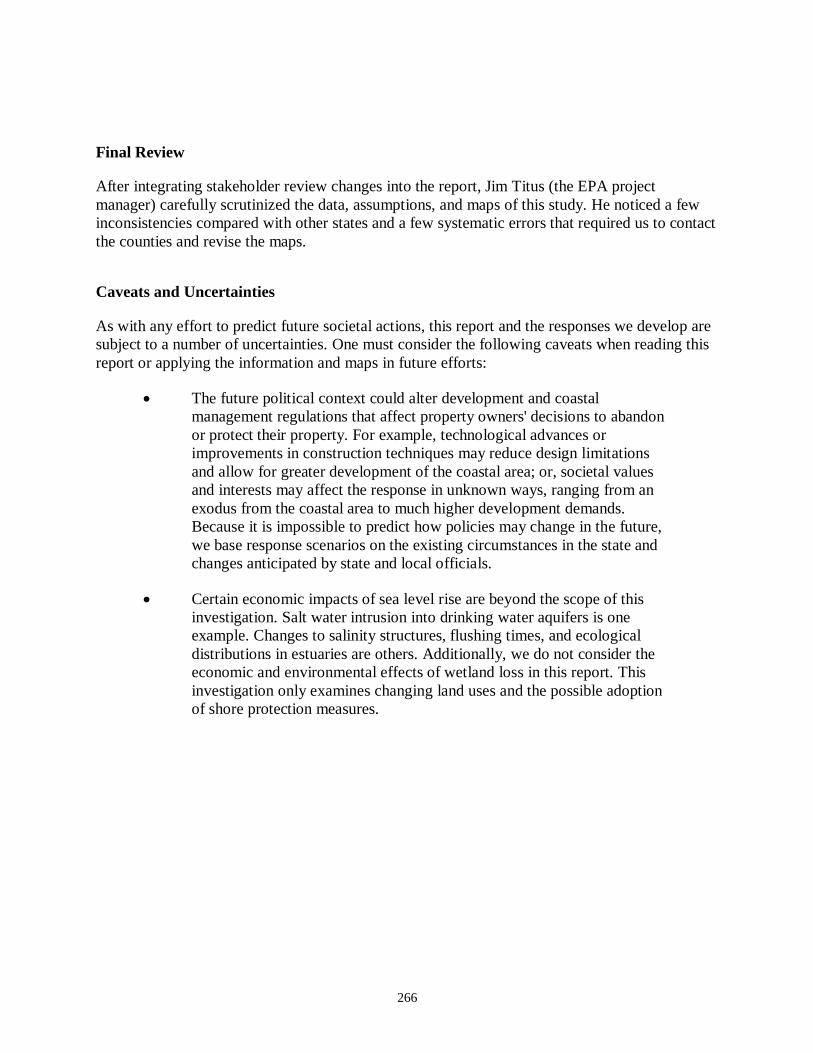
Final Review
After integrating stakeholder review changes into the report, Jim Titus (the EPA project
manager) carefully scrutinized the data, assumptions, and maps of this study. He noticed a few
inconsistencies compared with other states and a few systematic errors that required us to contact
the counties and revise the maps.
Caveats and Uncertainties
As with any effort to predict future societal actions, this report and the responses we develop are
subject to a number of uncertainties. One must consider the following caveats when reading this
report or applying the information and maps in future efforts:
The future political context could alter development and coastal
management regulations that affect property owners' decisions to abandon
or protect their property. For example, technological advances or
improvements in construction techniques may reduce design limitations
and allow for greater development of the coastal area; or, societal values
and interests may affect the response in unknown ways, ranging from an
exodus from the coastal area to much higher development demands.
Because it is impossible to predict how policies may change in the future,
we base response scenarios on the existing circumstances in the state and
changes anticipated by state and local officials.
Certain economic impacts of sea level rise are beyond the scope of this
investigation. Salt water intrusion into drinking water aquifers is one
example. Changes to salinity structures, flushing times, and ecological
distributions in estuaries are others. Additionally, we do not consider the
economic and environmental effects of wetland loss in this report. This
investigation only examines changing land uses and the possible adoption
of shore protection measures.

267
STATE POLICIES
In this section, we identify state regulations and policies that affect land use and the likelihood of
shoreline armoring and nourishment along Georgia’s coast. Based on these policies and state
planner input, we then outline anticipated state-wide responses to sea level rise.
Shore Protection Act
Enacted in 1992, the Shore Protection Act seeks to protect sand dunes and beaches. The act
requires property owners to obtain a permit to build a structure or alter the natural shoreline
topography and vegetation. The policies of this act apply to the ―dynamic dune field,‖8 which is
generally defined as the land between the high-water mark and the first tree at least 20 feet tall or
a structure that existed on July 1, 1979, whichever is the farthest seaward. As a result of the act's
wide scope, the state's Department of Natural Resources (DNR) maintains oversight over
development along the shore and can limit new development and significant enhancements to
structures, even in existing subdivisions. Additionally, the Act prohibits the use of vertical
seawalls -- only sloping seawalls are permitted.
Although public facilities are exempted from the act’s policies, the act does ban armoring of
shores along state and federal parks. Under the act, DNR also has additional powers to control
activities along the coast after emergencies such as major storms and hurricanes. DNR may
exercise one or more of the 12 emergency orders that include a 180-day moratorium on
nonessential construction as well as authorizations to place sand bags for erosion control and to
rebuild structures that were less than 80 percent destroyed.
Coastal Marshlands Protection Act
Georgia possesses vast coastal marshlands that provide habitat for wildlife, serve as a nursery for
commercially and recreationally important fish, and help to control flooding. To protect these
important natural areas, Georgia passed the Coastal Marshlands Protection Act in 1970. The act
authorizes the Coastal Resources Division (CRD) of DNR to regulate private property owners'
activities within tidal wetlands.9 CRD requires property owners to obtain permits to build and
expand structures, dredge, or fill tidal wetlands. The jurisdiction of the act extends to the
8According to Code 1981 § 2-5-232 (8), the dynamic dune ―means the dynamic area of beach and sand dunes,
varying in height and width, the ocean boundary of which extends to the ordinary high-water mark and the landward
boundary of which is the first occurrence either of a live native tree 20 feet in height or greater or of a structure
existing on July 1, 1979….If a real estate appraiser … determines that an existing structure …has been more than 80 percent destroyed by storm driven water or erosion, the landward boundary of the dynamic dune field shall be
determined as though such structure had not been in existence on July 1, 1979.‖
9The act also established the Coastal Marshlands Protection Committee, which is charged with reviewing all permit
requests and making decisions to grant or deny each request. The committee comprises the DNR commissioner and
two additional individuals chosen by the Board of Natural Resources.

268
intertidal area, mud flats, tidal water bottoms, and salt marshes within the estuarine area of the
state.
Many federal, state, and county actions are exempt from the act. Specifically, public roads,
drainage systems, drinking water, sewage, and utility networks may by constructed and
maintained within tidal wetlands without requiring permits.
Soil Erosion and Sedimentation Act
The Soil Erosion and Sedimentation Act establishes minimum standards for land-disturbing
activities that counties must enforce. Counties and municipalities must adopt comprehensive
ordinances that establish procedures for controlling land-disturbing activities. One requirement is
the installation of best management practices that avoid soil erosion caused by stormwater
runoff. Another aspect of the act requires that no land-disturbing activities be undertaken within
25 feet from state waters. Counties often extend this buffer to 50 feet from state waters.
Georgia Ports Authority Act
In 1945, the Georgia legislature created the Georgia Ports Authority to create, maintain, and
operate the state's ocean and river ports. The Ports Authority regulates activities within the ports
and seeks to maintain the nearby environment. As a state agency, the Ports Authority is exempt
from most of the state coastal management policies. Consequently, the Ports Authority will
continue to maintain shipping channels (dredge) as necessary, and will protect land-based
facilities through the construction of sea walls.

269
CREATING THE DRAFT MAPS
This section discusses the study area, the general statewide assumptions, and the data we used to
create the draft maps.
Study Area
This study follows the general approach of the sea level rise planning studies that EPA is
sponsoring along other Atlantic Coast states. In those studies, the study area consists of dry lands
that are either below the 20-foot (NGVD) elevation contour,10
or land within 1,000 feet of the
shore. Because the United States Geological Survey (USGS) maps in many areas along the
Atlantic Coast have contour intervals of either 10 or 20 feet, EPA had to use the 10- or 20-foot
contour to be certain that it included all the land that might be vulnerable. EPA concluded that
the 20-foot contour would be more appropriate than the 10-foot contour, for several reasons.
First, because of variations in tides and benchmark elevations, the 10-foot contour is only 6–7
feet above spring high tide in many areas. Second, under national map accuracy standards, 10
percent of the points along a 10-foot contour can be as low as 5 feet or as high as 15 feet. Third,
storm surges can already bring water levels up to approximately the 10-foot contour in many
areas. Fourth, the USGS maps in much of Georgia have a 2-meter contour interval, which allows
us to estimate the 20-foot contour (6 meters) but not the 10-foot contour. Finally, many
glaciologists believe that sea level could rise a few meters over the next few centuries. Generally
little or no additional effort was required to make the study area over-inclusive, while making the
study area under-inclusive might limit its usefulness. Users of this study can pick an elevation
and mask out lands above that elevation.
We also included land within 1,000 feet of tidal wetlands or open water, even if it is above the
20-ft contour, for two reasons. First, even high ground can erode as sea level rises. Second, we
wanted to ensure that the maps depict whether the shore is likely to be protected, even in areas
where the land directly threatened is too small to show up on a county-scale map.
General Statewide Assumptions
Table 3 provides the assumptions that we used to generate the draft and final set of maps. This
table assigns the likelihood of shore protection for various general categories of coastal lands.
We developed this table based on policies described in the previous section, during meetings
with the CRD of the Georgia DNR11
and officials from Glynn County. We were prepared to
apply a different set of assumptions for each county, but during our initial set of meetings with
10
Until recently, most topographic maps provided contours that measured elevation above the National Geodetic
Vertical Datum of 1929. That datum represented mean sea level for the tidal epoch that included 1929, at
approximately 20 stations around the United States. The mean water level varied at other locations relative to NGVD, and inland tidal waters are often 3–6 inches above mean sea level from water draining toward the ocean
through these rivers and bays. Because sea level has been rising, mean sea level is above NGVD29 almost
everywhere along the U.S. Atlantic Coast
11We identified ―anticipated response guidelines‖ based on personal correspondence with DNR Coastal Resources
Division staff (including Kevin Brady, Jill Huntington, Jan Mackinnon, and Kelie Matrangos).
270
other counties, the staff concurred with the general assumptions developed for Glynn County.12
Let us briefly examine our initial draft assumptions for the four shore protection scenarios; we
discuss the final assumptions in the section on Final Review.
Shore Protection Almost Certain. As we discuss below, state and county planners anticipate that
governments and private landowners will protect (e.g., through armoring or beach nourishment)
heavily developed areas, such as the City of Savannah and other industrial and commercial areas.
The state Department of Transportation (DOT) will also take measures necessary to protect the
major roadways along the coast. At a minimum, the evacuation routes will be elevated and
armored.
Shore Protection Likely. During the initial phase of the study, the state and county planners
viewed developable land, residential lands outside of urban areas, utilities, and infrastructure as
likely—but not certain—to be protected. Developable lands are not as certain to be protected as
existing development, because these lands remain undeveloped. But because development is
likely, the officials viewed shore protection as being likely as well—and assumption made by
similar studies in other states. More unusual was our initial assumption that most residential
areas and infrastructure was not almost certain to be protected. Officials generally doubted that
elected officials would be willing to fund the protection of coastal properties outside of the urban
areas; and along the open ocean, private shore protection is rarely sustainable over the long run.
Along estuaries, by contrast, private shore protection is generally cost-effective. Consequently,
during the initial and stakeholder review phases of this study, the officials with whom we spoke
generally considered the likelihood of protection for non-urban residential areas to be lower than
that of urban areas.13
Hence we show the residential category as only likely to be protected.
Given the potential for relocating the utilities and infrastructure in the corresponding areas, those
lands were also shown as only likely to be protected during the initial and stakeholder review
phases.
Shore Protection Unlikely. State and local officials generally agreed that agriculture and forest
lands are unlikely to be protected. Nevertheless, shore protection was at least possible because
some of these lands may be developed, while others may be extremely valuable in their current
use.
No Shore Protection.14
Parks and conservation lands (outside of urban areas) in Georgia
generally respond naturally to shore erosion. Shoreline areas of state and federal parks cannot be
armored. Shore Protection Act guidelines prohibit armoring of the shores of state and federal
12We discuss site-specific departures from those assumptions in the county-specific assumptions. The initial
meetings resulted in very few site-specific changes. Subsequent reviews, however, led to substantial changes and the
final review led to major changes.
13During the first two rounds of meetings with officials, the discussions tended to focus on whether public funds
will be available for shore protection. Meeting participants acknowledged that private landowners have in the past and could continue to protect their property without assistance from the state or counties. However, without public
funds, the planners noted a lower likelihood of protection compared to more urban areas where public funds would
likely be made available for shore protection.
14 The draft reports used the term ―protection illegal‖.

271
parks, according to the DNR. Therefore federal parks and state-owned lands, including state
beaches, are classified as no protection.
The draft reports mistakenly included two categories of private lands as no protection:
undevelopable lands and isolated forest districts.15
Undevelopable lands are mostly private agriculture and forest lands with high water
tables, which make the use of septic systems illegal. In several counties, these lands are
mostly nontidal wetlands (and hence excluded from our study area as wetlands). Our
erroneous premise was that shore protection permits cannot be issued for lands that can
not be legally developed.16
Isolated forests17
are located away from existing developed areas. Although development
was not expected in these areas, shore protection is still legal. During the initial phase of
the study, however, the authors mistakenly categorized these lands in the shore protection
illegal category.18
15Land use code ―FOR‖.
16Although shore protection of such areas is unlikely, it is not currently prohibited by government policies.
17Land use code ―FOR‖.
18Hudgens and Concannon agreed that the categorization was incorrect before stakeholder review and directed the
CGRDC GIS staff to change the land to shore protection unlikely. Unfortunately, no one made the change or noticed
that the categorization was still incorrect. As a result, this error was also included in the stakeholder review maps.

272
Table 3
GENERAL ASSUMPTIONS FOR LIKELIHOOD OF SHORE PROTECTION1
Land Use1 Likelihood of Shore Protection
Initial Meetings
(Draft Maps if Different)3
Final2
Commercial Lands Certain Certain
Industrial Lands Certain Certain
Urban Areas Certain Certain
Evacuation Routes and Transportation Corridors
Certain Certain
Residential Likely Certain
Public Infrastructure Likely Certain
Telecommunication and Utilities Likely Certain
Developable Lands4 Likely (N.A.) N.A.
Expected Future Development N.A.2 Likely
Military outside of Urban Areas N.A. Likely
Agriculture and Forest Districts Unlikely Unlikely5
Undevelopable Lands4 No Protection (N.A.) N.A.
Unused/Undeveloped Lands N.A. (No Protection)6 Unlikely
Isolated Forests (not in Districts) No Protection6 Unlikely
5
Parks, Recreation Areas, and Conservation. No Protection No Protection 1. See Table 4 for details on data sources. These decision rules were developed in conversations with the staffs of
the DNR Coastal Resources Division, and the planning department of Glynn County, and then applied statewide.
2. See Final Review section for further explanation. The original version of this table, included in the draft report,
consisted of the first two columns of this table, minus both the text in parentheses in the middle column and three
land use categories: future development, military, and unused/undeveloped lands.
3. The categories used in the draft maps diverged in a few cases from the assumptions suggested by meetings with
state and local officials. See text. 4. No data was available for this category. See Final Review section for discussion of what we did to identify
lands where future development is likely.
5. During the final review, we drafted maps showing these areas as likely to be protected and asked the counties
(other than Chatham) whether that was a reasonable assumption. While acknowledging the logic for doing so,
none of the counties favored such an assumption; hence the general assumption is shore protection unlikely. In
some counties, however, most of these lands were identified as areas of expected future development
6. This assumption was based on a misunderstanding of the data corrected during final review. See Final Review
section for more information.

273
Data and Map Creation
Table 4 shows the data we used to create the draft (and final) maps. The land use data in the first
two sources tracked the categories from our general assumptions (middle column of Table 3),
with two important exceptions: First, we had no data that specifically identify ―developable‖
lands. Therefore, we omitted that category when we made the draft maps.19
Second, the land use
data provides data on undeveloped lands; however, we mistakenly treated this category as
undevelopable.20
As discussed in the Final Review section of this report, we were not aware of
these two limitations until after the stakeholder review; thus, the final review was largely
devoted to identifying and implementing mapping corrections.
Table 4: SUMMARY OF GIS DATA APPLIED IN STUDY
Data Name Application in Study Source/Year Published
Conservation
Land
Used to identify lands that are held by the state, Federal
government, and private organizations for conservation
purposes and unlikely to receive shore protection.
Georgia Gap Project, Georgia
GIS Clearinghouse/ 1999
(1:24,000)
Land Use Used to identify currently developed lands within each county. Includes categories for: Commercial, Industrial, Urban,
Evacuation Routes, Transportation Corridors, Residential, Public
Infrastructure, Telecommunication and Utilities, Agriculture and
Forest Districts, Isolated Forests (not in Districts), Unused and
Undeveloped Lands
Produced by the Coastal Georgia RDC as part of the
coastal Georgia regional land
use map for the DCA/ 2000a
Future Land
Use (Chatham County only)
Added during the final review, used to identify existing
developed land; lands anticipated for future development (commercial, industrial, residential); and future conservation
lands.
Metropolitan Planning
Commission (MPC) 2005b
Roads Used to create 20-meter road buffers around major highways. CGRDC/2001 (1:24,000)
Evacuation Routes
Identifies emergency evacuation routes. Georgia Department of Transportation (via the Georgia
GIS Clearinghouse) / 1997
(1:24,000)
Wetlands Identifies tidal and non-tidal lands within the study area. NWI / 1981 through 2001
Study Area
Contours with elevation greater than and equal to 20’ were
selected and converted to polygons.
Georgia GIS Clearinghouse /
1996 (1:100,000)
County Boundaries
Identifies the borders of each county. Georgia Department of Community Affairs (via the
Georgia GIS Clearinghouse) /
2001 (1:100,000)
20The draft report misconstrued the Unused/Undeveloped and Vacant land use category in Coastal Georgia’s land
use data as being undevelopable land. See the Final Review section for additional details.

274
Table 4: SUMMARY OF GIS DATA APPLIED IN STUDY
Data Name Application in Study Source/Year Published
Notes: aCGRDC created the land use data based upon previous versions of land use data and Digital Orthophoto Quarter
Quads (1:12:000). CGRDC identifies the resulting resolution as "very accurate." Based on the density of vertices
in this layer, we assume that the resolution is at the scale of 1:100,000 or better. bMPC did not provide metadata with the Future Lands Use data. Based on the density of vertices in this layer, we
assume that the resolution is at the scale of 1:24,000 or better.
COUNTY-SPECIFIC RESPONSES: THE DRAFT MAPS
Figure 2 identifies the location of the six coastal counties included in this study and identifies
major cities and islands. In this section, we discuss our two sets of meetings with each county,
from north to south. During the initial set of meetings, we discussed both existing policies and
trends, and the likely prospects for responding to sea level rise. Table 5 lists the current policies
and trends we discussed. As the table shows, many of same issues arose in most of the meetings.
The implications of sea level rise involved more site-specific details, and hence the tables
summarizing those discussions are longer (see Appendix). During the stakeholder review
meetings, county officials made corrections to draft versions of Table 3 and the Appendix, and
suggested revisions to the draft maps that we had developed based on the original set of
meetings. Draft maps are presented as Figures in this section; final maps are presented as Maps
in the Final Review section.
Chatham County
Initial Meeting
Chatham County has more than 232,000 residents and is spread over 440 square miles.21
The
county is home to the historic City of Savannah as well as other heavily populated communities.
Along the northern border of Georgia, the beaches of Tybee Island are a major tourist attraction.
On Tybee Island, all new residential development is constructed on pilings. Structural fill to
elevate buildings is prohibited under the county flood mitigation plan, but fill is allowed for
general grading purposes.
Each year, the Environmental Protection Division of DNR receives applications for
approximately 60 shoreline alteration permits on Tybee Island. Sloping sea walls are allowed
under the Shore Protection Act, but not vertical sea walls, because they do not dissipate wave
energy and they increase shoreline erosion. Nourishment is allowed under the act, but is
generally conducted only as a private enterprise in Georgia. An application for funding or permit
of a seawall triggers a consultation under Section 7 of the Endangered Species Act. The purpose
of the consultation is to determine the effects of the construction on affected species. The
USFWS prefers carefully implemented renourishment to seawalls and revetments for the
viability of the sea turtle and plover populations, provided nourishment occurs outside of nesting
21
All population and county area data in this report are based on 2000 U.S. census data available
at http://quickfacts.census.gov/qfd/.

275
season. Even groins and breakwaters can limit the shifting of sand, which is necessary for the
successful feeding and nesting of plovers. 22
22
Change suggested during stakeholder review.

276
Figure 2. Georgia’s Coastal Counties
The county’s Soil Erosion & Sediment Control ordinance requires a buffer of 25 to 50 feet
(depending on location and date of development)23
from state waters. The County Greenspace
plan calls for acquisition of land adjoining existing open space. "Permanent protection" under
Greenspace rules requires land purchased with program funds to be maintained in a natural state.
All of these policies tend to increase land available for wetland migration compared to what it
would otherwise be.
23
Change suggested during stakeholder review (original text only mentioned 50-foot buffer).

277
The Appendix describes the county's anticipated response to sea level rise.24
Figure 3 shows the
draft shore protection map for Chatham County. The map suggests that the metropolitan area
surrounding Savannah will almost certainly be protected. Savannah Historic District is not
marked for protection by local ordinance. The state does not anticipate armoring the shorelines
near the state historic sites. However, county staff anticipate that the City of Savannah will
protect the historic area from sea level rise by constructing dikes along the Savannah River,
where it abuts the city. The County will maintain (elevate) roads to historic sites as well. County
planners also deem shoreline protection likely for the developed portions of Tybee and Skidaway
Islands, Dutch Island, Isle of Hope, and Modena.25
The county's major roads will almost certainly be protected to maintain state evacuation routes.
In particular, GS-80, which currently floods during high tides, is scheduled to be elevated and
widened—possible in 2007.26
Other evacuation routes include GA-204, GA-21, I-16 and U.S.17
(due to be widened to 4 lanes). County roads have a minimum elevation of 7.5 feet above mean
sea level, as required by GADOT. Officials expect these county roads to be maintained and
improved, as necessary, to maintain access to public and private property as sea level rise--
including the islands. The County will also accept responsibility for maintaining private roads on
a case-by-case basis. The county officials told us that most of the remaining areas in the county
were either wetlands or undevelopable, and are therefore not likely to be either developed or
protected. As we see in later sections, however, the officials may have been underestimating the
demand for development in coastal Georgia.
Stakeholder Review
During the stakeholder review meeting,27
the planning staff requested five changes to Figure 3:
1. Change Ossabow Island from red to light green. The island is a nature preserve and will not
be protected in the event of sea level rise.
2. Change Tybee Island from red to brown, to reflect the current and future efforts to protect the
development from erosion and flooding.
3. Change the Modena area, (4) Isle of Hope, and (5) Dutch Isle from red to brown. These areas
contain high-end development and the staff concluded that protection is almost certain.
24The Metropolitan Planning Commission (MPC) is a joint planning agency responsible for land use planning and
zoning for the City of Savannah and Chatham County. Anticipated responses within Savannah and Chatham County
are based on meetings and telephone conversations with MPC staff including Detre Denion, Courtney Reich, Clyde
Wester, and Tom Wilson (Director of Comprehensive Planning) as well as Chatham County staff Gregori Anderson,
Robert Drewry, and Vincent Grevemberg. Additionally, Thomas A. Cannon, Jr. who worked with the City of Tybee Island at the time of the initial meeting provided input on local responses.
25This characterization of shore protection likelihood is a departure from the general rule used by the initial draft
maps.
26Comment from stakeholder review meeting.
27June 11, 2003, at county offices.

278
The staff also noted that the Savannah National Wildlife Refuge is entirely tidal wetlands. Those
shores will not be protected. Because we used NWI data, which shows some of these areas to not
be tidal wetlands, we depict the refuge as a combination of tidal wetlands and no protection. The
staff also told us that a recent state–local economic development initiative has led to the
acquisition and clearing of a large (1,400 acres) site at the NE intersection of I-95 and I-16, for
use as an industrial park. Nevertheless, the County did not recommend that we change the map
from red to brown given the preliminary status of the project.
Figure 3. Draft Map of the Likelihood of Shore Protection in Chatham County. This map
was created based on our initial meeting, and reviewed during the stakeholder review meeting.
Bryan County
Initial Meeting
Located directly south of Chatham County and Savannah, Bryan County has more than 24,000
residents and nearly 450 square miles. Major communities in the county include Richmond Hill
and Pembroke. Operable rice paddy systems and tidal swamp (Sterling Creek) drain Richmond
Hill.
279
Large portions of the county are still undeveloped with significant agricultural and forested
lands. A countywide water and sewer service system is under consideration for the
unincorporated areas, and could help move development toward upland parts of the county.
The County will continue to acquire wetlands and marshes (through fee simple purchase or by
donations of easements) to supplement existing protected areas. These lands will supplement
drainage infrastructure and will help slow flooding in developed areas, because they will be
allowed to maintain their natural state either through inundation or conversion to wetlands.
Under current funding constraints, it is likely that land acquisition will be limited to slim
corridors of greenspace running alongside current riverine and wetland areas.
The Fort Stewart military installation encompasses a large area of land cutting across the middle
portion of the county, with a small portion within the study area.28
Figure 4 depicts our draft map
for Bryan County. The Appendix describes the county’s general approach to responding to sea
level rise.29
County planners anticipate that the Richmond Hill area will almost certainly be
protected; therefore, the initial draft maps depicted this area in brown rather than the blue that
would have resulted from the statewide assumptions listed in Table 3.30
Lands closer to ocean are
not developed extensively and county staff did not foresee significant development during the
next few decades. DNR staff do not expect to take action to armor or nourish beaches or dunes,
and County staff do not anticipate that either property owners or community groups will
undertake private nourishment efforts. Therefore those areas will not receive extensive protection
efforts, they said. The Environmental Protection Division of DNR currently issues approximately
six permits for seawall construction per year.
Ogeechee River is prone to flooding (at the oxbow), limiting access to Ft. McAllister via GA
Hwy 144. To control flooding, the Army Corps of Engineers is expected to continue the use of
riprap at the oxbow.
Stakeholder Review
After giving the county an opportunity to review Figure 4, we visited the planning staff for a
stakeholder review meeting.31
County staff noted that Bryan County’s flat topography is likely to
exacerbate the effects of sea level rise. To promote good drainage, the county is experimenting
with the use of porous, crushed concrete on unpaved roads. Little development is expected along
the coastal marsh area, and the County plans not to expend resources protecting what little
development does occur. 28Comment from stakeholder review meeting.
29Bryan County anticipated responses are based on a meeting with David McCranie (then-current administrator),
Derrell Newman, and Neil Smiley (engineer).
30This characterization of shore protection likelihood is a departure from the general rule used by the initial draft
maps.
31July 2, 2003 at the county offices.

280
Planning staff also told us that the areas closer to the ocean are becoming more attractive for
residential development, and at least one large mixed-use development is planned. Genesis
Pointe (at the eastern end of GA-144, past Fort McAllister) will have its own wastewater system
rather than septic tanks.32
The development will receive drinking water from Savannah River.
The Georgia DOT plans to expand Harris Trail to four lanes, and widen GA-144 east of Oak
Level Road. In addition, GA-144 may be elevated to better serve as an evacuation route. Because
of the relatively flat topography of the coastal plain, flooding is already a problem.
The County hopes to preserve wetlands and marshes along GA-144 through the county’s
Greenspace acquisition program. Finally, staff expects to see industrial park development along
Hwy 17, although the exact location is still unknown.
Despite these developments, the coastal area is overall sparsely developed, and county staff
expects it to remain that way for the foreseeable future. Therefore, the County sought no map
changes.
Figure 4. Draft map of the Likelihood of Shore Protection in Bryan County. This map was
created based on our initial meeting, and reviewed during the stakeholder review meeting
32County staff indicated that Genesis Point is east of Hwy. 144, near Oak Level Road, residing between the two
Wildlife Management Areas near Jake Brown Road and about 5 miles from the end of Highway 144 and about 3
miles south of the intersection of 144 and Spur 144. Oak Level Road is the main entrance road.

281
Liberty County
Initial Meeting
More than 61,000 people reside in the more than 519 square miles that constitute Liberty
County. The county has seven cities: Hinesville, Gum Branch, Walthourville, Flemington,
Allenhurst, Midway, and Riceboro. In addition, Fort Stewart is partially located within the
county. Fort Stewart is the Army's largest base east of the Mississippi River.33
Parks and open spaces owned by the city of Hinesville or the county are designated as
Recreation/Conservation (R/C) on the county land use map. Those areas include Wolf Island
National Wildlife Refuge and Wilderness Area, Blackbeard Island National Wildlife Refuge,
Lewis Island State Natural Area, Harris Neck National Wildlife Refuge, Sapelo Island National
Estuarine Sanctuary, Fort King George State Park, and R.J. Reynolds State Wildlife Refuge.
The Appendix provides details regarding the county's anticipated response to sea level rise.34
Figure 5 depicts the draft map we created based on our initial meeting with Liberty County. The
most heavily developed portion of the county surrounds the town of Hinesville and Fort Stewart,
which are almost certain to be protected. County planners also indicated that protection is likely,
but not certain in the residential areas of Riceboro and Midway. County officials indicated that
other lands will probably not have sufficient development to warrant shoreline protection. Lands
classified as agriculture or forestry are eligible for protection, but protection is unlikely. Much of
the land currently classified as vacant/undeveloped consists of wetlands and will not be
protected.
The County will maintain and improve its roads to maintain access to public and private
property. For example, the County anticipates taking efforts to protect infrastructure associated
with the industrial park planned for the area between Midway and I-95. The County will
maintain evacuation routes such as GA- 144, GA-119, GA-196, US-84, and US-17.
Stakeholder Review
After giving the county a chance to review Figure 5, we visited their offices for a stakeholder
review meeting.35
County staff pointed out areas where development is expected to accelerate.
Hampton Island, the now-famous holiday retreat of Ben Affleck, is an uplands area. County staff
do not anticipate that the county will take on responsibility for maintaining or elevating the
gravel road to the island. Development in the Half Moon marina will increase densities in an
33http://www.libertycounty.org/cities.html.
34Liberty County’s anticipated responses are based on an email from Bill Shanahan to Teresa Concannon and John
Henry on July 30, 2001, and telephone conversations between Trent Long (the county’s engineer) and Teresa
Concannon at a later, unrecorded date.
35June 11, 2003, at the county offices. This meeting included Mary Herring, zoning administrator.

282
existing developed area (in red, at eastern edge of county) and, so, the map was not changed. St.
Catherines Island (eastern edge of map) will not be developed, so we left that area as light green.
Yellow Bluff (just north of Half Moon) is undergoing development, but the staff considers it to
be an upland area, and we agreed that no map revision was required. A proposed industrial park,
just east of I-95, is also in an upland area. In sum, development is either taking the form of
increased density or construction in upland areas, and hence the stakeholder review resulted in
no map changes for Liberty County.
Figure 5. Draft Map of the Likelihood of Shore Protection in Liberty County. This map was
created based on our initial meeting, and reviewed during the stakeholder review meeting.
McIntosh County
Initial Meeting
McIntosh County is the state's second smallest (433 square miles) and has the smallest
population (11,000) of the six coastal counties. Points of interest in McIntosh County include the
City of Darien (which includes a riverfront park and an outlet shopping mall area), the Fort King
George Museum (built by the British in 1721), and Sapelo Island (a pristine barrier island 8
miles east of Darien).36
Less than 2 percent of the county is developed, and nearly 70 percent is 36http://www.mcintoshcounty.com/points.html.

283
commercially forested. Nevertheless, McIntosh County has recently experienced a surge in
residential development. Most of this new construction is concentrated in the northeastern
portion of the county. Planners expect that development trends will turn westward as the costs of
development near the water become prohibitive.
The Appendix provides details regarding the county's anticipated response to sea level rise.37
Figure 6 shows the draft map based on our initial meeting with McIntosh County officials. These
officials view the developed portion of Townsend as considered certain to be protected, while
other developed areas are likely to be protected (including Richmond Hill, Shellman Bluff,
Crescent, Meridian, and portions of Sapelo Island). The county's most populated town, Darien, is
mostly located above the 20-foot elevation contour38
and therefore we did not originally revise
the map to designate future shore protection.39
The County does not intend to assist private property owners in any efforts to protect structures
from sea level rise. Given the value of developed property in coastal Georgia, however, and the
state's policy of approving seawall permit applications, county officials believe that privately
funded protection of these lands is likely. Lands currently classified as agriculture and forest will
be converted to residential and commercial uses as development pressures increase and as sea
level rise becomes imminent. Local government offices that are located near the coast will
eventually be relocated westward to higher ground.
The County is committed to protecting its roads by elevating them when the threat of inundation
becomes apparent. It is unlikely, however, that the County will accept maintenance
responsibilities for private roads. There is no viable re-route option available for evacuation
routes, which include I-95, U.S. 17, and GA Hwy 57. DOT will maintain these evacuation
routes.
Stakeholder Review
After providing the county with an opportunity to review Figure 6, we revisited the county
offices.40
County staff noted that development is accelerating in the county with proposed and
active development efforts under way in Hird Island, within the Carnigan area (just north of
37McIntosh County anticipated responses are based on a meeting with Elenore Gale (county clerk) and Ronnie
Young (road superintendent).
38McIntosh 1992 Comprehensive Plan, Natural and Historic Resources, and Land Use.
39Coastal Georgia RDC’s land use database incorrectly showed Darien as undeveloped. The County and CGRDC
noticed its omission from the response map, but agreed that the omission was largely moot because most of the town is more than 1,000 feet from the shore and above the 20-foot contour. However, see the discussion in the final
review section, which details why we construe the county's comments as requiring us to change the blue to brown in
those portions of Darien that are within the study area.
40June 24, 2003. The meeting included Boyd Gault, chairman; Ray Parker, director, Emergency Management
Agency; and Melvin Amerson, building inspector.

284
Darien), in Baywood, Bellville, and Crescent, and in the Harris Neck–Shellman Bluff area. This
development could potentially include areas shown as nontidal wetlands on the planning maps
(as long as the proposals meet FEMA's elevation guidelines); however, the exact location of
those projects was not known. Because these areas were already red or, at the time considered
unlikely to receive protection assistance from the county,41
the map was not adjusted.
The County also pointed out that along the Altamaha River, much of the floodplain is owned or
managed by The Nature Conservancy or the state. Sapelo Island is sparsely populated, and much
of the land area is managed by the Department of Natural Resources.
Figure 6. Draft Map of the Likelihood of Shore Protection in McIntosh County. This map
was created based on our initial meeting, and reviewed during the stakeholder review meeting.
41The County and Coastal Georgia RDC assumed that the objective of these maps was to identify areas where
governments will bear the cost of shore protection. Hudgens (the co-author of the draft report) understood the
objective of this study, but did not realize that the low priority for government-subsidized shore protection was
offered as a justification for depicting some areas as no protection or protection unlikely. Therefore, as part of the
final review, we changed Harris Neck Shellman Bluff area from blue to red.

285
Glynn County
Initial Meeting
Glynn County is the second-most populated coastal county in Georgia with nearly 68,000
residents, but it is the smallest in area (422 square miles). Most of the county's residents live in
the City of Brunswick and on St. Simons Island. Tourism remains a popular industry within the
coastal communities of St. Simons and Jekyll islands.
The county’s Soil Erosion and Sediment Control ordinance requires a buffer of 50 feet from state
waters. The Comprehensive Plan requires septic systems to be at least 50 feet from the marsh.
The County plans additional sewer system expansions to pick up areas where older septic
systems are failing on St. Simons Island. A few decades may pass, however, before residents
have all been connected, given the additional costs.
Greenspace priorities for acquisition include marsh hammocks, flood control properties, soils
with low development potential, passive recreation lands, archaeological and historic resources,
trails and connectors, forested lands, and undeveloped barrier island properties. "Permanent
protection" under Greenspace rules requires land purchased with program funds to be maintained
in a natural state.
The Appendix provides details regarding the county's anticipated response to sea level rise.42
Figure 7 is the draft map that we developed based on our initial meeting. County planners
indicated that heavily developed portions of Brunswick and the industrial and commercial
portions of St. Simons and Sea islands are certain to be protected through the efforts of public
and private actors and funding sources.43
Given the value of developed property, and the state's
policy of approving seawall permit applications, privately funded protection of land will occur
on Sea Island and St. Simons Island. The Sea Island Company, which owns and develops Sea
Island, will almost certainly protect its properties through armoring and nourishment.44
DNR
staff do not expect to take action to armor or nourish beaches or dunes. However, the "Village"
(southern tip) area of St. Simons Island will be protected by the County with nourishment and
armoring, where appropriate. Moreover, shore stabilization structures are already prevalent on
private property on St. Simons Island. The Army Corps of Engineers plans to place sand
(dredged from shipping channels) on the southern end of St. Simons Island.45
It is likely that
some of this sand will accrete on the north end of Jekyll Island, due to wave action.
42 Glynn County anticipated responses are based on a meeting with Jim Bruner, John Peterson, Timothy Ransom,
Buster Reese, and Lee Sutton.
43 Despite the input provided by the county, the planning maps failed to show all developed lands within Brunswick
as almost certain to be protected. This mapping error was corrected during final review.
44This characterization of shore protection likelihood differs from the general rule used by the initial draft maps.
45This characterization of shore protection likelihood differs from the general rule used by the initial draft maps.

286
Although Jekyll Island is owned by the state (homeowners lease the land), county planners feel
that the developed portions of the island will be protected. The Jekyll Island Authority is
expected to protect and support the historic island club buildings, but the beach has never been
nourished. County staff expect the state to protect the historic Jekyll Island Club complex and
commercial areas. Protection is also likely in the island's residential areas.46
The county planners expected that remaining developed lands within the county are likely to be
protected. The draft map shows all residential lands as shore protection likely. The county
planners noted that agricultural and forested lands in the inland portion of the study area will
probably be converted to residential and commercial use in response to development pressures as
residents move inland from the waterfront areas. Furthermore, they expect these lands to be
protected.47
The County is committed to protecting its roads by elevating them when the threat of inundation
becomes apparent. Exceptionally high tides already affect roads connecting to the islands, so
action will be needed in the near term. The county commissioners would act on a case by case
basis to accept maintenance responsibilities for new or private roads, although a precedent has
been set. Pennick Road was damaged in a storm, and the County put in culverts and now must
maintain the road. Generally, if the County grades a road, or if a county school bus travels on it,
then the County must accept responsibility for that road's maintenance. All evacuation routes
will be maintained and protected by the county or DOT. This includes roads linking St. Simons
and Jekyll islands to the mainland, I-95, US 17, and westbound routes such as US 82/GA Hwy
520, GA Hwy 99, and US Hwy 25/341/GA Hwy 27.
Brunswick Historic District is not marked for protection by local ordinance. Historic Brunswick
will, however, benefit from protection efforts in commercial and industrial areas. Historic sites
on St. Simons will also benefit from efforts to protect valuable commercial and residential real
estate on the island.48
The existence of low-lying cemeteries will precipitate action at the county
level, perhaps leading to a discontinuation of the vault system. Shorelines near or surrounding
Jekyll Island State Park, Fort Frederica National Monument, Hofwyl-Broadfield Plantation State
Historic Site, and St. Simons Island Light House and Coast Guard Station will not be armored,
according to DNR.
Stakeholder Review
After giving staff an opportunity to review Figure 7, we visited the county offices.49
County staff
reported that St. Simons Island is less developed on the eastern shore than indicated by our map,
46
This characterization of shore protection likelihood difers from the general rule used by the initial draft maps.
47The draft maps failed to make this county-specific change. Following the general approach in Table 3, the draft
maps showed all agriculture and forest lands as shore protection unlikely. We corrected this error during the final
review, which further refined the County’s expectations for future development..
48This characterization of shore protection likelihood differs from the general rule used by the initial draft maps.
49June 3, 2003. York Phillips.

287
which showed that area as protection likely. No change to the map was made, however, because
the draft map showed heavily developed areas as brown; to show intervening areas as blue would
imply that inlet breaches were likely to form. The County also indicated that Jekyll Island is
more developed in the midsection area than our data indicated. Because this area is considered to
be a low priority for shore protection, the map was not changed.50
The County requested no
changes to the more inland areas.51
In addition, we learned that US Fish abd Wildlife staff are concerned about coastal nesting
grounds for sea turtles and the piping plover. As development continues along beaches, these
species are experiencing negative effects from encroachment. In an effort to document the effects
of encroachment, and to make better decisions with regard to permit (seawalls, etc.) issuance,
DNR is using GPS technology to map turtle nesting sites. Applications for permits undergo
―Section 7‖ (Endangered Species Act) consultation to determine the effects on species. Ms.
Chapman noted that carefully implemented beach renourishment (outside of nesting season) is
the preferred option from a sea turtle protection point of view. Seawalls are destructive to the
nesting piping plover population because they limit shifting sand.
Figure 7. Draft Map of the Likelihood of Shore Protection in Glynn County. This map was
created based on our initial meeting, and reviewed during the stakeholder review meeting. 50In the case of Jekyll Island, the County and Concannon assumed that the objective of these maps was to identify
areas where governments will bear the cost of shore protection, because the island is state-owned.
51Mr. Phillips later noticed that the draft map had failed to show some of the inland forests as likely to be protected,
as suggested during the first meeting with Bruner, Peterson, Ransom, Buster and Sutton.

288
Camden County
Initial Meeting
Approximately 44,000 people reside in the southernmost coastal county, which is also the largest
coastal county in Georgia (630 square miles). Major communities within Camden County
include Kingsland, Saint Marys, and Woodbine. The Kings Bay Naval Sub Base is also located
within the county.
The Environmental Protection Division of DNR oversees the required Soil Erosion and Sediment
controls. The ordinance requires a buffer for construction of 25 feet from state waters (100 feet
for trout streams). The Regional River Corridor Protection Plan, adopted by the County in 1994,
applies to development in the Satilla and St. Marys River corridors. The Greenspace plan lists
riparian corridors, passive recreation lands, archaeological and historic resources, and trails and
connectors as priority areas for acquisition. Permanent protection, under Greenspace program
rules, means that land purchased with program funds must be maintained in its natural state by a
land trust or government agency.
The Appendix lists the issues we discussed during our initial meeting with county officials
concerning the likely response to sea level rise. Figure 8 is the map that we developed based on
those initial discussions.52
The Kingsland, Woodbine, and St. Mary's areas are developed and
therefore the core commercial and institutional structures are almost certain to be protected. All
residential lands within the county are shown as likely to be protected. Given the undeveloped
nature of Cumberland Island and much of the central and western portions of the county,
protection is unlikely in most of the remaining areas.
Extensive new development is taking place in selected areas. For example, a Sea Island
Company-owned tract of land is to be developed into a high-end residential retreat. The land is
located in an area of the county above the 20-foot contour and, so, was not classified with regard
to likelihood of protection. Existing flooding problems with Highway 40 are being highlighted in
the county’s Hazard Mitigation Plan. New development planned for an area at the northern end
of the county (just south of where a finger of land protrudes into neighboring Glynn County) was
mistakenly thought to also be in an area completely above the 20-foot contour and therefore
outside of the study area. As a result, during the initial phase of the study, we originally showed
that site as unlikely to be protected. (Changes made during the final review led to showing this
area as a mixture of likely and certain to be protected.)
County planners also indicated that agriculture and silviculture are not vital to the county's
economic base, so residential development in the western, forested, portion of county is
considered likely. The planning maps, however, failed to incorporate this suggestion by the
52 Camden County anticipated responses are based on a meeting with Franklin Etheridge, Mercy Thompson, and
Tish Watson.

289
county. Later, during the final review this concept was integrated based on comments provided
by the county’s planning director. The impending opening of the Sidney Lanier bridge to
Brunswick will generate new residential development in the northeast portion of the county. A
proposed mixed use development at the south end of the bridge has recently received a favorable
review at the regional level.53
Given the value of this and other developed property and the state's
policy of approving seawall permit applications, privately funded protection of these lands is
almost certain.
Camden County Court House (Woodbine), Kingsland Historic District, and St. Marys Historic
District are not marked for protection from sea level rise or erosion. Shorelines surrounding the
Little Cumberland Island Light House will not be armored, according to DNR. Nor will the
County act to protect historic sites in St. Marys, Kingsland, and elsewhere in the county.
However, these sites will benefit from protection efforts in adjoining commercial and industrial
areas.
The military is likely to protect Kings Bay Submarine Support Base. Although the base is located
on high ground, above 20-foot elevation, it may need to be protected by armoring. Submarine
channels will be maintained and protected as necessary.
The County is committed to protecting its roads by elevating them when the threat of inundation
becomes apparent. It is unlikely, however, that the County will accept maintenance
responsibilities for private roads. There is no viable re-route option available for evacuation
routes, which include I-95, U.S. 17, GA Hwy 110, GA Hwy 252, and GA Hwy 40, which is
affected by flooding during high tide. DOT plans to elevate and widen portions of Hwy 40.
County-owned evacuation routes include Harriet's Bluff Road (currently affected by flooding)
and portions of St. Marys and Kings Bay roads. These roads will be elevated as necessary.
Stakeholder Review
After reviewing Figure 8, county staff noted that development is accelerating in specific areas.54
A large (10,000 units) development is proposed for the area around Woodbine, and a smaller
(700–1,000 units) development is proposed for the St. Andrews area along the Little Satilla River
(just below the sliver of land that projects into Glynn County). This area was shown in light
green and clearly has wetlands, but is located close to I-95 and is certain to be developed. Staff
does not anticipate that the County will expend resources to protect the area from sea level rise,
and hence we did not originally make the map change.55
53
This characterization of shore protection likelihood is a departure from the general rule used by the initial draft
maps.
54The final review meeting took place June 3, 2003, at the county offices.
55 During stakeholder review, the County and Coastal Georgia RDC assumed that the objective of these maps was to
identify areas where governments will bear the cost of shore protection. Hudgens (the co-author of the draft report)
understood the objective of this study, but did not realize that the low priority for government-subsidized shore
protection was offered as a justification for depicting this areas as protection unlikely. The extensive development

290
Additional development is expected to occur in the Cumberland Harbor area, but this was
already colored brown on the map. Staff noted that St. Marys has substantial storm-related
flooding and drainage concerns, and Hwy 40 is still a flooding hazard in the western portion of
the county. These issues are currently being addressed in the FEMA-mandated Hazard
Mitigation Plan.
The western third of the county was originally shown in light green on the map. The staff told us
that the land is in ―family ownership‖ and is considered to be stable and unlikely to be
developed.56
Figure 8. Draft Map of the Likelihood of Shore Protection in Camden County. This map
was created based on our initial meeting, and reviewed during the stakeholder review meeting.
expected by the county planner when contacted during the final review, however, changed this area to red along
with most of the coastal portion of the county.
56 As explained in the Methods and Final Review sections, Concannon assumed that these lands were legally
classified as ―undevelopable.‖ The Coastal Georgia GIS department had misunderstood her instructions: She asked
them to show ―undevelopable‖ lands as light green, and the GIS department showed ‖undeveloped and vacant
lands‖ as light green. The miscommunication within Coastal Georgia RDC was discovered in response to questions
from Titus during the final review.

291
FINAL REVIEW57
Purpose
To incorporate the stakeholder review, Hussain revised the maps and Hudgens revised the draft
report. Several months later, Titus (the EPA project manager) compared the draft to similar draft
reports from South Carolina and northeastern Florida. In addition, the EPA project manager
identified weakness in the study that required updates. This section examines the problems
identified and map revisions made during the final review. Table 3 compares our original and
final general assumptions.
Reclassified residential, utility, and infrastructure lands from protection likely to
protection almost certain
Identified land where planners anticipate future development, designated those lands as
protection likely, and revised the assumptions table to acknowledge that the land use data
do not include a category for ―developable‖ land;
Designated undeveloped land as protection unlikely instead of no protection and revised
the assumptions table to acknowledge that the land used data do not include a category
for ―undevelopable‖ land; and
Classified isolated forests—like other forests—as protection unlikely unless they are
likely to be developed.
We discuss each of these changes in turn. Table 7 provides additional details on how the final
maps were created.
Likelihood of Shore Protection for Residential Land, Utilities, and Infrastructure
Titus first noticed that the Georgia maps showed shore protection to be less likely than the South
Carolina and Florida maps assumed for similar areas while revising the draft to include the
stakeholder comments. He told the other authors that if this difference reflects actual
circumstances (e.g., policies less favorable to shore protection, lower land values, or higher shore
protection costs), then multistate maps would show the lower likelihood of shore protection in
Georgia, similar to portions of northeastern North Carolina. Before drawing such a conclusion,
however, he wanted to make sure that it did not simply result from our having applied the shore
protection categories differently.
Up to that point, we had considered this study only within the context of how it might be
incorporated into local land use planning and state coastal policies. We had not thought about
shore protection issues in the neighboring states or a need for national consistency. It was
immediately obvious to the Georgia authors (Concannon and Hussain) that if our maps were
presented as part of a national map, we would mislead people into thinking that shore protection
is less likely in Georgia than elsewhere.
57This section was drafted by the EPA project manager, Jim Titus

292
Most important, we had originally assumed that most residential areas along estuaries are
likely—but not certain—to be protected (red). By contrast, the other reports treat similar areas as
almost certain to be protected (brown). We do not believe that our assumptions reflect a greater
willingness in Georgia to yield neighborhoods to a rising sea than one finds in adjacent states.
More likely, this assumption resulted from a combination of our lack of future land use data and
the ordinal nature of the categories. Shore protection is more certain in the densely developed
urban areas than in the residential areas, and it would thus be understandable for planners to
depict residential areas in a different color, reflecting the reduced likelihood of shore protection.
In terms of EPA’s nationwide analysis, however, it would probably be more accurate to say that
shore protection is certain in the urban areas, and almost certain in the residential areas. That
distinction might be worth considering if a worst-case 20-foot rise in sea level were confronting
us over the next century. But given the intended use of this study (evaluating the likely impacts
of sea level rise and identifying areas for possible wetland migration or flood-mitigation
buyouts), both the urban and residential areas are almost certain to be protected. Titus contacted
planners from each of the counties, all of whom indicated that they now have almost no doubt
that people will protect homes rather than abandon them to the sea.58
Consequently, we changed
the general assumption to treat all existing residential areas as almost certain to be protected. We
made the same change for utilities and infrastructure as well.
Identifying Lands Likely to be Developed and Therefore Likely to be Protected
A more realistic distinction between protection likely and protection certain concerns the
undeveloped areas where development is expected. Given the modest sea level scenarios
considered in this study, those areas are much more likely to be protected than undeveloped areas
that are expected to remain as farms or forests. Yet shore protection is less likely in areas of
future development than in currently developed areas, because until an area is developed, it is
possible that development will not occur: The low land may be dedicated as a park or preserve as
part of a subdivision process, or purchased as part of a preservation effort. It is also possible that
the owners will choose not to develop it, or build homes with lots large enough for wetland
migration to be feasible. For these reasons, a key focus of the sea level rise planning studies is to
identify areas where development is expected, and the draft maps assigned ―developable‖ lands
as protection likely, or so we thought when we completed the stakeholder review.
At the beginning of the final review, however, Titus found a discrepancy between the maps and
the documentation in the draft reports. The circumstances that led to this oversight are
noteworthy—and possibly a useful caution to others. Titus and Hudgens thought that the draft
maps showed developable lands as protection likely. At the beginning of the study, Phillips and
Concannon created the precursor to Table 3, which defined the shore protection likelihood for
specific categories of land. Hudgens used Table 3 to prepare the draft report; and the CGRDC
GIS staff used it to prepare the maps. Titus received early drafts which he read, but did not
scrutinize.59
He looked at the maps and an early version of Table 3, which defined developable 58These conversations are cited in the discussion of county-specific final review changes, below.
59His primary concern about the drafts was that they lacked prose. The county-specific information was mostly in a
series of large tables, and a single table without explanatory prose described the map assumptions.

293
land as protection likely. Hudgens also believed that the maps included future development
because the table listed "developable" land as protection likely.60
Titus and Hudgens thought that
Table 3 was a list of data categories in the GIS.
Coastal Georgia RDC staff knew that the maps did not designate developable lands as protection
likely because the land use data did not include a category of developable lands. They did not
view Table 3 (which Hudgens had entitled ―State-Wide Decision Guidelines‖) as a list of data
categories in the GIS analysis, but rather as guidelines for the GIS analysts to use.61
A dataset on
developable lands was not available. Therefore, the GIS did not show developable lands as
protection likely. The draft report sent to the counties listed developable lands as shore
protection likely, but because planners know their counties, it seems unlikely that Table 3 misled
them about the contents of the maps.
Later, in reviewing Table 3, Titus noticed that forests and agriculture were designated protection
unlikely, but that developable lands were likely, while undevelopable lands were designated no
protection. Noting that most developable and undevelopable lands are either forests or
agriculture, Titus wondered how data conflicts were resolved. So he asked Hudgens (who asked
Concannon) which category applies to land that is both agriculture and developable (or
undevelopable). Only then did Hudgens and Titus learn that such a ―data conflict‖ never occurs
because the maps considered neither developable nor undevelopable lands. Table 3 showed what
we hoped to do, not what we had actually done.
Given the absence of data on developable land, the reclassification of residential, utilities, and
infrastructure62
meant that we had removed virtually all of the red (protection likely) from the
maps, except for a few military bases.63
Therefore, the primary task of the final review was to
identify land where protection is likely (red), that is, land where future development is likely.
Titus contacted county planners again and obtained either information on lands likely to be
developed or, for Chatham County, maps that illustrate anticipated future growth areas. We
integrated this information into the final maps to show anticipated future development in the
protection likely category, which we discuss in the county-specific sections that follow.
60In addition, Hudgens had discussed with Concannon the need to identify ―developable lands‖ where shore
protection is likely on several occasions.
61Concannon assumed that Hudgens understood the assumptions that went into the maps because they had discussed
the draft map procedures on several occasions.
62See the previous subsection, Likelihood of Shore Protection for Residential Land, Utilities, and Infrastructure.
63The general approach of this nationwide study is to not speculate on what the military will do with a given base,
other than to assume that the military will not give up to the sea a base in an urban area that is otherwise protected.
We do consult with local officials on what the use would be if the base closes. If the local officials indicate that the
land would be developed and protected if the base closed, then the land is shore protection certain whether or not the
base remains open. Otherwise, we color the bases red to highlight our hope for a DoD assessment of this issue.

294
"Undevelopable” and “Undeveloped” Lands
Table 3 had originally designated undevelopable land as no protection. But just as we had no
data on developable land, so we had no data on undevelopable land.64
However, the land use data
did have a category called Undeveloped/Vacant. The GIS staff reasoned that the land must be
undevelopable if it was not one of the other specified classes in the land use data. Therefore,
undeveloped/vacant land had been treated as no protection in the draft maps. We did not evaluate
the extent to which undeveloped lands are truly ―undevelopable‖ because even if they are
undevelopable, this category should be changed from no protection to
protection unlikely. The State of Georgia has no policy prohibiting shore protection of privately
owned undeveloped lands.
Fortunately, we were able to easily cure the lack of data on ―undevelopable‖ lands, because the
reality is that in Georgia almost all of the lands where shore protection cannot occur were already
identified by the conservation lands data layer. Our maps simply showed a category as light
green that should have been blue (or red if development is likely). Hence, we re-designated that
category as protection unlikely, while allowing newer information (discussed above) to over-ride
that designation.
Isolated Forests
The final review also led us to realize that it had been a mistake to identify isolated forests as no
protection. For purposes of development potential, the isolated forests that are not in forest
districts appear to be as likely to become developed as other forests. Therefore, the general
assumptions in our final analysis treat all forests the same, unless we have additional site-specific
information on the prospects for development.
Map Revisions
Table 6 provides the decision rules used to create the maps with the data we had during the final
review for all but Chatham County, which is documented in Table 7. Data conflicts are resolved
by the same ranking as the order in which the data categories are listed. For example, the
conservation layer is shown on top of the stakeholder review changes. Consequently, if a
stakeholder review polygon boundary does not conflicts with the boundary in the conservation
data layer, the maps use the boundaries from the conservation lands data layer. We take the
conservation layer over the stakeholder review polygons because the conservation data layer has
64 In this case, Titus, Hudgens, and Concannon were all under the impression that the draft maps had used a data
category for undevelopable lands.

295
a scale of 1:24,000, while our stakeholder review changes were based on annotations of maps
with scales on the order of 1:250,000.65
With those general corrections to the maps in our baseline, we re-approached the counties on
these limited issues, as we now describe in the county-specific sections.
Table 6
ASSUMPTIONS FOR GEORGIA SHORE PROTECTION MAP 1
Land Area Protection Likelihood Source
Evacuation Routes/Major Transportation Corridors
Certain Georgia roads
Conservation Lands (except Camden) No Protection Conservation lands
Bryan, Liberty, McIntosh, Glynn,
Camden counties: Ongoing development
and high-priority development
Certain
Final review, digitized by IEc at various
scales.
Expected Future Development Likely Final review, digitized by IEc at various
scales except Chatham County.4
Specific Areas identified during
Stakeholder Review
Varies; see county-
specific text
Digitized by CGRDC at a scale of
1:24,000
Military Lands Outside of Urban Areas2 Likely
Land use Commercial, Industrial, Recreational,
Public Infrastructure, Utilities and other
Urban Lands 3
Certain
Camden County: Conservation Lands5 No Protection Land use
Other Lands (Agriculture and Forest
Lands, Isolated Forests, and
Unused/Undeveloped Lands)6
Unlikely County boundary
Notes:
1. Where land areas overlap, classifications higher in the table take precedence.
2. Identified using distinct polygons within military installations that are coded as "Public, Institution", Hunter Army Airfield and Kings Bay Submarine Base are shown as brown because of their location in an urban
environment; remaining military lands are shown as red to reflect the uncertainty of protection.
3. Includes the following land use classifications: Commercial (COM); Industrial (IND); Public, Institution (PIN);
Residential (RES); and Transportation, Communication, Utilities (TCU).
4. See Table 6 for Chatham County
5. Delineated based upon land use code PRC (Parks, Recreation Areas, and Conservation)
6. Although the remaining lands are not delineated using land use data, these areas include land use classifications:
Agriculture (AGR), Agriculture and Forest (AGF), Forests (FOR), and Undeveloped/Unused (UND).
65Had the counties asked us to change particular areas from no protection to another designation, we would have had
to create a separate layer of stakeholder changes to conservation lands, which would be on top of the conservation
lands.

296
Chatham County
The previous mapping effort centered on defining the likelihood of shoreline protection for
specific areas based on the current land use. This led to a basic mapping guideline of existing
development as certain to be protected (brown) while the remaining land was either blue or light
green, depending on the extent to which the land is used for conservation purposes.
During the final review, Titus sought to integrate information on planned development and future
anticipated land use to identify areas where current land use would not warrant protection, but
anticipated future use would suggest a higher likelihood of protection. For Chatham County, he
identified the Metropolitan Planning Commission's new GIS data that provide updated existing
land use information as well as anticipated future land use within its jurisdiction. Teresa
Concannon of CGRDC obtained these draft data directly from MPC. IEc then made the
following map changes:
Lands designated with an anticipated future land use of commercial, industrial,
residential, downtown, and parks/recreational are displayed as protection likely
(red). To prevent the designated likelihood of shoreline protection from being
incorrectly reduced for existing development, this change was not applied to lands
considered almost certain to be protected under the initial and stakeholder review
maps.
Additionally, IEc used the MPC existing land use data to ensure that commercial,
office, industrial, residential, and public/institutional lands were displayed as
protection almost certain (brown).

297
Table 7 identifies the mapping assumptions applied to create the final Chatham County map
(Map 2).
Table 7
SHORE PROTECTION MAPPING APPROACH FOR CHATHAM COUNTY, GEORGIA1
Land Area Protection
Likelihood
Source
Evacuation Routes/Major Transportation
Corridors Certain
Georgia roads
Conservation Lands No Protection Conservation lands
Specific Areas identified during
Stakeholder Review
Varies -- See county-
specific text
Digitized by CGRDC at a scale of
1:24,000
Commercial, Industrial, Recreational,
Public Infrastructure, Utilities and other
Urban Lands 2
Certain Land use
Lands anticipated for future development3 Likely Future land use
All remaining lands (comprised of
Unused/Undeveloped and Isolated Forest
Lands from Land Use data) 4
Protection Unlikely County boundary
Notes:
1. Where land areas overlap, classifications higher in the table take precedence.
2. Includes the following land use classifications: Commercial (COM); Industrial (IND); Public, Institution (PIN);
Residential (RES); and Transportation, Communication, Utilities (TCU). 3. Includes the following future land use classifications: Commercial, Industrial, Residential, and
Parks/Recreation.
4. Although the remaining lands are not delineated using land use data, these areas include land use areas: Forest
(FOR) and Undeveloped/Unused (UND).

298
Map 2. Likelihood of Shore Protection in Chatham County. The darker shades represent
land that is either less than 2 meters above spring high water or within 300 meters of the
shoreline. Lands within our original study area but more than 5 meters above spring high water
using the USGS National Elevation Dataset are defined as outside study area here.

299
Bryan County
The planning staff referred us to planner Christy Stringer as the planner most familiar with future
development in the low areas of the county. She indicated that the county did not have any maps
or data that would be useful for our purposes of defining future development, but offered several
site-specific facts that our maps had omitted. Her comments implied the following changes:
1. Change the land at the end of Oak Level Road from blue to red. "In Bryan County we
have a 2000 acre development proposed for the end of Oak Level Road off of Hwy
144."66
2. Assume that the land along Belfast-Keller Road will probably be developed. "We also
have several developments in process off Belfast Keller Road. I don't see many other
developments in the near future because of the cap on water in South Bryan."
3. Change land along GA-144 south of Belfast from blue to red. ―Most of the land
[there] is owned by Rayonier and is being sold parcel-by-parcel.‖67
4. The land along US-17 will probably be developed commercially.68
Table 6 identifies the final mapping approach used for Bryan County (Map 3).
66
―development.‖ Email from Christy Stringer to Jim Titus April 22, 2005 (Discussing limited prospects for
development in Southern Bryan County)
67―RE: development in Bryan over 50-100 years.‖ Email from Christy Stringer to Jim Titus, April 22, 2005.
68 ―RE: development in Bryan over 50-100 years.‖ Email from Christy Stringer to Jim Titus, April 22, 2005.
Operationalized with a 1/2 mile red buffer on either side.

300
Map 3. Likelihood of Shore Protection in Bryan County. We show the entire study area
because the version used in Map 2 is more difficult to read.

301
Liberty County
We initially spoke with Ronald Tolley, president of the Liberty County Development Authority.
He told us that it made sense to him to assume that the agriculture and forest districts are more
likely to be developed than other lands because they tend to be higher and better drained.69
He
indicated that he would examine the maps, but as it turned out, we were unable to reconnect with
him during the following month.70
During that period, however, we were able to reach the staff of the recently created Liberty
County Consolidated Planning Commission. Our primary contact was Brandon Wescott, who
discussed the maps with Sonny Timmerman, staff director. Their first reaction was that using the
forest districts as a proxy for future development was not a very accurate way to project future
development, but that they had recently developed a map that does characterize their
expectations for future development.71
Our discussions of that map (both over the phone and via
email) resulted in the following recommended changes:
1. Show the Mid-Coast Business Center and depict it as protection certain. Commercial
development is being directed into this center, which has two separate sites separated by
about one mile and I-95.
2. Change the areas immediately surrounding (and between) the two sites of the Mid-Coast
Business Center from blue to brown. The areas along the I-95 interchange are also zoned
commercial, and the abundance of business centers is likely to support construction of
homes nearby.72
3. Show the planned Hampton Island Project as protection likely. The high-end
developments in this area tend to have conservation easements.73
4. Show Colonel’s Island and Yellow Bluff as protection likely. These areas are drawing
attention of developers.74
69―EPA Shore Protection Study (GA-Liberty).‖ Email from Jim Titus to Ronald Tolley, April 12, 2005
(summarizing conversation that afternoon).
70We called each of the next four Thursdays, and sent two additional emails.
71 ―Reply about development maps‖. Email from Brandon Wescott to Jim Titus May 6, 2005 (responding to email
asking whether the [forest districts] depicted in red really represent the areas where development is expected).
―Sonny and I both agreed that a lot of the areas in red are timber lands, and development does not seem to be
heading that way. That may change though. And also, we are noticing a lot of development heading down the
coastal area, especially high end development. I have attached a jpeg map that does a good job illustrating what we
are expecting in the near future.‖
72 ―Re: Replay about development maps—take 2.‖ Email from Brandon Wescott to Jim Titus, May 9, 2005
(answering questions about previously sent map depicting projected development, with specific areas of discussion
denoted on an attached map with index numbers).
73 Ibid.
74 Ibid

302
5. Show Ft. Stewart and the urbanized areas to its east as protection certain. The low-lying
areas in and adjacent to this military base are heavily developed and would be protected
even if the base were closed and converted to civilian use.
Table 6 identifies the final mapping approach used for Liberty County (Map 4).

303
Map 4. Likelihood of Shore Protection in Liberty County. We show the entire study area
because the version used in Map 2 is more difficult to read. .

304
McIntosh County
The county has no planning department. The clerk’s office told us that the comprehensive plan
was being developed, but that for the time being they would defer to the Coastal Georgia RDC,
which was likely to develop the comprehensive plan. We attempted to contact someone at
Coastal Georgia who might know what the comprehensive plan will say, but the planning
process has not yet started, and indeed the county’s contractor had not been officially selected.
Therefore, Coastal Georgia RDC recommended that the best that we could do along those lines
would be to use the previous comprehensive plan.75
Only a 1:600,000 scale hard copy map was
available. We therefore digitized the areas designated for future development and then
reclassified currently undeveloped lands within those areas as shore protection likely.
Table 6 identifies the final mapping approach used for McIntosh County (Map 5).
75
McIntosh 1992 Comprehensive Plan, Natural and Historic Resources, and Land Use.

305
Map 5. Likelihood of Shore Protection in McIntosh County. The darker shades represent land
that is either less than 2 meters above spring high water or within 300 meters of the shoreline.
Lands within our original study area but more than 5 meters above spring high water using the
USGS National Elevation Dataset are defined as outside study area here.

306
Glynn County
We had two conversations during the final review. The first conversation, with planning director
York Phillips, focused directly on the shore protection issue for barrier islands and marsh-front
development.76
Barrier Islands. Mr. Phillips said that St. Simons has development that might potentially be
worth protecting, but state funding is unlikely. There is no evidence yet that property owners
would collaborate on shore protection either (unlike the gated communities in South Carolina).
Therefore, we should put this in the "maybe" category, he said.
Jekyll Island is a state park that has a finite number of leased lots for shoreside cottages. As sea
level rises, it is more likely that the leased lot would simply be moved inland. Therefore, shore
protection is unlikely in the developed areas.
Sea Island does private beach nourishment. So it is reasonable to assume that property there will
continue to be protected and hence it is designated as protection certain.
Mr. Phillips added that there is a 10-foot bluff along much of the ocean shore, making homes
less vulnerable to flooding and slowing erosion rates. The bluffs may also make shore protection
more cost-effective than would otherwise be the case, since the higher ground provides greater
sand supply.
Marsh-Front Development. There is already a tendency to elevate homes on pilings, perhaps
parking cars underneath. When homes are not on pilings, often there will be some fill to ensure
that yard drains to the street—and homes must have a certain elevation to ensure sanitary
drainage. Homes are rarely if ever built in areas below the 6-foot NAVD given frequent
flooding at that level. Therefore, if we had a good way to identify undeveloped lands below the
6-foot NAVD along the marsh areas, it would be reasonable to designate them as shore
protection unlikely.
Future Development. We discussed future development with Eric Landon, planner II, Glynn
County who works for York Phillips. He said that the county’s future land use map matches the
existing zoning more closely than providing a projection of the future.77
As a guide to future
development, he suggested that it would be more useful to use the state’s traffic zone analysis of
projected development. He suggested the following changes to our maps.78
1. Change the blue to red on St. Simons Island. The island will probably be entirely
developed.
76See ―Sea Level Rise Study (GA-Glynn)‖. Email from Jim Titus to York Phillips, April 12, 2005 (summarizing conversation that afternoon between Titus and Phillips).
77 ―Glynn County, Georgia Mapping. Email from Eric Landon to Jim Titus, May 2, 2005.
78―Sea Level Rise Study—Glynn (GA)‖ Email from Jim Titus to Eric Landon, May 3, 2005 (summarizing the
outcome of a conversation that afternoon).

307
2. Change blue on Colonel's Island to red. It will probably be used by the port.
3. Change all undeveloped mainland areas east of I-95 from blue to red, protection likely,
except for the Federal Law Enforcement Training Center (FLETC).79
4. Change all blue within the City of Brunswick to red.
5. Examine the state’s Traffic Analysis Zone map published on the county web site. Change
blue within five polygons to brown. These five polygons all are expected to have fewer
than 400 additional households by 2030.
6. Again referring to the state’s Traffic Analysis Zone map, change all blue within four
polygons with 200–399 more households to red. Also change the blue within polygons
with 50–199 expected households from blue to red.
Map 6 shows the final study results for Glynn County.
79Thistraining center is mostly developed as well, and it is probably not practical for it to convert to wetlands
anyway. Because we are reluctant to ask local officials to speculate on the intentions of the federal government, we
show this area as red like military other secured installations.

308
Map 6. Likelihood of Shore Protection in Glynn County. Map 4. Likelihood of Shore
Protection in Liberty County. We show the entire study area because the version used in Map
2 is more difficult to read. ..

309

310
Camden County
We spoke with Tish Watson, planning director of Camden County, on three occasions, and also
carried on an email exchange. She indicated that she saw no reason to expect that anyone would
give up homes to the sea along estuarine shores.
Viewing the draft maps, her first comment was that all land east of US-17 is expected to be
developed, and in many cases development is imminent.80
She indicated that she could also make
some additional refinements after she returned from vacation. We made the changes that she
suggested81
and sent her a hard copy to review.82
Three weeks later, after examining the maps, she had several additional suggestions83
:
1. Change the NW and NE quadrants of I-95 and Dover Bluff Road to brown. The NW
quadrant will have 300 homes. The NE quadrant is Sanctuary Cove at St. Andrews
Sound, an upscale development with golf course.
2. Change land 1/4 mile on either side of Dover Bluff Road to brown. There are four
more s/d's in various stages of development and more are anticipated.
3. Change all usable land between Waverly Creek and White Oak to protection certain.
It is all developed or in the process of being developed.
4. Change the land within 1 mile of the new interchange of Horse Stamp Church Rd and
I-95 to brown. Major development is planned in response to this new interchange.
5. Change the entire area from Harrietta Bluff Road to Cumberland River (including
Grover Island) to brown. Sea Island Company has obtained rezoning for this entire
area.
80Telephone conversation between Jim Titus and Tish Watson, April 28, 2005. By ―east of US-17,‖ she included the
land north of US-17 to the north and east of Waverly, where northbound US-17 runs toward the east. The north-
south railroad that runs through Waverly parallels US-17 south of Waverly, but continues along a straight line to the north. We used the right of way to define lands east of US-17. In addition, we construed her suggestion as implying
that we should color the area between Greenville and Kingsland south of GA-40 red, as well as within the
immediate Kingsland area the triangle formed by the road that intersects GA-40 about 3 miles west of US-17.
81One of the challenges of this project is that after a conversation is over, one realizes what else he should have
asked to avoid ambiguities. We construed her suggestion as implying that we should color the area between
Greenville and Kingsland south of GA-40 red, as well as within the immediate Kingsland area the triangle formed
by the road that intersects GA-40 about 3 miles west of US-17.
82See ―Reminder on those Maps sent by EPA.‖ May 16, 2005, email from Jim Titus to Tish Watson (referring to
revised maps and asking for additional comments).
83See ―RE: Reminder on those Maps sent by EPA.‖ Email from Tish Watson to Jim Titus, May 27, 2005
(responding to Titus’ request to identify areas mapped in blue that are likely to be developed).
311
6. Change 1/4 mile on either side of GA 252 and 110 from US-17 to New Post Road to
brown.84
Map 7 shows the final study results for Camden County.
84C.f. ―RE: Reminder on those Maps sent by EPA—color code.‖ Email from Tish Watson to Jim Titus, June 1,
2005.

312
Map 7. Likelihood of Shore Protection in Camden County. Map 6. Likelihood of Shore
Protection in Glynn County. Map 4. Likelihood of Shore Protection in Liberty County.
We show the entire study area because the version used in Map 2 is more difficult to read.

313
APPENDIX A
DETAILS ON THE ANTICIPATED RESPONSES TO SEA LEVEL RISE IDENTIFIED
DURING THE STAKEHOLDER MEETINGS WITH COUNTY OFFICIALS
TABLE A1. CHATHAM COUNTY’S ANTICIPATED RESPONSE TO LEVEL RISE Land Use Response
Developed Areas
The valuable real estate that comprises the existing built area in the historic part of
Savannah, as well as on the islands, will almost certainly be protected by property
owners.
Skidaway Island will be protected because it is home to high end residential
development and research facilities.
Savannah will be forced to upgrade the existing drainage and gravity-fed stormwater system, which is already operating at maximum capacity. The upgrade will provide
some protection against the effects of sea level rise.
Residential development will continue to move west of Savannah into areas currently
zoned agriculture/forestry, although the development will be of a low density. Protection
is likely in this area.
The County will maintain roads and assist in protecting the commercial and industrial
enterprises that form the area's economic base, e.g., River Street in Savannah.
As a tourism-based economy, Tybee Island is not viable without nourishment. Given the
value of developed property and the state's policy of approving seawall/nourishment
permits, protection of developed portions is likely.
Public Facilities
In the short term, the county will protect local government offices that are currently
located in Savannah, which is vulnerable to sea level rise. However, it is likely that these facilities will eventually be consolidated in the northwestern, upland portion of the
county.
County and municipalities will expand capacity of surface water treatment plant, if
necessary, to treat water from aquifers that succumb to saltwater intrusion.
Transportation
Infrastructure
County roads will be maintained and improved, as necessary, to maintain access to
public and private property--including the islands.
The County will accept responsibility for maintaining private roads on a case by case
basis.
DOT is exempt from prohibition of the use of riprap, and will use it as necessary.
Beaches and Dunes
Tybee Island's beach has been nourished on numerous occasions since the 1970s. Corps
of Engineers dredge is dumped at the north end of Tybee Island.
Parts of Tybee Islands dunes are piping plover habitat. Piping plovers are an endangered species under the Federal Endangered Species Act. As a result, beach nourishment may
not be permitted in the future at those areas.
DNR staff do not expect to take action to armor or nourish beaches or dunes on state-
owned lands.
Parks and Open Spaces
Land classified as agriculture/forest is eligible for protection, but protection is unlikely.
The County will continue to acquire wetlands/marshes (through fee simple purchase or
by donations of easements) to supplement existing protected areas.
Historical and Cultural
Resources
Savannah Historic District is not marked for protection by local ordinance. The state
does not anticipate armoring the shorelines near the state historic sites. County staff,
however, anticipate that the City of Savannah will protect the historic area from sea level
rise by constructing dikes along the Savannah River, where it abuts the city. The County
will maintain (elevate) roads to historic sites.

314
TABLE A1. CHATHAM COUNTY’S ANTICIPATED RESPONSE TO LEVEL RISE Land Use Response
Military Lands/Bases
Hunter Army Air Field has the right to protect its facilities, which occupy a portion of
the upland area (above 20-foot elevation) in the north-central portion of the county.
Protection of this facility is almost certain, because the military is exempt from
applicable state regulations.

315
TABLE A2. BRYAN COUNTY’S ANTICIPATED RESPONSE TO SEA LEVEL RISE
Land Use Response
Developed Areas
Valuable high-end residential and commercial development around the Richmond Hill area will
certainly be protected by property owners.
The majority of new residential development in Bryan County occurs near Richmond Hill, in the
area south of GA Hwy 119 that is subject to a water withdrawal cap set by the Environmental
Protection Division of DNR. No new permits to withdraw water from the upper Floridian Aquifer
will be issued until at least 2006.
The Richmond Hill area is very vulnerable to sea level rise, but the County will commit only to
maintaining its roads.
Given the value of developed property and the state's policy of approving seawall permits, protection
of developed portions of the vulnerable areas is likely.
The Black Creek industrial park between I-16 and U.S. 280 in the northern (upland) end of Bryan
County is expected to produce a demand for conversion of nearby timberland to residential use, and
may relieve the development pressures in coastal Bryan County.
Public Facilities
In the short term, the County will protect local government offices that are currently located in
Richmond Hill, which is vulnerable to sea level rise. It is likely, however, that these facilities will
eventually be consolidated in the northwestern, upland portion of the county.
Fort Stewart, located north of the City of Richmond Hill, is likely to undertake some efforts at
protection, such as road elevation and building relocation.
Limited protection is likely throughout most of the developed, unincorporated, and Richmond Hill
municipal portions of the county.
Transportation
Infrastructure
County roads will be maintained and improved, as necessary, to maintain access to public and
private property.
The County currently obtains grading materials/dirt from DNR, and has a supply of (permeable)
crushed concrete for use in maintaining road shoulders.
DOT is exempt from prohibition on the use of riprap, and will use it as necessary.
County staff anticipate that the portion of GA Hwy 144 that is east of the flood-prone Ogeechee
River and west of Hwy 17 will be impossible to protect in the long term.
Beaches and Dunes
County staff do not expect the governing body to take action to protect beaches and dunes.
DNR staff do not expect to take action to armor or nourish beaches or dunes.
County staff do not anticipate that either property owners or community groups will undertake
private nourishment efforts.

316
TABLE A2. BRYAN COUNTY’S ANTICIPATED RESPONSE TO SEA LEVEL RISE
Land Use Response
Parks and Open Spaces
The County will continue to acquire wetlands/marshes (through fee simple purchase or by donations
of easements) to supplement existing protected areas. These lands will supplement drainage
infrastructure and will help slow flooding in developed areas, as they will be allowed to maintain
their natural state either through inundation or conversion to wetlands.
Under current funding constraints, it is likely that land acquisition will be limited to slim corridors of
greenspace running alongside current riverine/wetland areas.
Parks, recreation areas and conservation areas surrounding areas such as Fort McAllister are designated as Vacant/Undeveloped/Resource Protection (VURP) on the county land use map. Much
of the land currently classified VURP is wetlands, so protection is unlikely.
Historical and Cultural
Resources
Shorelines near/surrounding Fort McAllister, Kilkenny Plantation, Richmond Hill (Ford) Plantation,
and Strathy Hall will not be armored, according to DNR. The County will maintain and elevate roads to these facilities as long as possible.
Ogeechee River is prone to flooding (at the oxbow), limiting access to Ft. McAllister via GA Hwy
144. To control flooding, the Army Corps of Engineers is expected to continue the use of riprap at
the oxbow.
Military Lands/Bases
Fort Stewart Military Reservation has the right to protect its facilities, which stretch across the
north-central portion of the county.
Fort Stewart occupies a large proportion of the upland area (above 20-foot elevation) in the northern
portion of the county. The base is situated south of U.S. Hwy 280, and extends eastward to I-95.
Protection of this facility is almost certain because the military is exempt from applicable state
regulations.

317
TABLE A3. LIBERTY COUNTY’S ANTICIPATED RESPONSE TO SEA LEVEL RISE Land Use Response
Developed Areas Most residential development occurs around Hinesville and Fort Stewart. These lands
are almost certain to be protected. In other areas of the county, no large concentrations of
high-end development have occurred, and private property owners are not expected to
pursue aggressive protection measures.
An industrial park is planned for the area between Midway and I-95. The County
anticipates taking efforts to protect infrastructure associated with the industrial park.
The County will maintain its roads, but property owners will have to pay for protection of residences.
Any development in agriculture or forested areas will be of low density. Therefore,
protection of these lands is likely, but not certain.
Public Facilities
County facilities are located above the 20-foot elevation contour.
Limited protection is likely throughout most of the developed, unincorporated, and
municipal portions of the county.
Protection is likely, but not certain, in the municipalities of Riceboro and Midway. Fort
Stewart is located north of the City of Hinesville, and is situated on high ground.
Transportation
Infrastructure
County roads will be maintained and improved, as necessary, to maintain access to
public and private property.
County staff indicate that it is unlikely that the County will accept responsibility for
protection/elevation of private access roads.
Beaches and Dunes
County staff do not expect either private landowners or the governing body to take
action to protect beaches and dunes.
DNR staff do not expect to take action to armor or nourish beaches or dunes.
Parks and Open
Spaces
The County will continue to acquire wetlands/marshes (through fee simple purchase or
by donations of easements) to supplement existing protected areas. These lands will
supplement drainage infrastructure and will help slow flooding in developed areas,
because they will be allowed to maintain their natural state either through inundation or
conversion to wetlands.
Under current funding constraints, it is likely that land acquisition will be limited to slim
corridors of greenspace running alongside current riverine/wetland areas.
Much of the land currently classified as forest consists of wetlands, which will not be protected in any way.
Land classified as agriculture/forest is eligible for protection, but protection is unlikely.
Historical and Cultural
Resources
Shorelines at Fort Morris State Historic Site will not be armored, according to DNR. The
County will maintain/elevate roads to this, and other historic sites, as long as possible.
County staff do not anticipate that the governing body will accept responsibility for
protecting these sites.
Military Lands/Bases
Fort Stewart Military Reservation has the right to protect its facilities, which occupy a
large proportion of the upland area (above 20-foot elevation) in the northern portion of
the county. The base is situated north of GA Hwy 96. Protection of this facility is certain
because the military is exempt from applicable state regulations.
The base also includes a significant 100-year floodplain and is covered by wetlands.
Wetland migration at the southern portion of the base may be allowed to occur.

318
TABLE A4 McINTOSH COUNTY’S ANTICIPATED RESPONSE TO SEA LEVEL RISE
Land Use Response
Developed Area
McIntosh County is experiencing a surge in residential development. Most of this new
construction is concentrated in the northeastern portion of the county. The County does
not intend to assist private property owners in any efforts to protect structures from sea
level rise. However, given the value of developed property in coastal Georgia, and the
state's policy of approving seawall permit applications, privately funded protection of these lands is likely.
It is likely that development trends will turn westward as the costs of development near
the water become prohibitive.
Lands currently classified as agriculture and forest will be converted to residential and
commercial uses as development pressures increase and as sea level rise becomes
imminent.
Public Facilities
Local government offices that are located near the coast will eventually be relocated
westward to higher ground.
Limited protection of valuable property is likely throughout most of the current
municipal areas.
Transportation
Infrastructure
The County is committed to protecting its roads by elevating them when the threat of
inundation becomes apparent. It is unlikely, however, that the County will accept
maintenance responsibilities for private roads.
There is no viable re-route option available for evacuation routes, which include I-95,
U.S. 17, and GA Hwy 57. DOT will maintain these evacuation routes.
Beaches and Dunes
Sloping seawalls, which dissipate wave energy and do not increase shoreline erosion, are
allowed under the Shore Protection Act.
Nourishment is allowed under the Shore Protection Act, but is generally conducted only
as a private enterprise in Georgia.
An application for funding or permit of a seawall triggers a consultation under Section 7
of the Endangered Species Act. The purpose of the consultation is to determine the
effects of the construction on affected species. USFW notes that carefully implemented
renourishment is preferable for the viability of, e.g., sea turtle populations—if performed
outside of nesting season. In addition, sea walls and groins limit shifting of sand, which
is necessary for the successful feeding and nesting of plovers.
Parks and Open Spaces
The county land use map will be updated to illustrate the true designation/protection level of land. Expansion of R/C areas will act as protection (from development) for
existing wetlands.
Land classified as agriculture/forestry is eligible for protection, but protection is
unlikely.
Much of the land currently classified as vacant/undeveloped consists of wetlands and
will not be protected/armored.
Historical and Cultural
Resources
Historic Darien is predominantly located above the 20-foot elevation contour, but to the
extent necessary will benefit from privately funded protection efforts in commercial and
industrial areas.
Military Lands/Bases The military has the right to protect its bombing range along the western border of the
county. Protection is therefore deemed likely.

319
TABLE A5 GLYNN COUNTY’S ANTICIPATED RESPONSE TO SEA LEVEL RISE Land Use Response
Developed Areas
The County will bulkhead county roads, but it is not likely that the County will extend
protection measures to private roads or property. Exceptionally high tides already affect
roads connecting to the islands, so action will be needed in the near term.
In general, commercial and industrial areas are almost certain to be protected through the
efforts of public and private actors and funding sources. Given the value of developed property, and the state's policy of approving seawall permit applications, privately funded
protection of land will occur on Sea Island and St. Simons Island.
The Sea Island Company, which owns and develops Sea Island, will almost certainly protect
its properties through armoring and nourishment.
County staff anticipate that the state will almost certainly protect the historic Jekyll Island
Club complex and commercial areas. Protection is also likely in the island's residential areas;
here the land is leased from the state by homeowners.
Agricultural and forested lands in the western portion of the county will be converted to
residential and commercial use in response to development pressures and sea level rise.
These lands will likely be protected.
Public Facilities
County staff anticipate that public facilities/buildings undergoing construction or renovation
will be designed to withstand severe storms and higher water levels. It is likely, however, that these facilities will eventually be relocated westward to higher ground. The Federal Law
Enforcement Training Center (FLETC), located north of the City of Brunswick, is likely to
undergo some efforts at protection.
The existence of low-lying cemeteries will precipitate action at the county level, perhaps
leading to a discontinuation of the vault system.
Transportation
Infrastructure
The County is committed to protecting its roads by elevating them when the threat of
inundation becomes apparent.
The county commissioners would act on a case by case basis to accept maintenance
responsibilities for new/private roads, although a precedent has been set. Pennick Road was
damaged in a storm, and the County put in culverts and now must maintain the road.
Generally, if the County grades a road, or if a county school bus travels on it, then the
County must accept responsibility for that road's maintenance.
All evacuation routes will be maintained/protected by the county or DOT. This includes
roads linking St. Simons and Jekyll Islands to the mainland, I-95, U.S. 17, and westbound
routes such as US 82/GA Hwy 520, GA Hwy 99, and US Hwy 25/341/GA Hwy 27.
Beaches and Dunes
Sloping seawalls, which dissipate wave energy and do not increase shoreline erosion, are
allowed under the Shore Protection Act. Nourishment is allowed under the act, but is
generally conducted only as a private enterprise in Georgia.
An application for funding or permit of a seawall triggers a consultation under Section 7 of
the Endangered Species Act. The purpose of the consultation is to determine the effects of
the construction on affected species. USFW notes that carefully implemented renourishment
is preferable for the viability of, e.g., sea turtle populations—if performed outside of nesting
season. In addition, seawalls and groins limit shifting of sand, which is necessary for the successful feeding and nesting of plovers.
County staff do not expect the governing body to take action to protect beaches and dunes.
DNR staff do not expect to take action to armor or nourish beaches or dunes. However, shore
stabilization structures are already prevalent on private property on St. Simons Island.
The Army Corps of Engineers plans to place sand (dredged from shipping channels) on the
southern end of St. Simons Island. It is likely that some of this sand will accrete on the north
end of Jekyll Island, due to wave action.
The Sea Island Company, which owns substantial land and high-end real estate, is expected

320
TABLE A5 GLYNN COUNTY’S ANTICIPATED RESPONSE TO SEA LEVEL RISE Land Use Response
to protect its properties using armoring and beach nourishment, where applicable.
The "Village" (southern tip) area of St. Simons Island will be protected by the County with
nourishment and armoring, where appropriate.
Parks and Open Spaces
Greenspace priorities for acquisition include marsh hammocks, flood control properties, soils
with low development potential, passive recreation lands, archaeological and historic
resources, trails and connectors, forested lands, and undeveloped barrier island properties.
Permanent protection under Greenspace rules requires land purchased with program funds to be maintained in a natural state.
Shoreline areas of state/federal parks cannot be armored, per Shore Protection Act guidelines.
Much of the land currently classified as forest consists of wetlands, which will not be
protected in any way.
Land classified as agriculture/forest is eligible for protection, but protection is unlikely.
Parks, recreation areas, and conservation areas include Jekyll Island State Park, Hofwyl
Broadfield Plantation State Historic Site, and Fort Frederica National Monument. These sites
are wetlands, and protection is unlikely.
Historical and Cultural
Resources
Brunswick Historic District is not marked for protection by local ordinance. Historic
Brunswick will, however, benefit from protection efforts in commercial and industrial areas.
Historic sites on St. Simons will also benefit from efforts to protect valuable commercial and
residential real estate on the island.
Shorelines near/surrounding Jekyll Island State Park, Fort Frederica National Monument,
Hofwyl-Broadfield Plantation State Historic Site, St. Simons Island Light House, and Coast
Guard Station will not be armored, according to DNR.
The Jekyll Island Authority is expected to protect/support the historic island club buildings,
but the beach has never been nourished.

321
TABLE A6 CAMDEN COUNTY’S ANTICIPATED RESPONSE TO SEA LEVEL RISE
Land Use Response
Developed Areas
The County is considering a drainage study, in an effort to guide development, improve
drainage, and investigate options for reducing reliance on septic systems.
The County will maintain/elevate evacuation routes, but armoring in vulnerable residential and
commercial areas will be privately funded.
Agriculture/silviculture are not vital to the county's economic base, so residential development
in the western, forested, portion of county is considered likely. Protection of developed
residential lands is likely.
The impending opening of the Sidney Lanier bridge to Brunswick will generate new residential
development in the northeast portion of the county. A proposed mixed use development at the
south end of the bridge has recently received a favorable review at the regional level. Given the
value of this and other developed property and the state's policy of approving seawall permit
applications, privately funded protection of these lands is almost certain.
Public Facililties
Local government offices that are located near the coast will eventually be relocated westward
to higher ground.
Limited protection of valuable property is likely throughout most of the current municipal areas.
Transportation
Infrastructure
The County is committed to protecting its roads by elevating them when the threat of inundation
becomes apparent. It is unlikely, however, that the County will accept maintenance
responsibilities for private roads.
There is no viable re-route option available for evacuation routes, which include I-95, U.S. 17,
GA Hwy 110, GA Hwy 252, and GA Hwy 40, which is affected by flooding during high tide.
DOT plans to elevate and widen portions of Hwy 40. County-owned evacuation routes include
Harriet's Bluff Road (currently affected by flooding) and portions of St. Marys and Kings Bay
roads. These roads will be elevated as necessary.
Beaches and Dunes
The County is not likely to fund beach nourishment projects.
Parks and Open Spaces
The county land use map is being updated, and will illustrate the true designation/protection level of land. For example, lands acquired using state Greenspace funds will be classified PRO
(CP in zoning) and maintained in a natural state. These lands will act as protection (from
development) for existing wetlands.
Land classified as agriculture/forestry is eligible for protection, but protection is unlikely.
Much of the land currently classified as vacant/undeveloped consists of wetlands, and will not
be protected/armored.
Historical and Cultural
Resources
Camden County Court House (Woodbine), Kingsland Historic District, and St. Marys Historic
District are not marked for protection from sea level rise or erosion.
Shorelines surrounding the Little Cumberland Island Light House will not be armored,
according to DNR.
The County will not act to protect historic sites in St. Marys, Kingsland, and elsewhere in the
county. However, these sites will benefit from protection efforts in adjoining commercial and industrial areas.
Military Lands/Bases The military has the right to protect Kings Bay Submarine Support Base, which is located on
high ground, above 20-foot elevation. The base will be protected by armoring. Submarine
channels will be maintained/protected as necessary.

322
ACKNOWLEDGMENTS
This report was prepared under the direction of James G. Titus of the U.S. Environmental
Protection Agency, Office of Air and Radiation, Global Programs Division. Teresa Concannon,
John Henry, and York Phillips of the Coastal Georgia Regional Development Center (CGRDC)
interviewed land use planners and other representatives from the state and coastal counties,
obtained the data, and prepared the county-specific anticipated response tables. They also created
the original draft of Table 3, based largely on a statewide land use data set and decision rules
developed during conversations with state and local officials. Troy Nelson of the GIS
Department of CGRDC created the stakeholder review maps, using the assumptions in Table 3.
Daniel Hudgens of Industrial Economics, Inc. (IEc) participated in the initial meeting with
representatives from the state and Glynn County and drafted a report based on CGRDC’s
interview notes and discussions with Teresa Concannon. James Neumann of IEc reviewed and
edited that draft, and supervised Hudgens. Teresa Concannon distributed the draft report and
conducted stakeholder review meetings at county offices, attended by county staff and
representatives from other agencies, suggested changes to the draft report, and instructed the
CGRDC GIS department to revise the maps, as necessary.
Jim Titus revised the draft report to include the stakeholder review and add county-specific
discussions to the draft report. During those revisions, he concluded that a more in-depth final
review was necessary, which he conducted with assistance from Daniel Hudgens, Teresa
Concannon, and Mushtaq Hussain of the CGRDC’s GIS Department. Hussain prepared a
flattened GIS database that replicated the stakeholder review maps and incorporated additional
land use information. Daniel Hudgens modified those maps to correct a few incorrect
assumptions about the land use data. Titus obtained locations of projected development over the
phone and via email from all of the counties but Chatham, the only county that had an up-to-date
map of future land use. He devised a suggested procedure for that county’s land use data to
achieve the same ends. Teresa Concannon contacted Chatham County to obtain data and get final
feedback on the proposed final revision. Daniel Hudgens revised the maps with the assistance of
Andrew Hickok of IEc. Titus revised the draft originally prepared by Hudgens by writing
sections on methods, the general statewide approach, the county-specific sections on stakeholder
review and both statewide and county-specific sections concerning the final review; he also
revised the county-specific discussions of the initial phase of the study. Hudgens and Titus
passed the draft back and forth a half dozen times to ensure that the text correctly described the
maps and that the maps correctly implemented the suggestions of the county officials.
The authors thank the individuals listed in Table 2 for providing data, insights, and suggested
map changes.

References (metadata)
Office of Ocean and Coastal Resource Management and Georgia Department of NaturalResources, State of Georgia Coastal Management Program and Draft Environmental ImpactStatement, August 1997.
Intergovernmental Panel on Climate Change, 2001, Climate Change 2001: The Scientific Basis,Technical Summary of Working Group 1. Cambridge University Press, New York and London.
Titus J.G. and C. Richman, "Maps of Lands Vulnerable to Sea Level Rise: Modeled Elevationsalong the U.S. Atlantic and Gulf Coasts," Climate Research, 2001. 18:205–228.
Titus, J.G., D.E. Hudgens, D.L. Trescott, M. Craghan, W.H. Nuckols, C.H. Hershner, J. M.Kassakian, C.J. Linn, P.G. Merritt, T.M. McCue, J.F. O'Connell, J. Tanski, and J. Wang. 2009.
the U.S. Atlantic Coast. Environmental Research Letters. 4 (2009) 044008 (7pp).
Titus J.G., and J. Wang. 2008. Maps of Lands Close to Sea Level along the Middle AtlanticCoast of the United States: An Elevation Data Set to Use While Waiting for LIDAR. Section 1.1in: Background Documents Supporting Climate Change Science Program Synthesis andAssessment Product 4.1, J.G. Titus and E.M. Strange (eds.). EPA 430R07004. U.S. EPA,Washington, DC.
Titus, J.G., 1998, “Rising seas, coastal erosion and the takings clause: How to save wetlands andbeaches without hurting property owners,” Maryland Law Review 57:1279–1399.
Titus, J.G., et al., 1991, “Greenhouse effect and sea level rise: The cost of holding back the sea,”Coastal Management, 19:171-204;
Yohe, G., “The cost of not holding back the sea: Toward a national sample of economicvulnerability,” Coastal Management 18:403–431.
State and local governments plan for development of most land vulnerable to rising sea level along