Embed Size (px)
Citation preview

Georgia: Towards Green and Resilient GrowthECA Sustainable DevelopmentEnvironment, Natural Resources & Blue Economy
November 2020
Pub
lic D
iscl
osur
e A
utho
rized
Pub
lic D
iscl
osur
e A
utho
rized
Pub
lic D
iscl
osur
e A
utho
rized
Pub
lic D
iscl
osur
e A
utho
rized

© 2020 The World Bank1818 H Street NW, Washington DC 20433Telephone: 202-473-1000; Internet: www.worldbank.org
Photo: amazing mountain landscape of Georgia on a sunny summer day. Alpine green meadow in the Caucasian highlands. Idyllic valley in the Svaneti mountains.Author: Dzmitrock

Georgia: Towards Green and Resilient Growth
ECA Sustainable DevelopmentEnvironment, Natural Resources & Blue Economy

© 2020 The World Bank 1818 H Street NW, Washington DC 20433 Telephone: 202-473-1000; Internet: www.worldbank.org
Some rights reserved
This work is a product of the staff of The World Bank. The findings, interpretations, and conclusions expressed in this work do not necessarily reflect the views of the Executive Directors of The World Bank or the governments they represent. The World Bank does not guarantee the accuracy of the data included in this work. The boundaries, colors, denominations, and other information shown on any map in this work do not imply any judgment on the part of The World Bank concerning the legal status of any territory or the endorsement or acceptance of such boundaries.
Rights and Permissions
The material in this work is subject to copyright. Because The World Bank encourages dissemination of its knowledge, this work may be reproduced, in whole or in part, for noncommercial purposes as long as full attribution to this work is given.
Attribution
Please cite the work as follows: “World Bank. 2020. Georgia: Towards Green and Resilient Growth. © World Bank.”
All queries on rights and licenses, including subsidiary rights, should be addressed to World Bank Publications, The World Bank Group, 1818 H Street NW, Washington, DC 20433, USA; fax: 202-522-2625; e-mail: [email protected].

Georgia: Towards Green and Resilient Growth III
Contents
Acknowledgements . . . . . . . . . . . . . . . . . . . . . . . . . . . . . . . . . . . . . . . . . . . . . . . . . . . . . . . . . . . . . . . . . . . . . . V
Acronyms . . . . . . . . . . . . . . . . . . . . . . . . . . . . . . . . . . . . . . . . . . . . . . . . . . . . . . . . . . . . . . . . . . . . . . . . . . . . . . VI
Executive Summary . . . . . . . . . . . . . . . . . . . . . . . . . . . . . . . . . . . . . . . . . . . . . . . . . . . . . . . . . . . . . . . . . . . VIII
1. Introduction . . . . . . . . . . . . . . . . . . . . . . . . . . . . . . . . . . . . . . . . . . . . . . . . . . . . . . . . . . . . . . . . . . . . . . . . . . . 2
1.1. Economic, Social and Environment Context . . . . . . . . . . . . . . . . . . . . . . . . . . . . . . . . . . . . . . . . . . . 2
1.2. COVID-19 and Increased Uncertainty . . . . . . . . . . . . . . . . . . . . . . . . . . . . . . . . . . . . . . . . . . . . . . . . . 6
1.3. This Report: Towards Green and Resilient Growth . . . . . . . . . . . . . . . . . . . . . . . . . . . . . . . . . . . . . 7
2. The Cost of Environmental Degradation: Overview . . . . . . . . . . . . . . . . . . . . . . . . . . . . . . . . . . . . . . . . . 9
3.Land Degradation, Deforestation and Ecosystem Services . . . . . . . . . . . . . . . . . . . . . . . . . . . . . . . . . . .12
3.1.1. On-site Land Degradation . . . . . . . . . . . . . . . . . . . . . . . . . . . . . . . . . . . . . . . . . . . . . . . . . . . . . .13
3.1.2. Off-site Land Degradation . . . . . . . . . . . . . . . . . . . . . . . . . . . . . . . . . . . . . . . . . . . . . . . . . . . . .13
3.1.3. Deforestation and Ecosystem Services . . . . . . . . . . . . . . . . . . . . . . . . . . . . . . . . . . . . . . . . . 14
3.2. Social Impact of Land Degradation . . . . . . . . . . . . . . . . . . . . . . . . . . . . . . . . . . . . . . . . . . . . . . . . . .15
4. Coastal Zone Degradation . . . . . . . . . . . . . . . . . . . . . . . . . . . . . . . . . . . . . . . . . . . . . . . . . . . . . . . . . . . . . .17
5. Pollution . . . . . . . . . . . . . . . . . . . . . . . . . . . . . . . . . . . . . . . . . . . . . . . . . . . . . . . . . . . . . . . . . . . . . . . . . . . . .21
5.1. Air Pollution . . . . . . . . . . . . . . . . . . . . . . . . . . . . . . . . . . . . . . . . . . . . . . . . . . . . . . . . . . . . . . . . . . . . . .21
5.2. Exposure to Lead . . . . . . . . . . . . . . . . . . . . . . . . . . . . . . . . . . . . . . . . . . . . . . . . . . . . . . . . . . . . . . . . . 25
6. Government Response and Financing . . . . . . . . . . . . . . . . . . . . . . . . . . . . . . . . . . . . . . . . . . . . . . . . . . . 29
6.1. Current Legislation and Institutions . . . . . . . . . . . . . . . . . . . . . . . . . . . . . . . . . . . . . . . . . . . . . . . . 29
6.2. Implementation Efficiency . . . . . . . . . . . . . . . . . . . . . . . . . . . . . . . . . . . . . . . . . . . . . . . . . . . . . . . . 32
6.3. Financing . . . . . . . . . . . . . . . . . . . . . . . . . . . . . . . . . . . . . . . . . . . . . . . . . . . . . . . . . . . . . . . . . . . . . . 33
7.Enhancing Natural Capital: a Case-Study in the Forest Sector . . . . . . . . . . . . . . . . . . . . . . . . . . . . . . . 36
8. The Way Forward . . . . . . . . . . . . . . . . . . . . . . . . . . . . . . . . . . . . . . . . . . . . . . . . . . . . . . . . . . . . . . . . . . . . . 43
8.1. Sustainable Forest Management and Watershed Restoration . . . . . . . . . . . . . . . . . . . . . . . . . . 43
8.2. Reducing Coastal Vulnerability . . . . . . . . . . . . . . . . . . . . . . . . . . . . . . . . . . . . . . . . . . . . . . . . . . . . 45
8.3. Pollution Reduction . . . . . . . . . . . . . . . . . . . . . . . . . . . . . . . . . . . . . . . . . . . . . . . . . . . . . . . . . . . . . . 46
8.4. Harnessing the Private Sector . . . . . . . . . . . . . . . . . . . . . . . . . . . . . . . . . . . . . . . . . . . . . . . . . . . . . 47
8.5. Green Growth Strategy . . . . . . . . . . . . . . . . . . . . . . . . . . . . . . . . . . . . . . . . . . . . . . . . . . . . . . . . . . . 49
8.6. Sustainable COVID-19 Recovery . . . . . . . . . . . . . . . . . . . . . . . . . . . . . . . . . . . . . . . . . . . . . . . . . . . . 50
References . . . . . . . . . . . . . . . . . . . . . . . . . . . . . . . . . . . . . . . . . . . . . . . . . . . . . . . . . . . . . . . . . . . . . . . . . . . . . 52
Annexes . . . . . . . . . . . . . . . . . . . . . . . . . . . . . . . . . . . . . . . . . . . . . . . . . . . . . . . . . . . . . . . . . . . . . . . . . . . . . . . 57

Georgia: Towards Green and Resilient GrowthIV
List of figuresFigure 1.1 GDP Composition in Georgia (%, 2018) . . . . . . . . . . . . . . . . . . . . . . . . . . . . . . . . . . . . . . . . . . . . 3
Figure 1.2 Natural Capital in Georgia . . . . . . . . . . . . . . . . . . . . . . . . . . . . . . . . . . . . . . . . . . . . . . . . . . . . . . . 3
Figure 1.3 Sensitivity to Climate Change of Population Below the Poverty Line . . . . . . . . . . . . . . . . . . 4
Figure 1.4 Agricultural Productivity in Selected Former Soviet Union Countries (2000–2016) . . . . . . 5
Figure 1.5 Poverty Rate Trends in Georgia, 2008-2016 . . . . . . . . . . . . . . . . . . . . . . . . . . . . . . . . . . . . . . . . 6
Figure 3.1 Land Use in Georgia (% of land cover type in 2016) . . . . . . . . . . . . . . . . . . . . . . . . . . . . . . . . . .12
Figure 4.1 Coastal Zone in Georgia . . . . . . . . . . . . . . . . . . . . . . . . . . . . . . . . . . . . . . . . . . . . . . . . . . . . . . . . .17
Figure 4.2 Estimated Cost of Environmental Degradation in the Coastal Zone . . . . . . . . . . . . . . . . . . 19
Figure 5.1 Annual Ambient PM2.5 Levels in Georgian Cities – International Comparison. . . . . . . . . . 22
Figure 5.2 Annual Mortality by Cause and Age Group Attributed to PM2.5 Concentration in 2018 . . 23
Figure 5.3 Annual Mortality Due to PM2.5 Concentration – International Comparison . . . . . . . . . . . 23
Figure 5.4 Welfare Loss Associated with Exceedance of WHO Guideline
in Selected Countries, 2018 . . . . . . . . . . . . . . . . . . . . . . . . . . . . . . . . . . . . . . . . . . . . . . . . . . . . . 24
Figure 5.5 Blood Lead Level in Georgia, 2018 . . . . . . . . . . . . . . . . . . . . . . . . . . . . . . . . . . . . . . . . . . . . . . . . 26
Figure 5.6 The Annual Cost of Exposure to Lead (% GDP by the administrative region) . . . . . . . . . . . 27
Figure 6.1 National Environmental Expenditures . . . . . . . . . . . . . . . . . . . . . . . . . . . . . . . . . . . . . . . . . . . 33
Figure 6.2 Contribution to Environmental Expenditures from Development Partners . . . . . . . . . . . . 34
Figure 7.1 Fiscal Impact of Sector Reforms (taxes and fees, 2019–2023) . . . . . . . . . . . . . . . . . . . . . . . . 41
List of tablesTable 2.1 Estimated Annual CoED in Georgia (2012) . . . . . . . . . . . . . . . . . . . . . . . . . . . . . . . . . . . . . . . . . 9
Table 2.2 Estimated Annual CoED in Georgia (2018) . . . . . . . . . . . . . . . . . . . . . . . . . . . . . . . . . . . . . . . . 10
Table 5.1 Annual Welfare Loss of Ambient and Indoor Air Pollution Exceeding WHO Guideline. . . . 24
Table 5.2 Annual Impact of Lead Exposure . . . . . . . . . . . . . . . . . . . . . . . . . . . . . . . . . . . . . . . . . . . . . . . . 26
Table 6.1 Environmental Laws in Georgia in 2014-2020 . . . . . . . . . . . . . . . . . . . . . . . . . . . . . . . . . . . . . 30
Table 7.1 Forest Restoration by Method (1995-2017, ha) . . . . . . . . . . . . . . . . . . . . . . . . . . . . . . . . . . . . . 38
Table 8.1 Target Areas and Synergies between Different Options . . . . . . . . . . . . . . . . . . . . . . . . . . . . . 50
Table 8.2 Options for Mainstreaming Sustainability into COVID-19 Recovery . . . . . . . . . . . . . . . . . . .51
List of boxesBox 7.1 The ‘Social-Cut’ System in Georgia . . . . . . . . . . . . . . . . . . . . . . . . . . . . . . . . . . . . . . . . . . . . . . . 37
Box 7.2 Forest and Landscape Restoration Commitments in Georgia’s NDC . . . . . . . . . . . . . . . . . . 39
Box 8.1 Blue Economy in the Black Sea Basin. . . . . . . . . . . . . . . . . . . . . . . . . . . . . . . . . . . . . . . . . . . . . 46
Box 8.2 Public Policies and Private Sector Development: the Case of
Sustainable Wood Energy . . . . . . . . . . . . . . . . . . . . . . . . . . . . . . . . . . . . . . . . . . . . . . . . . . . . . . 48
Georgia: Towards Green and Resilient Growth V
Acknowledgements
This report was prepared by a World Bank team led by Tuukka Castrén (Senior Forest Specialist) and Elena Strukova Golub (Senior Economist), and included Darejan Kapanadze (Senior Environmental Specialist), Adriana Jordanova Damianova (Policy and Operations Consultant), Camilla Sophie Erencin (Economic Consultant), Blerian Ania (Voice Secondee), Nato Alhazishvili (Budgeting and Public Expenditure Consultant) and Irakli Kaviladze (Environmental Law and Regulations Consultant). The background paper on the Cost of Environmental Degradation of the Coastal Zone used in this report is authored by Paola Agostini (Lead Natural Resources Management Specialist), Darejan Kapanadze (Senior Environmental Specialist), Sergio Vallesi and Riccardo Scarpa (Consultants). Administrative support to the team rendered by Grace Aguilar and Linh Van Nguyen is gratefully acknowledged. Special thanks go to the following peer reviewers for their advice and comments that enriched the analysis: Berengere Prince (Lead Natural Resources Management Specialist), Tijen Arin (Senior Environmental Economist), Klas Sander (Senior Environmental Economist), Madhavi Pillar (Senior Natural Resource Management Specialist), Craig Meisner (Senior Environmental Economist) and Giovanni Ruta (Senior Environmental Economist). Advice and feedback from Abdulaziz Faghi (Program Leader), Steven N. Schonberger (Regional Director), Thomas Farole (Lead Economist), and Dorota Nowak (Country Program Coordinator) are gratefully acknowledged.
The team would like to thank Ms. Kseniya Lvovsky, Practice Manager, Environment, Natural Resources and Blue Economy for the Europe and Central Asia Region, and Sebastian-A Molineus, Regional Director for South Caucuses who provided valuable guidance to the team.
The team is grateful for the support, information and insights provided by officials of the Ministry of Environmental Protection and Agriculture of Georgia, and all stakeholders in Georgia who participated in the consultations.
Georgia: Towards Green and Resilient GrowthVI
Acronyms
AAP Ambient Air Pollution
ADB Asian Development Bank
AFD Agence Française de Développement
AIIB Asian Infrastructure Investment Bank
BAU Business as Usual
BLL Blood Lead Level
BSEC Black Sea Economic Cooperation
CEA Country Environmental Analysis
CO2 Carbon Dioxide
COPD Chronic Obstructive Pulmonary Disease
COVID-19 Coronavirus Disease 2019
DPO Development Policy Operation
ECA Europe and Central Asia
EGD European Green Deal
EIA Environmental Impact Assessment
ENPI European Neighborhood Partnership Instrument
ESF Environmental and Social Framework
EU European Union
FDI Foreign Direct Investment
FLEG Forest Law Enforcement and Governance
FY Fiscal Year
GBD Global Burden of Disease
GDP Gross Domestic Product
GEL Georgian Lari
GFCM General Fisheries Commission for Mediterranean
GHG Greenhouse Gas
GP Global Practice
HAP Household Air Pollution
HPP Hydropower Plant
IHD Ischemic Heart Disease
IMF International Monetary Fund
IQ Intelligence Quotient

Georgia: Towards Green and Resilient Growth VII
IUCN International Union for Conservation of Nature
KfW Kreditanstalt für Wiederaufbau
LRI Lower Respiratory Infection
MEPA Ministry of Environmental Protection and Agriculture
MW Megawatts
NDC Nationally Determined Contributions
NEA National Environmental Agency
NEAP-3 Third National Environmental Action Program
NFA National Forest Agency
NFC National Forest Concept
NGO Non-Governmental Organization
NO2 Nitrogen Oxide
NTFP Non-Timber Forest Product
O3 Ozone
OECD Organization for Economic Cooperation and Development
PAF Population Attributable Fraction
PM Particulate Matter
PM2.5 Particulate Matter with a diameter of less than 2.5 μm
PM10 Particulate Matter with a diameter of less than 10 μm
PPP Purchasing Power Parity
RR Relative Risk
SCD Systematic Country Diagnostic
SME Small and Medium Enterprises
SO2 Sulfur Dioxide
TA Technical Assistance
TDM Tons of Dry Matter
TEEB The Economics of Ecosystems and Biodiversity
USDA United States Department of Agriculture
US$ United States Dollar
VSL Value of Statistical Life
WHO World Health Organization
WTP Willingness-to-pay
WWF World Wildlife Fund
μg/m3 Microgram per Cubic Meter
Georgia: Towards Green and Resilient GrowthVIII
Executive Summary Background and Context
Georgia has made remarkable progress in terms of economic growth and poverty alleviation. Over the past 20 years, the country posted an impressive 5.4 percent growth in annual gross domestic product (GDP), with the tourism sector booming. In 2019, the country became an upper middle-income country. Poverty has declined overall, and a combination of new economic opportunities and favorable social policies has spurred welfare improvements. Yet, challenges persist as poverty and inequality remain high, especially in rural areas. The COVID-19 induced global recession has affected important sectors of the economy, including tourism and the travel industry. Real GDP growth is projected to drop sharply in 2020 in this challenging external environment.
Georgia’s endowment of natural resources is a significant source of national wealth and has the potential for accelerating inclusive socio-economic development. This report fills knowledge gaps in the upstream importance of environment and natural assets, and highlights areas for aligning national strategies with sustainable recovery from the COVID-19 pandemic. In so doing, the report aims to inform national policies by which Georgia has commitments to “greening” sector developments aligned with the provisions of the EU–Georgia Association Agreement. The analysis underlying the report includes updates to the cost of environmental degradation (CoED) published in 2015.1 It also reflects the new government priorities and options for addressing specific challenges in forest management, land and coastal degradation, and air pollution. The recommendations of this report are designed for a wider audience, including the Government of Georgia, as well as development partners and broader society.
Cost of Environmental Degradation
The analysis of the CoED points to trends of unsustainable resource use in Georgia. The updated CoED on agriculture and forest land, air quality, lead exposure, and Georgia’s coastal zone indicates negative effects on the country’s economy,2 with costs that include both direct costs and the lost economic opportunities from compromised future resource production potential. Land degradation leads to lower agricultural productivity and reduced potential for hydropower generation. The welfare losses associated with air pollution and lead exposure reduce human capital and negatively affect economic growth. The CoED results highlight the need for course-correction to address the systemic challenges of the depreciation of natural assets, while mitigating the socio-economic impacts of COVID-19.
1 World Bank. 2015. “Georgia – Country environmental analysis: institutional, economic, and poverty aspects of Georgia’s road to environmental sustainability (English).” Washington D.C.: The World Bank.
2 The annual CoED are measured in terms of percentages of GDP in 2018 to provide an “order of magnitude” information. The CoED estimates of impact areas cannot be added or compared directly, because of differences in methodological approaches and data availability.

Georgia: Towards Green and Resilient Growth IX
Estimated Annual CoED in Georgia (2018)3
Impact areaEstimated
Annual Cost of national GDP
in 2018– US$ million – – % –
Land Degradation- agricultural land 111 0.6Loss in agricultural productivity (croplands and pastures), loss of irrigated lands, sedimentation of hydroelectric power plant reservoirs, measured as productivity loss- forestland 16 0.1Loss in forest ecosystem services, applying forest values from the study in the Adjara regionPollution- ambient air pollution 180 1.0Impact of ambient air pollution (PM2.5) in exceedance of the World Health Organization’s guideline on health, valued with welfare loss methodology- household air pollution 380 2.2Impact of household air pollution (PM2.5) on health, valued with welfare loss methodology - lead exposure 530 3.0Loss in cognitive ability in children, valued with the loss of lifetime income
of coastal GDP in 2018– % –
Coastal Zone Degradation4
- fluvial flooding 56 2.8Damage to assets and economic productivity, valued with benefit transfer- coastal flooding 27 1.4Damage to assets and economic productivity, valued with benefit transfer- coastal erosion 7 0.4Damage to infrastructures, residential houses, tourism and other businesses, due to severe waves, storms and sea surges, valued at restoration cost- waste 3 0.2Damage due to uncollected municipal waste, damage due to inappropriate disposal of municipal waste, valued at the annual loss of property values- land degradation 4 0.2Loss of agricultural productivity and forest ecosystem services in the coastal zone
n4
3 All currency amounts in this report are given in US Dollars, unless otherwise stated.4 The estimates are based on World Bank. 2020d. “The Cost of Coastal Zone Degradation in the Country of Georgia. A tool
for the Coastal Zone Climate Adaptation Plan and the Nationally Determined Contributions.” Background technical paper. Forthcoming. Washington DC: The World Bank.
GDP percentage estimates for the coastal zone are adjusted to 2018 using a different methodology. Therefore, percentage estimates may differ from the World Bank technical background paper (World Bank. 2020d).

Georgia: Towards Green and Resilient GrowthX
The direct economic impact of land degradation is estimated at 0.7 percent of national GDP in 2018, which emphasizes the importance of mitigation actions. Agriculture and forest-based economic activities generate 7 percent of the country’s GDP, while providing 39 percent of total employment in 2018.5 A high level of land degradation is caused by the absence of an integrated approach, extensive land use and a lack of investments. The adverse effects of this impact both land and water users, and the biophysical conditions of landscapes, resulting in stagnant agricultural productivity, which is lower in Georgia than in any other country of the former Soviet Union.6 The annual cost of land degradation reduced agricultural GDP by 8 percent in 2018; it is estimated that the poverty gap for the population in the lowest income quintile would narrow by six percentage points if landscapes were to be restored in Georgia.
Coastal ecosystems that are important for the tourism sector have been affected by substantial environmental degradation. The economic cost of degradation in the eight coastal municipalities of Georgia is equivalent to 5 percent of the GDP produced in the coastal zone in 2018. The high economic cost of coastal degradation is associated with floods, pollution, loss of physical assets (including buildings, and transport and hospitality infrastructure) and damage to critical ecosystems (including beaches, forests, and river deltas). People residing on the coast are directly affected by coastal degradation that erodes land and agricultural topsoil, and damages dwellings and commercial buildings. Climate change and the increased variability of coastal weather, characterized by rising sea levels and more frequent and violent storms, exacerbate such impacts.
Solutions to air pollution will be particularly critical as life returns to its normal course in the post-pandemic economy. Georgia has a chance to chart a different course in reducing air pollution, which continues to have significant impacts on human health. The annual mortality attributable to ambient and indoor air pollution in 2018 is estimated at about 4,000 people, corresponding to a welfare loss of US$560 million,7 an equivalent of 3 percent of national GDP in 2018. Annual average concentrations of fine particulate matter (PM2.5) are higher than those considered safe for human health. Emissions from transportation, and dust from construction and other fugitive sources pollute ambient air in cities. People in rural areas continue to burn polluting fuels in their homes for cooking and heating. Exposure is particularly high among women, young children, and the elderly, who spend the most time indoors.
More attention is needed to understand the causes of lead contamination and act to address them. Based on one study available on the lead content in children, the economic cost of lead exposure could be as high as 3% of the national GDP. Lead has several health impacts, but a particularly significant one is reduced cognitive ability in children. Cognitive ability loss leads to reduced productivity and has long-term consequences for those affected. Given that Georgia banned the use of leaded gasoline in 2000, possible current sources of lead pollution and the persistence of children’s exposure to legacy pollution need to be further understood in order to develop an effective strategy of impact mitigation.
Climate change impacts in Georgia are seen in temperature increase and reduction of precipitation, with significant variability from year to year. The risk to the population’s wellbeing from climate change is estimated at an equivalent of 1.5-6.6 percent of Georgia’s national GDP.8 The likelihood of severe droughts will increase, particularly for the central areas of the country. Frequent occurrences of extreme weather will result in increased landslides, floods, avalanches, and mudflows that will affect agriculture, water resources, forests, coastal areas, public health and infrastructure. The southern and eastern regions are the areas expected to be hardest hit by high temperatures and prolonged heat waves. The rural population is most affected in the areas where climate change impacts further increase the costs of environmental and natural resource degradation.
5 Geostat. 2020c. “Employment and Unemployment.” https://www.geostat.ge/en/modules/categories/38/employment-and-unemployment. (accessed on August 19, 2020).
6 USDA. 2019. “International Agricultural Productivity.” https://www.ers.usda.gov/data-products/international-agricultural-productivity/.
7 The economic cost of ambient and indoor air pollution reflects health impacts from exceeding World Health Organization (WHO) guidelines for fine particles (PM2.5).
8 Hallegatte, S., A. Vogt-Schilb, M. Bangalore, and J. Rozenberg. 2017. “Unbreakable: Building the Resilience of the Poor in the Face of Natural Disasters”. Climate Change and Development Series. Washington DC: The World Bank.

Georgia: Towards Green and Resilient Growth XI
The Way Forward
Georgia has made significant progress in updating and reforming its national environmental legislation. However, more policy improvements will be needed to support increased investments and institutional development, including for “effective adaption and implementation of key environmental legislation”.9 The effective enforcement of environmental laws requires supporting regulations and norms, as well as enhanced implementation capacity and clear institutional mandates, primarily from the Ministry of Environmental Protection and Agriculture (MEPA). Furthermore, increased technical and financial capacities of the public and private sectors for adherence to environmental regulations is needed. Some aspects of environmental management have benefited from financial support from state and local authorities as well as from international development partners, the latter estimated at 39-47 percent of total environmental expenditures at the national level. Most of these funds were allocated for solid waste management. Other sectors responsible for most of the annual CoED received less attention from international and bilateral donors, as preliminary analysis suggests.
Putting Georgia on the path of sustainable and greener development will require a targeted mix of enabling policies, incentives, and public investments. These are needed both to address the structural challenges in the Georgian economy and to support post-COVID-19 recovery. The CoED analysis indicates a loss of economic activity and potential fiscal revenue that can be avoided by addressing market failures and strengthening natural resource management policies and practices. The study focuses on four areas where public actions could reduce bottlenecks and mitigate the pressure on resources while contributing to green growth transition:
1. Strengthening forest and landscape management;2. Sustainable development of the coastal zone;3. Pollution management; and4. Building a multisectoral approach to sustainable development, engaging the private sector and green
recovery from COVID-19 pandemic.
Government programs for forest and landscape management could target mutually reinforcing and complementary interventions, including institutional development and watershed restoration. Firstly, the support to national and local forest institutions, forest management, forest-base livelihoods, and sector reform at national level will have to enable the implementation of the newly adopted Forest Code (May 2020). Secondly, these programs need to facilitate geographically more targeted interventions for the rehabilitation and improved management of degraded watersheds, particularly in the eastern parts of the country. Addressing environmental degradation, especially in lagging regions, would improve socio-economic opportunities and development outcomes. Support for rehabilitation and improved management of degraded watersheds would require investments in land management, landscape restoration, management capacity and small-scale infrastructure to improve the environmental services provided by the region’s watersheds.
To reduce impacts of natural hazards and minimize economic losses, coastal zone development plans need to focus on the diverse environmental issues of Georgia’s Black Sea coast. The allocation of Government resources needs to be consistent with climate change adaptation and planning priorities for coastal Georgia, with a focus on reducing the impacts of extreme weather events. This should include hazard identification, risk assessment and analysis, and the development of modern prevention and monitoring systems. A “climate resilient” coastal zone development program would consist of targeted investments that would support flood and other natural hazard management and mitigation, prevention of coastal erosion, landscape restoration and waste management. The key reference point for designing such investment programs would be the National Action Plan for climate change adaptation in coastal areas, developed with assistance from the Nationally Defined Contribution Support Facility (NDC SF).10 The estimated investment needs of the coastal area adaptation program are about US$600 million.
9 World Bank. 2020a. “Analysis of Gaps between National Legislation of Georgia and World Bank Environmental and Social Framework.” Washington DC: The World Bank.
10 NDC SF grant administered by the World Bank.
Georgia: Towards Green and Resilient GrowthXII
Addressing air pollution and reducing lead exposure could improve human health and generate economic gains. Air pollution contributes to multiple negative health impacts, including ischemic heart diseases and stroke. Lead exposure has a detrimental impact on the cognitive abilities of children. By supporting a major survey to identify blood led level in children, Georgia has taken an important step towards improving the monitoring of ambient air pollution (AAP) and identifying hazards from lead exposure. The next steps are to establish major sources of pollution, separately for each contaminated zone; develop locally specific short-, medium-, and long-term measures to reduce pollution; and adopt policy and institutional reforms to align pollution levels with internationally accepted standards. As most institutions are sector-based, policies and institutional reforms should enhance cross-sectoral capacities and measures, while investments to control pollution must be based on an inclusive and cross-sectoral strategy.
Georgia can enhance productivity-led growth based on the sustainable use of natural resources, strengthened environmental management and inclusiveness. Growth in Georgia is not fully inclusive, and poor rural communities do not enjoy its benefits in the same way as the urban population. A large part of the population is involved in low-productivity agriculture: 39 percent of total employment is in agriculture though only 8 percent of GDP stems from agriculture, forestry and fishery.11 Tourism employed around 150,000 people in 2019, contributing about 7 percent of national GDP12 but is also one of the sectors most affected by the global COVID-19 pandemic. Nature-based tourism depends on sustainable natural resource and landscape management. Likewise, coastal tourism in Georgia depends on maintaining the essential ecological functions of the Black Sea and coastal areas.
Georgia will benefit from developing a “Green Growth Development Policy” that is climate-resilient and based on sustainable natural resource use, high productivity, and the circular economy. The government of Georgia has an ambitious yet incomplete environmental agenda. On the one hand, a “whole-of-government” approach to sustainability would focus on low carbon development that creates jobs and provides co-benefits in reducing waste and pollution, congestion, and improving health outcomes. On the other hand, the approach would be aimed at protecting biodiversity and ecosystem services to sustain the natural resource base of the economy. It would need to cover traditionally relevant “environmental” sectors (e.g. nature protection, pollution management, landscape and natural resource management), as well as all aspects of public policy (e.g. taxation and subsidies, public procurement, infrastructure design and business development). The private sector plays an essential role in employment generation, and it is essential that a well-managed environment and reduced degradation are recognized as essential elements for a conducive business environment. This does not apply only to “green” natural resource-based businesses, but to all economic sectors.
The COVID-19 pandemic reinforced the importance of reducing the vulnerability of the population and economy and facilitating sustainable recovery. Initially, Georgia handled the spread of the virus well, yet its economy is significantly affected by the impacts of lockdown, global demand shocks and travel restrictions. The pandemic is not over to fully assess its impacts. The International Monetary Fund (IMF) estimates that Georgia’s real GDP growth will fall by 4 percent by end of 2020 before seeing a recovery of 3 percent in 2021.13
During the economic downturn, Georgia adopted a national anti-crisis package focusing on social support (US$330 million), stimulating economic growth (US$680 million) and strengthening the healthcare system (US$110 million) to fight the pandemic. Yet, beyond this direct post-pandemic crisis response, all nature-based sectors may benefit from initiating a transformational green recovery and adapting to the challenge of climate change. Environmental risks remain a substantial concern, with persistently problematic areas of the country where environmental degradation has reached unsustainable levels. After COVID-19, economic growth could resume and even accelerate by preserving and enhancing the country’s natural capital. Georgia is well positioned to establish a foundation for growing back greener by rebooting its economy for sustainable future.
11 Geostat. 2020c.12 Geostat. 2020c.13 IMF. 2020. “Georgia.” https://www.imf.org/en/Countries/GEO (accessed on August 28, 2020).

Koruldi Lakes in the Caucasus, Georgia
Author: Milosz Maslanka

Georgia: Towards Green and Resilient Growth2
1. Introduction
1.1. Economic, Social and Environment ContextGeorgia has made impressive strides in economic growth and poverty alleviation. Over the past 20 years, Georgia’s economy grew at an average of 5.4 percent of GDP annually, with foreign investment and domestic demand both playing a prominent role. Georgia transitioned from a lower-middle income country to an upper-middle income country in 2019.14 Thanks to bold policy reforms, Georgia has one of the lowest corruption levels in the Europe and Central Asia (ECA) region.15 Improvements in public service delivery and the business climate have attracted significant amounts of foreign direct investment (FDI), spurring growth and positive net job creation.16 Poverty has declined, with over half a million Georgians leaving poverty between 2010 and 2015. However, rural poverty remains higher than in urban areas and many people in rural areas remain vulnerable to adverse developments, like the current COVID-19 pandemic.
Georgia is endowed with natural resources, including vast forests, a beautiful coastline, majestic mountainous landscapes, and abundant water resources. Georgia has many different climate zones, from humid sub-tropical climate to permanent snow and glaciers zone. About 40 percent of Georgia’s land is forested and another 30 percent covered by pastures and mosaic landscapes. The country has exceptionally rich and diverse flora and fauna. Many economic sectors depend on these resources which, if sustainably managed, can form the basis of a green and prosperous Georgia.
Currently, the service sector, including tourism, is the engine of economic development in Georgia (Figure 1.1). Tourism is a fast-growing sector and contributes 7 percent of GDP. However, tourism-driven development is still fragmented and incomplete, and other branches of the economy like agriculture and renewable energy, that could be connected to tourism activities, do not enjoy the same level of growth. Tourism expansion is vulnerable to potential demand shocks – like the travel disruptions caused by the COVID-19 pandemic, and global recessions. Economic growth in Georgia is not fully inclusive and poor rural communities do not enjoy its benefits in the same way as the urban population. A large part of the population is involved in low productivity agriculture: 39 percent of all employed are in agriculture, although only 8 percent of GDP is generated through agriculture, forestry and fishery; 8 percent are employed in industry, with 11 percent of GDP created in manufacturing; and 6 percent in construction, which accounts for 9 percent of GDP).
14 See the World bank historical classification of countries by income at https://datahelpdesk.worldbank.org/knowledgebase/articles/906519-world-bank-country-and-lending-groups.
15 Transparency International. 2020. “CPI 2019: Eastern Europe & Central Asia.” https://www.transparency.org/en/news/cpi-2019-eastern-europe-central-asia#.
16 World Bank. 2018b. “Georgia – Country partnership framework for the period FY19-FY22 (English).” Washington DC: The World Bank. https://documents.worldbank.org/en/publication/documents-reports/documentdetail/588751525364587100/undefined.

Georgia: Towards Green and Resilient Growth 3
Figure 1.1 GDP Composition in Georgia (%, 2018)
Agriculture, hunting and forestry; fishing
Manufacturing
Processing of products by households
Hotels and restaurants
Mining and quarrying
Electricity, gas and water supply
Construction
Transport
Other services55 %
8 %1 %
11 %
3 %2 %
9 %
3 %
8 %
Source: Geostat. 2020a.
Natural capital is declining in Georgia – a trend which is most clearly seen in the natural resource-based sectors. Natural resources, which form the backbone of the Georgian economy, posted a decline of 8 percent in constant value between 1995 and 2014 (Figure 1.2).17 Despite leaving out many vital services provided by nature - like air and water filtration, flood protection, carbon storage, pollination for crops, and the provision of habitats for fisheries and wildlife - the National Wealth Accounting confirms a declining trend in Georgia’s natural capital. Most of this devaluation originates from a sharp drop or stagnant productivity in croplands and pasturelands.
Figure 1.2 Natural Capital in Georgia
Forests
Pastureland
Protected areas Cropland
Fossil fuel energy Minerals
45 000
40 000
35 000
30 000
25 000
20 000
15 000
10 000
5 000
0
cons
tant
201
4 U
S$, m
illio
ns
1995 2000 2005 2010 2014
Source: World Bank. 2020b.
17 Lange, G., Q. Wodon, and K. Carey. 2018. “The Changing Wealth of Nations 2018: Building a Sustainable Future”. Washington DC: The World Bank.

Georgia: Towards Green and Resilient Growth4
Georgia is vulnerable to climate change, observed in the increased intensity and frequency of extreme weather events. Climate change is projected to increase temperatures by the end of the century and water availability is expected to diminish across Georgia. Under a high-emission scenario, projections show a likely increase of monthly temperatures of 4.5oC for the 2080–2099 period, with a possible increase of over 7oC by 2099 in Tbilisi and Telavi,18 and in the key agricultural areas of Imereti, Kvemo Kartli and South Georgia.19 Additionally, both the quantities and the distribution of precipitation are projected to change. While on average a reduction in precipitation is expected for Georgia (monthly precipitation is projected to decrease steadily by 1.3mm per month from 2040-2059), some areas may also experience flooding due to increased intensity of rainfall, especially in the coastal areas (including Batumi and Sokhumi), the low-lying areas in the center of the country (including Kutaisi and Gori), and in key river basins.
Projected temperature increases and reduction of precipitation will impact Georgia’s agrarian, forestry, and water sectors, and the poor population will be affected most. The likelihood of severe drought will increase particularly for the central areas of the country.20 According to the third National Communication to the United Nations Framework Convention on Climate Change (2015),21 the intensification of extreme weather events will result in increased landslides, floods, avalanches, and mudflows, with adverse impacts on agriculture, water resources, forests, coastal areas, public health, and infrastructure. Risks to the wellbeing of the population caused by climate change are estimated at a level equivalent to 1.5–6.6 percent of GDP. 22 Figure 1.3 maps the sensitivity to climate change of the population below the poverty line in different municipalities in Georgia. People living below the poverty line will be hardest hit by climate change in central Georgia and in the Northeast (see dark brown areas in Figure 1.3).
Figure 1.3 Sensitivity to Climate Change of Population Below the Poverty Line
Source: As appears in USAID. 2016.
18 Elizabarashvili, M. et al. “Georgian climate change under global warming conditions.” Annals of Agrarian Science, 15(1): 17-25.19 ENVSEC. 2016. “Climate Change and Security in the South Caucasus. Republic of Armenia, Azerbaijan and Georgia-
Regional Assessment.”20 Ministry of Environment and Natural Resources Protection of Georgia. 2015. “Georgia’s Third National Communication to
the UNFCCC.”21 Ministry of Environment and Natural Resources Protection of Georgia. 2015.22 Hallegatte, S., A. Vogt-Schilb, M. Bangalore, and J. Rozenberg. 2017. “Unbreakable: Building the Resilience of the Poor
in the Face of Natural Disasters”. Climate Change and Development Series. Washington DC: The World Bank. http://documents.worldbank.org/curated/en/512241480487839624/Unbreakable-building-the-resilience-of-the-poor-in-the-face-of-natural-disasters.

Georgia: Towards Green and Resilient Growth 5
Changes in the quality and stock of natural capital explains the low labor productivity in agriculture, forestry and fishery (Figure 1.4). A large part of the Georgian population is involved in low productivity agriculture: 39 percent of all Georgians employed are in agriculture, while only 8 percent of GDP is generated by agriculture, forestry and fishery combined. Based on the estimates of the United States Department of Agriculture (USDA), agricultural productivity23 in Georgia is lower than in any other of the former Soviet Union countries. It is 20-30 times lower than in the EU-member countries Estonia, Lithuania and Latvia, 10-20 times lower than in Belarus, Russia and Ukraine, and 2-4 times lower than in Armenia and Azerbaijan. Consequently, Georgia has not been able to increase overall economic productivity relative to other countries.
Figure 1.4 Agricultural Productivity in Selected Former Soviet Union Countries (2000–2016)
Latvia Armenia Azerbaijan Georgia Belarus Ukraine
18
16
14
12
10
8
6
4
2
02000 2002 2004 2006 2008 2010 2012 2014 2016
2006
-200
8 C
onst
ant U
S$/h
ecta
re ‘0
00
Source: USDA. 2019.
Despite Georgia’s impressive economic growth, the country’s population remains vulnerable to economic, social and environmental shocks. Substantial reductions in poverty have been achieved since 2010 (Figure 1.5), but a significant share of households may fall back into poverty as a consequence of the COVID-19-induced economic crisis. Existing income inequality is influenced by regional disparities: according to World Bank calculations, poverty rates were 11 percent in Tbilisi in 2016, compared with 13 percent in other cities and slightly more than 20 percent in rural areas, where most workers are concentrated in low-productivity agricultural and informal activities. Persisting rural poverty contributes to the negative demographic trend and a declining rural population.24
23 Measured as agricultural output in constant 2004-2006 US$ per one employed in agriculture24 Geostat. 2020. “Population and Demographics.” https://www.geostat.ge/ka/modules/categories/316/mosakhleoba-da-
demografia

Georgia: Towards Green and Resilient Growth6
Figure 1.5 Poverty Rate Trends in Georgia, 2008-2016
Georgia Tbilisi Other urban Rural
40
Proverty rate (percent of population)
35
30
25
20
15
10
5
02008 2009 2010 2011 2012 2013 2014 2015 2016
Source: As appears in World Bank. 2019b.
1.2. COVID-19 and Increased UncertaintyThe global outbreak of the coronavirus in February 2020 threatens to reverse past gains in economic development and poverty reduction in Georgia. The official reaction to the pandemic has been swift and comprehensive. A nationwide State of Emergency was declared on March 21, 2020, and robust measures put in place to contain the health risks, protect livelihoods, and set the stage for economic recovery. Efforts to mitigate the economic and social impacts of the crisis included the expansion of social transfers and other temporary relief measures for businesses and households. The Government’s proactive response comes at significant fiscal and economic costs, that also need to be managed. The containment measures, while successful in slowing the spread of the virus, are causing declines in both consumption and investment. The global nature of the pandemic also means that remittances and the external demand for goods and services, including tourism, have taken a hit.
Georgia’s economy is gradually recovering from the first COVID-19 shock, but the pandemic is not over to fully assess its impacts. Georgia adopted a national anti-crisis package focusing on social support (US$330 million), stimulating economic growth (US$680 million) and strengthening the healthcare system (US$110 million) to fight the pandemic. Supported by accelerated government spending, robust credit growth and higher remittances, partially offsetting the impact of the remaining restrictions on mobility and economic activity, the economy contracted at a slower pace (7.7 percent) in June, 2020, compared with May, 2020 (13.5 percent).25 Nevertheless, the IMF estimated Georgia’s real GDP growth would decline by 4 percent by the end of 2020 before a recovery in 2021.26
25 Word Bank. 2020c. “Georgia Monthly Economic Update – August 2020.” http://pubdocs.worldbank.org/en/317821597419426483/GE-MEU-August-2020.pdf (accessed on August 25, 2020).
26 IMF. 2020. “Georgia.” https://www.imf.org/en/Countries/GEO (accessed on August 28, 2020).

Georgia: Towards Green and Resilient Growth 7
Poverty has been falling in the last decade, but is projected to increase in 2020, as a result of the COVID-19 crisis. Increased vulnerabilities associated with the effects of the pandemic caused massive job losses and unemployment among unskilled labor. Lower income Georgians are more prone to health shocks due to their relatively poor access to healthcare and lower savings against economic crisis. The pandemic and the associated travel disruptions adversely impact the tourism industry, which contributed 7 percent to national GDP in 2018. Other sectors of the natural-resource-based economy in Georgia - like forestry - are still relatively detached from global value chains and will likely be less impacted by the global downturn. However, unemployment and increased poverty rates may bring people back to subsistence farming, leading to an expansion of the agriculture frontier and increased forest degradation.
Economic recovery measures present an opportunity for Georgia to “grow back better and greener”, in alignment with the EU approximation policies and the European Green Deal (EGD). Economic policies which address immediate shocks and ensure a sustainable development of the country compatible with the EU long-term strategy for the EGD, could be prioritized. The Government’s focus on the EU–Georgia Association Agreement provides new opportunities to advance sustainability goals and access potential financial sources. EU member states also recognize green transition as a key element of strategies for recovery from the current crisis.27
1.3. This Report: Towards Green and Resilient Growth This report builds on and updates the 2015 Country Environmental Analysis (CEA). It provides new and updated analysis on the costs of environmental degradation (CoED) while discussing government priorities and resource allocation to facilitate greener economic recovery and sustainable growth. The evidence on the CoED presented in the report could be used as a baseline for further actions to address the pandemic and its impact. At the same time, many of the recommendations are actions that may be undertaken regardless of COVID-19, with a focus on environmental sustainability as a “no regrets” approach in an ongoing crisis where the full impact is still not fully known. The analysis identifies potential areas of improvement of current policies, strategies, and financing to address environmental challenges, aligned with the priorities of the government of Georgia, the EU–Georgia Association Agreement and Georgia’s global commitments.
This report is not intended to be a full CEA, but rather a policy note to update the CoED, recent policy/legal changes and some policy recommendations. It builds on a partial analysis of the costs, on an assessment of gaps in ESF implementation, and on recent analytical work in the forest sector and on the development of coastal areas. Based on these, the report provides some broad policy recommendations for dialogue within the Government and between the Government and its development partners. It does not amount to a full extended core diagnostic for Georgia.
The report comprises eight chapters. The introduction outlines the basic country parameters and challenges concerning Georgia’s natural capital, while considering impacts of the COVID-19 crisis. Chapter 2 provides an overview of the CoED and summarizes key findings of this report. Chapters 3 to 5 discuss the methodology and results of the updated CoED analysis, which focuses on land and ecosystems, coastal zone, and pollution. Chapter 6 reviews Georgia’s policy and institutional framework. Chapter 7 provides a deep dive into enhancing natural capital in the forest sector, and Chapter 8 outlines the way forward and key actions that Georgia might take to grow back better and greener.
27 Bloomberg Law. 2020. “Green Focus Pledged for the European Union’s Virus Recovery Plan.” https://news.bloomberglaw.com/environment-and-energy/green-focus-pledged-for-the-european-unions-virus-recovery-plan?context=article-related (accessed on August 4, 2020).

Katskhi Pillar. Sightseeing in Georgia. Monastery near village Katskhi. Imereti, Georgia. A Georgian Meteora.
Author: Andrei Bortnikau

Georgia: Towards Green and Resilient Growth 9
2. The Cost of Environmental Degradation: Overview
The Georgia Country Environmental Analysis (CEA) of 201528 provided an overall assessment on CoED and recommendations on cross-sectoral interventions. The 2015 CEA integrated economic development with environmental and social factors to foster an understanding of unsustainable patterns of economic development in Georgia and the effects of environmental degradation on growth. The CEA estimated the CoED of selected impact areas, including human health effects from air pollution, exposure to lead, land degradation and deforestation, loss of amenities as a result of untreated solid waste, and natural disasters for 2012 (Table 2.1).29 The annual cost of air pollution and lead exposure were the major contributors to the total estimate, reflecting the urgency of mitigation measures in these areas. The monitoring data and analysis methods used in the CEA 2015 had several limitations. For example, no continuous monitoring data of ambient air pollution (AAP) was available, there were no estimations of the agricultural production loss attributable to soil erosion, and there was no information on ecosystem value losses due to forest degradation. Given these limitations, the CoED provides range estimates (low and high) rather the precise costs.
Table 2.1 Estimated Annual CoED in Georgia (2012)
SectorEstimated Annual Cost,
- US$ million -Share of GDP in 201230
- % -Low High Low High
Ambient air pollution 280 820 1.8 5.2Household air pollution 200 580 1.3 3.7Lead exposure 150 220 0.9 1.4Cropland and pastureland degradation 150 190 0.9 1.2Solid waste 57 64 0.3 0.4Natural disasters 20 120 0.2 0.7Deforestation 20 30 0.1 0.2
30Source: World Bank. 2015.
Aiming to address natural resource degradation, the Government of Georgia has since 2014 strengthened the monitoring of environmental pollution and environmental and natural resource statistics collection and reporting.31 Eight continuous air pollution monitoring stations have been installed in major cities. In 2016, with EU support, Georgia started to monitor water quality in the Black Sea. Soil quality monitoring resumed in 2013 and soil samples of about 30 settlements are analyzed in 2017 for heavy metals content. In 2017, the Emerald Network of protected areas was established to preserve biodiversity and critical habitats; by December 2019, the Network covered about 1 million ha in Georgia. A methodology was developed for a National Forest Inventory: field work started in 2018 and is expected to be completed in 2021. The number of hydrometeorological observation points increased by 43 units to 137 observation points after 2014. The availability of monitoring data helped to improve the accuracy of the CoED estimates in this report, as compared to the CEA from 2015; however, methodological improvements make a direct comparison to CoED estimates of the CEA 2015 difficult.
Table 2.2 presents a summary of new estimates. The updated CoED on agriculture and forest land, air quality, lead exposure, and Georgia’s coastal zone indicate a continuous negative trend in impacts on the economy. Costs detailed include both direct costs and lost economic opportunities. Given the methodological improvements as well as the improvement of monitoring data, new estimates could be used as benchmarks for an economic analysis of policy interventions to reduce the CoED and proceed with greener recovery in Georgia. Subsequent chapters outline these estimates in detail, highlight spatial hot spots and call attention to data limitations.
28 World Bank. 2015.29 Depending on the assumptions used, the range of estimates was 5.5%–12.47%. 30 The CoED are measured in terms of percentage of GDP in 2012 to provide an “order of magnitude” information. The cost
estimates of impact areas cannot be added or compared directly, because of differences of methodological approaches and data availability.
31 Ministry of Environmental Protection and Agriculture of Georgia. 2017. “The National Report on the State of the Environment of Georgia, 2014-2017.”
Georgia: Towards Green and Resilient Growth10
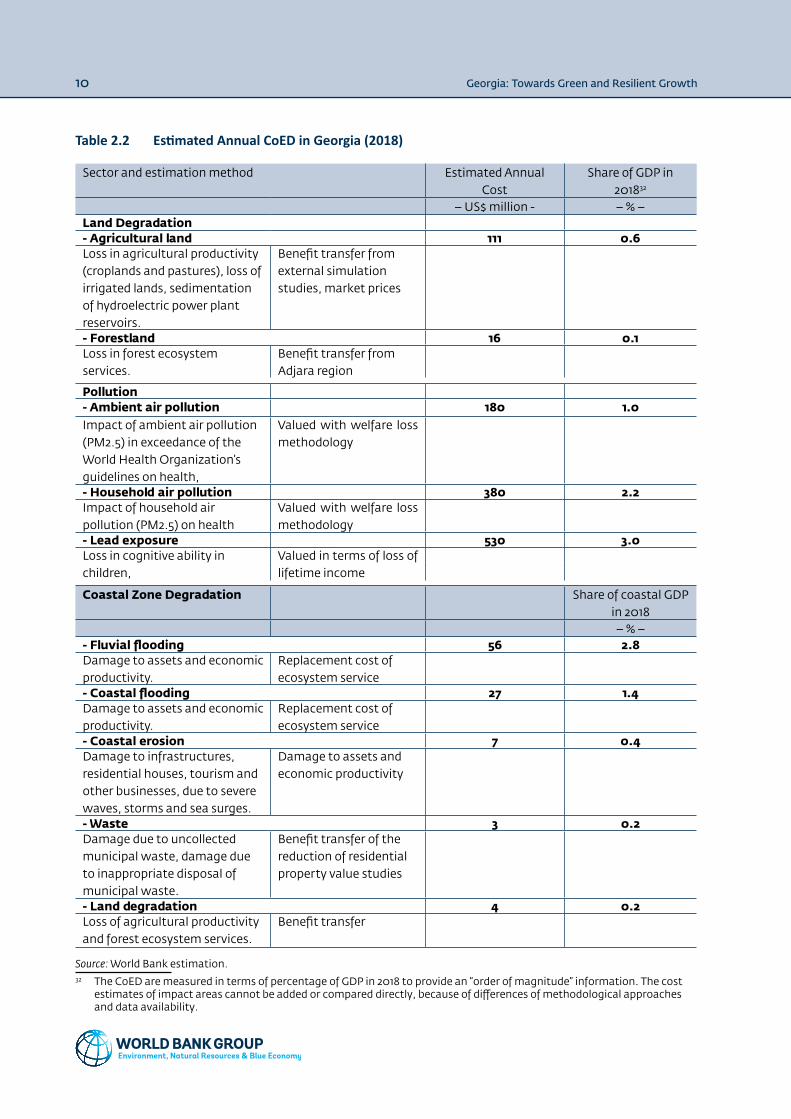
Table 2.2 Estimated Annual CoED in Georgia (2018)32
Sector and estimation method Estimated Annual Cost
Share of GDP in 201832
– US$ million - – % –Land Degradation- Agricultural land 111 0.6Loss in agricultural productivity (croplands and pastures), loss of irrigated lands, sedimentation of hydroelectric power plant reservoirs.
Benefit transfer from external simulation studies, market prices
- Forestland 16 0.1Loss in forest ecosystem services.
Benefit transfer from Adjara region
Pollution- Ambient air pollution 180 1.0Impact of ambient air pollution (PM2.5) in exceedance of the World Health Organization’s guidelines on health,
Valued with welfare loss methodology
- Household air pollution 380 2.2Impact of household air pollution (PM2.5) on health
Valued with welfare loss methodology
- Lead exposure 530 3.0Loss in cognitive ability in children,
Valued in terms of loss of lifetime income
Coastal Zone Degradation Share of coastal GDP in 2018– % –
- Fluvial flooding 56 2.8Damage to assets and economic productivity.
Replacement cost of ecosystem service
- Coastal flooding 27 1.4Damage to assets and economic productivity.
Replacement cost of ecosystem service
- Coastal erosion 7 0.4Damage to infrastructures, residential houses, tourism and other businesses, due to severe waves, storms and sea surges.
Damage to assets and economic productivity
- Waste 3 0.2Damage due to uncollected municipal waste, damage due to inappropriate disposal of municipal waste.
Benefit transfer of the reduction of residential property value studies
- Land degradation 4 0.2Loss of agricultural productivity and forest ecosystem services.
Benefit transfer
Source: World Bank estimation.32 The CoED are measured in terms of percentage of GDP in 2018 to provide an “order of magnitude” information. The cost
estimates of impact areas cannot be added or compared directly, because of differences of methodological approaches and data availability.

Gergeti Monastery.
Author: Marcin Szymczak

Georgia: Towards Green and Resilient Growth12
3. Land Degradation, Deforestation and Ecosystem Services
The assessment of economic impact of land degradation highlights actions to mitigate environmental degradation with direct impact on agriculture, forestry and poverty alleviation. Agriculture and forest-based economic activities generate 7 percent of the country’s GDP. Along with their significance in terms of economic output, agriculture and forestry also play a substantial role in providing livelihoods for the poor, as a large share of poor and non-poor population displays high dependency on these economic activities. Agricultural land, pastures and forests are also a dominant part of Georgia’s landscape. Land use in Georgia is presented in Figure 3.1.
Land degradation has an impact on land and water users across the landscape, and on agriculture, forestry, protected areas, hydropower plants and water sources. The high level of land degradation is a result of the absence of an integrated land management, of extensive land use, and of a lack of investments. The agricultural sector in Georgia is dominated by small, fragmented, subsistence and semi-subsistence farms, and most farmers are poorly integrated into markets, with low technology adoption. About a third of the 3 million ha of agricultural land is affected by soil erosion, 7–8 percent is affected by waterlogging due to malfunctioning drainage systems, and another 7 percent is affected by salinity, among other problems.33
Figure 3.1 Land Use in Georgia (% of land cover type in 2016)
Source: World Bank Group. 2020.
Estimates in this report reflect the significant impact of land degradation, including soil erosion and salination, and related factors on land users both on-site and off-site. Soil degradation is defined as a change in soil health status resulting in a diminished capacity to provide goods and services for beneficiaries. Degraded soils do not provide the full range of goods and services they could if undisturbed.34 Loss of soil productivity is the main on-site effect of soil degradation, while changed productivity of downstream land, sedimentation and eutrophication of waterways and reservoirs are common off-site effects. On-site soil erosion analysis included losses from pasture degradation and losses from reduced agricultural production from annual crops, permanent crops and animal husbandry. The methodology for estimating the cost of land degradation is presented in ANNEX A.
33 World Bank. 2012. “Georgia: Climate Change and Agricultural Country Report. Washington DC: The World Bank.34 FAO. 2020. “Soil Degradation.” http://www.fao.org/soils-portal/soil-degradation-restoration/en/.
Grassland
Deciduous Broadleaf Forest
Mixed Deciduous Forest
Closed Shrubland
Cropland
11,4 %
17,1 %
17,4 %37,7 %
Urban
Crop, Natural Veg. Mosaic
Permanent Snow, Ice

Georgia: Towards Green and Resilient Growth 13
3.1.1. On-site Land DegradationNatural hay meadows and pastures comprise about 1.91 million hectares in Georgia, of which a significant amount is degraded due to unsustainable agricultural practices and overgrazing. Soil degradation resulted in a productivity reduction of about 23 percent and is estimated at about 7 tons of dry matter per hectare.35 This loss of pasture productivity (valued with a market price of a substitute) generates total annual costs of around US$59 million.
Poor soil condition is one of the major factors affecting agricultural productivity. In 2018, the total value of agricultural production, including annual crops, permanent crops and animal husbandry, exceeds US$681 million. Soil degradation reduces the benefits of agricultural production on the eroded soils. An annual land productivity loss of 1.8 percent was estimated based on the combined use of the Revised Universal Soil Loss Equation (RUSLE) and MAGNET models.36 The application of the land productivity reduction coefficient to the total value of a cultivated products in agriculture resulted in the total annual agricultural productivity cost at about US$11.9 million. Poor soils are most prevalent in the eastern parts of the country, where overgrazing and reduced precipitation have led to wind erosion.
3.1.2. Off-site Land Degradation Upstream soil erosion and the accumulation of sediment volumes leads to economic losses through sedimentation of irrigation and hydropower plant (HPP) reservoirs. This is a significant contribution to losses of agricultural capacities and energy generation, especially for large reservoir facilities. Georgia has seven large hydroelectric power stations, all with large reservoirs, with a total installed capacity exceeding 1,991 megawatts (MW). The projected aggregate power generation capacity calculated in feasibility studies show an expected production of around 5,801 million kWh. Analysis of historical electric energy generated by these facilities indicates an average annual production of around 5,303 million kWh. The difference between actual production and expected production was 318 kWh; 80 percent of this annual electricity generation loss - below potential production - can be attributed to sedimentation.37 Estimations of the value of this missing production, valued at consumer tariffs, amount to about US$21 million.
Georgia is facing a reduction in total irrigated lands due to shortage of irrigation infrastructure capacity. This has been particularly severe in Eastern Georgia. Actual irrigated area, comprising around 386,000 hectares by the end of the 1980’s, shrunk to 43,000 hectares by 2015 with the lack of operation and maintenance through the extreme economic hardship of the 1990s, and a difficult shift to the market-driven economy thereafter. Recent investments in the rehabilitation of irrigation infrastructure allow a portion of the previously serviced areas to be brought back under irrigation. According to the estimates of the Irrigation Strategy for Georgia for 2017-2025, the total irrigated area was expected to reach 120,000 hectares by 2020 and 200,000 hectares by 2025. In 2018, the annual estimated loss of agricultural productivity compared with the maximum productivity of reservoirs was US$21 million. The ongoing reconstruction of existing irrigation schemes alone will not suffice to improve service delivery to targeted areas, as the availability of irrigation water becomes a limiting factor with the increasing impacts of climate change. Preventing future losses from reduced agricultural productivity would require development of irrigation water storage capacity in the form of reservoirs, and integrated watershed management.
35 USAID. 2016. “The Georgian Road Map on Climate Change Adaption.” http://nala.ge/climatechange/uploads/RoadMap/TheRoadMapEngPre-design_reference191_Final.pdf (accessed on August 4, 2020).
36 Sartori, M. et al. 2019. “A linkage between the biophysical and the economic: Assessing the global market impacts of soil erosion.” Land Use Policy, 86:299-312.
37 GLOWS-FIU. 2011. “Rapid Assessment of the Rioni and Alazani-lori River Basins - Republic of Georgia. Technical Summary Report.” Global Water for Sustainability Program, Florida International University: 48.

Georgia: Towards Green and Resilient Growth14
3.1.3. Deforestation and Ecosystem Services Many important ecosystem services are not adequately quantified in Georgia. Georgia has high forest cover, totaling about 39 percent of total land area or 2.7 million hectares,38 the highest share in the Caucasus region (see Chapter 7 for more data). Georgia is also a globally recognized biodiversity hotspot: up to 400 species of trees and shrubs can be found in the country, of which 61 are endemic to the country, and an additional 43 species endemic to the Caucasian region. Georgian forests present not only a rich and unique habitat for fauna, but also an important migration corridor for various bird species. The Georgian forests have the crucial function of preserving genetic biodiversity, and they are ranked among globally valuable biodiversity areas by such bodies as the World Wildlife Fund (WWF) and the International Union for Conservation of Nature (IUCN).39 Many economic activities – for example fisheries, agriculture, and forestry - depend directly on biodiversity, healthy ecosystems and the vital and irreplaceable services they provide. Also, many services like tourism benefit greatly from well-maintained biodiversity. The more diverse an ecosystem is, the more stable and productive it tends to be, and the better it can withstand environmental stress. The loss of biodiversity in terrestrial ecosystems is driven largely by pressures from agriculture and from unsustainable forest use. These are also impacting freshwater resources, soil fertility and native species.
Annual ecosystem services loss in Georgia is estimated by taking into account the loss of provisioning and natural hazard regulating services provided by forests. The value of these services is estimated for Adjara region in the 2016 study of The Economics of Environment and Biodiversity (TEEB) at about US$882 per hectare/year.40 Based on the case study, these services include:
• Provisioning services. Economic values are estimated at US$286 hectare/year for fuelwood and US$141 hectare/year for non-timber forest products (NTFPs), using a net factor income approach computing the gross revenues for each service and the costs of production.41
• Natural hazard regulation. A value of US$455 hectare/year is estimated for landslide regulation, using the avoided damage costs approach, involving estimations how the risks of damage events change with changes in forest cover.
Forest use is unsustainable in many places, with extensive forest degradation affecting about 15,000 hectares annually.42 As a result, Georgia is experiencing a significant reduction in ecosystems services from forestlands, with a substantial impact on biodiversity. Excessive grazing, illegal logging, the pollution of water sources and changes to agricultural frontiers reduce the density of forest, threatening biodiversity and livelihoods. Over the past 20 years, as shown in the Interactive Land Degradation Map, wood harvesting – mostly for fuelwood – has been a major driver of forest loss in Georgia.43 It is estimated that annual forest degradation costs in Georgia amount to US$11.9 million. Average annual tree cover loss (a proxy indicator for deforestation) was about 500 hectares from 2001–2018. Using the net present value of lost forest values at a 6 percent discount rate, losses are estimated at US$4 million annually.
38 Ministry of Environmental Protection and Agriculture of Georgia. 2017. “The National Report on the State of the Environment of Georgia, 2014-2017.” https://mepa.gov.ge/En/Reports (accessed on August 4, 2020).
39 IUCN. 2012. “Georgia – a haven for biodiversity.” https://www.iucn.org/content/georgia-a-haven-biodiversity (accessed August 4, 2020).
40 Brander L., C. Sovann, D. Kharazishvili, and N. Memiadze. 2016. “The Economics of Ecosystems and Biodiversity for the Forestry Sector of Adjara Autonomous Republic, Georgia.” Final Report prepared on behalf of the WWF Caucasus Programme Office. http://www.teebweb.org/wp-content/uploads/2017/03/TEEB-Adjara-Final-Report.pdf.
41 Carbon storage is not included in forest valuation to avoid double counting. In the economic value of carbon storage is estimated at US$218 hectare/year.
42 Estimated based on Brander et al. 2016.43 Ministry of Environmental Protection and Agriculture of Georgia. 2020a. “Interactive Map (English).” https://atlas.mepa.
gov.ge/maps/map?l=en (accessed on August 19, 2020).

Georgia: Towards Green and Resilient Growth 15
3.2. Social Impact of Land DegradationLand degradation can have a notable welfare impact and push more people into poverty as agricultural production falls below its potential. Economic activities related to agriculture are very important in Georgia. Agriculture, together with forests, contributes about 7 percent of GDP, and 42 percent of employment - 45 percent for women. Agriculture and forestry activities are vital in providing subsistence to the poor in rural areas, where almost half of the population lives. Poor rural households and lagging regions often rely on low-productivity subsistence agriculture and forestry, which produce stagnant returns.
The average income from agriculture is one fifth of households’ subsistence minimum. The average monthly household income from agriculture is about US$20 while the subsistence minimum for the average household is US$104.44 For families with six and more members (13 percent of the households in Georgia, especially in rural areas) the subsistence minimum is US$145; these households must sell over seven times more agricultural products compared to the average to reach the subsistence minimum. The reduction in agricultural production and income from forests due to land degradation thus has a direct impact on the poor.
Mitigation of land degradation will have a significant positive impact on the income of the most vulnerable rural households. Household survey data from 201645 estimated household incomes across regions with different forest cover and different exposures to natural hazards. An analysis of income diversification data indicates that more than 20 percent of households have absolute dependence on income generated by forests. Rural populations extract on average 47–61 percent of their income from agriculture and forestry. The estimations reveal that for the poorest 20 percent of the population the poverty gap46 would reduce by six percentage points if landscapes are restored (see ANNEX B for the methodology).
The impact of climate change could further impair the welfare of the most vulnerable population. As indicated in Chapter 1, the population living below the poverty line is more vulnerable to climate change and the risk of natural disasters. Landscape restoration and the corresponding reduction in the poverty gap will improve the resilience of the poor. This positive impact could be reinforced by the introduction of policies that support further income diversification, for example, through ecotourism or the modernization of agricultural and forestry practices.
44 Geostat. 2019. “Agriculture of Georgia, 2018 (English)”. Statistical publication. Tbilisi: Geostat. https://www.geostat.ge/media/24488/soflis-meurneoba_2018.pdf.
45 World Bank. 2018c. “Georgia: Household Surveys on Forest Use, Poverty and Vulnerability to Natural Hazards.” Washington DC: The World Bank.
46 The poverty gap is the ratio by which the mean income of the poor falls below the poverty line. Poverty level in Georgia is estimated at the rural poverty level at 60% of the median rural income (Geostat. 2020d. “Living conditions.” https://www.geostat.ge/en/modules/categories/192/living-conditions (accessed on August 19, 2020).

Black Sea Coast in the botanical garden. Batumi, Georgia.
Author: Sergey Lyashenko

Georgia: Towards Green and Resilient Growth 17
4. Coastal Zone Degradation
Georgia’s coastal zone, with its free-flowing river deltas, supports agriculture, forestry, and commercial activities, and has a high potential for expanding the tourism industry.47 The Georgian coast, spanning from the mouth of the river Psou in the north to the Sarpi settlement in the south, is divided between the Autonomous Republic of Abkhazeti, currently not under jurisdiction of the government of Georgia, and eight municipalities, with a diversity of economic, political, geographical features, natural resource endowments and land use patterns. The municipalities are Khelvachauri, Batumi, Kobuleti, Ozurgeti, Lanchkhuti, Poti, Khobi and Zugdidi, with a total population of 554,700 people and extending over a coastline tract of about 120 km (Figure 4.1). The coastal zone is home to one of every seven Georgians, and generates about 15 percent of the country’s GDP, or US$2 billion.
Figure 4.1 Coastal Zone in Georgia
Source: World Bank GIS operative.
The recent rapid growth of tourism facilities along the southern part of the coast has increased the competition for land, water, and other natural resources. Artificial barriers along rivers have induced changes in freshwater flows from glacier thawing and rainwater collection, contributing to significant reduction in the important ecosystem service of sediment transport and deposition, accelerating coastal retreat. Moreover, climate change and disaster risks are exacerbating these threats.
47 Based on World Bank. 2020d. “The Cost of Coastal Zone Degradation in the Country of Georgia. A tool for the Coastal Zone Climate Adaptation Plan and the Nationally Determined Contributions.” Background technical paper. Forthcoming. Washington DC: The World Bank.

Georgia: Towards Green and Resilient Growth18
The coastal zone is undergoing substantial environmental degradation. The economic costs of this are associated with human losses due to floods and pollution, the losses of assets (including buildings, and transport and hospitality infrastructure) and damages to critical ecosystems (including beaches, forests, and river deltas). The economic impacts of degradation in coastal Georgia result from four major factors: flooding, coastal erosion, pollution and waste, and damage to agricultural soils and forests. Water pollution damages could be significant, but due to a lack of appropriate data these are harder to measure. The CoED in the eight coastal municipalities is estimated at an equivalent of 4 percent to 5 percent of coastal zone GDP in 2018,48 using market prices.
The main costs are from flooding and coastal erosion and forest degradation. While the latter is estimated with a high degree of uncertainty,49 together they account for more than 90 percent of the total costs (Figure 4.2). Four major factors affect the coastal zone:
• Flooding can result from high rainfall, with pluvial floods occurring when heavy precipitation saturates drainage systems, and flash floods, characterized by an intense, high velocity torrent of water; from overflowing rivers; and from sea surges caused by heavy storms, leading to coastal flooding. It can cause loss of life and major damage to physical structures and critical ecosystems, such as beaches and protected areas. Sea surges are particularly damaging in low-lying areas and are often exacerbated by associated erosion of the coastline. Fluvial and pluvial floods are estimated to cost society approximately US$55.5 million per year, while coastal floods are estimated to cost approximately US27 million per year, for a total of US$82.5 million per year, or nearly 3.5 percent of the annual GDP of the eight coastal municipalities.
• Coastal erosion affects the shore along the coastline by removing beach material and causing the encroachment of seawater inland. A contributing factor is the installation of artificial barriers, such as dams, along rivers contributing significantly to the reduction of water-transported sediment and its deposition along coastal shores. Consequently, beach retreat has accelerated, while increased disaster risks and strengthened wave action resulting from climate change are exacerbating these threats. On Georgia’s coastline, reduced natural sediment transportation due to river barriers on the Chorokhi and Enguri rivers diminishes natural beach nourishment via sediment deprivation. The total cost from environmental degradation due to sediment deprivation of all rivers in Coastal Georgia is estimated at US$7 million per year. As a consequence of climate change, erosion is expected to increase considerably in the future.
• Soil and forest degradation mainly affect the interior parts of coastal Georgia. Pluvial water, wind and animal husbandry all have a negative effect on topsoil health, mostly via erosion and the compaction of its micro-structure, inhibiting aeration, especially in sloped surfaces and grazing plots. The long-term fertility and productivity loss of agricultural lands has an annual cost ranging between US$1.2 and US$2.4 million per year. There is also significant forest degradation, mostly driven by people sourcing firewood from public forest land, as well as the loss of a variety of ecosystem services provided by forests. The sum of these two components (forest degradation and deforestation) is estimated with high uncertainty. Based on the Adjara forestry study,50 the lower-bound estimate for forest degradation and deforestation is approximated at US$2.1 million per year in the eight coastal municipalities.
48 GDP percentage estimates for the coastal zone are adjusted to 2018 using a different methodology. Therefore, percentage estimates may differ from the World Bank technical background paper (World Bank. 2020d).
49 Estimates in this section are from (World Bank. 2020d).50 Brander et al. 2016. “The Economics of Ecosystems and Biodiversity for the Forestry Sector of Adjara Autonomous
Republic, Georgia.” Final Report prepared on behalf of the WWF Caucasus Programme Office. http://www.teebweb.org/wp-content/uploads/2017/03/TEEB-Adjara-Final-Report.pdf.

Georgia: Towards Green and Resilient Growth 19
• Pollution from unregulated waste disposal is a widespread problem in the coastal zone. Inappropriate waste disposal can result in soil and aquifer contamination. In coastal and marine areas, it can cause problems such as the deterioration of marine water quality, modified ecosystems, reduced tourism opportunities, fish contamination, and sometimes increased human illness and possibly mortality. Diffuse waste, such as that from plastic fragments, also pose increasing challenges in coastal Georgia. Property markets penalize properties in the proximity of landfills and waste management sites, which expose these properties to the transit of waste loads, unpleasant odor, and other disturbances. The annual cost of degradation associated with the impact of regulated and unregulated landfills and waste disposal sites on property values is estimated at US$2.5 million in the eight coastal municipalities.
Figure 4.2 Estimated Cost of Environmental Degradation in the Coastal Zone
Source: World Bank. 2020d.
Waste Manegement
Soil Degradation (Agricultural and Forest)
Coastal Erosion
Floods Coastal
Floods inland (Pluvial, Fluvial)
US$ Million
6050403020100

Martvili Canyon in Georgia. A beautiful natural canyon near Kutaisi, with a mountainous river, blue crystal water and a boat trip.
Author: Aliona Birukova

Georgia: Towards Green and Resilient Growth 21
5. Pollution
5.1. Air Pollution Air pollution is a growing environmental challenge for Georgia. Both indoor and outdoor air pollution have a significant impact on human health attributed to compared to other countries in Europe.51 Average annual concentrations of particulate matter (PM) are higher than those considered to be safe for human health.52 One of the most damaging pollutants is PM2.5, a very fine particulate matter with an aerodynamic diameter of less than 2.5 micrometers. Given their small size, PM2.5 particles are capable of penetrating deep into the lungs, resulting in serious health impacts and even death.
Respiratory diseases associated with air pollution are increasing in urban areas. According to statistics released by Georgia’s National Center for Disease Control and Public Health, the number of registered cases of respiratory diseases in Tbilisi at the end of 2016 stood at 20 percent of the city’s total population .53 About 57 percent of Georgia’s population live in urban areas, with a third of the total population living in Tbilisi, which has an insufficiently developed public transport system. Consequently, a significant proportion of the population uses private vehicles as the preferred mode of transport. This demand has caused a notable inflow of imported used vehicles from Europe and Japan; as a result, more than 90 percent of the vehicle fleet in the country is 10 or more years old.54
People in rural areas continue to burn polluting fuels in their homes for cooking and heating. These cooking practices are inefficient and use fuels and technologies that produce high levels of household air pollution. In poorly ventilated dwellings, PM content in indoor smoke can be 100 times higher than the acceptable levels of fine particles.55 Exposure is particularly high among women, young children and elderly, who spend the most time indoors.
Based on mean daily concentrations, the annual average concentration of ambient PM2.5 is 20.6 μg/m3 for urban areas.56 The National Environmental Agency (NEA) is responsible for the assessment and monitoring of ambient air quality in Georgia. Starting in 2017, Georgia expanded the number of installed automatic monitoring stations to eight stations, located in Tbilisi, which has five stations, and in Batumi, Rustavi and Kutaisi.57 In 2018, Georgia adopted the EU limit value for annual average concentration for PM2.5 of 25 μg/m3; between 2019 and 2020 this value was exceeded, mainly in the winter season. The ambient PM2.5 concentration in Rustavi – a major industrial town – is higher than 50 μg/m3 for two consecutive months of the year. The annual average ambient pollution in Tbilisi, Kutaisi and Batumi are similar to other selected countries, as shown in Figure 5.1.
51 GBD. 2017a. “GBD Results Tool”. http://ghdx.healthdata.org/gbd-results-tool (accessed on June 19, 2020).52 WHO annual average PM2.5 air quality guideline value is 10 μg/m3. EU has a less stringent limit value of 25 μg/m3.53 Bloomberg CityLab. “Tbilisi comes up for air.” https://www.bloomberg.com/news/articles/2018-06-01/environmental-
activism-blooms-in-tbilisi-georgia (accessed August 4, 2020).54 Environmental Protection and Natural Resource Committee. 2019. “Thematic Inquiry Report of the Environment
Protection and Natural Resources Committee of the Parliament of Georgia on Air Quality in Tbilisi.” Prepared and published under the initiative of the Parliament of Georgia.
55 WHO 2018. “Household air pollution and health.” https://www.who.int/news-room/fact-sheets/detail/household-air-pollution-and-health (accessed on August 4, 2020).
56 Based on data published by the Ministry of Environmental Protection and Agriculture between January 2019 to March 2020.
57 Monthly average ambient PM2.5 concentrations recorded at air quality monitoring stations are shown in ANNEX C.

Georgia: Towards Green and Resilient Growth22
Figure 5.1 Annual Ambient PM2.5 Levels in Georgian Cities – International Comparison
Source: The Ministry of Environmental Protection and Agriculture of Georgia. 2020b; WHO. 2016.
Report: Georgia has adopted the EU annual PM2.5 limit value of 25 μg/m3 that presents the level where member states face
enforcement action by the European Commission. The WHO aspirational guidelines are more stringent recommending
annual PM2.5 concentration of 10 μg/m3. The EU has a long-term ambition to lower the enforcement threshold to the level
recommended by the WHO.
In rural areas, the annual mean concentration of ambient PM2.5 is assessed at 17.9 μg/m3 but household air pollution (HAP) is higher than in urban areas. About 40 percent of Georgia’s population lives in rural areas, with lower Ambient Air Pollution (AAP) levels due to lower traffic and industrial activities. Given the absence of automatic monitoring stations in rural areas, the study uses mean ambient concentration of PM2.5 estimated by the World Health Organization (WHO) in 2016.58 HAP is higher in rural areas, as most rural households have no access to clean fuels for heating and cooking. During the winter period, households use wood for heating, leading to indoor PM2.5 pollution levels estimated at 100 μg/m3. Close to one in five of the rural population, 18 percent, lives in households with primary reliance on solid fuels for cooking, mainly wood.59 The average annual concentration of PM2.5 is estimated at 200 μg/m3 for households where cooking is done inside the main house without a separate room, while the concentration is estimated at 100 μg/m3 if the household has a separate room or building for cooking, or if cooking is done outdoors.
The total annual mortality attributed to air pollution in 2018 was estimated at 4,056 people. Estimated annual mortality by cause attributed to ambient and indoor air pollution is presented in Figure 5.260, derived using annual average exposure to PM2.5 pollution in urban and rural areas, and country-specific data on mortality by cause, published by the Global Burden of Disease (GBD).61 Ischemic heart disease (IHD) is the most common of the cardiovascular diseases and accounts for 36 percent of total annual cases of mortality in 2018. About 67 percent of deaths occur in the age group of 70 years and above; this population subgroup should be a focus of specific mitigation measures to reduce the impact of air pollution in Georgia. Almost 50 percent of total premature mortality attributed to air pollution is due to indoor air pollution in rural areas.
58 WHO. 2016. “Global Health Observatory data repository.“ https://apps.who.int/gho/data/view.main.AMBIENTCITY2016?lang=en (accessed on June 19, 2020).
59 UNICEF. 2019. “2018 Georgia MICS (Multiple Indicator Cluster Survey).” Survey Findings Support. https://www.unicef.org/georgia/reports/2018-georgia-mics-multiple-indicator-cluster-survey.
60 For detailed discussion on the methodology, see ANNEX D.61 GBD. 2017a. “GBD Results Tool”. http://ghdx.healthdata.org/gbd-results-tool (accessed on June 19, 2020).
Rustavi
Krakow
Sarajevo
Sofia
Belgra
de
Wars
aw
Kyiv
Zagreb
Tbilisi
Ankara
Batum
i
Kutaisi
Tivat
Ann
ual a
mbi
ent
PM25
( μ
g/m
3 )
35
Georgia Limit Value
WHO Guaidline
30
25
20
15
10
5
0

Georgia: Towards Green and Resilient Growth 23
Figure 5.2 Annual Mortality by Cause and Age Group Attributed to PM2.5 Concentration in 2018
Source: World Bank estimates
Report: IHD = Ischemic Heart Disease, COPD = Chronic Obstructive Pulmonary Disease; LC = Tracheal, Bronchial, and Lung
Cancer; LRI = Lower Respiratory Infection; Diabetes = Diabetes Mellitus Type 2
The annual mortality rate attributed to AAP is estimated at 109 deaths per 100,000 habitants in Georgia. This is high by European standards; regionally, Georgia follows Bulgaria and Ukraine with the highest rates of mortality from air pollution (Figure 5.3).
Figure 5.3 Annual Mortality Due to PM2.5 Concentration – International Comparison
Source: WHO. 2016.
Ann
ual c
ases
of m
orta
lity
2 500
2 000
1 500
1 000
500
00-4 5-14 15-49 50-69 70+
IHD Stroke
Age group
COPD LC LRI Diabetes
Bulgaria
Ukrain
e
Georgia
BiH
Monte
negro
Poland
Croatia
Serbia
Turkey
140
120
100
80
60
40
20
0
Ann
ual m
orta
lity
per 1
00
,00
0 c
apit
a

Georgia: Towards Green and Resilient Growth24
The economic cost associated with the health burden from exposure to air pollution in Georgia is estimated at US$560 million, equivalent to 3 percent of GDP in 2018 (Table 5.1). This is a welfare loss, associated with exceeding the WHO guideline, that could have been avoided if exposure to PM2.5 would have been reduced to 10 μg/m3. The annual cost of this was estimated in the CEA62 of 2015 as between 3 percent and 9 percent of national GDP in 2012. Given the fundamental changes in methodology and the availability of continuous monitoring data of ambient PM2.5 concentrations in the major cities, the estimated annual cost of the health impact is not fully comparable with the cost of air pollution estimated in 2015.
Table 5.1 Annual Welfare Loss of Ambient and Indoor Air Pollution Exceeding WHO Guideline
Ambient air pollution (AAP) Household air pollution (HAP)
– US$ million –Urban areas 150 50Rural areas 30 330Total 180 380Equivalent to 3% of GDP in 2018
Source: World Bank estimates.
The annual welfare loss associated with exceeding the WHO guideline of 10 ug/m3 is lower in Georgia than in selected EU and Western Balkan countries. Figure 5.4 presents annual costs associated with exceeding the WHO guidelines on PM2.5 annual average concentration in selected countries.63 The comparison is limited to urban population exposure to ambient PM2.5 concentrations. Measured as an equivalent of GDP in 2018, Georgia has a lower total cost than Bulgaria, Poland, Greece, Hungary, Slovakia, Romania, Czech Republic, Bosnia and Herzegovina and North Macedonia. Georgia’s urban population is most exposed to AAP, with Rustavi most polluted. It is in these areas that air quality improvement programs should be implemented.
Figure 5.4 Welfare Loss Associated with Exceedance of WHO Guideline in Selected Countries, 2018
Source: World Bank staff own estimations. Based on EEA. 2019 and GBD. 2017a.
Report: Estimates assume that urban population in each country is exposed to AAP above the WHO guideline. The method does
not account for double counting in the urban population exposed to both ambient and household air pollution.
62 World Bank. 2015.63 Details of the estimation are presented in ANNEX E.
6 %
5 %
4 %
3 %
2 %
1 %
0 %
Bulgaria
North M
acedonia
Poland
Hungary
Greece
Bosnia and H
erzegovin
a
Croatia
Czech Republic
Slovak R
epublic
Romania
Georgia
ItalyA
nnua
l wel
fare
loss
in %
of C
ount
ry’s
GD
P

Georgia: Towards Green and Resilient Growth 25
In areas with high pollution prevalence, people with cardiovascular diseases and respiratory distress caused or worsened by long-term exposure to air pollution are likely to be more vulnerable to COVID-19. Analysis from the Severe Acute Respiratory Syndrome (SARS) coronavirus outbreak in China in 2003 found that infected people living in areas with higher air pollution levels were twice as likely to die as those in less polluted areas.64 Lowering air pollution levels can help reduce risks associated with COVID-19 and possible future pandemics. Unlike in Europe and China, which have seen a significant drop in nitrogen dioxide concentrations due to the shutting down of industrial activity and reduced traffic pollution in rural Georgia comes mainly from solid fuel for heating and cooking. This means that pollution has not reduced, and people continue to heavily exposed. A likely economic downturn coupled with an increase in unemployment will impact the spending of private households, likely inclining the choice of fuel towards low-grade fuels and increasing household air pollution.
5.2. Exposure to LeadHigh exposure to lead among children is leading to health impacts; particularly to the reduced cognitive ability, even at low levels of exposure.65 Cognitive ability loss has long-term consequences expressed in the intelligence quotient (IQ) loss for those affected and can lead to reduced productivity. Therefore, reducing lead exposure at an early age can have major economic benefits of increasing per-capita productivity and income While there is no known level of lead exposure that is considered safe for human beings, a measurement of 2 micrograms per deciliter (μg/dL) of venous blood is the reference level at or above which the literature recommends initiating public health actions (see ANNEX F).
Georgia is well equipped with information on lead exposure among children. In a recent Multiple Indicator Cluster Survey by UNICEF66, samples of venous blood were collected from 1,578 randomly-selected two to seven-year-old children from across Georgia, providing a nationally representative sample of lead prevalence (blood lead level, BLL).67 Extensive information on exposure to lead in Georgia suggests a large disparity in the economic burden of lead; this may be driven by regional characteristics (Figure 5.5).
64 The Guardian. 2020. “Air pollution likely to increase coronavirus death rate, warn experts.” https://www.theguardian.com/environment/2020/mar/17/air-pollution-likely-to-increase-coronavirus-death-rate-warn-experts (accessed on August 4, 2020).
65 Lanphear, B. P., R. Hornung, J. Khoury, K. Yolton, P. Baghurst, D. C. Bellinger, R. L. Canfield, K. N. Dietrich, R. Bornschein, T. Greene, and S. J. Rothenberg. 2005. “Low-level environmental lead exposure and children’s intellectual function: an international pooled analysis.” Environmental Health Perspectives, 113:894–899.
66 UNICEF. 2019. “2018 Georgia MICS (Multiple Indicator Cluster Survey).” Survey Findings Support. https://www.unicef.org/georgia/reports/2018-georgia-mics-multiple-indicator-cluster-survey; Ruadze, E., I. Khonelidze, L. Sturua, P. Lauriola, H. Crabbe, T. Marczylo, G.S. Leonardi, and A. Gamkrelidze. 2020. “Addressing lead exposure in children in Georgia: challenges and successes of a multi-agency response.” European Journal of Public Health, 30(Supplement_5):166-145.
67 Inductively Coupled Plasma Mass Spectrometry (ICP MS)

Georgia: Towards Green and Resilient Growth26
Figure 5.5 Blood Lead Level in Georgia, 2018
Source: UNICEF. 2019.
Based on the UNICEF study68, the annual cost of lead exposure in Georgia is estimated at about US$530 million, equivalent to 3 percent of GDP in 2018 (Table 5.2). This impact is unevenly distributed, with Western Georgia losing about 3-4 percent of GDP and Eastern Georgia losing 2-3 percent of GDP (Figure 5.6). Most of the impact is experienced in Tbilisi, where each child loses about 4 IQ points due to exposure to lead in early childhood, with associated economic costs of about US$200 million annually.
Monitoring of lead exposure and its sources requires further corroboration and validation in Georgia. Lead monitoring also informs other health issues, and many of the measures to improve analysis of exposure to lead through surveillance, case finding, and data collection and dissemination are also relevant to efforts to track other health related risks.
Table 5.2 Annual Impact of Lead Exposure
Region IQ loss per child Total cost US$ million % of GDP in 2018Tbilisi 4.1 198 2.5Autonomous Republic of Adjara 6.9 59 4.2Guria 6.4 10 3.9Imereti 5.7 50 3.5Kakheti 3.7 18 2.2Mtskheta-Mtianeti 3.9 9 2.4Racha-Lechkhumi and Kvemo Svaneti 5.7 3 3.5Samegrelo-Zemo Svaneti 5.8 29 3.5Samtskhe-Javakheti 4.5 13 2.7Kvemo Kartli 3.9 29 2.4Shida Kartli 3.7 14 2.3National 4.9 527 3.0
Source: World Bank estimates.
68 UNICEF. 2019. “2018 Georgia MICS (Multiple Indicator Cluster Survey).” Survey Findings Support. https://www.unicef.org/georgia/reports/2018-georgia-mics-multiple-indicator-cluster-survey.
Mean BLL level inchildren 2-7 years of age,
μg/dl
Powered by Bing© GeoNames, HERE, MSFT
13
4

Georgia: Towards Green and Resilient Growth 27
Figure 5.6 The Annual Cost of Exposure to Lead (% GDP by the administrative region)
Source: World Bank estimates.
% GDP loss
Powered by Bing© GeoNames, HERE, MSFT
4.2
2.2

Tbilisi at sunset. Georgia. City landscape in summertime.
Author: Grisha Bruev

Georgia: Towards Green and Resilient Growth 29
6. Government Response and Financing
6.1. Current Legislation and InstitutionsGeorgia’s national development strategies emphasize the importance of sustainable development. The vision for national development is driven by the “Georgia 2020” Platform and Development Strategy. This notes as major reasons for low productivity of natural resource-based sectors the inefficient use of natural resources and extensive agricultural production, combined with a low level of technological development and innovation, as well as farm fragmentation.
The Third National Environmental Action Programme of Georgia (NEAP-3) 2017–2021 is the key policy document. It is influenced by (i) the EU-Georgia Association Agreement, (ii) United Nations Sustainable Development Goals and (iii) key international agreements, and relevant national policy and strategic documents. The strategic objectives reflected in the NEAP-3 are:
• Improving the status of the environment, ensuring the protection and sustainable use of natural resources, and mitigating risks to human health and the welfare of the population.
• Increasing compliance with the obligations under regional and global environmental agreements, and further approximation with the EU’s overall environmental policies, framework legislation and directive-specific requirements.
• Increasing the capacities of the administrative structures required to ensure efficient environmental management and the enforcement of environmental legislation.
• Promoting sustainable development through the integration of environmental aspects into social and economic sector policies.
While Georgia has made significant progress in updating its environmental legislation, there are important gaps between the national legislation and good international practice.69 The adoption of several relevant environmental laws, currently in draft, would significantly strengthen the national regulatory system. Legislative developments are also needed in the areas of labor and working conditions; social assessment; valuation of and compensation for land; property and economic losses; and community health and safety. Enforcement of environmental laws should be strengthened by concrete policy guidelines and the increased implementation capacity of key institutions, such as MEPA. Development of environmental and social management systems within project-implementing institutions (including government agencies and state-owned enterprises) would bring both quality and consistency to policy implementation (see Table 6.1; for discussion on the forest code see Chapter 7).
69 World bank. 2020a. “Analysis of Gaps between National Legislation of Georgia and World Bank Environmental and Social Framework.” Washington DC: The World Bank. http://documents1.worldbank.org/curated/pt/105031592550795667/pdf/Analysis-of-Gaps-between-National-Legislation-of-Georgia-and-World-Bank-Environmental-and-Social-Framework.pdf.

Georgia: Towards Green and Resilient Growth30
Table 6.1 Environmental Laws in Georgia in 2014-2020
Law (draft) Main Features(i) Law of Waste Management Code (2015)
Protects environmental and public health by providing an enabling environment for circular economy. It establishes Extended Liability of Producer to (i) make their products least damaging to the environment and generating minimal amount of waste; and (ii) assume responsibility for the recovery and final disposal of waste generated from their products.
(ii) Law on Environmental Assessment Code (2017)
Introduces screening and scoping phases in the environmental impact assessment (EIA) process; mandates disclosure of documentation generated in the EIA process and public participation in decision-making; and introduces trans-boundary EIAs and strategic environmental assessments.
(iii) Law on Energy Labelling
Mandates provision of information on the parameters of energy demand on the labels of products traded and operated in Georgia so that consumers can take informed decision while purchasing these products based on their energy efficiency.
(iv) Law on Forest Code (2020)
Sets forth the principles of sustainable forest management and institutions based on a revised forest definition, categorization of the types of forest use and forest ownership. The code establishes ecosystem service delivery function and mandates public participation in decision-making on forest use and its management.
(v) Law on Energy Efficiency (2020)
Aligns with the EU directives and Georgia’s NDCs, provides legal grounds for setting forth energy efficiency norms and rules for certifying the energy efficiency of buildings, and requires development and Government approval of three-year long Energy Efficiency Action Plans.
(vi) Law on Energy Efficiency of Buildings (2020)
Formulates rules and methodological principles for calculating the energy efficiency of buildings; introduces minimal requirements for energy efficiency and regulates conduct of inspection; and defines requirements to be met by independent experts authorized to undertake certification and inspection.
(vii) Draft Law on Water Resource Management
Establishes integrated water resource management based on the principle of watershed-based management of water resources and the development of 6-year-long watershed management plans.
(viii) Draft Law on Biodiversity
Covers not only wildlife species, but their habitats and natural landscapes, and requires that activities affecting fauna, its habitats, breeding areas, corridors of migration and pathways to watering sources, are undertaken in a manner which preserves all of these elements. The lists of strictly protected and protected wildlife species and their habitats are to be compiled in accordance with EU directives, the Berne Convention on the Conservation of European Wildlife and Natural Habitats (Emerald Network), the Bonn Convention on the Conservation of Migratory Species of Wild Animals, and the Convention on International Trade in Endangered Species of Wild Fauna and Flora (CITES).
Georgia has a strong regulatory framework for protecting, conserving, and restoring biodiversity, but legal provisions for the sustainable use of natural resources are insufficient. The main pillars of this framework are the Law on Environmental Protection (1996; last amended in 2018); the Law on the System of Protected Areas (1996; last amended in 2018); the Law on Red Book and Red List of Species (2003; last amended in 2018); and a number of international conventions Georgia has joined. The national system of protected areas aligns with the principles established by the IUCN.
Georgia: Towards Green and Resilient Growth 31
The Law on Water (1997; last amended in 2018) was enacted to prevent water pollution and ensure the efficient use of water but lacks adequate enforcement mechanisms. It does not require an EIA or the issuance of an environmental permit to construct municipal water supply systems or for water intake from surface-water bodies. As a result, such systems continue to be built and resources exploited without considerations of environmental implications. Only groundwater extraction for municipal water supply is subject to licensing. National legislation prioritizes municipal water supply for domestic consumption over other types of water use. Other principles of water sharing and prioritization (e.g. for irrigation, and power generation) are not explicitly stipulated. New water legislation, based on the watershed-based principles of water use planning and management, is currently in draft.
The national regulatory framework for pollution prevention, based on the Law on Environmental Protection (1996; last amended in 2018), prioritizes public health protection and sets thresholds for concentrations of pollutants. Every investment project requires that the expected emissions (including noise) and discharges be calculated as part of the EIA, to prove the intended project’s compliance with the established thresholds. Software modeling of emissions is broadly used for this purpose. Industrial facilities, if not fully compliant, are required to submit emission/discharge calculations to MEPA, along with time-bound plans for acquiring less-polluting technologies. However, technical capacities to implement the legislation are weak and policies are not effective.
The Waste Management Code (2015; last amended in 2019) is harmonized with conventional policies of waste management, including a strong emphasis on reuse, recovery, and even the circular economy. The law introduces a waste management hierarchy, listing prevention, preparation of reuse, recycling, recovery, and disposal in the conventional order of preference for waste management solutions. Industries generating solid waste and hazardous waste above annual threshold volumes must develop waste management and disposal plans for MEPA’s approval. The dumping of waste and the mixing of hazardous waste with other types are strictly prohibited. In addition, the “polluter pays” principle has been adopted. However, the code establishes later dates for enacting several provisions because, at present, there is an acute lack of waste management infrastructure, and such provisions are seen as expensive for businesses.
National legislation focuses mainly on protecting and conserving species within protected areas, and less on preserving habitats. Although the Law on Red Book and Red List of Species prohibits any activities that would damage habitats that support species under protection, no differentiated approaches are established for transformed, natural, and critical habitats. Prohibiting or permitting various activities inside habitats mostly depends on whether habitats are located inside or outside of designated protected areas. National legislation does not include a definition of or requirement for biodiversity offsets. These may be provided to a limited extent based on international treaties ratified by Georgia, such as the Ramsar Convention on Wetlands of International Importance especially as Waterfowl Habitat and the Bern Convention on the Conservation of European Wildlife and Natural Habitats. Finally, ecosystem services are not referred to in the national legislation. However, various laws make general statements about the State’s obligation to maintain a clean and livable environment for the benefit of citizens, and to require that forests, biodiversity, water, and other elements of natural capital are used in a manner which sustains their protective, productive, recreational, and cultural functions.
Georgia is party to the Bern Convention on the Conservation of European Wildlife and Natural Habitats and is in the process of developing the Emerald Network, made up of areas of special conservation interest. Georgia made substantial progress between 2007 and 2019 in expanding the protected areas network from 7.1 percent of national territory in 2007 to 9.9 percent in 2019. However, the Aichi Biodiversity Target 1170 aims for the conservation of at least 17 percent of terrestrial and inland water areas and 10 percent of coastal and marine areas by 2020, especially in areas of particular importance for biodiversity and ecosystem services. Georgia is striving to progress towards Aichi Biodiversity Target 11, although there is still a long way to go. A new biodiversity law is currently under preparation, and it is expected to develop a clear framework for the management of the Emerald Network sites in the country.
70 Tenth meeting of parties to the Convention on Biological Diversity was held in October 2010 in Nagoya, Aichi Prefecture, Japan, and adopted revised and updated Strategic Plan for Biodiversity, including Aichi Biodiversity Targets for the period of 2011-2020.

Georgia: Towards Green and Resilient Growth32
The European Green Deal (EGD)71 was announced by the European Commission (EC) in 2019, and it is seen as an important reference point for Georgia as an EU-neighboring country. The EGD resets the EC’s commitment to tackling climate and environmental-related challenges. It is a new growth strategy that aims to achieve climate neutrality in 2050, and to decouple economic growth from resource use. The EGD also aims to protect, conserve and enhance natural capital, and to protect the health and well-being of citizens from environment-related risks and impacts. There are several important elements of the EGD that are related to environmental sustainability, including zero-pollution environment and conservation of ecosystems and environment, among other pillars. The EGD directly affects EU Neighborhood Policy countries like Georgia. The lawmaking process in environmental management has also been shaped by the Georgia’s Association Agreement with the EU signed in June 2014.
Georgia’s NDC addresses both climate change adaptation and mitigation, emphasizing preparedness, adaptive capacity, and reduced greenhouse gas (GHG) emissions as priorities for green growth.72 Georgia is analyzing the costs and benefits of adopting more aggressive carbon emission reduction targets to 2030. The NDC-SF, a multi-donor trust fund created to facilitate the implementation of the NDCs, has supported development of the National Action Plan for Adapting to Climate Change Impacts in the Black Sea Coastal Zone of Georgia. It will be a building block for the evolving National Adaptation Plan with the establishment of resilient landscapes as a climate change adaptation and mitigation measures.
6.2. Implementation Efficiency73
Although environmental regulations for waste management are in place, enforcement remains weak. Georgia lacks a comprehensive approach to waste management that could be achieved through a circular economy approach. The circular economy is a systems-level approach to economic development, based on the principles of keeping products and materials in use and regenerating natural systems.74 The current linear (take-make-dispose) economy is not addressing the issue of pollution in a systematic way. There are only a handful of standard sanitary landfills in the country, and a limited number of registered waste disposal facilities. Numerous illegal dump sites remain in rural Georgia, including, most harmfully, dumps inside riverbeds. There are no facilities for the final safe disposal of hazardous waste, and most entities that generate hazardous waste store it on their own premises, which does not require licensing. The risks to public and environmental health are high.
In some cases, policies introduced as a framework for clean production and the sustainable use of natural resources are ineffective and fail to create the right incentives. The “polluter pays” principle is introduced to environmental legislation, but incentives are not strong enough for behavioral change. Fines established for polluting industries are low and often ineffective in motivating polluters to make investments for acquiring cleaner technologies. In protected areas, administrations are encouraged to generate their own revenues, and are allowed to retain them. As a result, protected areas need to balance biodiversity conservation efforts with income-generating activities like tourism and recreation. While the Law on the System of Protected Areas is explicit about the types of activities allowed in the various zones of protected areas, room is left for management plans to specify individual investments and actions that do not always align with the spirit of the law.
71 A roadmap for making the EU's economy sustainable by turning climate and environmental challenges into opportunities across all policy areas and making the transition just and inclusive for all. Brussels, 11.12.2019 COM (2019) 640 final.
72 Ministry of Environment and Natural Resources Protection of Georgia. 2015.73 This section is largely based on World Bank. 2020a. “Analysis of Gaps between National Legislation of Georgia and
World Bank Environmental and Social Framework.” Washington DC: The World Bank. http://documents1.worldbank.org/curated/pt/105031592550795667/pdf/Analysis-of-Gaps-between-National-Legislation-of-Georgia-and-World-Bank-Environmental-and-Social-Framework.pdf..
74 Defined by Ellen MacArthur Foundation launched in 2010 to accelerate the transition to a circular economy.

Georgia: Towards Green and Resilient Growth 33
Implementation of modern environmental and natural resource management legislation is significantly constrained by insufficient technical capacity of the administrative bodies. The adoption of transformational legislation to manage water resources, forests, and biodiversity (see Table 6.1 above) will require new areas of expertise in MEPA and its subordinate bodies - the National Forest Agency and the Agency of Protected Areas. Obvious needs for capacity development include developing and implementing landscape and forest management plans; administering forest registry and inventory databases; identifying and valuing ecosystem services; managing and monitoring of the Emerald Network sites; and designing and provisioning biodiversity offsets. The mandate of the Department of Environmental Supervision (DES) of MEPA includes general inspection for compliance with environmental legislation in Georgia; this implies a vast range of pollution control responsibilities, too broad to allow for tracking specific mitigating measures.
6.3. Financing Effective and cost-efficient environmental management systems in Georgia are affected by the lack of adequate financing to support implementation. Environmental management has received notable domestic resources both from the state and local authorities, and international development partners which have contributed about 39 percent to 47 percent of the total environmental expenditures at the national level (Figure 6.1 and Figure 6.2). Still, financial resources fall below estimated needs. For example, implementation costs for the new Forest Code have been estimated at US$60 million75 – roughly two times the whole annual environmental budget allocation across all sectors. Additionally, most domestic funding is allocated to the central administration and NEA. While the detailed breakdown of domestic public expenditure is not available, it is likely that much of the budget allocation is for recurrent costs, and investment budgets are relatively small.
Figure 6.1 National Environmental Expenditures
Source: Ministry of Finance of Georgia. 2020; National Environmental Agency of Georgia. 2020; information for NEA budgets
2017 and 2018 was obtцained from the Agency directly. MENR: Ministry of Environment and Natural Resources was merged
with the Ministry of Agriculture in 2017 to become MEPA.
75 Estimate made in an informal internal MEPA discussion report.
US$
Mill
ion
2014 2015 2016 2017 2018
MENR
40
35
30
25
20
15
10
5
0
NEA Agricultural Research Waste Manegement

Georgia: Towards Green and Resilient Growth34
Development partners provide close to half of public funding for the environmental sectors. The annual external financing has been in the range of US$20–25 million, with the trend in external funding increasing slightly through the 2010s. Most of the projects financed by external partners target solid waste management, while other sectors responsible for most of the estimated annual CoED received less support. The COVID-19 pandemic and its economic impacts will further increase fiscal stress and with it the need for development partner support for economic recovery and environmental priorities. It highlights the importance of “win-win” policies and investments that address immediate recovery needs while laying the foundation for long-term green growth.
Figure 6.2 Contribution to Environmental Expenditures from Development Partners
Source: Ministry of Finance of Georgia. 2020; National Environmental Agency of Georgia. 2020.
2014 2015 2016 2017 2018
Solid Waste Management Protected Areas
Environmental Policy
Coastal Marine Protection
Forests
Other
Disaster Preparedness
Biodiverisity
US$
Mill
ion
30
25
20
15
10
5
0

Mountain river forest in Georgia
Аuthor: Evgeniya Tiplyashina

Georgia: Towards Green and Resilient Growth36
7. Enhancing Natural Capital: a Case-Study in the Forest Sector
Georgia boasts a rich diversity of forest ecosystems and forest cover. Forests contribute to a diverse economic base and local markets for timber, fuelwood, and wood products, supporting the development of small-, medium-, and large-scale forest industries, jobs and income. Yet, the value of such diverse contributions depends on the sustainable management of forests. In 2017, 44.8 percent of the country’s territory was registered as forest land (3,124,200 ha),76 while the area with actual forest cover accounts for 2,690,000 ha (38.5 percent). The total volume of forest is 454.5 million m3 and the annual average increase is around 4.5 million m3. Effectively all (95 to 98 percent) of Georgian forests are natural in origin and represent a globally important habitat. Georgia boasts up to 400 species of trees and shrubs, of which 61 are endemic to the country, and an additional 43 to the Caucasus region. Georgian forests represent not only a rich and unique habitat for fauna, but also an important migration corridor for various bird species. The Georgian forests have been ranked among globally valuable areas for their biodiversity by the WWF and IUCN.77
Forests in Georgia are publicly owned. There are, however, state owned forests that have been given to the Church or leased under long-term concessions to private operators. Timber harvesting licenses, or concessions, with duration of a maximum of 20 years were commonly issued from 2006 to 2012. There are also licenses issued for shorter duration of 5 or 10 years. The licenses were issued through auctions to ensure transparency and equal opportunities for various firms. However, as the State Audit Office indicated,78 this did not really happen, and the process was not truly competitive. There have also been various governance and management shortcomings in the concessions, and new ones have not been issued since 2012.
Forests are the most important source of wood and non-wood products, including fuelwood, for local communities (see Section 3.1.3). Fuelwood is the primary energy source for cooking and heating in rural areas, and a substantial portion of the wood harvest is for fuelwood production. However, the current sustainable wood supply is inadequate to satisfy demand. The official firewood production estimate in 2017 was 630,000 m3, which is close to the levels across the previous four years. Much of this firewood is obtained through the soon-to-be-discontinued social cut system (Box 7.1). However, independent studies indicate that the actual numbers are much greater. For example, a study from 201679 estimates that, in 2014, the volume of timber harvested for fuelwood and industrial use was around 2.7 to 3 million m3, or four to five times the officially recorded harvest. Roundwood export from Georgia is prohibited, and logs go through processing to produce sawn wood and other products for exports and use in domestic markets.
76 There has not been a recent national forest inventory (NFI) in Georgia and much of the data is outdated. An NFI is currently ongoing with support from the Government of Germany and results are expected in 2020. Currently, 22.6% of the forest fund is located in territories not under Government control (507,000 ha in the Autonomous Republic of Abkhazeti and 173,600 ha in the Samachablo/Tskhinvali region) (The National Forest Agency of Georgia. 2020. “Georgian Forest (English).” http://forestry.gov.ge/Ge/Page/GeorgianForests/).
77 Ministry of Environment and Natural Resources Protection and National Forestry Agency of Georgia. 2014. “National Forest Concept for Georgia.” http://environment.cenn.org/app/uploads/2016/09/CENN-BROCHURE-reduced-ENG.pdf.
78 State Audit Office of Georgia. 2016a. “Performance Audit of Forest Commercial Resource Management.” https://sao.ge/en/performance-audit-of-forest-commercial-resource-ma201911290332454en.html.
79 Garforth, M., S. Nilsson, and P. Torchinava. 2016. “Wood Market Study: Integrated Biodiversity Management – South Caucasus.” Consultant report by GFA Consulting Group.

Georgia: Towards Green and Resilient Growth 37
Box 7.1 The ‘Social-Cut’ System in GeorgiaWood energy is by far the most important type of forest use in Georgia, covering around 50 percent of the population’s energy needs. Forests and forest authorities provide many social services without financing from formal social programs. For example, the country has a system of social forest management called “social-cut”, through which rural communities are entitled to subsidized fuelwood from state forests. However current forest use is considered unsustainable, almost entirely due to fuelwood extraction. While contributing positively to meeting energy needs of rural poor and public institutions such as schools, the harvest levels are above sustainable levels and the system also encourages and hides illegal logging.
Recent official estimates put annual fuelwood use at about 3.5 million m3, while the sustainable yield is estimated at 0.6 million m3. Another study, by the Caucasus Environmental NGO Network in 2016, estimated that the sustainable supply would be only 0.3 million m3, while use would be 2.8 million m3. This demonstrates that supply estimates are somewhat inaccurate due to the lack of detailed data. Be this as it may, there are strong indications from Global Forest Watch that forests are being degraded and deforestation is happening in parts of the country. The present social cutting system provides 600,000 families with the right to harvest fuelwood directly from the forest against a small payment. The system also diminishes the potential of the state forest management organizations to finance their operations.
The new Forest Code discontinues the social harvesting system. This is a key measure to enhance the sustainability of the forest sector, recommended in 2016 when the State Audit Office concluded in its audit on social use of timber resources and found that social cutting activity is not sustainable.80 The Office recommended that it is necessary to gradually reduce the demand for firewood, reduce the market for illegal timber, and ensure legal supply of firewood to the social sector in order to achieve sustainability.
80
The annual cost of deforestation and forest degradation in Georgia is estimated at about US$16 million in 2018 (Section 3.1.3). Forest ecosystem services have declined in recent years, and in many areas, forests are no longer able to provide protection against environmental hazards. Fuelwood extraction is a major cause of deforestation and forest degradation in Georgia. This report estimates annual forest degradation costs of about US$11.9 million. Average annual deforestation was about 500 hectares between 2001 and 2018, and costs are estimated at US$4 million annually.
Forest restoration has been declining over the past 15 to 20 years. Only small areas have been restored, compared with the level of deforestation (Section 3.1.3). Preference is given to natural regeneration and restoration is conducted mainly through assisted natural regeneration. However, current restored areas are only a small fraction of the size of those in the 1990s (Table 7.1). Replanting or seeding is used on about one-third of the total restoration area. Due to the lack of resources, recent efforts have not been sufficient to compensate for the losses and degradation caused by illegal logging, diseases and wildfires.
80 State Audit Office of Georgia. 2016b. “Social Use of Timber Resources.” https://sao.ge/en/social-use-of-timber-resources201911290332500en.html.

Georgia: Towards Green and Resilient Growth38
Table 7.1 Forest Restoration by Method (1995-2017, ha)
1995 2000 2005 2010 2015 2016 2017
– hectare –Forest restoration 13,912 1,158 74 165 142 178 156 - of which seeding and planting 1,002 258 10 111 21 50 44 assisted natural regeneration 12,910 900 64 54 121 128 112
Source: Based on statistics of the Ministry of Environmental Protection and Agriculture of Georgia; Forestry Agency of Adjara;
Agency of Protected Areas; and National Forest Agency.
Sustainable forest restoration that considers the interests of private and public sectors in Georgia will have multiple benefits. The current forest resource base in Georgia is not adequate for the timber industry to become a sizable contributor to the country’s GDP. Sustainable forest restoration, including the planting of fast-growing commercial species, could restore degraded landscapes and provide erosion control benefits. In addition, increased forest cover could become a feedstock for both wood the processing industries and the wood energy sector. Much of the economic activity and job creation would be rural, which could help bridge the rural–urban divide. Increased stocking could also act as a carbon sink.
Georgia has applied a modern approach to forest management, including for wood harvesting and processing, through comprehensive reforms. These reforms fundamentally change forest management policy and introduce new regulations, enforcement, and supervision to enhance sustainable management of forests and to reduce forest degradation. One breakthrough is the National Forest Concept (NFC),81 approved by Parliament in 2013. The challenges identified in the concept include a weak legal framework; a lack of proper consideration of forest values and functions in the decision-making process; rural poverty; insufficient awareness of communities about forest values; and inadequate financing. The NFC also promotes short-rotation plantations, and suggests that fuelwood from sustainably managed forests could be cut and collected by professional or state forest management bodies, instead of by the local population. Additionally, various strategies and action plans, international obligations, such as the Association Agreement, and the Deep and Comprehensive Free Trade Area (AA/DCFTA) agreement with the EU, and regulations like the new Forest Code, approved in May 2020, provide important inputs to the modern forest management approach. Georgia has also made commitments in its Nationally Determined Contribution (NDC) to maintain and expand their forest cover (Box 7.2).
In 2014 Georgia and the EU signed the Association Agreement, which entered in to force in July 2016 and covers collaboration in the forest sector (articles 233, 239 and 302). The Agreement includes commitments to forest conservation and the promotion of improved forest legality and governance. Legal and sustainable timber trade, including appropriate listings from the Convention on International Trade in Endangered Species, are also to be promoted.82
81 Decree of the Georgian Parliament. N1742-IS, 11.12.2013; Ministry of Environment and Natural Resources Protection. 2015.82 The European Union. 2014. Association Agreement between the European Union and the European Atomic Energy
Community and their Member States, of the one part, and Georgia, of the other part. Official Journal of the European Union 261, 30.8.2014, p. 4–743.
Georgia: Towards Green and Resilient Growth 39
Box 7.2 Forest and Landscape Restoration Commitments in Georgia’s NDC“Government of Georgia prioritizes three options for climate change mitigation activities in forestry sector: (a) establish Sustainable Forest Management (SFM) practices; (b) conduct afforestation/reforestation and assist natural regeneration; and (c) expand protected areas.
Unconditional commitment
Georgia is committed to:
• Strongly support CO2 reduction in one pilot area, the Borjomi-Bakuriani forest district (currently the only forest district where carbon emissions have been quantified) by at least 70% between 2020 and 2030, by strengthening law enforcement and introducing SFM practices. It is estimated that this measure will lead to an overall emission reduction of at least 1 million tons of CO2 over a period of 10 years in this district covering 45,000 hectares;
• Implement afforestation/reforestation activities on already identified 1,500 ha of degraded lands by 2030;
• Assist natural regeneration of forests through different silvicultural methods on 7,500 ha by 2030 in order to restore natural forest cover.
Conditional commitment
• In case of external financial and technical support, the country commits itself to afforest/reforest up to a total of 35,000 hectares, as well as supporting relevant activities to assist natural regeneration in identified areas needing afforestation / reforestation until 2030;
• If Georgia receives substantial financial and technical support for the development of forest inventories and remote sensing, as well as the development of internationally recognized practices for SFM and carbon monitoring for the identified forest districts 8 (covering up to 250,000 ha of forest lands) the country commits itself to support the sustainable management of forests with estimating measures leading to an overall carbon sequestration up to 6 million tons of CO2 on these lands over a period 2020-2030. These forest lands include the forest district of Akhmeta (covering up to 70,000 ha) where the first set of locality/site-specific criteria and indicators (C&I) for SFM will be selected/tested and implemented. The objective is to gain relevant expertise for further development of the C&I for SFM in the rest of identified forest lands to achieve the nation-wide development of SFM practices, thereby support the carbon sequestration;
• With financial support from international sources to set up an adequate infrastructure and assure effective planning for management of the additional protected areas during 2020-2030, country commits itself to expand the protected area from 0.52 million ha to 1.3 million ha (about 20% of Georgia’s territory) comprising at least 1 million ha of forests.”
Source: Ministry of Environment and Natural Resources Protection of Georgia. 2015. “Georgia’s intended nationally determined contribution submission to the UNFCCC.” https://www4.unfccc.int/sites/ndcstaging/PublishedDocuments/Georgia%20First/INDC_of_Georgia.pdf.

Georgia: Towards Green and Resilient Growth40
The new Forest Code builds the legal basis for improved forest management in the country. This code is based on the modern, multipurpose management of forests to sustainably benefit a broad range of stakeholders. The code includes the principle of dividing the national forests into four functional categories: protected forests; protective forests; resort and recreation forests; and utilization/production forests. It also establishes a new and improved institutional set-up with forest policy, management, and supervision functions clearly separated. The principle of sustainable forest management, including protection functions, cuts across these functional categories and across newly defined ownership categories.
The new Forest Code discontinues the social harvesting system and includes crucial institutional and operational changes. In 2016, the State Audit Office concluded in its audit on the social use of timber resources that social cutting activities are not sustainable.83 As one of the key measures to mainstream sustainability in the forest sector, the new Forest Code sets an end to the social harvesting system. The National Forest Agency (NFA) will oversee the management of state production forests (i.e. forests that are not protected areas). A strengthened Department of Environmental Supervision (DES) under MEPA will be in charge of supervision and law enforcement, while the Department for Biodiversity and Forest Policy will be in charge of related policies. The Government has also decided to establish a National Agency for Wildlife Management (NAWM, the former National Nursery), responsible for the development and implementation of biodiversity conservation measures outside protected areas, as well as for wildlife management, including hunting and fishing. The Agency will also support genetic material and nursery development.
The sector reforms will have a sizeable fiscal impact, crucial for financial support for COVID-19 recovery measures. In Georgia, the state budget receives a stumpage fee (of US$1-2.2, depending on species84) for firewood sold through the “social-cut” system (Box 7.1). According to ENPI-FLEG,85 US$189 million of stumpage value is lost annually in Georgia. The reason for this economic loss is the production of low-priced products, such as firewood, instead of higher-value products. In many cases, firewood is produced from relatively high-quality logs rather than from small diameter wood, thinning, deadwood, or harvesting and processing residues, and this also results in the accelerated degradation of forests, particularly those in close proximity to rural population centers.86 With reforms that encourage the production of high value products, budget revenue is expected to increase by almost 35 percent between 2020 to 2023, or over eight times as high as without the reform87 (Figure 7.1). The budget revenue would grow from about 1 percent to 8.5 percent of the total planned budget of the Ministry of Environmental Protection and Agriculture.88 This estimate includes the fiscal impact of reforms to reduce degradation and improve the productivity of forests in Georgia. Growing the productivity of forests and improving the environmental footprint of forest operations could support economic recovery after COVID-19 and create preconditions for transformational growth in the country.
83 State Audit Office of Georgia. 2016b. “Social Use of Timber Resources.” https://sao.ge/en/social-use-of-timber-resources201911290332500en.html.
84 Exchange Rate: 1 GEL = 0.34 US$ (reference year 2019)85 ENPI-FLEG. 2016. “Economic Effects of households’ firewood consumption and cost-benefit analyses of use of alternative
heating resources (English).” Study prepared by CENN/Davit Darsavelidze.86 The 2019 value of revenue loss can be estimated at GEL 586 million (US$244 million).87 Parliament of Georgia. “Explanatory Report on the draft law of Georgia Forest Code of Georgia (English)." https://info.
parliament.ge/file/1/BillReviewContent/214676 (accessed on August 5, 2020).88 Transparency International Georgia. 2018. “2019 Draft State Budget of Georgia: Analysis and Recommendations.” https://
www.transparency.ge/en/blog/2019-draft-state-budget-georgia-analysis-and-recommendations (accessed on October 15, 2020).

Georgia: Towards Green and Resilient Growth 41
Figure 7.1 Fiscal Impact of Sector Reforms (taxes and fees, 2019–2023)
Source: Parliament of Georgia. 2020.
The recent policy, strategy, and legal developments have significantly improved the environment for the promotion of a modern concept of sustainable forest management nationwide. The new Forest Code provides concrete guidance to promote sustainable forest management and the conservation of forest-related biodiversity, soil, and water resources. It also establishes an enabling framework for a more strategic allocation of resources and non-state sector investment to improve the performance of the Georgian forest sector and its contribution to national economic, social, and environmental objectives. However, there is still a pressing need to develop supporting by-laws and implementation guidance, and the implementation of these new policy directions will require notable international support. Further actions by both public and private sectors with domestic and external resources are required; these include:
• National forest inventories are required, to provide basic information on forests and development trends. These provide information for strategic planning and the monitoring of international commitments such as NDCs. Information from inventories needs to be publicly available.
• Consultative bodies should be supported in fostering open and constructive national dialogue towards sector development and to reduce conflict. Forests are under pressure from energy demand and other land uses including mining and infrastructure development and, addressing conflicting interests from different economic sectors requires cross-sectoral coordination. Ensuring cross-sector coordination and policy coherence could help to address this.
• Certification of sustainable forest management should be developed. This would provide independent verification that forests are managed in ways that are environmentally, socially, and economically sustainable.
• Forest and energy policies need to be coherent and supportive of sustainable biomass energy. The proposed new model for centralized fuelwood supply through the NFA has the potential to improve the efficiency of wood energy use in Georgia.89 Dry fuelwood also has benefits for indoor air quality.
89 Currently, most fuelwood is not dried, or seasoned. However, the net heating value of seasoned fuelwood with moisture content of 20 percent can be up to 80 percent higher compared to green fuelwood with a moisture content of 50 percent.
7
1,36
2019 2020
1,39
9
2021
1,43
10
2022
1,43
11
2023
1,39
12
with reformation of NFA without reformation of NFA
14
12
10
8
6
4
2
0
US$
Mill
ion

tower in Georgia and mountains
Author: Sobol Igor

Georgia: Towards Green and Resilient Growth 43
8. The Way Forward
Georgia’s environment is a great economic asset, but continuous high CoED estimates indicate the need for sustainable and greener economic development. Given Georgia’s environmental vulnerability, addressing environmental challenges will enhance the economic basis for growth and build climate resilience. This includes embedding environmental considerations in decision making and promoting environment-friendly sectors. The World Bank’s Systematic Country Diagnostic (SCD) from 201890 and the latest World Bank Country Partnership Framework (CPF, fiscal years 2019–22)91 prioritize sustainable economic growth and the pursuit of growth-oriented interventions that improve productivity, increase inclusivity and help to manage environmental risks.
A sustainable, greener development pathway for Georgia will require a targeted mix of enabling policies, incentives and public investments. These interventions are needed to address both the long-term structural challenges of the Georgian economy and to support post-COVID-19 recovery. The analysis on which this report is based has helped identify actions in the following four areas: 92
a) Strengthening forest and landscape management;
b) Sustainable development of coastal areas;
c) Pollution management; and
d) Three crosscutting themes:
• Supporting private sector engagement in natural resource management
• Green growth strategy: introducing a cross-sectoral approach to sustainability
• COVID-19 recovery
8.1. Sustainable Forest Management and Watershed RestorationGeorgia has made progress by reforming the institutional and legal framework of its forest sector (see Chapter7) through the establishment of a comprehensive national system for sustainable forest management. Forests and trees in the landscape are an integral component in maintaining healthy ecosystems, protecting biodiversity, and adaptation to and mitigating the impacts of climate change. They contribute to regulating the water cycle, and they act as natural filters for reducing soil erosion and natural hazards. Sector reform is expected to enhance the economic and social benefits of the forests.
The Government’s forest and landscape management program could focus on two mutually reinforcing interventions. The first of these is support for national and local forest institutions, forest management, forest-based livelihoods and sector reform at the national level. The second is geographically targeted support for the rehabilitation and improved management of degraded watersheds, particularly in the Eastern parts of the country.
90 World Bank. 2018a. “Georgia - Systematic Country Diagnostic: from reformer to performer (English).” Washington DC: The World Bank.
91 World Bank. 2018b. “Georgia - Country partnership framework for the period FY19-FY22 (English).” Washington DC: The World Bank.
92 There are also other areas of economic activity that are profoundly based on sustainable management of natural resources but fall outside the scope of the current analysis. These include such areas as developing, sustainable Blue economy development in the Black Sea and mining and extraction of non-renewable natural resources.

Georgia: Towards Green and Resilient Growth44
The legal reforms will require the support of implementation capacity at national and local level. Successful implementation of the reforms and of the new forest code would require investments and capacity building in the forest administration’s knowledge management, monitoring and planning systems, as well as in technical forest management. Introducing comprehensive forest management planning across the national forest estate requires resources: medium-term financing needs to implement the new forest code have been estimated at the minimum of US$60 million.93 This includes the development of new organizational arrangements, and forest restoration and rehabilitation at the national central level as well as at the regional and local levels. The major steps required to achieve these goals are:
• Improvement of forest management institutions to strengthen forest management capacity and revenue capture by the Government; and to increase monetary and non-monetary benefits from forests to local communities.
• Improvement of forest and land management; improvement of climate resilience and climate change mitigation through high quality management planning and operational management (including re/afforestation of degraded lands); and improving livelihoods through job creation and enterprise development.
• Investments in ecosystem services and developing mechanisms for the valuation and monetization of the benefits provided by nature. This includes distribution of these financial benefits to stakeholders, for example by using Payment for Ecosystem Services schemes.
• Implementation of good practices that can be scaled up and leverage private investment. The ongoing reforms have created a strong momentum for transforming Georgia’s forestry-related institutions into modern, service-oriented management organizations servicing multiple forest uses and a broad range of stakeholders from the rural poor to the private sector and the global community.
Addressing environmental degradation and reducing its cost requires geographically targeted interventions. This is particularly relevant in lagging regions where declining environmental conditions have adverse socio-economic impacts. For example, Eastern Georgia has a large population vulnerable to the impacts of land degradation and the declining quality of upland watersheds. Support for the rehabilitation and improved management of degraded watersheds would require investments in land management, landscape restoration, management capacity and small-scale infrastructure to improve environmental services from watersheds in the region. The focus could be on building nature-based solutions (“green infrastructure”), although conventional investments may be required to improve such services as water supply for consumption, industry, irrigation and energy (“gray infrastructure”).
Landscape restoration in priority areas would help improve land management and watershed services. Enhanced vegetation cover could improve climate resilience and contribute to climate change mitigation. Starting in selected locations in the most impacted and vulnerable areas would also in the development of locally adapted practices that could be scaled up and replicated in other fragile watersheds in Georgia. Expanding landscape restoration programs to the national level would require long-term commitment and financing from the Government. A good basis for this commitment would be the development of a systematic sequencing and prioritization framework based on objectively measured indicators including environmental, social and economic criteria. Prioritization of investment areas would need to be based on a transparent and participatory process.
93 Estimate made in an informal internal MEPA discussion report.

Georgia: Towards Green and Resilient Growth 45
8.2. Reducing Coastal Vulnerability A geographically targeted response to environmental degradation is needed to address the multiple challenges to Georgia’s coastal ecosystems. The Government has a primary goal of avoiding the loss of lives and reducing the impact of natural hazards on human health and ecosystems, specifically particularly flash floods in Western Georgia, and to minimize economic losses. Government resources need to be directed to improve the process of climate change planning for coastal Georgia to mainstream risk management for extreme weather events. This would include hazard identification, risk assessment and analysis, and modern prevention and monitoring systems. Georgia’s Government already conducts extensive geological studies in and around settlements and strategic infrastructure prone to the impacts of geologic activity. The number of meteorological and hydrologic monitoring stations is steadily increasing, and specialized equipment is provided for the enhancement of early warning systems.
A coastal zone development program would include targeted investment in the coastal areas to reduce vulnerability to natural disasters. This would be particularly valuable in increasing resilience to climate change. The investments would support activities such as flood and other natural hazard management, the prevention of coastal erosion, landscape restoration, and waste management. The key reference point for the investment programs would be national actions plans, currently under preparation, for climate change adaptation in coastal areas. The cost of coastal area adaptation programs is estimated at about US$600 million.94
A coastal zone development program would promote innovative approaches through partnerships with the private sector. Such activities as flood prevention and landscape restoration can often be conducted through collaboration between the public and private sectors. Coastal adaptation programs would allow innovative public–private-partnerships. For example, tourism, especially along Georgia’s coast, contributes to the country’s economic growth. Collaboration with private tourist operators would help in building sustainable recovery from the economic impacts of COVID-19 restrictions on international travel. Another option for private sector collaboration would be with the local insurance industry, which would have an interest in reducing the impact from adverse weather events on insured property. Georgia could benefit from regional initiatives and collaboration in the Black Sea Basin, where efforts are underway to improve management of coastal and marine resources based on Blue Economy principles (Box 8.1).
94 Green Climate Fund. 2018. “Georgia needs assessment.” Consultation Draft. https://www.greenclimate.fund/countries/georgia?f%5b%5d=field_date_content:2018#overview (accessed February 15, 2020).

Georgia: Towards Green and Resilient Growth46
Box 8.1 Blue Economy in the Black Sea BasinThe wider Black Sea area includes a population of 332 million people. The Black Sea countries rely on a healthy coastal environment for their fisheries and tourism industries. According to the General Fisheries Commission for Mediterranean (GFCM), marine capture fisheries in the Black Sea region produce an estimated total revenue of US$350 million annually, and account directly for more than 20,000 jobs, not including pre- and post-harvest employment. Tourist arrivals in the Black Sea region grew faster than the world average over the last two decades. with 143 million international tourist arrivals in 2018, and US$75 billion of international tourism receipts in member countries of the Organization of the Black Sea Economic Cooperation (BSEC).
With climate change likely to exacerbate coastal erosion, flooding and the environmental quality of the Black Sea, there is a need to adapt and build more resilient solutions and stimuli for the Blue Economy, as a key element of the sustainable economic development of coastal areas in each littoral state. Half a million people live in the coastal municipalities of Georgia dependent on the Blue Economy; they might be particularly affected by the CoED in the coastal zone (Chapter 4). The main tasks for the Blue Economy in Georgia are:
• Ensuring the protection and sustainability of the coastal and marine ecosystem by identifying and filling the key knowledge gaps; addressing critical levels of pollution; supporting sustainable fisheries and aquaculture; supporting innovation in infrastructure, specifically green infrastructure; and encouraging the production, management and sharing of knowledge about the marine and coastal environment for effective environmental monitoring and observation.
• Creating a competitive, innovative and sustainable Blue Economy to foster innovative business models, stimulate research and innovation, promote transport and digital connectivity, and encourage the development of relevant skills and employment growth.
• Fostering investments for Blue Economy by improving access to financial resources, encouraging sustainable investment in the Blue Economy, and promoting maritime entrepreneurship and clusters.
8.3. Pollution ReductionGeorgia strives to ensure a clean and safe environment for its citizens through sound pollution management. Third National Environmental Action Program (NEAP-3) (2018) is targeting (i) the reduction of air emissions through the regulation of air pollutants from various economic sectors; (ii) the development of an air quality monitoring and assessment system, (iii) the improvement of the state system for emission inventories and the establishment of the emission projections system, and (iv) the improvement of the chemicals management system with the implementation of an integrated inspection system to support national capacity to manage risks to public health. NEAP-3 also highlights the lack of finance to implement a comprehensive, fully automated system of air quality monitoring and improvements to emission inventories and projections, even with the ongoing EU support. Development of new legislation on atmospheric air protection and the legal framework for chemicals management is in progress, along with work on a number of sub-laws and regulations. The establishment of a unified state registry of hazardous chemicals, an Environmental Public Health Tracking system, and a system of inspecting industrial facilities handling hazardous substances remain on the agenda.

Georgia: Towards Green and Resilient Growth 47
Transport-related emissions are a significant source of local air pollution, especially in urban areas, while indoor air quality is a concern in rural areas. Action plans to reduce air pollution should address sources of both ambient and household air pollution. Strengthening vehicle inspection and maintenance programs, while enforcing measures to regulate importation of older, polluting vehicles should be a high priority in effectively reducing AAP in urban areas. Although Georgia’s fuel standards are moving toward EU standards, fuel quality inspections and monitoring systems need to be improved, with a clear assignment of responsibilities. The use of polluting fuels for cooking and heating is still high in Georgia, especially in rural areas. Bringing household PM2.5 concentration below recommended guideline values requires the implementation of a range of measures, from improving fuel quality to significantly improving or replacing stoves and boilers following standards of the EU Eco-design Directive.
Human exposure to toxic pollution requires efforts to eliminate occupational exposure, and particularly the exposure of children to lead. Georgia made an important step in identifying hazards from lead exposure and supporting a major survey to identify blood lead level (BLL) in children. The next step is to identify and address the major sources of lead exposure, separately for each contaminated zone, and to develop short-, medium-, and long-term measures to reduce lead exposure. An effective lead contamination reduction program requires consistent policies on chemicals and pesticides, and would include exposure mitigation, including fully enforced rules on major sources of lead and the prevention of uncontrolled lead emissions from construction sites. This would ensure that health risk control measures are operationalized across sectors and governance levels. Defined measures need to include clear targets, a timeframe, and performance indicators to monitor progress.
An action plan to reduce pollution would be based on four pillars: (i) clearly defined pollution problem assessment based on scientific evidence (including the identification of pollutants, pollutions sources, population-exposure, and vulnerable groups); (ii) a cross-sector strategy that brings together the relevant sectors across all levels of government; (iii) policy reform based on the economic impacts of pollution, especially among vulnerable groups and those affected by pandemics; and (iv) identifying co-benefits, especially the climate co-benefits of addressing air pollution, that would further strengthen the political and economic argument for action. The pollution reduction strategy should bring pollution levels below internationally accepted levels.
8.4. Harnessing the Private SectorEconomic management and governance reforms have earned Georgia a reputation of “star reformer”. Successful reforms form a helpful basis for building green jobs using Georgia’s natural resources sustainably. Georgia has introduced regulations that ease restrictions on business activities, while the country’s international ratings in governance and investment climate have soared. However, economic performance has not fully matched these ratings.95 Further actions to strengthen the enabling environment for the private sector should be streamlined to support sustainable investments in green and blue economies, and to reinforce economic diversification. The Government of Georgia could adopt policies to stimulate innovative ways to create competitive and sustainable green jobs.
Economic production activities in Georgia are largely conducted by the private sector, and natural resource-based economic growth and job creation needs to come from private businesses. Georgia privatized many of its state-owned enterprises in between 2004–2011; only selected assets remained under government ownership.96 Agricultural land is privately owned, while natural forests are mostly state-owned. Downstream sectors like the wood processing industry and tourism, are founded in private business. Even in forestry and wood production, most operative work in publicly owned forests is contracted to the private sector. As a result, further improvements
95 World Bank. 2018a.96 Gilauri, N. 2016. “Practical economics: Economic transformation and government reform in Georgia 2004-2012”. Chapter
6. Privatizing State-Owned Enterprises. (pp.113-124).
Georgia: Towards Green and Resilient Growth48
in the business environment and the competitiveness of private firms would be essential to ensure that natural resources and their sustainable use and management contribute to job creation. Environmental degradation also has an impact on businesses that do not directly use natural resources; for example, indoor and ambient air pollution have an adverse impact on labor health and productivity, and natural disasters impose a cost on all business, regardless of the sector. Reducing environmental degradation would thus lead to an improved business environment generally and help in creating sustainable employment in natural resource and environment-based industries.
Green jobs are often knowledge-intensive, entailing a combination of traditional wisdom and experience with high-tech skills required in disruptive technologies. Education and training are needed to foster these skills, enabling more people to take up green jobs. The loss of formal employment in polluting and environmentally unsustainable businesses needs to be compensated for by supporting formal and self-employment in sustainable nature-based businesses such as landscape management, food processing, fish processing, forestry, and recycling. Improved environmental management makes jobs safer, healthier and more productive. Many other countries in the region and globally are facing comparable environmental challenges to Georgia. A strong “green” business sector could thus open export opportunities for innovative forerunner industries.
Public investments in training, research, and product development services can help build the foundations of a modern green industry. Technical transitions in production technology would require both capacity building and financial support. Technical support and vocational training in innovative and environmentally sustainable practices would allow firms to develop more advanced business models and become more competitive. One option is to develop public-private partnerships through which public institutions support firms in product development, which can be a risky undertaking for which many small- and medium-size industries do not have the technical and financial resources required. Many small firms also lack knowledge about new markets, particularly high-end niche markets, outside their traditional markets. Public support and collaboration with other firms could help such businesses identify and take advantage of new market opportunities. Support to investments (e.g. tax breaks) in modern and efficient production technology could also be part of the transition to sustainability (Box 8.2).
Box 8.2 Public Policies and Private Sector Development: the Case of Sustainable Wood Energy
One example of public-private partnership is provided by the development of environmentally friendly household wood energy supply chains with social benefits. Forest and energy policies need to be coherent and supportive of sustainable biomass energy. Wood energy that uses small diameter wood and logging and processing residues may provide low carbon energy to institutions and households. As Georgia reforms its forest management systems, it will be necessary to ensure that all timber assortments are utilized efficiently and appropriately. This includes utilizing logging residues for energy or other uses where small diameter wood and residues can be used (e.g. certain board products). A steady supply of raw materials matched with existing household demand forms a good basis for developing sustainable rural small businesses.
Building the private wood energy industry may also require targeted financing for investment in such industries as pellet production. The proposed new model for a centralized fuelwood supply through the NFA has the potential to improve the efficiency of wood energy use in Georgia, where currently, most fuelwood is not dried or seasoned. However, the net heating value of seasoned fuelwood with moisture content of 20 percent can be up to 80 percent higher compared to green fuelwood with a moisture content of 50 percent. Dry fuelwood also has benefits for indoor air quality. It is essential that a new fuelwood system promotes efficient fuelwood use and that NFA and its contractors supply appropriately dried wood for energy use.
Based on World Bank. 2020.

Georgia: Towards Green and Resilient Growth 49
8.5. Green Growth StrategyMainstreaming an ambitious environmental agenda in national development plans could become a government priority. While Georgia has revised many of its environmental policies over the past decade, the reform agenda is still incomplete. Some key policies and legislations have not been finalized. There are also gaps in lower-level implementation regulations and institutional capacities to ensure implementation of policies. A “Green Growth Development Policy” would aim at wholesale engagement in transitioning Georgia toward a climate-resilient development pathway based on the sustainable use of natural resources. Additionally, the implementation of the EU–Georgia Association Agreement supports Georgia’s aim to apply EU standards, creating an ambitious agenda in the environmental field.
Financing an ambitious environmental agenda is a challenge and could be supported with a public environmental and climate expenditure review. The review would examine government resource allocations within and between sectors, and across governance levels, and assesses the efficiency and effectiveness of those allocations in the context of the framework and priorities for environmental management and resilience building. In Georgia, such a review could identify and assess areas where public income generation through different sources is insufficient to cover environmental and resilience climate expenditures and suggest options to balance revenues and costs. At the same time, green recovery packages could support financing high expenditures associated with the COVID-19 pandemic through approaches and investments that are sustainable and cost-effective, and that contain medium-term social expenditure pressures.
Georgia has expressed the intention of developing a Green Growth Strategy to modernize the economy, achieve sustainable development and to improve social, economic and environmental policy coherence. Georgia has joined the Organization for Economic Cooperation and Development (OECD) Green Growth Declaration (2015), as well as the Pan-European Strategic Framework for Greening the Economy (Batumi, 2017). The Green Growth Strategy should be a guide for achieving the country’s economic growth while protecting the environment, creating green jobs, and encouraging social equity.
A comprehensive “whole-of-government” approach to sustainability covering all sectors would focus on low carbon development that creates jobs. The approach would generate several co-benefits such as reducing waste and resource inefficiency, pollution, and congestion, while improving health outcomes, biodiversity and ecosystem sustainability. In addition to traditionally relevant “environmental” sectors (e.g. nature protection, pollution management, landscape and natural resource management), all aspects of public policy would need to be covered. Public policy areas - like taxation and subsidies, public procurement, infrastructure design and business development - can have far-reaching impacts on the environment. Thus, a “green growth policy” would facilitate a number of sector-specific engagements, in the short-, medium-, and long-term. This would require active collaboration and consultation with private sector representatives and business associations.
Economy-wide green growth policy should be supplemented with targeted sector-specific interventions in land and natural resource management. Table 8.1 presents the potential interventions, identified above, for key impact areas (including forest, watersheds, the coastal zone, and pollution) to reduce the costs of environmental degradation and support national policy priorities through several pathways. The crosscutting themes of sustainable landscape management, the improvement of human health, regional development, green development, rural development and the development of the bioeconomy based on private sector participation are relevant for all areas.

Georgia: Towards Green and Resilient Growth50
Table 8.1 Target Areas and Synergies between Different Options
Policy objective
Landscape management
Pollution, human health
Regional development
Bioeconomy, private sector
Green development
Rural development
Gov
ernm
ent i
nter
venti
on
Forest sector reforms XX XX X X
Watershed investments XX X XX X XX
Coastal area program X X XX X X
Air and lead pollution XX X X
Source: World Bank assessment.
Report: XX: focus area; X: supporting area
8.6. Sustainable COVID-19 RecoveryThe Georgian growth model needs to rebalance the economy toward productivity-led growth. This involves the productive use of natural resources and linking services like tourism to sustainable environmental management. An increase in productivity, efficient resource use, and capital accumulation in major economic sectors need to become the keys to future economic growth. Better management of natural capital is an important engine of growth for Georgia, and vice versa. If CoED is not addressed adequately, it will continue to be an impediment to important growth and inclusion engines. This is of particular concern, as it has a major impact on the most vulnerable populations, including the rural poor.
The COVID-19 pandemic reinforces the importance of reducing the vulnerability of the population and the economy to environmental pollution and natural resource degradation in the short-, medium- and long-term. It is essential to recognize that COVID-19 is not only a health issue, but one that impacts all areas of life, causing disruptions in economic, social and human development. In the short-term, a broad spectrum of income support is required, including cash transfers, and direct investments in economic activities, with a focus on productive and sustainable outcomes.
A COVID-19 recovery that is sustainable and inclusive would improve economic performance in the medium to long term. Georgia can adapt existing public work programs or design new approaches for quick deployment that include, for example, labor intensive conservation programs (Table 8.2). While the scaling-up or activation of public works will take time, it is important to start the preparation process as early as possible to mitigate the looming job crisis. This includes: (i) identifying the communities to be targeted; (ii) lining up ready-to-implement interventions; and (iii) defining health and safety norms to conduct public work prudently in the aftermath of the pandemic. In the long-run, private-public partnerships and structural reforms in agriculture and forestry could form new diversified green growth strategy that is resilient to demand and supply shocks.

Georgia: Towards Green and Resilient Growth 51
Table 8.2 Options for Mainstreaming Sustainability into COVID-19 Recovery
Interventions SectorsActions during economic downturn: preserving businesses and jobs, supporting livelihoods
• A broad spectrum of income support, including cash transfers in, in-kind and livelihoods support.
• Liquidity support to businesses, SMEs in particular, participatory community resource management mechanisms.
• Direct investments in economic activities focused on opportunities for sustainable scaling-up and fast-track approaches.
Agriculture, forestry and blue economy (tourism)
Facilitation of the first phase of sustainable recovery to protect households and vulnerable populations
• Reduction of pollution in urban and rural areas.
• Sustainable jobs creation, improving agricultural productivity to buffer pressures of migration back to rural areas.
• Sustainable food production and land management, reinforcing resilient landscape management with the private sector.
Cities, villages, forestry, agriculture, blue economy and coastal development
Establishing the foundations for “growing back better”
• Rebuilding economy for a post-COVID world; integrating investments with climate adaptation objectives and addressing the impacts of climate change.
• Building sustainable green and gray infrastructure.
• Green fiscal policies (taxation, subsidies).
• Supporting green finance for climate-smart agriculture, energy, transportation, and water resources management; reinjecting funds into coastal protection for tourist developments after the crisis; and empower private capital to leverage support of resilience measures.
Government, infrastructure, financial sector, all sectors of the national economy
Georgia: Towards Green and Resilient Growth52
References
Bloomberg CityLab. “Tbilisi comes up for air.” https://www.bloomberg.com/news/articles/2018-06-01/environmental-activism-blooms-in-tbilisi-georgia (accessed August 4, 2020).
Bloomberg Law. 2020. “Green Focus Pledged for the European Union’s Virus Recovery Plan.” https://news.bloomberglaw.com/environment-and-energy/green-focus-pledged-for-the-european-unions-virus-recovery-plan?context=article-related (accessed on August 4, 2020).
Brander L., C. Sovann, D. Kharazishvili, and N. Memiadze. 2016. “The Economics of Ecosystems and Biodiversity for the Forestry Sector of Adjara Autonomous Republic, Georgia.” Final Report prepared on behalf of the WWF Caucasus Programme Office. http://www.teebweb.org/wp-content/uploads/2017/03/TEEB-Adjara-Final-Report.pdf.
Caravanos, J., K. Chatham-Stephens, B. Ericson, P. J. Landrigan, R. Fuller. 2013. “The burden of disease from pediatric lead exposure at hazardous waste sites in 7 Asian countries.” Environmental Research, 120:119-125. http://dx.doi.org/10.1016/j.envres.2012.06.006.
Cusano G., M. Gonzalo, F. Farrell, R. Remus, S. Roudier, L. Sancho. 2017. Best Available Techniques (BAT) Reference Document for the Non-Ferrous Metals Industries. Industrial Emissions Directive 2010/75/EU Integrated Pollution Prevention and Control. Publications Office of the European Union. https://op.europa.eu/en/publication-detail/-/publication/c0bc6046-651c-11e7-b2f2-01aa75ed71a1.
EEA. 2019. “Air quality in Europe – 2019 report.” Luxemburg: Publications Office of the European Union. https://www.eea.europa.eu/publications/air-quality-in-europe-2019
Elizbarashvili M., E. Elizbarashvili, M. Tatishvili, S. Elizbarashvili, R. Meskhia, N. Kutaladze, L. King, I. Keggenhoff, and T. Khardziani. 2017. “Georgian climate change under global warming conditions.” Annals of Agrarian Science, 15(1): 17-25. https://doi.org/10.1016/j.aasci.2017.02.001.
ENPI-FLEG. 2016. “Economic Effects of households’ firewood consumption and cost-benefit analyses of use of alternative heating resources (English).” Study prepared by CENN/Davit Darsavelidze.
Environmental Protection and Natural Resource Committee. 2019. “Thematic Inquiry Report of the Environment Protection and Natural Resources Committee of the Parliament of Georgia on Air Quality in Tbilisi.” Prepared and published under the initiative of the Parliament of Georgia. http://www.parliament.ge/ge/ajax/downloadFile/122661/green-report2019eng.
ENVSEC. 2016. “Climate Change and Security in the South Caucasus. Republic of Armenia, Azerbaijan and Georgia- Regional Assessment.” https://www.osce.org/files/f/documents/3/1/355546.pdf.
Ericson, B., L. Gabelaia, J. Keith, T. Kashibadze, N. Beraia, L. Sturua, and Z. Kazzi. 2020. “Elevated Levels of Lead (Pb) Identified in Georgian Spices.” Annals of Global Health, 86(1).
European Union. 2014. Association Agreement between the European Union and the European Atomic Energy Community and their Member States, of the one part, and Georgia, of the other part. Official Journal of the European Union 261, 30.8.2014, p. 4–743. https://eur-lex.europa.eu/legal-content/EN/TXT/?uri=CELEX%3A22014A0830%2802%29.
FAO. 2020. “Soil Degradation.” http://www.fao.org/soils-portal/soil-degradation-restoration/en/ (accessed on August 4, 2020).

Georgia: Towards Green and Resilient Growth 53
Fewtrell, L., R. Kaufmann, and A. Pruss-Ustun. 2003. “Lead: assessing the environmental burden of disease at national and local levels.” Environmental Burden of Disease Series No.2. Geneva: WHO. https://www.who.int/quantifying_ehimpacts/publications/9241546107/en/.
Guardian. 2020. “Air pollution likely to increase coronavirus death rate, warn experts.” https://www.theguardian.com/environment/2020/mar/17/air-pollution-likely-to-increase-coronavirus-death-rate-warn-experts (accessed on August 4, 2020).
Garforth, M., S. Nilsson, and P. Torchinava. 2016. “Wood Market Study: Integrated Biodiversity Management – South Caucasus.” Consultant report by GFA Consulting Group. https://biodivers-southcaucasus.org/uploads/files/5b45b2b4d8951.pdf.
GBD. 2017a. “GBD Results Tool”. http://ghdx.healthdata.org/gbd-results-tool (accessed on June 19, 2020).
GBD. 2017b. “Supplementary appendix 1: GBD 2017 Risk Factor Collaborators.” The Lancet 2018, 392: 1923–45.
Geostat. 2019. “Agriculture of Georgia, 2018 (English)”. Statistical publication. Tbilisi: Geostat. https://www.geostat.ge/media/24488/soflis-meurneoba_2018.pdf.
Geostat. 2020a. “Gross Domestic Product (GDP).” https://www.geostat.ge/en/modules/categories/23/gross-domestic-product-gdp (accessed on August 3, 2020).
Geostat. 2020b. “Population and Demographics.” https://www.geostat.ge/ka/modules/categories/316/mosakhleoba-da-demografia (accessed on August 4, 2020).
Geostat. 2020c. “Employment and Unemployment.” https://www.geostat.ge/en/modules/categories /38/ employment-and-unemployment (accessed on August 19, 2020).
Geostat. 2020d. “Living conditions.” https://www.geostat.ge/en/modules/categories/192/living-conditions (accessed on August 19, 2020).
Gilauri, N. 2016. Practical economics: Economic transformation and government reform in Georgia 2004-2012. Chapter 6. Privatizing State-Owned Enterprises. (pp.113-124)
GLOWS-FIU. 2011. “Rapid Assessment of the Rioni and Alazani-lori River Basins - Republic of Georgia. Technical Summary Report.” Global Water for Sustainability Program, Florida International University. http://dpanther.fiu.edu/sobek/FI14090893/00001.
Grandjean, P., M. Bellanger. 2017. “Calculation of the disease burden associated with environmental chemical exposures: application of toxicological information in health economic estimation.” Environmental Health 16:123. https://doi.org/10.1186/s12940-017-0340-3.
Green Climate Fund. 2018. “Georgia needs assessment.” Consultation Draft.https://www.greenclimate.fund/countries/georgia?f%5b%5d=field_date_content:2018#overview (accessed February 15, 2020).
GT. 2019. “Alarming Lead Levels Measured in Georgian Children.” http://georgiatoday.ge/news/15393/Alarming-Lead-Levels-Measured-in-Georgian-Children (accessed on August 4, 2020).
Hallegatte, S., A. Vogt-Schilb, M. Bangalore, and J. Rozenberg. 2017. Unbreakable: Building the Resilience of the Poor in the Face of Natural Disasters. Climate Change and Development Series. Washington DC: The World Bank. http://documents.worldbank.org/curated/en/512241480487839624/Unbreakable-building-the-resilience-of-the-poor-in-the-face-of-natural-disasters.

Georgia: Towards Green and Resilient Growth54
Health Effects Institute. 2019. “State of Global Air 2019.” Data source: Global Burden of Disease Study 2017. IHME, 2018. https://www.stateofglobalair.org/data/#/air/plot (accessed on August 4, 2020).
Hore, P., K. Alex-Oni, S. Sedlar, and D. Nagin, D. 2019. “A Spoonful of Lead: A 10-Year Look at Spices as a Potential Source of Lead Exposure.” Journal of Public Health Management and Practice, 25:63-70.
IMF. 2020. “Georgia.” https://www.imf.org/en/Countries/GEO (accessed on August 28, 2020).
IUCN. 2012. “Georgia – a haven for biodiversity.” https://www.iucn.org/content/georgia-a-haven-biodiversity (accessed August 4, 2020).
JHU. 2020. “Coronavirus Resource Center.” https://coronavirus.jhu.edu/map.html (accessed on June 24, 2020).
Lange, G., Q. Wodon, and K. Carey. 2018. The Changing Wealth of Nations 2018: Building a Sustainable Future. Washington, DC.: The World Bank. https://openknowledge.worldbank.org/handle/10986/29001.
Lanphear, B. P., R. Hornung, J. Khoury, K. Yolton, P. Baghurst, D. C. Bellinger, R. L. Canfield, K. N. Dietrich, R. Bornschein, T. Greene, and S. J. Rothenberg. 2005. “Low-level environmental lead exposure and children’s intellectual function: an international pooled analysis.” Environmental Health Perspectives, 113:894–899. https://www.ncbi.nlm.nih.gov/pmc/articles/PMC1257652/.
Ministry of Agriculture of Georgia. 2017. “Irrigation Strategy for Georgia 2017-2025.” http://extwprlegs1.fao.org/docs/pdf/geo171443.pdf
Ministry of Environment and Natural Resources Protection and National Forestry Agency of Georgia. 2014. “National Forest Concept for Georgia.” http://environment.cenn.org/app/uploads/2016/09/CENN-BROCHURE-reduced-ENG.pdf.
Ministry of Environment and Natural Resources Protection of Georgia. 2015. “Georgia’s Third National Communication to the UNFCCC.” https://unfccc.int/sites/default/files/resource/Geonc3.pdf.
Ministry of Environment and Natural Resources Protection of Georgia. 2017. Climate Change National Adaptation Plan for Georgia’s Agriculture Sector (English).”
Ministry of Environmental Protection and Agriculture of Georgia. 2017. “The National Report on the State of the Environment of Georgia, 2014-2017.” https://mepa.gov.ge/En/Reports (accessed on August 4, 2020).
Ministry of Environmental Protection and Agriculture of Georgia. 2020a. “Interactive Map (English).” https://atlas.mepa.gov.ge/maps/map?l=en (accessed on August 19, 2020).
Ministry of Environmental Protection and Agriculture of Georgia. 2020b. “The Quality of Air Pollution (English).” https://mepa.gov.ge/En/TheQualityofAirPollution?page=14&pageSize=1/ (accessed on August 4, 2020).
Ministry of Finance of Georgia. 2020. https://mof.ge/4536 (accessed on August 5, 2020).
Narain, U., and C. Sall. 2016. “Methodology for Valuing the Health Impacts of Air Pollution: Discussion of Challenges and Proposed Solutions.” Washington, DC.: The World Bank.
Natela Turnava. Minister of Economy and Sustainable Development of Georgia. 2020. “Role of State-Owned Enterprises in the COVID-19 Pandemic.” Presentation at the Governance GP learns on June 2, 2020. The World Bank
National Environmental Agency of Georgia. 2020. “Public Information”. http://nea.gov.ge/ge/publicinfo/finansebi-da-xarjtagricxva/21/ (accessed on August 5, 2020).

Georgia: Towards Green and Resilient Growth 55
National Forest Agency of Georgia. 2020. “Georgian Forest (English).” http://forestry.gov.ge/Ge/Page/GeorgianForests/).
NYC. 2020. “Hazardous Products: Foods and Spices.” https://www1.nyc.gov/site/doh/health/health-topics/hazardous-foods-spices.page (accessed on October 15, 2020).
Parliament of Georgia. “Explanatory Report on the draft law of Georgia Forest Code of Georgia (English).” https://info.parliament.ge/file/1/BillReviewContent/214676 (accessed on August 5, 2020).
Ruadze, E., I. Khonelidze, L. Sturua, P. Lauriola, H. Crabbe, T. Marczylo, G.S. Leonardi, and A. Gamkrelidze. 2020. “Addressing lead exposure in children in Georgia: challenges and successes of a multi-agency response.” European Journal of Public Health, 30(Supplement_5):166-145. https://doi.org/10.1093/eurpub/ckaa166.145.
Salkever, D. S. 1995. “Updated estimates of earnings benefits from reduced exposure of children to environmental lead.” Environmental Research, 70:1-6.
Sartori, M., G. Philippidis, E. Ferrari, P. Borrelli, E. Lugato, L. Montanarella, and P. Panagos. 2019. “A linkage between the biophysical and the economic: Assessing the global market impacts of soil erosion.” Land Use Policy, 86:299-312. https://doi.org/10.1016/j.landusepol.2019.05.014.
Schwartz, J. 1994. “Societal benefits of reducing lead exposure.” Environmental Research, 66:105-12.
State Audit Office of Georgia. 2016a. “Performance Audit of Forest Commercial Resource Management.” https://sao.ge/en/performance-audit-of-forest-commercial-resource-ma201911290332454en.html.
State Audit Office of Georgia. 2016b. “Social Use of Timber Resources.” https://sao.ge/en/social-use-of-timber-resources201911290332500en.html
Transparency International Georgia. 2018. “2019 Draft State Budget of Georgia: Analysis and Recommendations.” https://www.transparency.ge/en/blog/2019-draft-state-budget-georgia-analysis-and-recommendations (accessed on October 15, 2020).
Transparency International. 2020. “CPI 2019: Eastern Europe & Central Asia.” https://www.transparency.org/en/news/cpi-2019-eastern-europe-central-asia# (accessed on August 3, 2020).
UNICEF. 2019. “2018 Georgia MICS (Multiple Indicator Cluster Survey).” Survey Findings Support. https://www.unicef.org/georgia/reports/2018-georgia-mics-multiple-indicator-cluster-survey.
USAID. 2016. “The Georgian Road Map on Climate Change Adaption.” http://nala.ge/climatechange/uploads/RoadMap/TheRoadMapEngPre-design_reference191_Final.pdf (accessed on August 4, 2020).
USDA. 2019. “International Agricultural productivity.” https://www.ers.usda.gov/data-products/international-agricultural-productivity/ (accessed on August 3, 2020).
WHO. 2013. ‘‘Review of evidence on health aspects of air pollution—REVIHAAP.” Copenhagen: WHO Regional Office for Europe. https://www.euro.who.int/__data/assets/pdf_file/0020/182432/e96762-final.pdf?rel=mas.
WHO. 2016. “Global Health Observatory data repository.“ https://apps.who.int/gho/data/view.main.AMBIENTCITY2016?lang=en (accessed on June 19, 2020).
WHO. 2018. “Household air pollution and health.” https://www.who.int/news-room/fact-sheets/detail/household-air-pollution-and-health (accessed on August 4, 2020).
Wikipedia. 2020. “List of power stations in Georgia.” https://en.wikipedia.org/wiki/List_of_power_stations_in_Georgia (accessed on August 5, 2020).
Georgia: Towards Green and Resilient Growth56
World Bank. 2012. “Georgia: Climate Change and Agricultural Country Report. Washington DC: The World Bank. https://openknowledge.worldbank.org/handle/10986/21837.
World Bank. 2015. “Georgia – Country environmental analysis: institutional, economic, and poverty aspects of Georgia’s road to environmental sustainability.” Washington DC: The World Bank. http://documents1.worldbank.org/curated/en/293731468001755898/pdf/ACS13945-WP-P147475-Box391501B-PUBLIC-6-26-15.pdf.
World Bank. 2018a. “Georgia – Systematic Country Diagnostic: from reformer to performer.” Washington DC: The World Bank. https://openknowledge.worldbank.org/handle/10986/29790.
World Bank. 2018b. “Georgia – Country partnership framework for the period FY19-FY22 (English).” Washington DC: The World Bank. https://documents.worldbank.org/en/publication/documents-reports/documentdetail/588751525364587100/undefined.
World Bank. 2018c. “Georgia: Household Surveys on Forest Use, Poverty and Vulnerability to Natural Hazards.” Washington DC: The World Bank.
World Bank. 2019a. Doing Business 2019: Training for Reform. Washington DC: The World Bank. https://openknowledge.worldbank.org/handle/10986/30438.
World Bank. 2019b. “South Caucasus in Motion.” Washington DC: The World Bank. https://openknowledge.worldbank.org/handle/10986/31620.
World Bank. 2019c. “2019 Water Week.” April 2-4, 2019. Washington DC: The World Bank. https://www.worldbank.org/en/events/2019/04/02/2019-water-week (accessed on August 4, 2020).
World Bank. 2020a. “Analysis of Gaps between National Legislation of Georgia and World Bank Environmental and Social Framework.” Washington DC: The World Bank. http://documents1.worldbank.org/curated/pt/105031592550795667/pdf/Analysis-of-Gaps-between-National-Legislation-of-Georgia-and-World-Bank-Environmental-and-Social-Framework.pdf.
World Bank. 2020b. ‘Wealth Accounting.” Washington DC: The World Bank. https://datacatalog.worldbank.org/dataset/wealth-accounting (accessed on August 3, 2020).
World Bank, 2020c. “Georgia Monthly Economic Update – August 2020.” Washington DC: The World Bank. http://pubdocs.worldbank.org/en/317821597419426483/GE-MEU-August-2020.pdf (accessed on August 25, 2020).
World Bank. 2020d. “The Cost of Coastal Zone Degradation in the Country of Georgia. A tool for the Coastal Zone Climate Adaptation Plan and the Nationally Determined Contributions.” Background technical paper. Forthcoming. Washington DC: The World Bank.
World Bank Group. 2020. “World Bank Group Geospatial Platform”. Washington DC: The World Bank. https://geo.worldbank.org/home (accessed on August 4, 2020).
Georgia: Towards Green and Resilient Growth 57
AnnexesMethodology of The CoED Estimation: General Approach
The CoED is estimated by measuring annual environmental and natural resources losses and valuing them in monetary terms. These losses include damages to health and wellbeing, using relationships between pollution and such health “end effects” as premature mortality, morbidity or intellectual quotient (IQ) reduction. For natural resource degradation, the services provided by the natural environment are reduced on account of damage or overuse. Physical effects are converted to monetary terms using valuation techniques that take account of individuals’ willingness to pay to avoid negative health effects or loss of life-time income. A different approach of valuing damages is applied in calculating the economic losses due to agricultural land degradation, disposal of solid waste, deforestation and natural disasters, where losses are valued taking direct account of productivity reduction or expected GDP loss.
The costs can be both direct costs and the costs of lost opportunities where production is below its potential. For example, the annual cost of land degradation reduces agricultural GDP by 8 percent (Chapter 3). Lower agricultural productivity affects the most vulnerable population, whose livelihoods are dependent on the ecosystem services provided to agriculture. Another example are the welfare losses associated with air pollution and lead exposure that reduce human capital and, correspondingly, negatively affect economic growth. These are only a few examples of impacts attributed to environmental degradation. Due to the significant uncertainty related to these estimations, the costs in this report should be considered conservative, lower-bound estimates, which only capture a part of the full cost.

Georgia: Towards Green and Resilient Growth58
Annex A Methodology to Estimate Cost of Natural Resource Degradation
Losses from Pasture DegradationEstimation of losses from pasture degradation was based on Georgia’s total area of natural hay meadows and pastures of 1,911 thousand hectares (Agriculture of Georgia 2018). According to Climate Change National Adaptation Plan for Georgia’s Agriculture Sector (2017), 23 percent of total pastures were degraded, indicating a total of 439.6 thousand hectares of degraded pastureland. Applying the average reduced productivity of 0.7 tons per hectare to the degraded pastureland area97 and the average price of barley (a priced substitute product of pasture) of US$192 per ton, generates a total annual loss of US$59 million from pasture degradation.
ANNEX Table A.1 Losses from Pastures DegradationTotal pastures land in Georgia (in thousand ha) 1,911Degraded pastures land (as % of total pastures land) 23.0Degraded pastures land (in thousand hectares) 439.6Average reduced productivity per 1 ha (in tons/ha) 0.7Average price of barley (US$/t) 192Annual cost of pastures productivity reduction (million US$) 59.1
Losses from Production Reduction in Agriculture The value of cultivated products in agriculture in 2018, in farm gate prices, was US$681 million (GEL 1,923 million) in 2018, as per National Statistic Office of Georgia, based on the exchange rate in 2018 (Central Bank of Georgia). The annual cost of agricultural productivity reduction is estimated from the application of the 1.8 percent reduction in agricultural production from land degradation to the value of a cultivated products in agriculture.
ANNEX Table A.2 Losses from Production Reduction in AgriculturesValue of a cultivated products in agriculture in GEL million in 2018 (in farm gate prices) 1,923 Average GEL/US$ exchange rate in 2018 as per Central Bank of Georgia 0.35 Value of a cultivated products in agriculture in US$ million in 2018 (in farm gate prices) 681 Reduction of agricultural production from land degradation 1.8% Total value of losses in cultivated products in agriculture in US$ million (in farm gate prices) 11.9
Losses from Dried Land and Lack of Irrigation An estimation of losses from irrigation takes into account the total reduction of irrigation capacity due to damaged water reservoirs, multiplied by the profit margin differential on irrigated and non-irrigated land and the composition of farms by size, respectively for both marginal/small and medium/large farms.98
97 Ministry of Environment and Natural Resources Protection of Georgia. 2017. “Climate Change National Adaptation Plan for Georgia’s Agriculture Sector (English).”
98 Ministry of Agriculture of Georgia. 2017. “Irrigation Strategy for Georgia 2017-2025.” http://extwprlegs1.fao.org/docs/pdf/geo171443.pdf (accessed on August 5, 2020).

Georgia: Towards Green and Resilient Growth 59
The impact of irrigation in agricultural production (Ministry of Agriculture, 2017) indicate that the annual income per hectare of each agricultural production farm in Georgia will increase by 59 percent, or $250 (GEL 700) for small and marginal farms, and by 85%, or US$2,380 (GEL 6,720 ) for medium and large farms, if the land was irrigated and drained.
ANNEX Table A.3 Annual Income of Rainfed and Irrigation Land/ha Rainfed Irrigated Differential Differential in %Marginal/Small Farm (0.8 ha) 1,190 1,890 700 59%Medium/Large Farm (6 ha) 7,923 14,643 6,720 85%
Losses from reduced irrigation services delivery during the period of greatest reduction in irrigation infrastructure capacity experienced in Georgia are estimated based on the data from the Irrigation Strategy for Georgia 2017-2025, which reports maximal reduction of irrigated land by 56,600 hectares, and provides information on the composition of farms in Georgia (small and marginal farms 94.5 percent and medium and large farms 5.5 percent).
ANNEX Table A.4 Irrigation LossReduction of irrigated lands (in ha) 56,600 Marginal/Small Farm (0.8 ha) profit growth if land is irrigated (in US$) 248 Medium/Large Farm (6 ha) profit growth profit growth if land is irrigated (in US$) 2,381
Composition of farms by size (as % of total):Marginal/Small Farm (0.8 ha) 94.5% Medium/Large Farm (6 ha) 5.5% Losses from irrigated land reduction (in US$ million) 21.0
Losses from HPP Reservoirs Sedimentation The total projected multiannual electric energy generation of HPP calculated during a feasibility study for the 7 largest HPPs is 6,119 million kWh.99 The actual annual average generation by HPPs with dams is 5,801 million kWh - a difference of 317.7 million kWh. The tariff of electric energy for over 301kWh level is 23 tetri/kWh, which multiplied by the difference between projected and actual energy generation of 317.7 million kWh, gives an estimated total value of missing energy generation of (US$5.9 million (GEL 73.2 million). This means that around 80 percent of the total missing energy generation is attributable to sedimentation.100
ANNEX Table A.5 Losses from SedimentationProjected multi annual generation of HPP calculated during feasibility study (Million kWh)
6,119
Actual annual generation of HPP (Million kWh) 5,801Difference of projected production and actual production (Million kWh) 317.7Tariff of electric energy for over 301kWh level (tetri/kWh) 23.0Value of missing production (Capacity - Production) in GEL million 73.2Value of missing production (Capacity - Production) in US$ million 25.9Share of missing production attributable to sedimentation (as % of total) 80.0%Losses from sedimentation 20.7
99 Wikipedia. 2020. “List of power stations in Georgia.” https://en.wikipedia.org/wiki/List_of_power_stations_in_Georgia (accessed on August 5, 2020).
100 GLOWS-FIU. 2011.

Georgia: Towards Green and Resilient Growth60
Deforestation and Ecosystem Services Reduction Total annual loss in forest area in Georgia is around 508 hectares/year starting from 2001 (GIS Atlas, 2020). The annual value of ecosystem services per 1 hectare of forest land is US$882, based on a TEEB case study of the Adjara region.101 A calculation of the respective present value of annual cost of 1 ha of mid-cycle forest land loss for 13 years, discounted by 6 percent in real terms, revealed a loss of US$7,800, which multiplied by 508 hectares, totals US$4 million.
ANNEX Table A.6 Losses from DeforestationAnnual loss of forested land cover (in ha) 508Annual value of 1 ha forest land loss (US$/ha) 882Present value of annual cost of 1 ha forest land loss (US$/ha) 7,800Total cost from forest land cover losses (in US$ million) 4.0
The aggregate costs of ecosystem services per hectare in Adjara are estimated in US$882 / ha, for fuel wood, NTFPs, and landslide regulation. The values of ecosystem services in Adjara per ha, are used as a basis for the country level estimations. If 0.5 percent of land is degraded in Georgia nationwide, then 0.5 percent multiplied by the total forest area in Georgia reveals annual costs of ecosystem services reduction due to forest degradation of US$11.9 million.
ANNEX Table A.7 Costs of Ecosystem Services in Adjara per haFuel wood (in US$ / ha) 286NTFPs (in US$ / ha) 141Landslide regulation (in US$ / ha) 455Total cost of ecosystem services (in US$ / ha) 882
ANNEX Table A.8 Costs of Forest Degradation in GeorgiaTotal forest area in Georgia (in million ha) 2.69Share of forest area degraded each year 0.5%Annual value of ecosystem services (in US$ /hectare) 882Total cost of ecosystem services (in US$ million) 11.9
101 Brander L., C. Sovann, D. Kharazishvili, and N. Memiadze. 2016. “The Economics of Ecosystems and Biodiversity for the Forestry Sector of Adjara Autonomous Republic, Georgia.” Final Report prepared on behalf of the WWF Caucasus Programme Office. http://www.teebweb.org/wp-content/uploads/2017/03/TEEB-Adjara-Final-Report.pdf.

Georgia: Towards Green and Resilient Growth 61
Annex BMethodology to Estimate the Social Impact of Land Degradation
In 2016, as part of Forests, Livelihoods, and Poverty Linkages in the Forest Communities of Georgia report, the World Bank facilitated the a forest user survey, the first large scale-collection of household level data (across 950 households in total) compiled across regions with different forest cover and different exposures to natural hazards. The survey generated important information on socio-economic conditions, forest dependency, and the extent of poverty of households living in and near forest areas.
The selection of villages in the sample was based on two indicators: i) forest cover and ii) frequency of natural hazards, to capture both the large spatial variation in forest concentration and frequency of natural disasters. The households in the survey were chosen using a two-stage stratification method leading to a framework of four strata:
• Stratum 1: High Forest cover and High natural Hazard frequency (HF-HH)
• Stratum 2: High Forest cover and Low natural Hazard frequency (HF-LH)
• Stratum 3: Low Forest cover and High natural Hazard frequency (LF-HH)
• Stratum 4: Low Forest cover and Low natural Hazard frequency (LF-LH)
Analysis of income from forest by strata show average forest income as similar across all strata, regardless of forest coverage. The participation rate of forest-related income activities is lower in high forest coverage villages (around 20 percent), than in villages with low coverage areas (30 percent and 41 percent). The income generated in forestry, agriculture and livestock, contribute 47-61 percent of the total for households in different strata.102 This income is reduced by 8 percent as a result of the estimated impact of landscape degradation in Georgia.
ANNEX Table B.1 Income Distribution by Stratum and Source
Stratum LF-HH LF-LH HF-HH HF-LFIncome source Mediam Rate Mediam Rate Mediam Rate Mediam Rate
– GEL – – % – – GEL – – % – – GEL – – % – – GEL – – % –
Forest income 750 30 750 41 750 19 750 20Agriculture 450 10 1000 11 500 11 1150 13Livestock 700 7 1500 9 600 20 1200 14Wage employment 5300 20 6000 27 4800 27 6000 29Pension 2020 41 1160 32 2115 48 2592 53Social programs 140 20 205 12 120 21 114 24Self-employment 1500 13 1500 14 1500 12 1500 10Total household income 2035 100 1300 100 2240 100 3000 100Per capita 740 - 750 - 1137 - 1747 -
The data from the World Bank database on Poverty and Equity (2020) is applied to estimated income distribution by quintiles in Georgia. Average rural income is reported in the Georgia Statistical Yearbook (2019). Average per capita income in each quintile is adjusted for land degradation cost. The corresponding poverty gap compare to the rural poverty line estimated at 60 percent of the median rural income for the lowest income quintile in the rural area.
102 World Bank. 2018c.

Georgia: Towards Green and Resilient Growth62
ANNEX Table B.2 Estimation of Poverty Gap for the Lowest Income Quintile in Rural Areas
% of the total income
Total Income,
US$ million
Per capita rural
income, US$/person
Land degradation impact, US$
Potential income,
US$
Income share held by lowest 20% 6.5 117 379 16 395
Income share held by second 20% 11.5 206 671 29 700
Income share held by third 20% 16.2 291 945 41 986
Income share held by fourth 20% 22.6 406 1,318 57 1,375
Income share held by highest 20% 43.2 775 2,519 109 2,628

Georgia: Towards Green and Resilient Growth 63
Annex CPM2.5 Concentrations at Monitoring Stations (monthly average 01/2019 – 03/2020)
Georgia Limit Value
WHO Guaidline
Jan-19
Feb-19
Mar-1
9
Apr-19
May-19
Jun-19
Jul-1
9
Aug-19
Sep-19
Oct-19
Nov-19
Dec-19
Jan-20
Feb-20
Mar-2
0
Tbilisi Rustavi Kutaisi Batumi
70
Mon
th a
mbi
ent
PM2.
5 (μg/
m3 ) 60
50
40
30
20
10
0
Source: Ministry of Environmental Protection and Agriculture of Georgia. 2017.
Report: Georgia has adopted the EU annual PM2.5 limit value of 25 μg/m3 that presents the level where member states face
enforcement action by the European Commission. The WHO aspirational guidelines are more stringent, recommending
annual PM2.5 concentration of 10 μg/m3. The EU has a long-term ambition of lowering the enforcement threshold to the level
recommended by the WHO.
Georgia: Towards Green and Resilient Growth64
Annex DMethodology for Estimating the Health Burden Attributed to Air Pollution
The following health outcomes that can be attributed to ambient PM2.5 concentration are considered: Ischemic heart disease (IHD); cerebrovascular disease (stroke); malignant neoplasm of trachea; bronchus and lung cancer; chronic obstructive pulmonary disease (COPD); diabetes mellitus 2; and lower respiratory infections (LRI). The health burden for each disease is expressed in terms of annual number of premature deaths.
To estimate the population attributable fraction (PAF) for the population exposed to PM2.5 by listed disease, the analysis uses relative risk (RR) factors published by GBD 2017.103 The risk functions for IHD and stroke are age-specific with five-year age intervals, while singular age-group risk functions are applied for lung cancer (≥ 25 years), COPD (≥ 25 years), diabetes mellitus 2 and LRI. Disease burdens for all listed diseases are estimated for five age groups: 0 to 4, 5 to 14, 15 to 49, 50 to 69, and 70 plus years. The PAF of diseases from PM2.5 exposure is calculated using the following function:
(D1)
where Pi is the share of the population exposed to PM2.5 concentration.
The PAF is calculated for each disease outcome (k) and age group (l). The disease burden (B) in terms of annual cases of disease outcomes due to PM2.5 exposure is then estimated by:
(D2)
where Dkl is the total annual number of diseases (k) in age group (l) and PAFkl is the attributable fraction of these cases of disease (k) in age group (l), due to PM2.5 exposure.
Steps to value AAP and HAP:
1. Estimate population weighted average annual concentrations of PM2.5 in urban and rural areas for population that uses clean fuel / solid fuel for cooking and/or heating based on proportionate approach from GBD 2017;
2. Estimate PAFs for 6 diseases associated with PM2.5 air pollution, using ambient average monitoring data, relative risk from GBD 2017, and mortality rates from GBD 2017 at the national level.
3. Estimate attributed mortality by five age groups with the corresponding RR from GBD 2017.
4. Monetary valuation of physical impacts: for mortality end-points valuation, applied GDP-adjusted VSL estimates from OECD countries as per Narain and Sall (2016). See ANNEX A.
5. Morbidity cost estimated as 10 percent of mortality cost.
103 GBD. 2017b. “Supplementary appendix 1: GBD 2017 Risk Factor Collaborators.” The Lancet 2018, 392: 1923–45.
Annex page 8
Official Use
ANNEX D. METHODOLOGY FOR ESTIMATING THE HEALTH BURDEN ATTRIBUTED TO AIR POLLUTION
The following health outcomes that can be attributed to ambient PM2.5 concentration are considered: Ischemic heart disease (IHD); cerebrovascular disease (stroke); malignant neoplasm of trachea; bronchus and lung cancer; chronic obstructive pulmonary disease (COPD); diabetes mellitus 2; and lower respiratory infections (LRI). The health burden for each disease is expressed in terms of annual number of premature deaths.
To estimate the population attributable fraction (PAF) for the population exposed to PM2.5 by listed disease, the analysis uses relative risk (RR) factors published by GBD 2017.103 The risk functions for IHD and stroke are age-specific with five-year age intervals, while singular age-group risk functions are applied for lung cancer (≥ 25 years), COPD (≥ 25 years), diabetes mellitus 2 and LRI. Disease burdens for all listed diseases are estimated for five age groups: 0 to 4, 5 to 14, 15 to 49, 50 to 69, and 70 plus years. The PAF of diseases from PM2.5 exposure is calculated using the following function:
PAF= ∑ Pi[RR �xi+xi-1
2� -1] / (∑ Pi[RR( xi+xi-1
2)n
i=1ni=1 -1]+1) (D1)
where Pi is the share of the population exposed to PM2.5 concentration.
The PAF is calculated for each disease outcome (k) and age group (l). The disease burden (B) in terms of annual cases of disease outcomes due to PM2.5 exposure is then estimated by:
B= ∑ ∑ DklPAFklsl=1
tk=1 (D2)
where Dkl is the total annual number of diseases (k) in age group (l) and PAFkl is the attributable fraction of these cases of disease (k) in age group (l), due to PM2.5 exposure.
Steps to value AAP and HAP:
1. Estimate population weighted average annual concentrations of PM2.5 in urban and rural areas for population that uses clean fuel / solid fuel for cooking and/or heating based on proportionate approach from GBD 2017;
2. Estimate PAFs for 6 diseases associated with PM2.5 air pollution, using ambient average monitoring data, relative risk from GBD 2017, and mortality rates from GBD 2017 at the national level.
3. Estimate attributed mortality by five age groups with the corresponding RR from GBD 2017. 4. Monetary valuation of physical impacts: for mortality end-points valuation, applied GDP-adjusted
VSL estimates from OECD countries as per Narain and Sall (2016). See ANNEX A. 5. Morbidity cost estimated as 10 percent of mortality cost.
103 GBD. 2017b. “Supplementary appendix 1: GBD 2017 Risk Factor Collaborators.” The Lancet 2018, 392: 1923–45.

Georgia: Towards Green and Resilient Growth 65
Annex EMethodology to Estimate the Economic Value of Health Burden Attributed to Air Pollution
Welfare loss is calculated by multiplying the estimated number of premature deaths with the value of statistical life (VSL). VSL measures represent an aggregate of individuals’ willingness to pay (WTP) for marginal reductions in their mortality risks. It is not the value of any single person’s life or death, nor does it represent a society’s judgment as to what that value should be. VSL is estimated using the stated preference approach, whereby surveyed individuals are asked how much they would hypothetically be willing to pay to reduce their mortality risk. As such, VSL is not limited to the value of output that would be lost in case of premature death but covers an array of other values that contribute to an individual’s and the society’s welfare. Therefore, this measure is not directly comparable with GDP.
For World Bank reports, the mean VSL estimate from quality-screened sample of studies in OECD countries that pass some form of a scope test for internal or external consistency is used as a base value.104 Average VSL estimate from OECD countries is transferred to Georgia, using average GDP per capita differential and assumptions regarding the income elasticity of VSL, following the guidance in Narain and Sall (2016). The average of resulting low and high-end values are used in this analysis.
The following formula is used for benefit transfer:
where:VSLG in PPP = VSL in Georgia in PPP termsVSLOECD in PPP = VSL in OECD countries in PPP termsYG in PPP = GDP per capita in Goergia in PPP termsYOECD in PPP = GDP per capita in OECD in PPP termsPPP = Purchasing power parity for Georgia = Income elasticity for high-income countriesANNEX Table E.1 presents the derivation of VSL for Georgia from low-end and high-end VSL estimates in OECD countries using the above formula.
ANNEX Table E.1 Low-to-high-end VSL Estimates for Georgia 2018Value estimates for Georgia Low HighAverage VSL estimates from OECD (million US$) 3.2 3.8Country's GDP (US$ billion) in 2018 17.6 17.6Country's GDP PPP (US$ billion) in 2018 44.8 44.8Population (million) in 2018 3.7 3.7GDP per capita (PPP US$) in 2018 12,017 12,017Average GDP/capita differential 0.3 0.3Income elasticity of VSL 1.4 1VSL for individuals exposed to AAP (US$ million) 0.26 0.48
Source: World Bank estimates.
104 Narain, U., and C. Sall. 2016. “Methodology for Valuing the Health Impacts of Air Pollution: Discussion of Challenges and Proposed Solutions.” Washington, DC.: The World Bank.
Annex page 9
Official Use
ANNEX E. METHODOLOGY TO ESTIMATE THE ECONOMIC VALUE OF HEALTH BURDEN ATTRIBUTED TO AIR POLLUTION
Welfare loss is calculated by multiplying the estimated number of premature deaths with the value of statistical life (VSL). VSL measures represent an aggregate of individuals’ willingness to pay (WTP) for marginal reductions in their mortality risks. It is not the value of any single person’s life or death, nor does it represent a society’s judgment as to what that value should be. VSL is estimated using the stated preference approach, whereby surveyed individuals are asked how much they would hypothetically be willing to pay to reduce their mortality risk. As such, VSL is not limited to the value of output that would be lost in case of premature death but covers an array of other values that contribute to an individual’s and the society’s welfare. Therefore, this measure is not directly comparable with GDP.
For World Bank reports, the mean VSL estimate from quality-screened sample of studies in OECD countries that pass some form of a scope test for internal or external consistency is used as a base value.104 Average VSL estimate from OECD countries is transferred to Georgia, using average GDP per capita differential and assumptions regarding the income elasticity of VSL, following the guidance in Narain and Sall (2016). The average of resulting low and high-end values are used in this analysis.
The following formula is used for benefit transfer:
VSLG in PPP=VSLOECD in PPP �YG in PPP
YOECD in PPP�ε (E1)
VSLG= VSLG in PPP
PPP (E2)
where: VSLG in PPP = VSL in Georgia in PPP terms VSLOECD in PPP = VSL in OECD countries in PPP terms YG in PPP = GDP per capita in Goergia in PPP terms YOECD in PPP = GDP per capita in OECD in PPP terms PPP = Purchasing power parity for Georgia ε = Income elasticity for high-income countries
ANNEX Table E.1 presents the derivation of VSL for Georgia from low-end and high-end VSL estimates in OECD countries using the above formula.
104Narain, U., and C. Sall. 2016. “Methodology for Valuing the Health Impacts of Air Pollution: Discussion of Challenges and Proposed Solutions.” Washington, DC.: The World Bank.

Georgia: Towards Green and Resilient Growth66
To calculate the welfare-based costs attributable to the exceedance of the WHO guideline, premature death related to total PM2.5 concentration (38 μg/m3 for rural population exposed to AAP and HAP due to solid fuel use for heating; 101 μg/m3 for rural population exposed to AAP and HAP due to solid fuel use for cooking and heating; 18 μg/m3 for rural population exposed to AAP but no HAP; 41 μg/m3 urban population exposed to AAP and HAP due to solid fuel use for heating; 21 μg/m3 for urban population exposed to AAP but not HAP) is estimated (see ANNEX A for methodology). Additionally, premature death related to the WHO guideline of 10 μg/m3 is calculated for each of the different exposures of rural and urban population in Georgia. The premature death estimate related to 10 μg/m3 is subtracted from the total premature death to reach to the mortality rate attributable to the exceedance of the WHO guideline.
The welfare-based cost of mortality is calculated by multiplying the estimated number of premature deaths caused by exceeding WHO guidelines for PM2.5 by the country specific VSL. This equates to the welfare loss associated with the exceedance of the WHO guideline that would have been avoided if the annual PM2.5 concentration of 10 μg/m3 would be reached by Georgia.
The comparison of the air pollution cost above the WHO guideline in selected EU member states, Western Balkan countries and Georgia (see Figure 5.4 above) is estimated using the simplified methodology that is applied in the 2019 EEA report. This methodology is endorsed by Pan-European study HRAPIE105 (2013) and is based on the estimation of non-accidental mortality attributable to AAP of people above the age of 30 years. This method then assumes a linear increased risk of non-accidental mortality per increase of PM2.5 concentration. The lower bound of the confidence interval (4 percent of non-accidental mortality per 10 μg/m3 increase of the annual average population weighted PM2.5 concentration) applied to arrive at the estimate in Georgia is higher than the estimate obtained using the more conservative GBD 2017 methodology in this report, because the risk of mortality of the urban population that uses solid fuel for cooking and heating and is exposed to HAP is not excluded from the total AAP risk of the urban population in Georgia. This approach allows the comparison of countries with different shares of population exposed to HAP. Premature death related to the WHO guideline value of 10 μg/m3 is calculated for each of the selected EU countries. The premature death estimate related to 10 μg/m3 is subtracted from total premature deaths attributed to the annual average population weighted PM2.5 concentration in each country to reach to the mortality rate attributable to the exceedance of the WHO guideline. Only the urban population in each country is assumed to be exposed to a PM2.5 pollution level that exceeds the WHO guideline. Finally, the welfare-based cost of mortality is estimated in each country, using VSL according to the World Bank guideline.106
105 WHO. 2013. ‘‘Review of evidence on health aspects of air pollution—REVIHAAP.” Copenhagen: WHO Regional Office for Europe. https://www.euro.who.int/__data/assets/pdf_file/0020/182432/e96762-final.pdf?rel=mas
106 Narain and Sall. 2016.
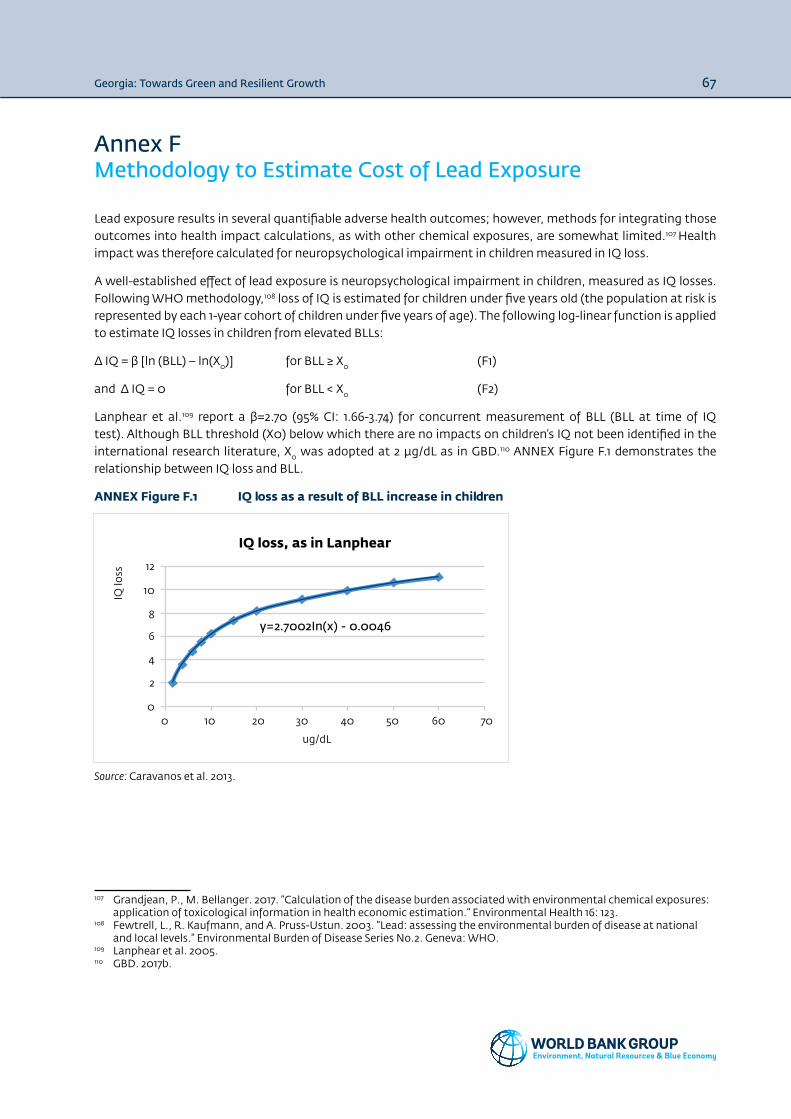
Georgia: Towards Green and Resilient Growth 67
Annex FMethodology to Estimate Cost of Lead Exposure
Lead exposure results in several quantifiable adverse health outcomes; however, methods for integrating those outcomes into health impact calculations, as with other chemical exposures, are somewhat limited.107 Health impact was therefore calculated for neuropsychological impairment in children measured in IQ loss.
A well-established effect of lead exposure is neuropsychological impairment in children, measured as IQ losses. Following WHO methodology,108 loss of IQ is estimated for children under five years old (the population at risk is represented by each 1-year cohort of children under five years of age). The following log-linear function is applied to estimate IQ losses in children from elevated BLLs:
Δ IQ = β [ln (BLL) – ln(X0)] for BLL ≥ X0 (F1)
and Δ IQ = 0 for BLL < X0 (F2)
Lanphear et al.109 report a β=2.70 (95% CI: 1.66-3.74) for concurrent measurement of BLL (BLL at time of IQ test). Although BLL threshold (X0) below which there are no impacts on children’s IQ not been identified in the international research literature, X0 was adopted at 2 µg/dL as in GBD.110 ANNEX Figure F.1 demonstrates the relationship between IQ loss and BLL.
ANNEX Figure F.1 IQ loss as a result of BLL increase in children
Source: Caravanos et al. 2013.
107 Grandjean, P., M. Bellanger. 2017. “Calculation of the disease burden associated with environmental chemical exposures: application of toxicological information in health economic estimation.” Environmental Health 16: 123.
108 Fewtrell, L., R. Kaufmann, and A. Pruss-Ustun. 2003. “Lead: assessing the environmental burden of disease at national and local levels.” Environmental Burden of Disease Series No.2. Geneva: WHO.
109 Lanphear et al. 2005.110 GBD. 2017b.
IQ loss, as in Lanphear
IQ lo
ss
ug/dL
y=2.7002In(x) - 0.0046
1000
2
4
6
8
10
12
20 30 40 50 60 70

Georgia: Towards Green and Resilient Growth68
The economic value of one IQ loss is calculated with the loss of the lifetime income of an individual. An individual’s lifetime income is associated with the individual’s IQ score and has been established by empirical studies.111 These studies found that a decline of one IQ point is associated with a 1.3-2 percent decline in lifetime income.
The present value of future lifetime income of a child at two years of age is estimated based on the average annual income (2018) provided by the World Development Indicator. A 4 percent annual growth rate of GDP per capita and 6 percent social discount rate is assumed, based on Narain and Sall.112 Average working age is assumed to be between 15 years and 65 years.113 The final lifetime income loss depends on the survival rate in Georgia, where life expectancy is about 78 years in 2018.
Steps to value cost of lead exposure in children are as follows:
1. Annual IQ loss attributable to lead exposure, based on MICS 2018.
2. The Lanphear model is applied to convert BLL level into IQ loss for 1-year cohort of exposed children in lead polluted hotspots.
3. Total IQ loss is valued as 1.3-2 percent of lifetime income, adjusted by the probability of survival in Georgia.
111 Salkever, D. S. 1995. “Updated estimates of earnings benefits from reduced exposure of children to environmental lead.” Environmental Research, 70:1-6; Schwartz, J. 1994. “Societal benefits of reducing lead exposure.” Environmental Research, 66:105-12.
112 Narain and Sall. 2016.113 Corrected for a lower life expectancy as estimated by WHO in 2018 (http://gamapserver.who.int/mapLibrary/Files/Maps/
Global_LifeExpectancy_bothsexes_2016.png)

Georgia: Towards Green and Resilient GrowthECA Sustainable DevelopmentEnvironment, Natural Resources & Blue Economy
November 2020