Embed Size (px)
Citation preview

Geospatial cognition and
understanding of
Global Energy Systems
Rajan Gupta
Theoretical Division
Los Alamos National Laboratory(LA-UR-09-01389)

UNM Students (ECE, CS)
Harihar Shankar
• Ratheesh Prabhu Rajendran
• Parthiban Jayabal
Aswin T. Y. Venkata
Saravanan Poosanthiram
Faculty at UNM
(ECE)
• Chaouki Abdallah
• Greg Heileman
LANL
• David Daniel (CCS)
• Fernando Gonzalez (STBRL)
Rajan Gupta
• V. Morris (UGS)
• LANL
• NM Consortium
Thanks to Collaborators and Sponsors

A macro view of global population
2 billion in 21st century
3 billion in 18th century
with less than $2 ppp/day(Additional 2.5B will start here)
1.5B
people
in
Transition
HealthEducation
EnergyWater
Job Skills

The energy-environment-
development-climate challenge
requires evolving to
• Cheap
• Copious
& Clean
Energy
Needs and impacts are global
6.6 ( 9) billion people want same opportunities

Electric Power System: Lifecycle cost comparison
Smart Transmission Grid
Coal Mine
Thermal PP
= Pipelines + liquefaction/regasification
Solar Farm
“PV”, CSPIndustry
Wind TurbineIndustry
Wind Farm
Hydropower
R RGHG
Transmission lines
Ecology
238U Mine
Nuclear PP
Waste
Fuel
Storage
Low density,Intermittent
N. Gas field
NG PP
GHG

Transportation fuels: Lifecycle cost comparison
Distribution Hub
Coal Mine
Coal 2 Liquid
Oil Shale
Refinery
Cook itto get oil
Oil field
= Pipelines + pumping stations
RefineryX RefineryY
Tar Sand Corn,.,Algae
Biofuel
Heat itto get oil
All of today’sfuels
produceGHG
Conversion

A global infrastructure (>$25 trillion) providesmodern energy/mobility to ~3.5 billion people
Oil and gas contracts, rigs,exploration, recovery
Tankers, ports, pipelines
Refineries, LNG facilities
Auto industry
600 (+ 220) million cars (+trucks) running on gasoline
Service, gasoline stations
Existing coal/gas electricitygeneration plants
Fossil Fuel Industry

All alternatives to fossil fuels have amarket niche. World Needs 10 TW
e
• Nuclear ~370 Gw ?
• Hydro ~400 Gw ~600 Gw
• Wind 90 Gwp /(3-5) +~20%/year
• Solar PV 5 Gwp /(3-5) +~30%/year
• Geothermal 25 GW (e+th)
• Biofuels 1.5 Mboe/day ?
But none is large enough today!
Need technological breakthroughs
Today Potential

7 Global Science Grand Challenges:Innovation is key
• Carbon neutral use of fossil fuel (especially coal)
• Economic Solar and Wind ($1/wattp)
• Storage and Transmission of electric power
• Closed nuclear fuel cycle to enable safe, secure,
sustainable nuclear energy
• H2 / fuel produced from non-fossil sources
– From Photochemical and/or thermal splitting of H2O
• Biofuels Pest-resistant, self-fertilizing, low water
using, easily degradable biomass
• Fusion – the ultimate “source”

9 faces of the challenge1) USA, Europe, Japan, China, India, …
lack energy security (conventional oil, gas)
2) Climate Change – an uncontrolled experiment
3) Middle East & Russia control oil and gas
4) Increasing competition (China, India, …)
5) Military solutions too costly ($ and lives)
6) The energy infrastructure is huge (>$25 trillion)
7) Unconventional fossil fuels: 2-3 pollution&CO2
8) Cheap clean energy – an economic opportunity
Alternatives have a market niche but are small today
9) Energy efficiency behavior change

What will drive change?(>$25 Trillion investment in fossil systems)
• Markets, resources, policy will need to
respond to demand and climate change
• They will not change overnight
• Yet they are in the middle of change!
Global Energy Consumption
1 exajoule (EJ) = 1018 J

In industrialized nations, energy systemsneed replacement over next 20-30 years
In developing countries Coal & Gas plantsare being installed for the first time
Business as usual Growth in coal and gas
fired plants and automobiles for next “20” yrs
Opportunity to move away from fossil fuels

No population growth & improved efficiency staged replacements in step with technology
Public transport systems are effective andused by a large fraction of the population
Nuclear Power is an issue!
Why EU, Japan, are well placed to go Green
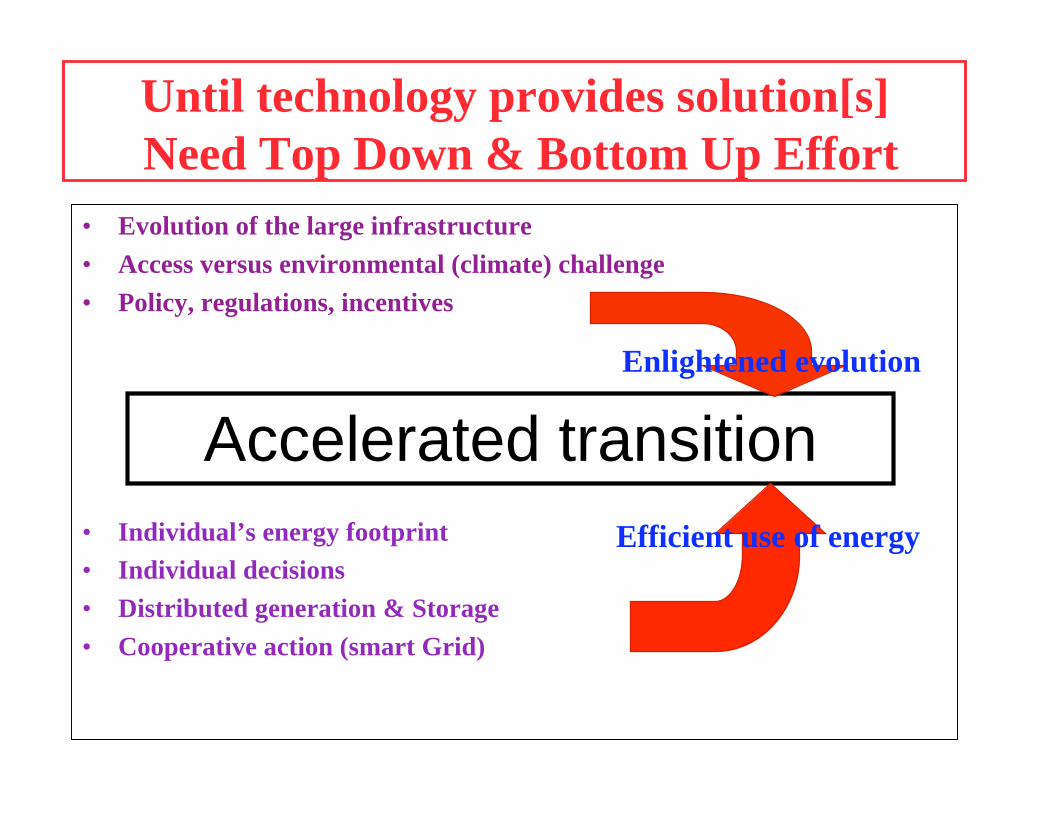
Until technology provides solution[s]
Need Top Down & Bottom Up Effort
• Evolution of the large infrastructure
• Access versus environmental (climate) challenge
• Policy, regulations, incentives
• Individual’s energy footprint
• Individual decisions
• Distributed generation & Storage
• Cooperative action (smart Grid)
Accelerated transition
Enlightened evolution
Efficient use of energy
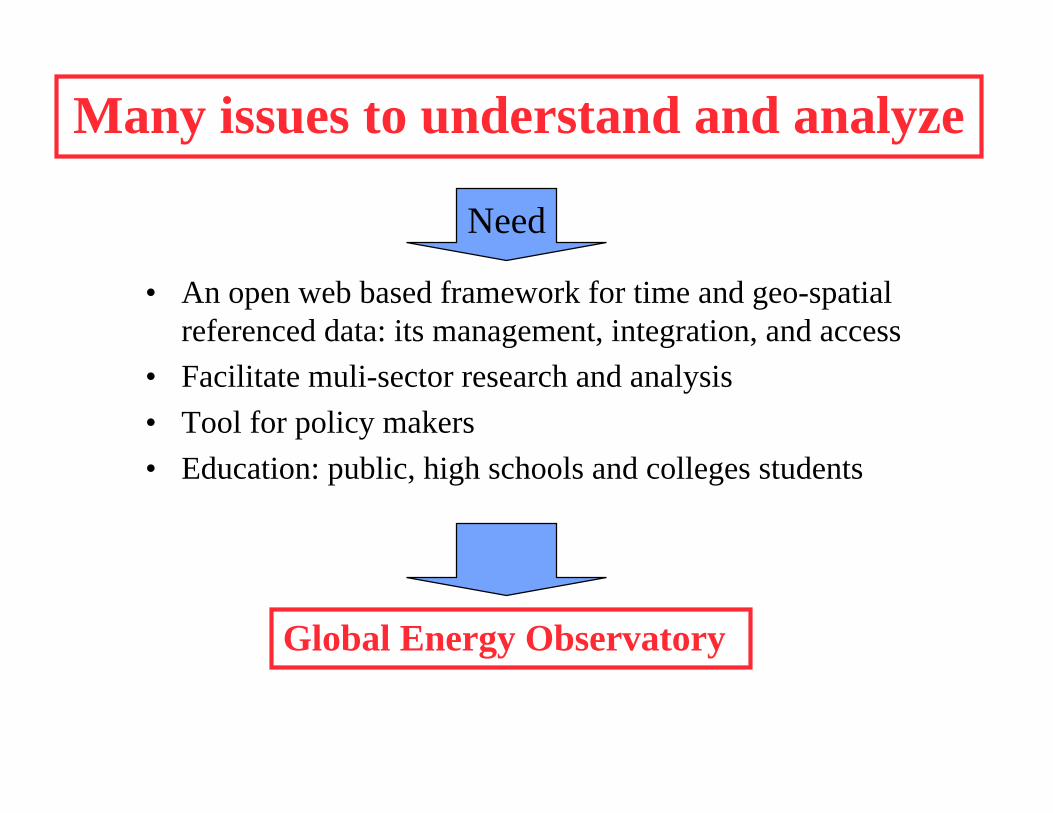
Many issues to understand and analyze
• An open web based framework for time and geo-spatial
referenced data: its management, integration, and access
• Facilitate muli-sector research and analysis
• Tool for policy makers
• Education: public, high schools and colleges students
Need
Global Energy Observatory

Understanding Dynamics of Change/Growth
• Growing to satisfy demand
• Linked Infrastructure & Resources
• Technology insertion and diffusion
• Performance and emissions control
Complex
Dynamical
System

Business World
• Policy and Public Opinion
• Regulations (environment, safety)
• Fuel supply (linkages, price)
• Competition
RISK
Example: Nuclear Power in the US

Impact of Policy and Markets
• Encourage Investment
• Decrease Risk
• Synergistic development ofinfrastructure
• Competition to improve efficiency
Drives

Efficient Use of Energy
• CO2 footprint (power & transport)
• Reducing the footprint
• Distributed generation & storage
• Smart grid
GEO
survey

Monitoring, Measurement and
Validation for Environmental Treaties
• Baseline inventory of emissions
• Technology for control of emissions
• On site measuring and monitoring devices
• Remote Sensing (Satellite Measurements)
• Compliance with Treaties and Regulations
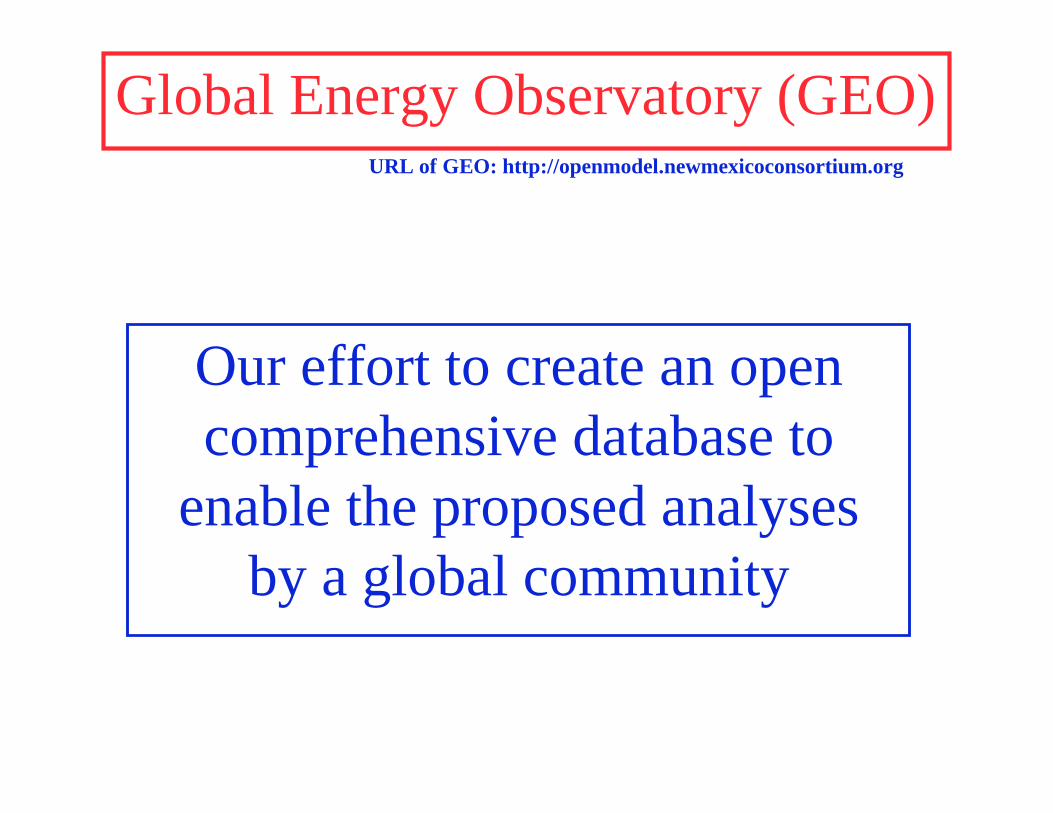
Our effort to create an open
comprehensive database to
enable the proposed analyses
by a global community
Global Energy Observatory (GEO)URL of GEO: http://openmodel.newmexicoconsortium.org

Global Energy Observatory (GEO)
Goal 3: inform educate & influence the transition to affordable carbon
neutral energy systems
Goal 2: understand the dynamics of change in various energy systems
Goal 1: to assemble, annotate, store and analyze the global energy system
URL of GEO: http://openmodel.newmexicoconsortium.org
4 linked databases:
1. Large Power Plants
2. Fuels and Resources
3. Transmission
4. Reduce your CO2 footprint

Integrate Volunteered Information(Examples of needed IS&T paradigms)
• Harvesting chatter– Increase in activity before social or terrorist events
– Google map of spread of flu (harvesting queries)
• Framework for collecting, managing, verifying andvalidating information through voluntary participation(citizen sensors)– Amateur astronomers
– Christmas bird inventory
• Universally Accessible Formats– WWW, Web 2.0

GEO @ openmodel.newmexicoconsortium.org
Framework for harnessing heterogeneous data,
contributions, moderation, validation & analysis
Moderated,
Validated
Database
Contributionsfrom experts & public Stack for
Moderation
Moderation
Discussion ForumAnalysis
Need further validation
Validated

Database: Reduce your CO2 footprint
• Calculate your CO2 foot print
• Strategies for reducing your CO2 footprint
• Database of distributed generation & storage
– Solar PV
– Wind
– Heat Pumps
– Storage (batteries)

Large Infrastructure Databases
* Coal Plants
* Gas Plants
* Geothermal Plants
* Hydroelectric Plants
* Nuclear Plants
* Oil/Diesel Plants
* Solar PV Farms
* Solar Thermal Plants
* Waste Plants
* Wind Farms
* Gas Fields
* Oil Fields
* Coal Mines
* Uranium Mines
* Crude Oil Refineries
* Solar Potential
* Wind Potential
* Biomass resource
* Gas Pipelines
* Oil Pipelines
* Coal Ports
* LNG ports
* Oil Ports
* Rail Links
* Road Links
* Shipping Lanes
* Electric Transmission
Grid
Power Plants(GEOwiki)
Fuels&Resources(GEOresources)
Transmission(GEOtransmission)
Blue=done, others=under construction

Organization of GEOpower:
Large power plants database
Power Plant Type
Country
State/Province
Individual Plant

Overview of features
• View existing data
• Create a new entry
• Edit and Add data
– Moderation
– Discussion Forum
• Download data
• Analyze data
• Create a Linked and IntegratedNetwork of energy systems
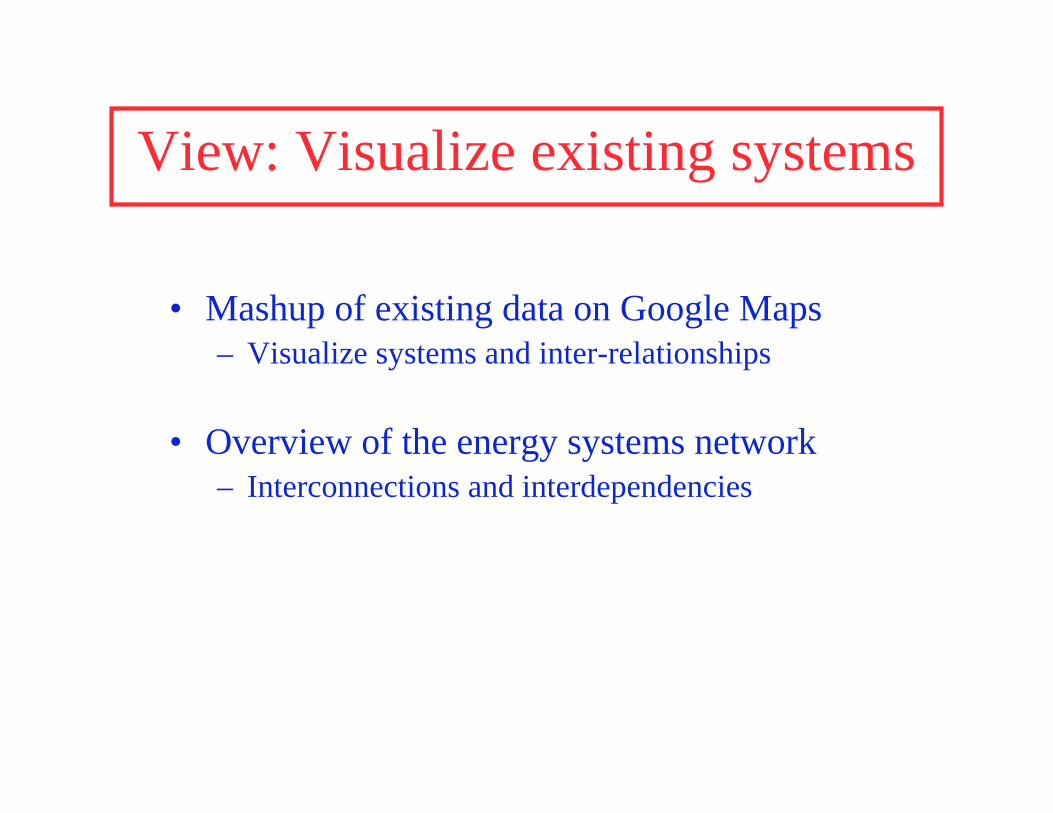
View: Visualize existing systems
• Mashup of existing data on Google Maps– Visualize systems and inter-relationships
• Overview of the energy systems network– Interconnections and interdependencies

Creating new entries
• Formatted Structured Data input via web forms– Geo-location
– Unit description
– Status of emission control devices and monitoring
– Linked Infrastructure
– Performance
– Emissions and impacts
– Major upgrades
– Ownership
– Comments
– References

Editing and adding to existing systems
• Enlarging the scientific database
• Visualization and analysis
• Timeline of improvements and enhancements
Maintaining Data Integrity
• On view: last moderated version
• Corrections: placed in a viewable stack for moderation
• Moderation: validating and incorporating new data

Ratings of Data
• Evaluating data records
– Visitors score the accuracy ofexisting data in a record
– Previous scores available as agraph showing distribution
– Time history of previous scoreswith overlay of dates on whichthe record was updated with anew moderated version.

V&V: (based on referee system in journals)
• Editors (subject area experts)– Review and verify submissions
– Create a new version for moderatorsto accept
– Enter unverified data into discussionforum
– Provide “trust rating” of contributors
• Moderators (subject area expertswith experience in moderation)– Integrate verified data submitted by
editors
– Provide “trust rating” of editors

Trust Network
trust(u) =(trust(i) * trust _edge(i,u))
i predecessors
(trust(i))i predecessors
trust(E) =0.7*0.8 + 0.8*0.6
0.7 + 0.8= 0.69
• Evaluating contributors
– Moderators rate editors
– Editors rate contributors foraccuracy of input
– Trust scores organized bysubject and geographical area
– Contributions from userswith high trust accepteddirectly (random checks withprobability based on trustscores)
– Users with score above “0.9”added to the pool of possibleeditors

Analysis
• Understand drivers
• Correlate (growth, scaling laws, …) with
– demographics
– economic activity
– land and water use
• Multi-sector network models:
– Feedbacks, nonlinearities, tipping points
– Crisis & Bottlenecks
– Evolution towards Smart / Green grids
• Understand the dynamics of change in energy systems
• Expose and validate options of carbon neutral systems

Modeling
• Exploring scenarios
• Exploring options
• Exploring consequences
• Connecting multiple sectors / networks
• Validation of data
• Providing input to policy

Partnerships and Collaborations
• High Schools, Colleges, Universities, Research Labs
• Academics and Scholars
• Utilities and energy companies
• Special Interest Groups
– WWF: Influenced moving the East Siberia-Pacific Ocean
pipeline further from Lake Baikal
– Greenpeace
– Sierra Club
– Industry
• Informed Public

Education
• Course EDUC 223B, School of Education, UC Berkeley. InstructorProf. Michael Ranney. Exercise and evaluate the prototype system froma reasoning and cognitive perspective.
• Course SC/NATS 1840.06 on Science, Technology and theEnvironment, Physics Department, York University, Canada.Instructor Prof. Carl Wolf. (242 students) Map the Canadian energysystem. Develop a plan to meet the growing energy needs of a region.
• Course 33-115 on Energy and Environmental Issues, PhysicsDepartment, Carnegie-Mellon University. Instructor Prof. John Nagle.Twelve students are using GEO to understand current energy systemsof eight regions (Illinois, Texas, Connecticut, Pennsylvania, India,Hong Kong, Taiwan, Mexico, and the UK).

Why OpenModel?Why not just buy information from “Platts”?
• Easy and free access for casual users
• Many more people can engage and contribute
• Topics, data, information selected by a diverse publicand experts and not just by a few experts & what sells
• Rapid and constant updates
• Constant scrutiny and validation of data
• Mashups and analyses contributing to education andpolicy
• Tracking growth in
– Distributed Generation and Storage
– Energy Efficiency
• Smart Grids
GEO Platts (Wikipedia Britannica)