Embed Size (px)
Citation preview
i
GEOTECHNICAL ASPECTS OF POLDER EMBANKMENT IN
SELECTED COASTAL AREA OF BANGLADESH
by
Md. Zakir Hossain
A thesis submitted to the Department of Civil Engineering,
Bangladesh University of Engineering and Technology,
Dhaka, in partial fulfillment of the degree of
MASTER OF ENGINEERING (Civil and Geotechnical)
DEPARTMENT OF CIVIL ENGINEERING
BANGLADESH UNIVERSITY OF ENGINEERING AND TECHNOLOGY
2013
ii
The thesis titled "GEOTECHNICAL ASPECTS OF POLDER EMBANKMENT IN
SELECTED COASTAL AREA OF BANGLADESH" Submitted by Md. Zakir Hossain, Roll
No. 100604212(P), Session October’ 2006, has been accepted as satisfactory in partial
fulfillment of the requirement for the degree of M. Engg. (Civil and Geotechnical) on
September 18, 2013.
BOARD OF EXAMINERS
Dr. Md. Jahangir Alam Chairman
Associate Professor (Supervisor)
Department of Civil Engineering
BUET, Dhaka - 1000.
Dr. Abu Siddique Member
Professor
Department of Civil Engineering
BUET, Dhaka - 1000.
Dr. Eqramul Hoque Member
Professor
Department of Civil Engineering,
BUET, Dhaka-1000
iii
CANDIDATE'S DECLARATION
It is hereby declared that this thesis or any part of it has not been submitted elsewhere for
the award of any degree or diploma.
(Md. Zakir Hossain)
iv
TABLE OF CONTENTS
Title Page
CANDIDATE'S DECLARATION iii
TABLE OF CONTENTS iv
LIST OF TABLLES vi
LIST OF FIGURES vii
LIST OF NOTATIONS ix
ACKNOWLEDGMENTS x
ABSTRACT xi
CHAPTER ONE: INTRODUCTION
1.1 General 11
1.2 Background of the Study 12
1.3 Objectives of the Study 14
1.4 Methodology 14
1.5 Organization of the Thesis 15
CHAPTER TWO: LITERATURE REVIEW
2.1 Introduction 18
2.2 Geotechnical Failure Mechanisms 19
2.2.1 Overall Stability Failure Mechanisms 19
2.2.2 Local Stability Failure Mechanisms 20
2.3 Identification of Soils Susceptible to Downslope Migration 22
2.4 Methods of Preventing Downslope Migration 23
2.5 Geotechnical Investigation of Meghna-Dhonagoda Irrigation Project
(MDIP) Embankment
25
2.6 Causes of Erosion of Polder Embankment 29
2.6.1 Natural Forces 30
2.6.2 Human Interference 32
2.7 Causes of Failure of Earth Fill Embankments 33
2.7.1 Hydraulic Failures 33
2.7.2 Seepage Failures 34
v
2.7.3 Structural Failures 35
2.7.4 Others 35
CHAPTER THREE: TEST PROGRAM
3.1 General 36
3.2 Polder Embankment Section 36
3.3 Field Tests 36
3.4 Laboratory Tests 37
CHAPTER FOUR: RESULTS AND DISCUSSION
4.1 General 41
4.2 Atterberg Limits 41
4.3 Grain Size Distribution 42
4.4 USCS Classification of Soil Samples 42
4.5 Identification of Soils Susceptible to Downslope Migration 42
4.6 Field SPT Value 44
4.7 Field Density 44
4.8 Hydrometer Analysis 45
4.9 Double Hydrometer Ratio Test 45
4.10 Polder Embankment Construction Practices 46
4.11 Causes of Failure of Embankment 46
4.12 Possible Solutions to the Problem 47
CHAPTER FIVE: CONCLUSION AND RECOMMENDATION
5.1 General 60
5.2 Conclusions 60
5.3 Recommendations for future study 61
REFERENCES 62
APPENDIX A: TEST DATA AND GRAPH 64
vi
LIST OF TABLES
Table 2.1 Requirements of the coarse layer
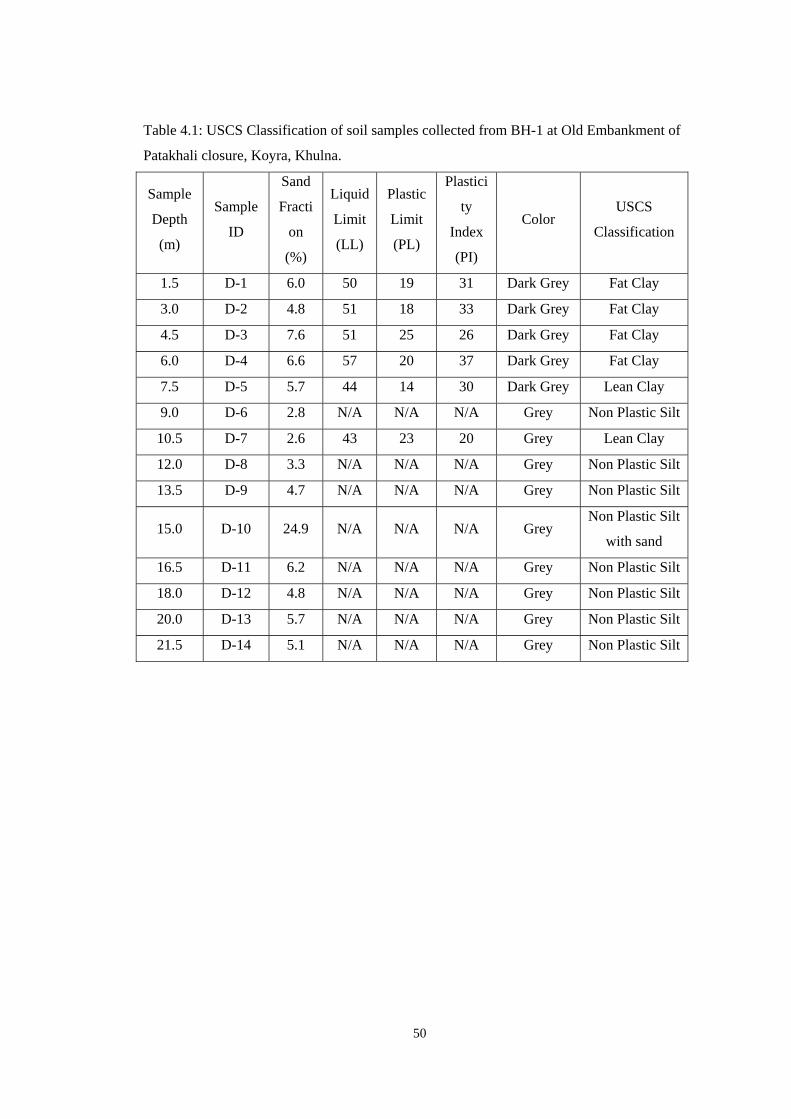
Table 4.1 USCS Classification of soil samples collected from BH-1 at Old
Embankment of Patakhali closure, Koyra, Khulna
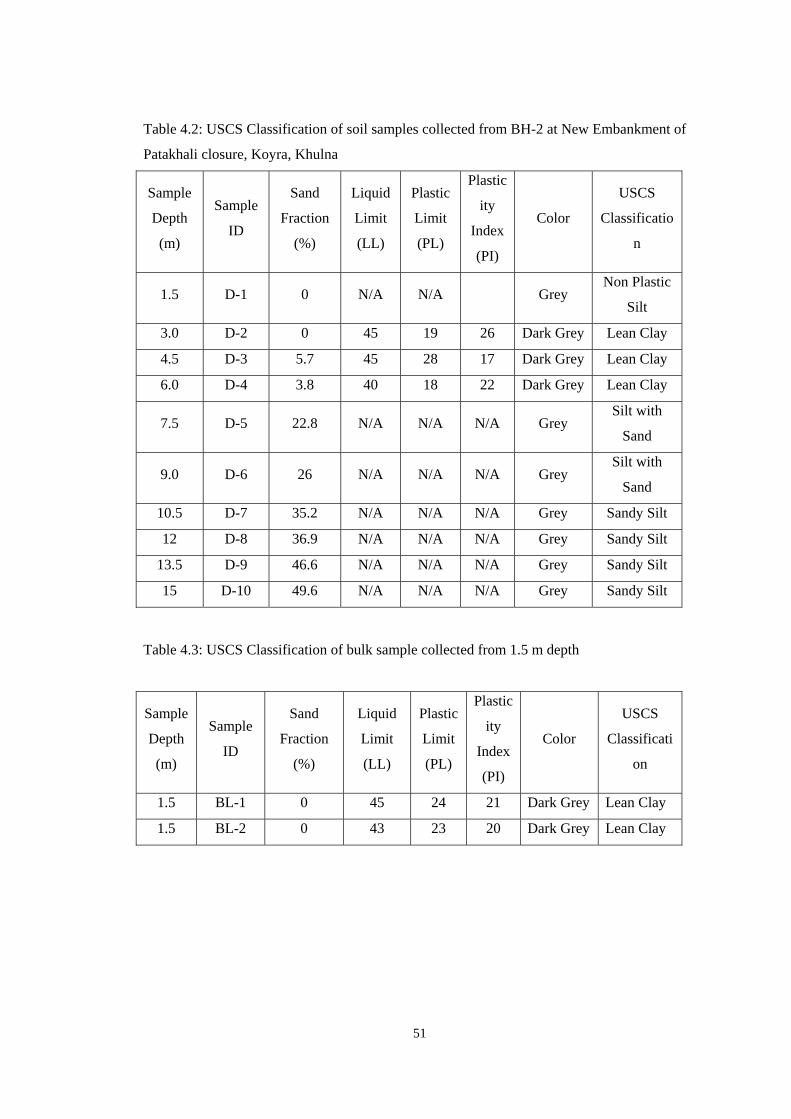
Table 4.2 USCS Classification of soil samples collected from BH-2 at New
Embankment of Patakhali closure, Koyra, Khulna
Table 4.3 USCS Classification of bulk sample collected from 1.5 m depth
Table 4.4 Index properties of clayey soil collected from BH-1
Table 4.5 Index properties of clayey soil collected from BH-2
Table 4.6 Field density results
Table 4.7 Degree of dispersion from double hydrometer ratio test [6]
vii
LIST OF FIGURES
Figure 1.1 Situation of villages after 2 years of devastation caused by Aila in 2009;
(a) country side (b) river side
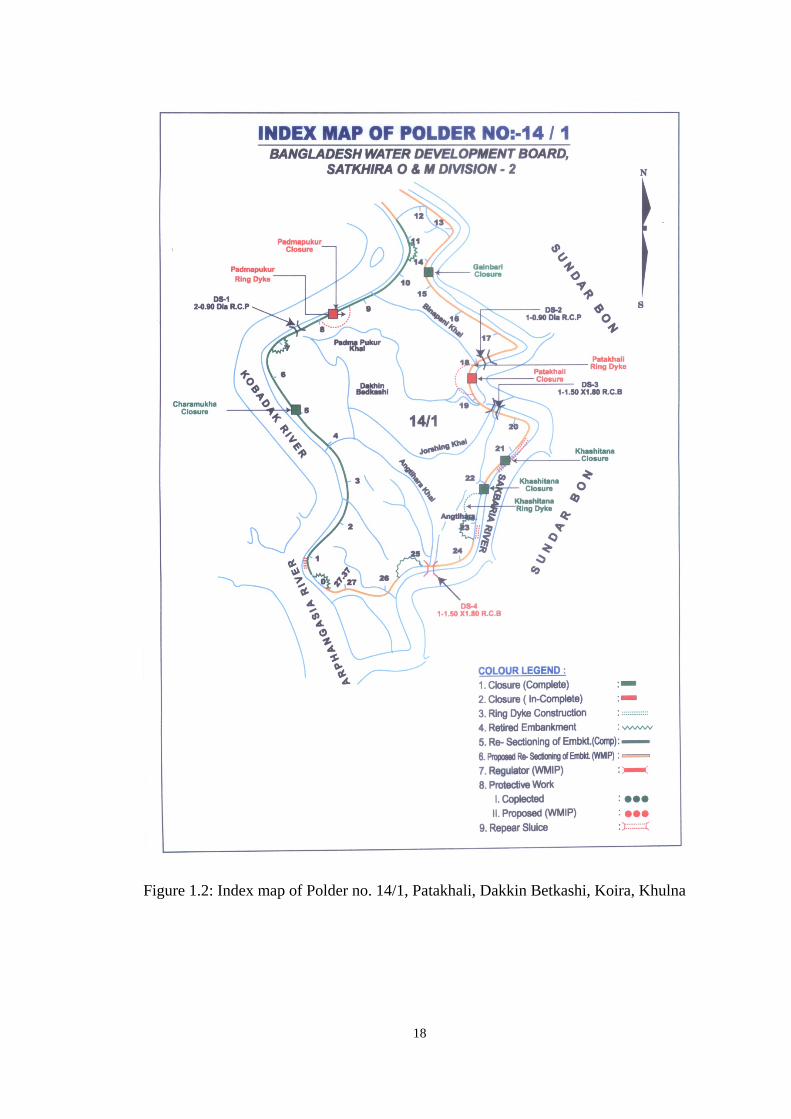
Figure 1.2 Index map of Polder no. 14/1, Patakhali, Dakkin Betkashi, Koira,
Khulna
Figure 2.1 Sub-soil failure mechanism Figure 2.2 Classification of various failure mechanisms Figure 2.3 Recommended filter system
Figure 2.4 Location of boreholes marked by circles and distress areas are marked by
numbers in the MDIP
Figure 3.1 Typical section of old embankments Figure 3.2 Typical section of new embankments Figure 3.3 Locations of SPT boreholes, field density tests and bulk soil sample
Figure 3.4 First borehole, BH-1 (21.5 m deep), near old embankment at Patakhali
closure, Koyra, Khulna
Figure 3.5 Second borehole, BH-2 (15.5 m deep), near new embankment at
Patakhali closure, Koyra, Khulna
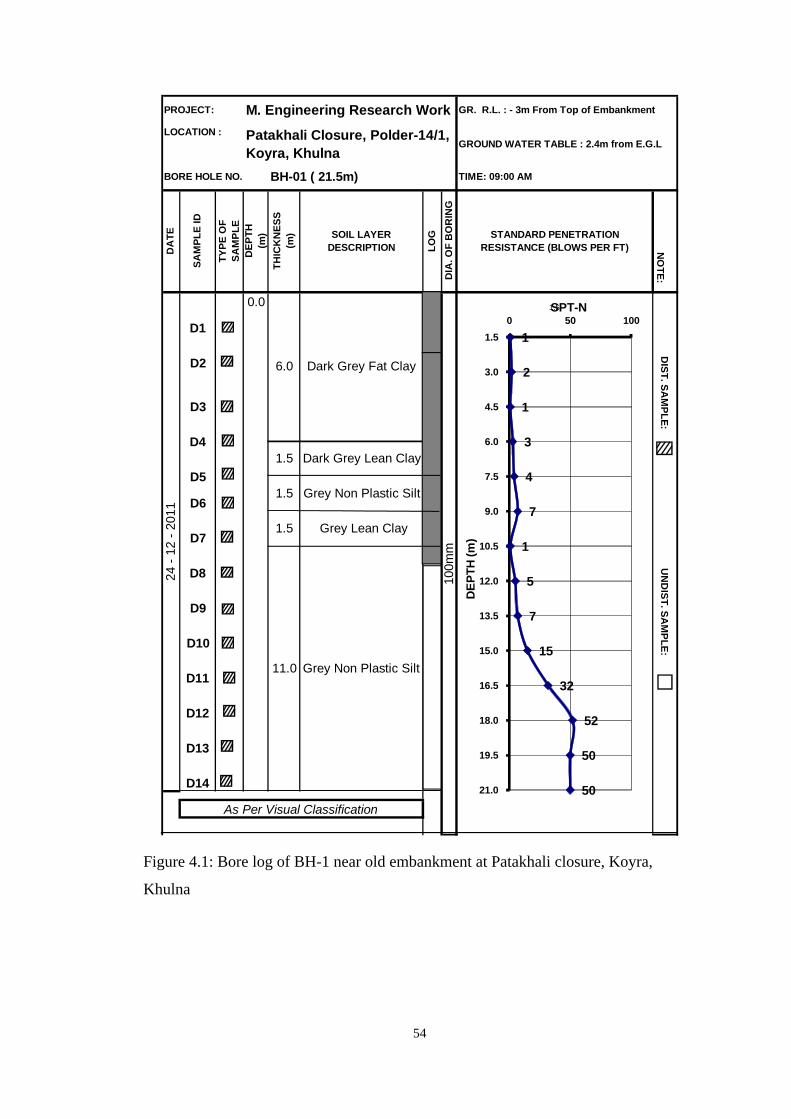
Figure 4.1 Bore log of BH-1 near old embankment at Patakhali closure, Koyra,
Khulna
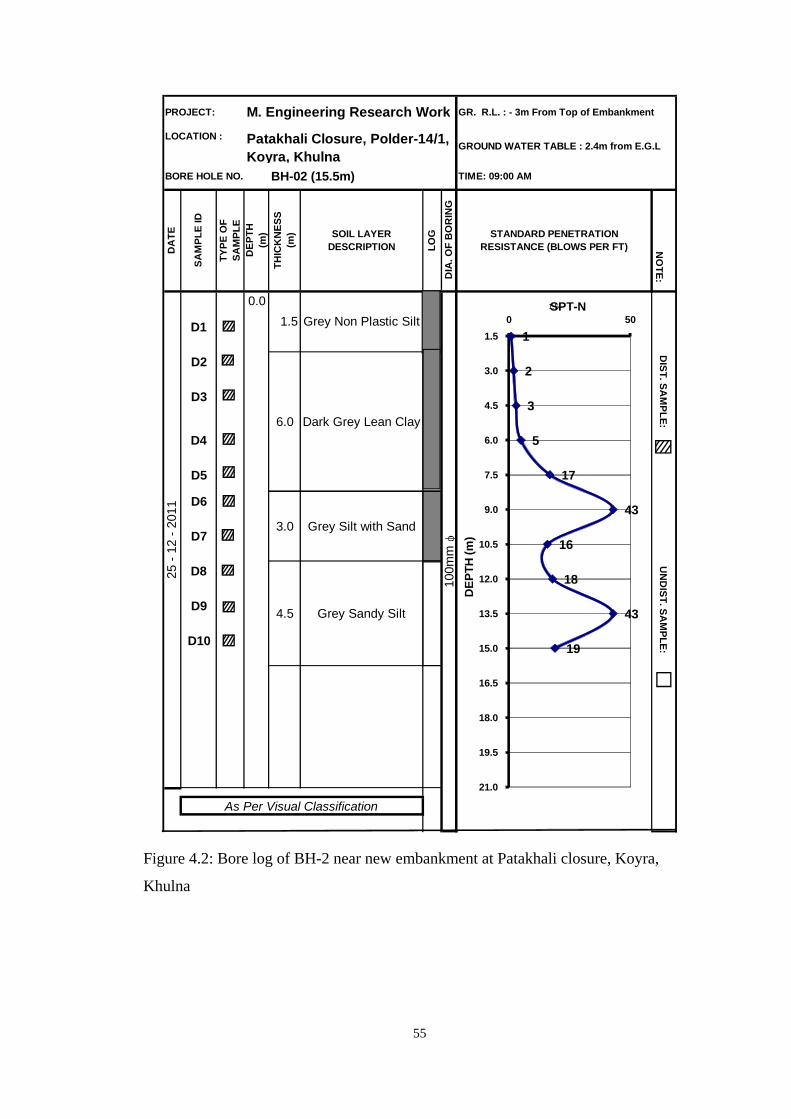
Figure 4.2 Bore log of BH-2 near new embankment at Patakhali closure, Koyra,
Khulna
Figure 4.3 Grain size distribution curve of bulk soil sample B-1 (Lean Clay)
collected from Patakhali closure, Koyra, Khulna
Figure 4.4 Grain size distribution curve of disturbed soil sample D- 2 collected
from BH-1, Patakhali closure, Koyra, Khulna
Figure 4.5 Grain size distribution curve of disturbed soil sample D-3 collected
from BH-2, Patakhali closure, Koyra, Khulna
Figure 4.6 Double hydrometer ratio test result of bulk soil sample B-1 (Lean Clay)
collected from Patakhali closure, Koyra, Khulna
Figure 4.7 Double hydrometer ratio test result of disturbed soil sample D-2 (Lean
Clay) collected from BH-1, Patakhali closure, Koyra, Khulna
Figure 4.8 Double hydrometer ratio test result of disturbed soil sample D-3 (Lean
Clay) collected from BH-2, Patakhali closure, Koyra, Khulna

viii
Figure 4.9 Standard Proctor Compaction Test results of bulk soil sample B-1 (Lean
Clay) collected from Patakhali closure, Koyra, Khulna
Figure 4.10 Typical section of embankment constructed in Padmapukur, Koyra,
Khulna

ix
LIST OF NOTATIONS
S = Degree of saturation;
Cc = Compression index;
Ip = Plasticity index;
qu = Unconfined compressive strength
SPT = Standard penetration test;
wL = Liquid limit;
wn = Natural Water Content;
wp = Plastic limit;
γd = Dry unit weight;
x
ACKNOWLEDGEMENTS
The author is indebted to his supervisor Dr. Md. Jahangir Alam, Associate Professor,
Department of Civil Engineering, Bangladesh University of Engineering and
Technology (BUET), for his inspiration, encouragement, continuous guidance,
important suggestions throughout the various stages of this research. The author also
expresses his profound gratitude to Dr. Abu Siddique, Professor, Department of Civil
Engineering, BUET, Dhaka, for his valuable corrections and suggestions during
preparation of proposal and writing of this thesis.
The author gratefully acknowledges the constructive criticisms and valuable
suggestions made by Professor Dr. Eqramul Hoque.
Thanks are due to Mr. Habibur Rahman, Mr. Shahabuddin and Mr. Khokon of
Geotechnical Laboratory for their enormous help and assistance during experimental
works.
Last but not the least, the author gratefully acknowledges the patience and
encouragement of his parents and wife during his M. Engineering study in BUET.
xi
ABSTRACT
Polder embankments are vulnerable to breaching during storm surges. To investigate
the causes of failure of embankments, polder no. 14/1 was selected for this study. This
polder is in Koyra Upazilla under Khulna district. This polder is near Sundarbans.
Two SPT bore holes were done near Patakhali closure, one at the toe of existing
embankment and another adjacent to the closure. Due to very soft and non-plastic soil,
undisturbed soil samples could not be collected from any borehole. Disturbed samples
were collected from two boreholes at 1.5 m interval along with field SPT-N value.
Bulk soil samples were collected from adjacent to closure at 1.5 m depth by manually
excavating the top soil. Two in-situ field density test using sand cone method were
performed; one on the top of the existing embankment and another at the toe of the
existing embankment. Necessary index tests were done to classify the soils. Double
hydrometer ratio tests were performed to determine the dispersiveness of the soil.
Standard Proctor Compaction test were performed on bulk sample.
The sub-surface soil consists mainly of lean clay in the upper layers up to the depth of
eleven meters whereas the layers below this consist of non-plastic silt with sand.
Since the soil is non-plastic i.e. the soil possesses no cohesion, it is vulnerable to
erosion and so if any failure takes place in the embankment due to any cause it
propagates quickly and cannot be stopped and becomes a catastrophe within days.
Double hydrometer ratio test results on lean clay show that the soil samples collected
from the surface and the boreholes are medium dispersive. When water flows through
it or in contact with it the soil particles are easily washed away with water. So, it
might be the cause of failure of the embankment. In situ density of soil is very low.
Usually no compaction is done during construction of polder embankment. Because it
is very expensive to carry compaction machine to the site as it is very remote place in
Bangladesh. So the embankment remains at high void ratio which is susceptible to
piping and erosion.
12
CHAPTER 1: INTRODUCTION
1.1 GENERAL
A polder is a low lying tract of land enclosed by embankments (barriers) known as
dykes, that forms an artificial hydrological entity, meaning it has no connection with
outside water other than through manually operated devices. Polders are most
commonly found, though not exclusively so, in river deltas, former fen lands, and
coastal areas. Dykes are mostly built using locally available materials and each
material has its own risk factor: sand is prone to erosion by water while dry peat is
lighter than water, making the barrier potentially unstable in very dry seasons.
Earth embankments in Bangladesh are beset with multi-facetted problems. The design
and construction methods used to build the embankments, the nature and extent of
erosive forces to destabilize them and above all the attitude of the local people for
whom they are built altogether determine the magnitude and degree of instability.
Most earthen embankments face light to moderate erosion problems arising out of
rainfall splash, animal actions and the nature of human uses. Some of the critically
positioned submerged types of embankment in haor areas of the eastern part and river
embankments of the main land are subjected to turbulent water currents and changes
in river courses. The problem is acute in offshore islands and coastal belts where the
embankments are in addition exposed to erosion by sea waves and tidal fluctuation of
water levels.
In the coastal belt and offshore islands severe bank erosion problems occur frequently.
New accretion and shifting of the bank line due to erosion happen almost in the same
way as those observed in the inland rivers. However, the nature and extent of erosive
forces damaging the seashore and successively the dykes differ in certain aspects from
those of the inland riverbanks.
The process of erosion gradually destroys the shore lands/riverbanks, foreshore
areas/berms and successively the earthen embankments engulfing the plain
agricultural lands, habitats and many important installations. In the affected reaches,
the embankments built with adequate setback are found to disappear within a year or
two of the start of erosion. Generally new embankments are constructed along
13
separate alignments (further back in the countryside), simultaneously adopting
sufficient measures to check the bank erosion. Whenever the situation compels to
protect the high-value assets and important installations as the losses are really
irreparable or would have a great impact on the national economy, sophisticated
structural means of proven engineering solutions involving huge costs are often
adopted to combat the erosive forces.
1.2 BACKGROUND OF THE STUDY
The southern part of Bangladesh mostly the coastal districts are divided into many
parts of land like separated islands by the tributaries of the main rivers of Bangladesh.
Existing ground surface is slightly above the mean water level of surrounding rivers.
So they are frequently washed away by the daily tidal surges. To protect those lands
and their inhabitants from these regular tidal surges and storm surges due to cyclone,
embankments were built surrounding the island which is known as Polder.
There are 123 polders in the coastal districts of Bangladesh. Some are large in area
whereas some are small. Of them ten polders are in Satkhira, 26 in Khulna, 5 in
Bagerhat, 23 in Patuakhali, 19 in Borguna, 19 in Cox’s Bazar and rest of the polders
are situated in other coastal districts. These polders were constructed during late
sixties. Since then they had been working well up to recent years. But they were
severely damaged recently by the cyclone Aila in April 2009. After Aila, during tidal
flow the saline water enters into the polder and submerged everything. This affects
those polder areas through permanent inundation, drainage congestion, storm surge
inundation and increased salinity intrusion of low-lying areas. As a result shrimp
farm, agricultural land, wetlands, infrastructure and all other income generating works
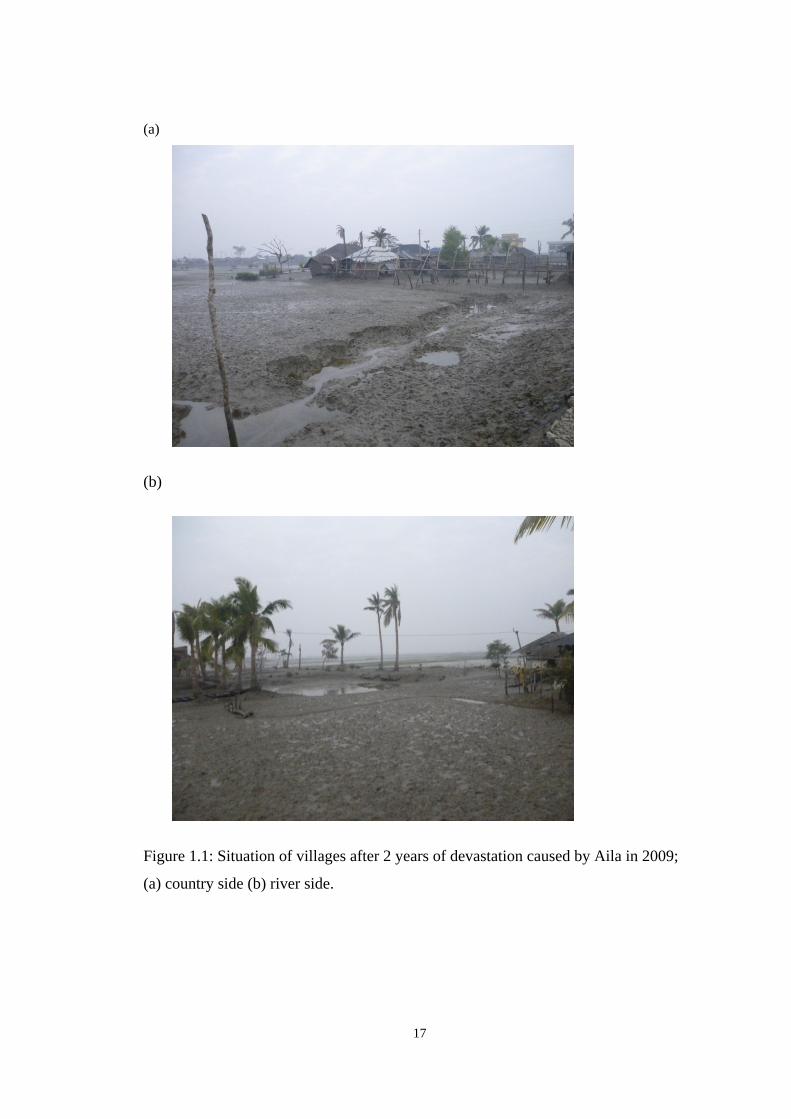
become severely damaged. The green crop land disappears and it becomes a desert of
mud (Figure 1.1). So the suffering of the islanders knows no bound. Bangladesh
Water Development Board (BWDB) tried their best to rebuild the damaged part of
embankment. But it was not always possible to rebuild the dyke and keep the closure
in position.
Increasing rates of sea level rise caused by global warming are expected to lead to
permanent inundation, drainage congestion, salinity intrusion and frequent storm
14
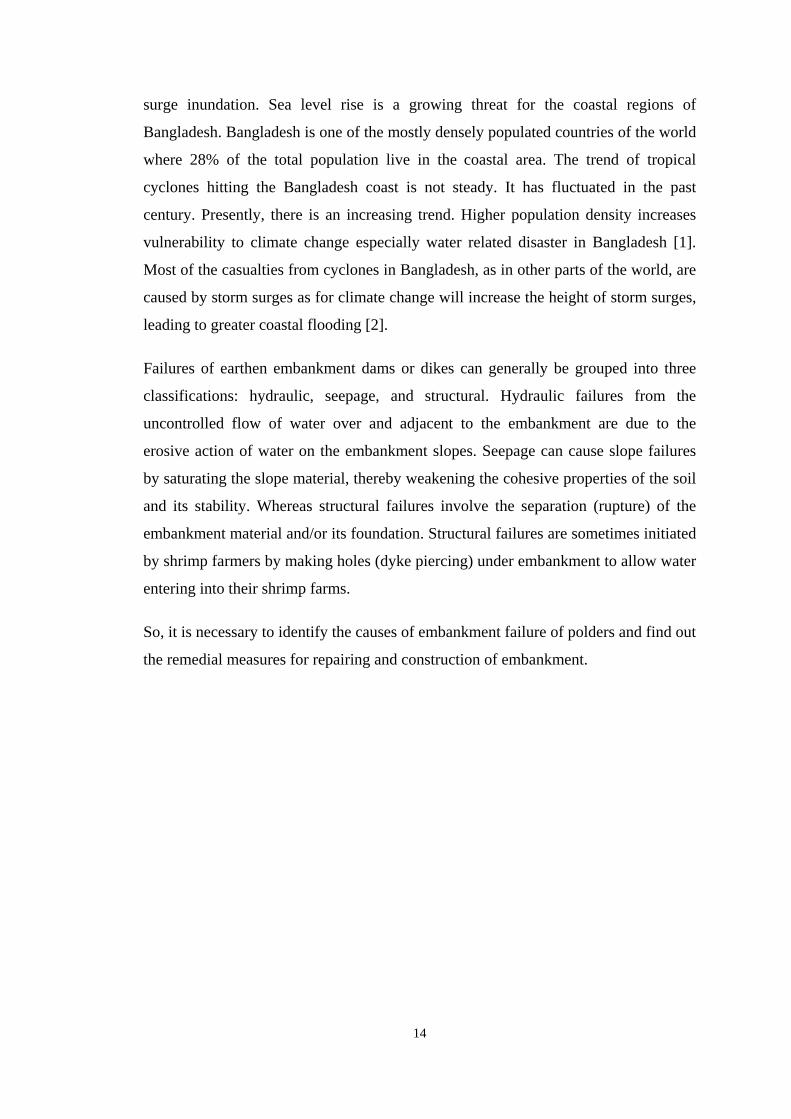
surge inundation. Sea level rise is a growing threat for the coastal regions of
Bangladesh. Bangladesh is one of the mostly densely populated countries of the world
where 28% of the total population live in the coastal area. The trend of tropical
cyclones hitting the Bangladesh coast is not steady. It has fluctuated in the past
century. Presently, there is an increasing trend. Higher population density increases
vulnerability to climate change especially water related disaster in Bangladesh [1].
Most of the casualties from cyclones in Bangladesh, as in other parts of the world, are
caused by storm surges as for climate change will increase the height of storm surges,
leading to greater coastal flooding [2].
Failures of earthen embankment dams or dikes can generally be grouped into three
classifications: hydraulic, seepage, and structural. Hydraulic failures from the
uncontrolled flow of water over and adjacent to the embankment are due to the
erosive action of water on the embankment slopes. Seepage can cause slope failures
by saturating the slope material, thereby weakening the cohesive properties of the soil
and its stability. Whereas structural failures involve the separation (rupture) of the
embankment material and/or its foundation. Structural failures are sometimes initiated
by shrimp farmers by making holes (dyke piercing) under embankment to allow water
entering into their shrimp farms.
So, it is necessary to identify the causes of embankment failure of polders and find out
the remedial measures for repairing and construction of embankment.
15
1.3 OBJECTIVES OF THE STUDY
The objectives of the study are as follows:
i. To identify the causes of failure of embankments of Polders.
ii. To suggest a method to repair the embankments.
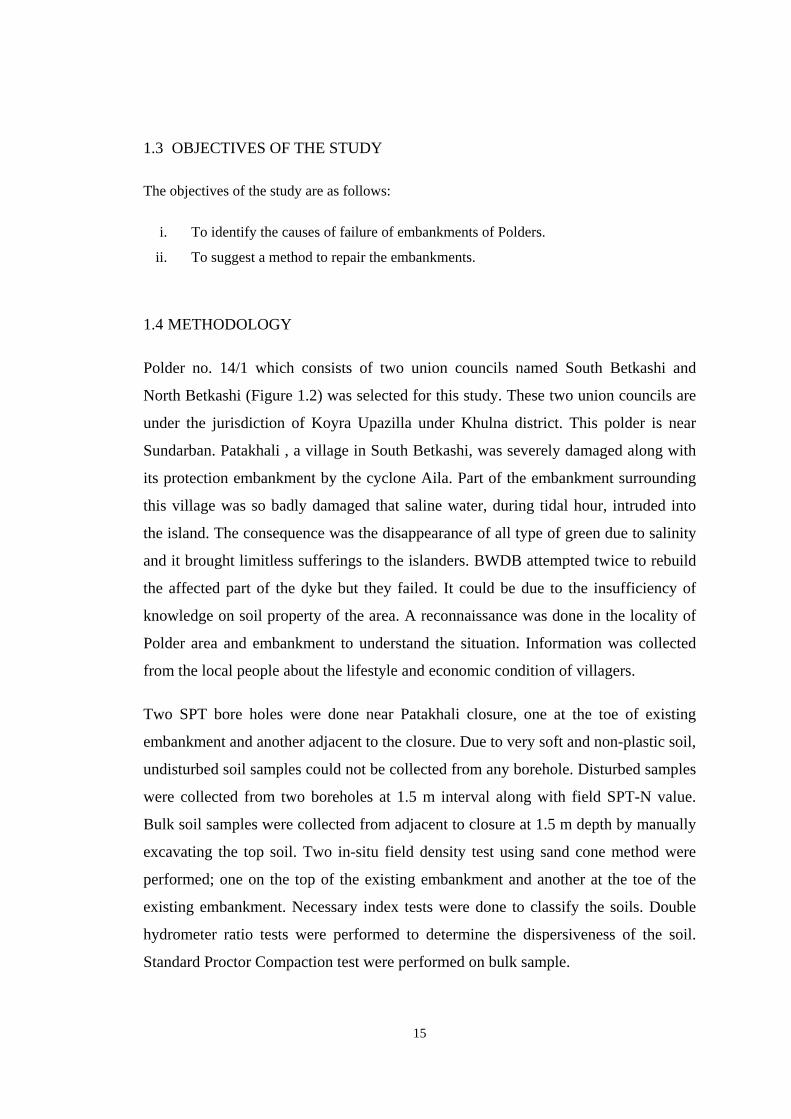
1.4 METHODOLOGY
Polder no. 14/1 which consists of two union councils named South Betkashi and
North Betkashi (Figure 1.2) was selected for this study. These two union councils are
under the jurisdiction of Koyra Upazilla under Khulna district. This polder is near
Sundarban. Patakhali , a village in South Betkashi, was severely damaged along with
its protection embankment by the cyclone Aila. Part of the embankment surrounding
this village was so badly damaged that saline water, during tidal hour, intruded into
the island. The consequence was the disappearance of all type of green due to salinity
and it brought limitless sufferings to the islanders. BWDB attempted twice to rebuild
the affected part of the dyke but they failed. It could be due to the insufficiency of
knowledge on soil property of the area. A reconnaissance was done in the locality of
Polder area and embankment to understand the situation. Information was collected
from the local people about the lifestyle and economic condition of villagers.
Two SPT bore holes were done near Patakhali closure, one at the toe of existing
embankment and another adjacent to the closure. Due to very soft and non-plastic soil,
undisturbed soil samples could not be collected from any borehole. Disturbed samples
were collected from two boreholes at 1.5 m interval along with field SPT-N value.
Bulk soil samples were collected from adjacent to closure at 1.5 m depth by manually
excavating the top soil. Two in-situ field density test using sand cone method were
performed; one on the top of the existing embankment and another at the toe of the
existing embankment. Necessary index tests were done to classify the soils. Double
hydrometer ratio tests were performed to determine the dispersiveness of the soil.
Standard Proctor Compaction test were performed on bulk sample.
16
1.5 ORGANIZATION OF THE THESIS
The thesis is arranged into five chapters and one appendix. In Chapter One,
background and objectives of the research is described. Chapter Two contains the
literature review where history, works and researches on embankment failure are
described.
Chapter Three describes the testing program. Chapter Four contains results and
discussion. Chapter Five contains the conclusions and recommendations for further
research. All graphs of testing results are presented in Appendix A.
17
(a)
(b)
Figure 1.1: Situation of villages after 2 years of devastation caused by Aila in 2009;
(a) country side (b) river side.
18
Figure 1.2: Index map of Polder no. 14/1, Patakhali, Dakkin Betkashi, Koira, Khulna
19
CHAPTER 2: LITERATURE REVIEW
2.1 INTRODUCTION
The literature review is consisting of (a) geotechnical failure mechanisms (b) causes
of erosion of polder embankments and their effects (c) measures taken for erosion
control and (d) different models for embankment erosion control. Agarwala et al [1]
discussed the climate change in Bangladesh and focus on the causes of coastal
flooding and Sundarbans. Ali [2] worked on vulnerability of Bangladesh to climate
change and finds the sea level rise through tropical cyclones and storm surges.
Hossain and Sakai [4] learn the severity of flood embankments in Bangladesh through
their works and suggest its remedial approach. Islam et al [5] studied in-situ shear
strength of Vetiver grass rooted soil to protect embankment from erosion. Several
studies have been done on river embankment and bank failure in various locations of
Bangladesh by Hossain et al [5].
Sustainable embankment construction and repair is necessary to protect the
inhabitants of polders in Bangladesh. Until now few researches have been done in
Bangladesh addressing this problem. Hossain and Sakai [4] identified that as most of
the embankments are made of earth or soil only without any surface covering, these
are washed away easily with the raindrop and current or flow of water. Therefore they
suggested that following remedial measures should be taken for sustainable
embankment in Bangladesh: (i) construction of concrete embankment instead of
earthen one, (ii) Protection to the surface of earthen embankment to prevent washing
out of soil, (iii) Use of locally available recycled and waste materials for earth
reinforcement and (iv) application of soil cement composite with mesh as a
reinforcement. Islam et al [5] studied the effectiveness of Vetiver grass rooted soil for
sustainable embankment. They concluded that Vetiver is effective to protect the
coastal embankment against erosion, runoff, wave action, flood and cyclonic tidal
surge etc.
20
2.2 GEOTECHNICAL FAILURE MECHANISMS
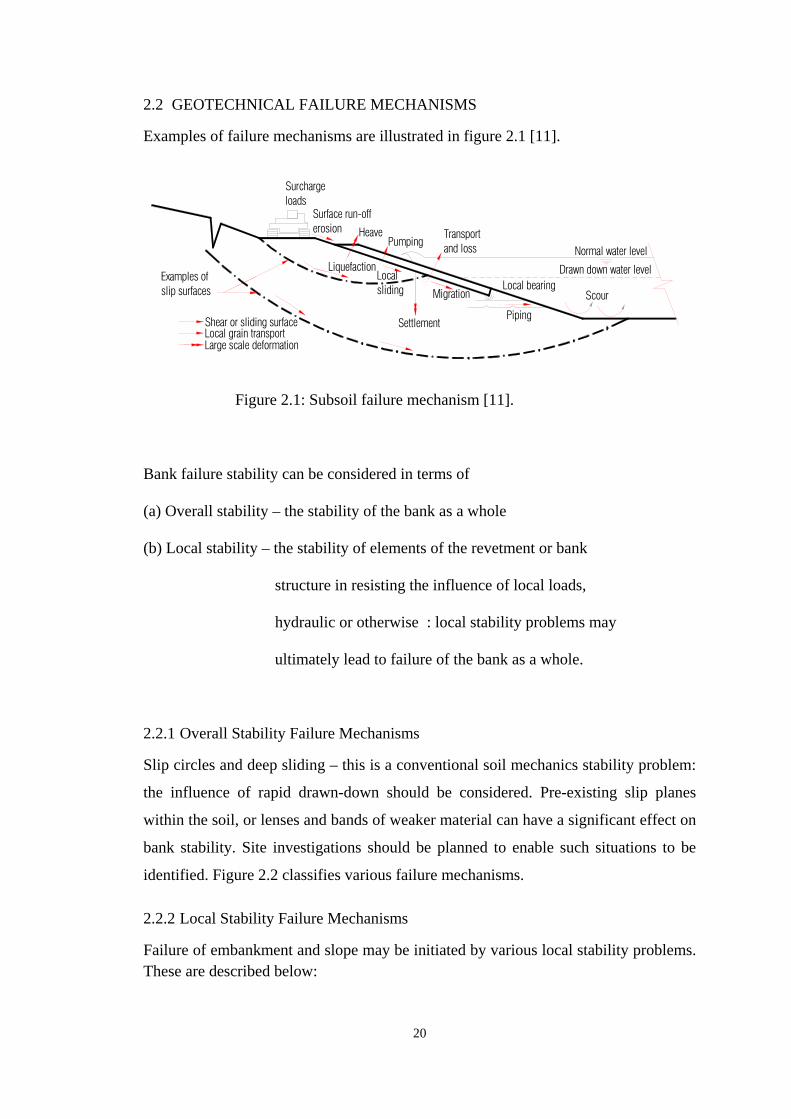
Examples of failure mechanisms are illustrated in figure 2.1 [11].
Surchargeloads
Surface run-offerosion Heave
LiquefactionLocalsliding
Settlement
Examples ofslip surfaces
Transportand loss Normal water level
Drawn down water level
Piping
Local bearingScour
Shear or sliding surfaceLocal grain transportLarge scale deformation
Pumping
Migration
Figure 2.1: Subsoil failure mechanism [11].
Bank failure stability can be considered in terms of
(a) Overall stability – the stability of the bank as a whole
(b) Local stability – the stability of elements of the revetment or bank
structure in resisting the influence of local loads,
hydraulic or otherwise : local stability problems may
ultimately lead to failure of the bank as a whole.
2.2.1 Overall Stability Failure Mechanisms
Slip circles and deep sliding – this is a conventional soil mechanics stability problem:
the influence of rapid drawn-down should be considered. Pre-existing slip planes
within the soil, or lenses and bands of weaker material can have a significant effect on
bank stability. Site investigations should be planned to enable such situations to be
identified. Figure 2.2 classifies various failure mechanisms.
2.2.2 Local Stability Failure Mechanisms
Failure of embankment and slope may be initiated by various local stability problems. These are described below:
21
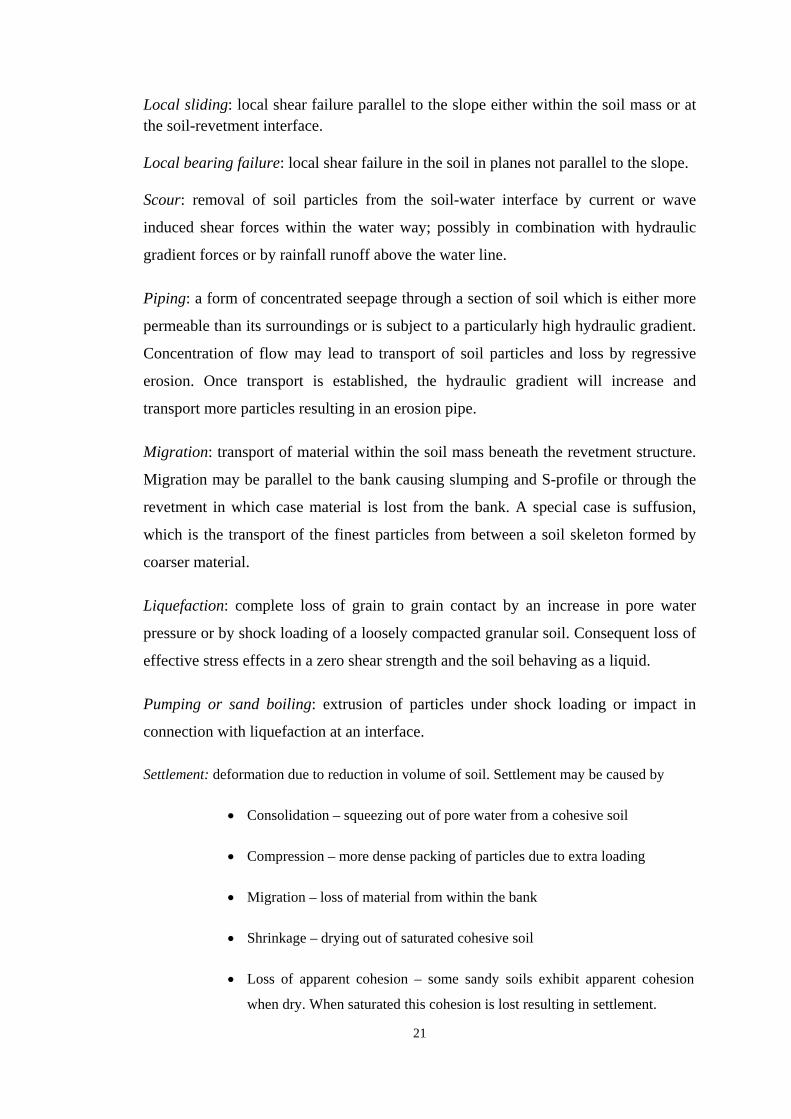
Local sliding: local shear failure parallel to the slope either within the soil mass or at the soil-revetment interface.
Local bearing failure: local shear failure in the soil in planes not parallel to the slope.
Scour: removal of soil particles from the soil-water interface by current or wave
induced shear forces within the water way; possibly in combination with hydraulic
gradient forces or by rainfall runoff above the water line.
Piping: a form of concentrated seepage through a section of soil which is either more
permeable than its surroundings or is subject to a particularly high hydraulic gradient.
Concentration of flow may lead to transport of soil particles and loss by regressive
erosion. Once transport is established, the hydraulic gradient will increase and
transport more particles resulting in an erosion pipe.
Migration: transport of material within the soil mass beneath the revetment structure.
Migration may be parallel to the bank causing slumping and S-profile or through the
revetment in which case material is lost from the bank. A special case is suffusion,
which is the transport of the finest particles from between a soil skeleton formed by
coarser material.
Liquefaction: complete loss of grain to grain contact by an increase in pore water
pressure or by shock loading of a loosely compacted granular soil. Consequent loss of
effective stress effects in a zero shear strength and the soil behaving as a liquid.
Pumping or sand boiling: extrusion of particles under shock loading or impact in
connection with liquefaction at an interface.
Settlement: deformation due to reduction in volume of soil. Settlement may be caused by
• Consolidation – squeezing out of pore water from a cohesive soil
• Compression – more dense packing of particles due to extra loading
• Migration – loss of material from within the bank
• Shrinkage – drying out of saturated cohesive soil
• Loss of apparent cohesion – some sandy soils exhibit apparent cohesion
when dry. When saturated this cohesion is lost resulting in settlement.
22
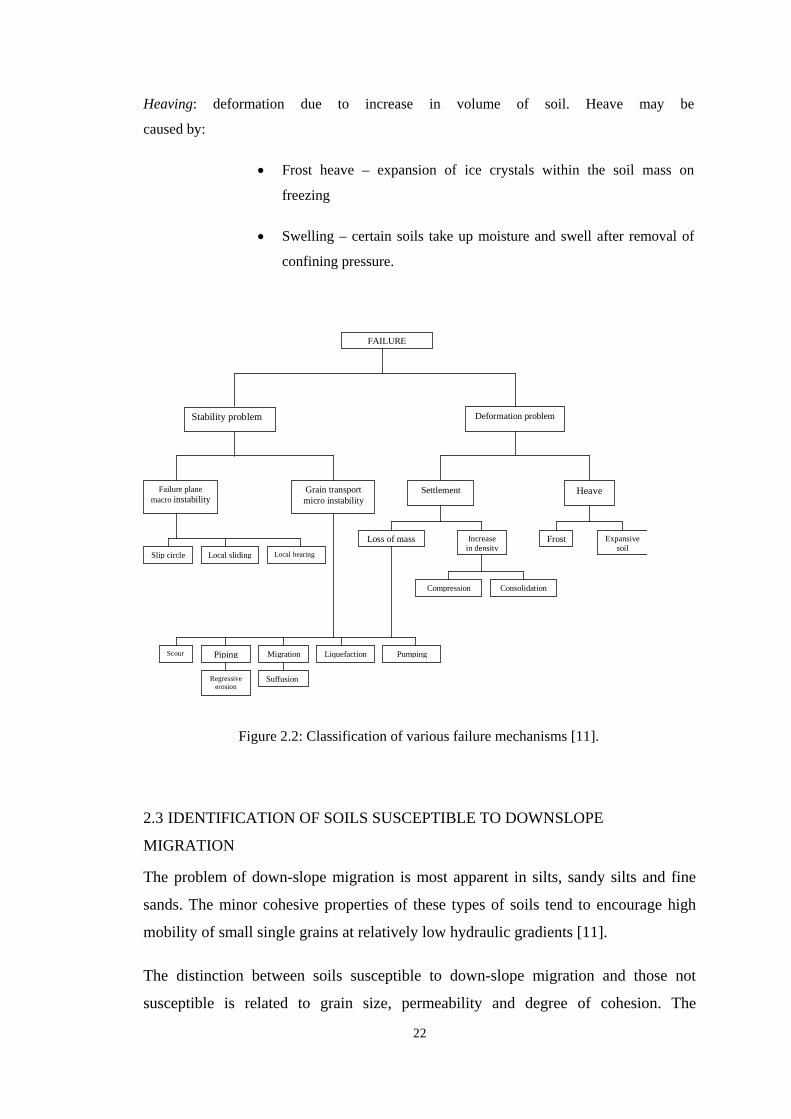
Heaving: deformation due to increase in volume of soil. Heave may be
caused by:
• Frost heave – expansion of ice crystals within the soil mass on
freezing
• Swelling – certain soils take up moisture and swell after removal of
confining pressure.
Stability problem
FAILURE
Deformation problem
Failure plane macro instability
Grain transportmicro instability
Settlement Heave
Slip circle Local sliding Local bearing
Scour Piping Migration Liquefaction Pumping
Loss of mass Increase in density
Frost Expansive soil
Compression Consolidation
Regressive erosion
Suffusion
Figure 2.2: Classification of various failure mechanisms [11].
2.3 IDENTIFICATION OF SOILS SUSCEPTIBLE TO DOWNSLOPE
MIGRATION
The problem of down-slope migration is most apparent in silts, sandy silts and fine
sands. The minor cohesive properties of these types of soils tend to encourage high
mobility of small single grains at relatively low hydraulic gradients [11].
The distinction between soils susceptible to down-slope migration and those not
susceptible is related to grain size, permeability and degree of cohesion. The
23
following procedure gives a general method of identifying soils susceptible to down-
slope migration. There may however be exceptions to the conditions given here and
the designer must use his own judgment in such cases.
Soils susceptible to down-slope migration will satisfy the condition that a proportion
of particles must be smaller than 0.06 mm. Additionally the soil will satisfy at least
one of the following criteria:
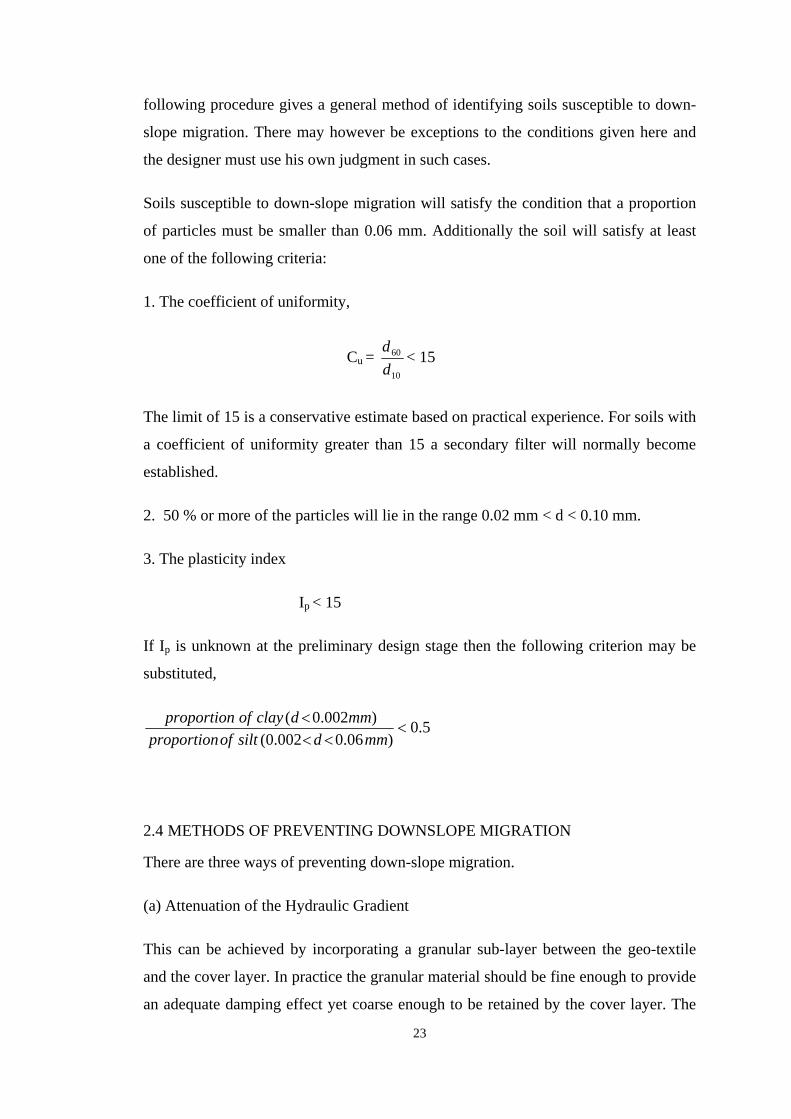
1. The coefficient of uniformity,
Cu = 10
60
dd
< 15
The limit of 15 is a conservative estimate based on practical experience. For soils with
a coefficient of uniformity greater than 15 a secondary filter will normally become
established.
2. 50 % or more of the particles will lie in the range 0.02 mm < d < 0.10 mm.
3. The plasticity index
Ip < 15
If Ip is unknown at the preliminary design stage then the following criterion may be
substituted,
5.0)06.0002.0(
)002.0(<
<<<
mmdsiltofproportionmmdclayofproportion
2.4 METHODS OF PREVENTING DOWNSLOPE MIGRATION
There are three ways of preventing down-slope migration.
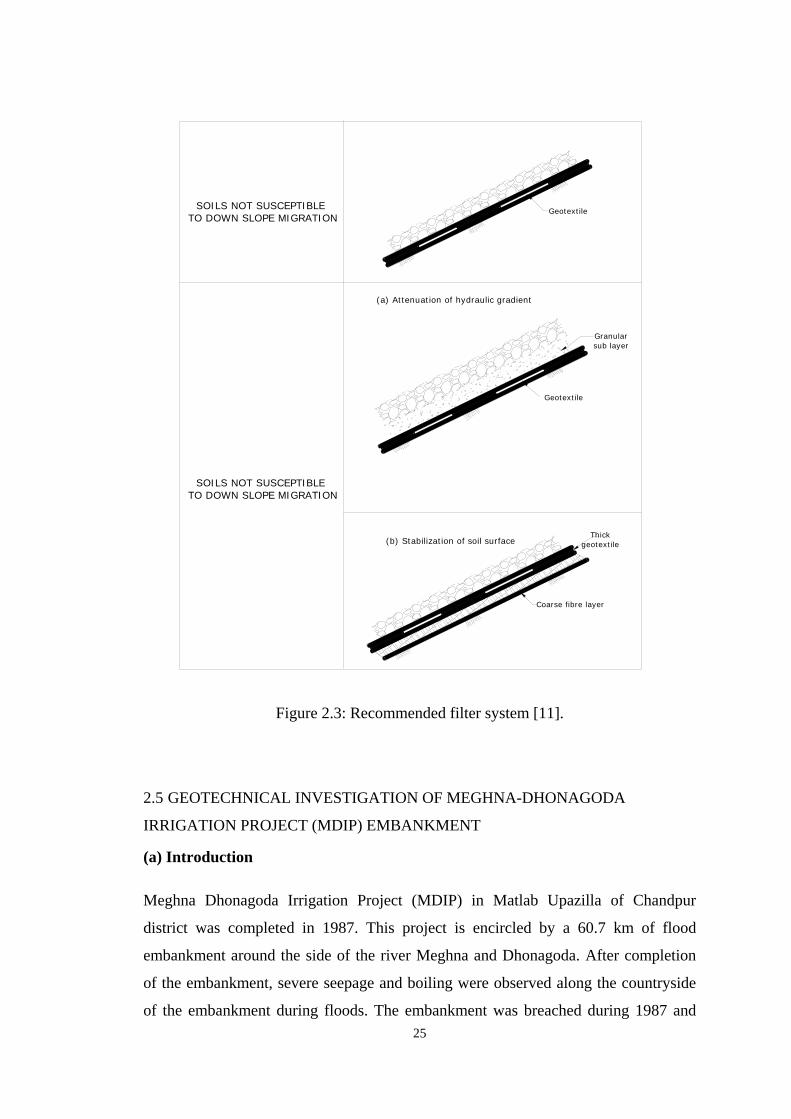
(a) Attenuation of the Hydraulic Gradient
This can be achieved by incorporating a granular sub-layer between the geo-textile
and the cover layer. In practice the granular material should be fine enough to provide
an adequate damping effect yet coarse enough to be retained by the cover layer. The
24
sub-layer should have a thickness of between 100 mm and 500 mm for the conditions
given at the beginning of this section 300 mm has been found to be adequate.
(b) Stabilization of the Soil Surface
Experience has shown that a thick layer of coarse fibers attached to the back of the
geo-textile filter integrates with the soil surface, thus reducing down-slope migration
of soil particles within this layer.
The physical requirements of this layer are dependent upon the range of the soil
grading are given in Table 2.1.
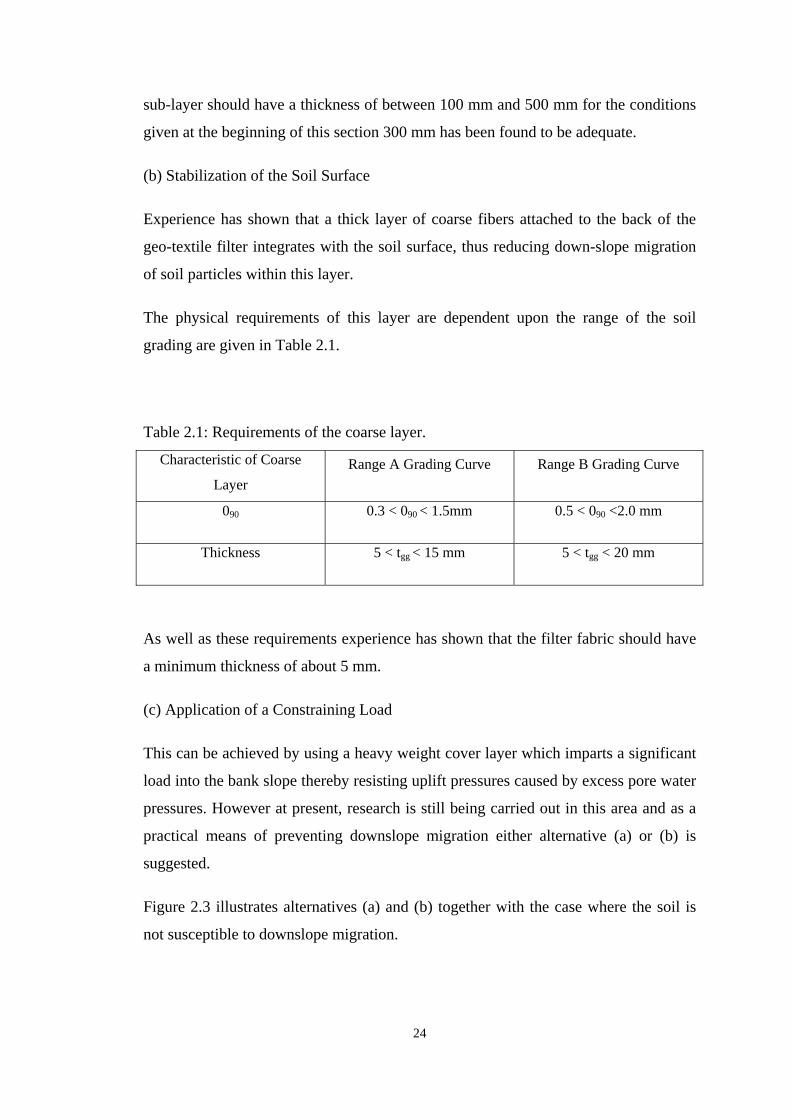
Table 2.1: Requirements of the coarse layer.
Characteristic of Coarse
Layer Range A Grading Curve Range B Grading Curve
090 0.3 < 090 < 1.5mm 0.5 < 090 <2.0 mm
Thickness 5 < tgg < 15 mm 5 < tgg < 20 mm
As well as these requirements experience has shown that the filter fabric should have
a minimum thickness of about 5 mm.
(c) Application of a Constraining Load
This can be achieved by using a heavy weight cover layer which imparts a significant
load into the bank slope thereby resisting uplift pressures caused by excess pore water
pressures. However at present, research is still being carried out in this area and as a
practical means of preventing downslope migration either alternative (a) or (b) is
suggested.
Figure 2.3 illustrates alternatives (a) and (b) together with the case where the soil is
not susceptible to downslope migration.
25
Geotextile
Geotextile
Granularsub layer
Coarse fibre layer
Thickgeotextile
SOILS NOT SUSCEPTIBLE TO DOWN SLOPE MIGRATION
SOILS NOT SUSCEPTIBLE TO DOWN SLOPE MIGRATION
(b) Stabilization of soil surface
(a) Attenuation of hydraulic gradient
Figure 2.3: Recommended filter system [11].
2.5 GEOTECHNICAL INVESTIGATION OF MEGHNA-DHONAGODA
IRRIGATION PROJECT (MDIP) EMBANKMENT
(a) Introduction
Meghna Dhonagoda Irrigation Project (MDIP) in Matlab Upazilla of Chandpur
district was completed in 1987. This project is encircled by a 60.7 km of flood
embankment around the side of the river Meghna and Dhonagoda. After completion
of the embankment, severe seepage and boiling were observed along the countryside
of the embankment during floods. The embankment was breached during 1987 and
26
1988 floods causing severe damages. During the floods of 2004, a breach at
Nandalalpur occurred but no damage could be caused as the BWDB authorities
repaired the breach quickly with the help of local people. Furthermore, sliding of the
slope of embankments occurred on the countryside at about 60 places, seepage
problems developed at about 25 km length and boiling occurred at about 120
locations. The damages were severe and it remained as a threat to future performance
of the embankment during floods.
(b) Observed Distresses in the Embankment
Four major types of failure/damage in the embankment due to 2004 flood were
observed:
• Blowout of the upper soil on the countryside close to the embankment due
to uplift pressure transferred through the sand layer.
• Initiation of boiling through a sandy channel with progressive removal of
sand creating a tunnel that finally enlarged and sometimes creating breach
in the embankment.
• Erosion of soil from toe of the embankment due to seepage creating
instability at the toe and resulting in slides on the country side, and
• Rain cuts and washout or removal of sandy soil within the embankment
damaging the embankment sections.
(c) Subsoil Exploration
A detailed soil investigation was carried out on the sub-soil at the embankment site.
The soil investigation was conducted with the following principal objectives:
• Identification and classification of the foundation soil.
• Determination of stratigraphic sequences of sub-soil strata by drilling
boreholes to adequate depths.
27
• Evaluation of consistency and relative density of the sub-soil by carrying
out specific in-situ test, and
• Assessment of strength, compressibility, expansibility and permeability
properties of the sub-soil from laboratory testing.
The field investigation at the embankment site consisted of drilling of boreholes,
recording density/stiffness characteristics of soil layers by carrying out Standard
Penetration Tests (SPT), collection of sufficient numbers of disturbed and undisturbed
tube samples. Also portable seismograph was used to support the result obtained from
SPT-N values. A total of fifty six boreholes at eleven sites were drilled vertically at
this site using wash boring technique.
The depth of boreholes below the ground surface varied from 32 ft to 52 ft. In general
five boreholes (BH-1, BH-2, BH-3, BH-4 and BH-5) were drilled at each site across
an embankment section. The chainage-wise borehole sites and locations are presented
in Figure 2.4.

28
Nabipur
BeltoliKm 30
Beltoli
Kalipurpump House
Km 35
Lalpur
SatnalKm 40
Sanger Char
Mohanpur
Km 45 Dubgipump House
Ekhlaspurpump House
10 11
Km 50
Kaligastala
Km 55
Nishankhola
pump HouseUdumdi
Km 61 Km 1
Km 5
Km 10
Km 15
Nandalalpur
Km 20
Galimkhan
Taltali
Km 25
1 2
3
4 5
6 7
9 8
N
Figure 2.4: Location of boreholes marked by circles and distress areas are marked by
numbers in the MDIP.
(e) Findings of BRTC, BUET about the problems in MDIP
Based on subsoil investigation data and their analyses, they concluded that the
embankment and the foundation soil of MDIP embankment mainly consists of alluvial
silty sand. This type of soil is prone to distress especially when used in earthen
embankment. During the recent floods, especially in 2004, the embankment was
29
under tremendous threat to breach. The post flood observation of the sites revealed
that the vulnerability of the embankment was primarily because of water seepage
through the embankment, especially through the foundation soil. This allowed the
finer particles to migrate through the interconnecting voids thus forming an effective
water channel within the soil mass and resulted in boiling at several locations.
From field SPT values and empirical correlations, the relative density of the
embankment and foundation soil was estimated to be in the range of 20% to 55%.
From direct shear test, apparent cohesion was found to be small, a maximum value of
16 kN/m2 was obtained. The values of internal angle of friction of the soils were found
to be in the range of 27o and 36o (void ratio 0.81 to 1.13 i.e. porosity 0.45 to 0.53).
constant head permeability test was carried out using a special constant head
permeameter. In these tests the boiling phenomenon was also simulated for the field
conditions. The laboratory determined permeability was of the order of 3x10⁻³ m/s
which agreed reasonably well with those estimated using well known Allen Hazen’s
empirical formula.
2.6 CAUSES OF EROSION OF POLDER EMBANKMENT
Earth embankments in Bangladesh are beset with multi-facetted problems. The design
and construction methods used to build embankments, the nature and extent of erosive
forces to destabilize them and above all the attitude of the local people for whom they
are built altogether determine the magnitude and degree of instability.
Most earth embankments face light to moderate erosion problems arising out of
rainfall splash, animal action and nature of human uses. Some of the critically
positioned submerged types of embankment in haor areas of the eastern part and river
embankments of the main land are subjected to turbulent water currents and changes
in river courses. The problem is acute in offshore islands and coastal belts where the
embankments are in addition exposed to erosion by sea waves and tidal fluctuation of
water levels.
In the coastal belts and offshore islands, severe bank erosion problems occur
frequently. New accretion and shifting of the bank line due to erosion happen all most
30
in the same way as those observed in the inland rivers. However the nature and extent
of erosive forces damaging the seashore and successively the dykes differ in certain
aspects from those of the inland riverbanks.
The process of erosion gradually destroys the shore lands, river banks, foreshore areas
and successively the earthen embankments engulfing the plain agricultural lands,
habitant and many important installations. In the affected reaches, the embankments
built with adequate setback are found to disappear within a year or two of the start of
erosion. Generally new embankments are constructed along separate alignments
(further back in the country side), simultaneously adopting sufficient measure to
check the bank erosion. Whenever the situation compels to protect the high-value
assets and important installations as the losses are really irreparable or would have a
great impact on the national economy, sophisticated structural means of proven
structural solutions involving huge costs are adopted to combat the erosive forces.
Thus erosion creates a double disaster – erosion of resources from where it is mostly
wanted and simultaneous accumulation where it is unwanted.
The most common causes are natural forces and human interference.
2.6.1 Natural Forces
The natural forces cause erosion of the embankments in the following ways:
Rainfall impact: Mean annual rainfall varies from about 1500 mm in the southwest
(Khulna district) to over 3570 mm in the southeast (Cox’s Bazar). The heaviest
rainfall occurs in July and ranges from 350 mm to over 875 mm accordingly. The
slope erosion caused by rain runoff is enormous and its speed/force grows
exponentially towards the toe. Toe erosion is the combined effect of runoff and wave
action. The main features of rainfall impact are:
• The embankment crest is mainly affected with the formation of gullies
and initiation of piping action leading to collapses in combination with
either.
31
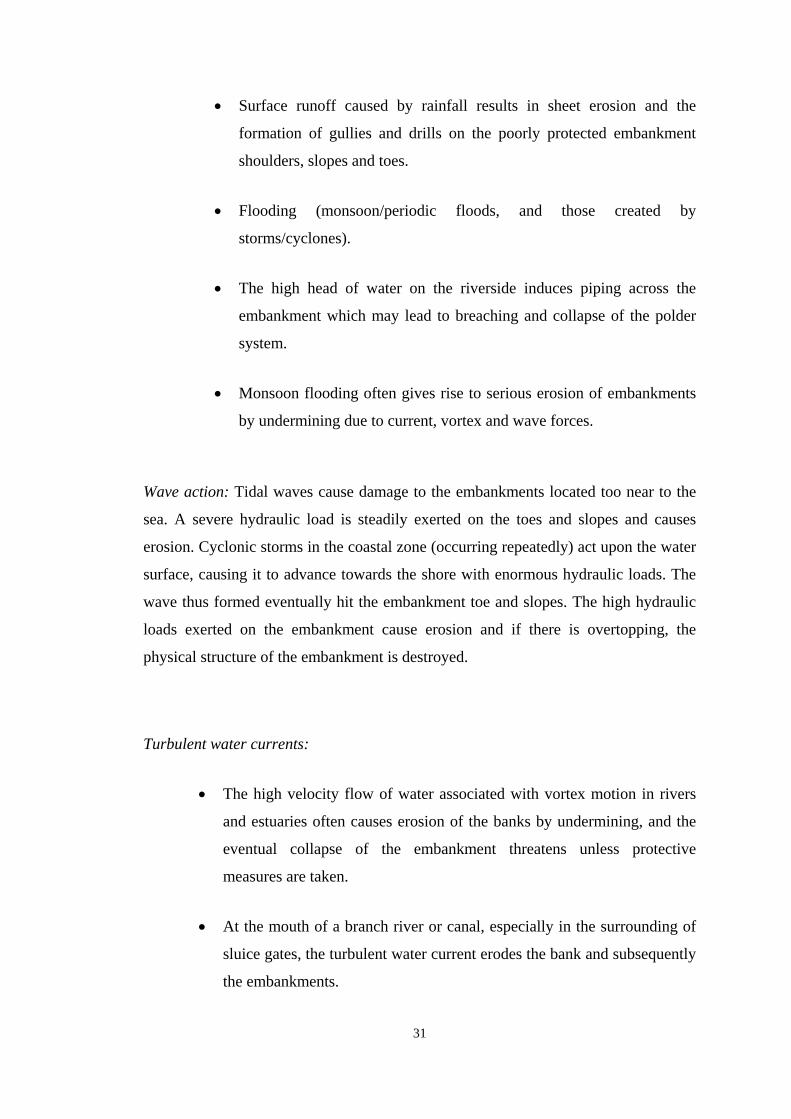
• Surface runoff caused by rainfall results in sheet erosion and the
formation of gullies and drills on the poorly protected embankment
shoulders, slopes and toes.
• Flooding (monsoon/periodic floods, and those created by
storms/cyclones).
• The high head of water on the riverside induces piping across the
embankment which may lead to breaching and collapse of the polder
system.
• Monsoon flooding often gives rise to serious erosion of embankments
by undermining due to current, vortex and wave forces.
Wave action: Tidal waves cause damage to the embankments located too near to the
sea. A severe hydraulic load is steadily exerted on the toes and slopes and causes
erosion. Cyclonic storms in the coastal zone (occurring repeatedly) act upon the water
surface, causing it to advance towards the shore with enormous hydraulic loads. The
wave thus formed eventually hit the embankment toe and slopes. The high hydraulic
loads exerted on the embankment cause erosion and if there is overtopping, the
physical structure of the embankment is destroyed.
Turbulent water currents:
• The high velocity flow of water associated with vortex motion in rivers
and estuaries often causes erosion of the banks by undermining, and the
eventual collapse of the embankment threatens unless protective
measures are taken.
• At the mouth of a branch river or canal, especially in the surrounding of
sluice gates, the turbulent water current erodes the bank and subsequently
the embankments.
32
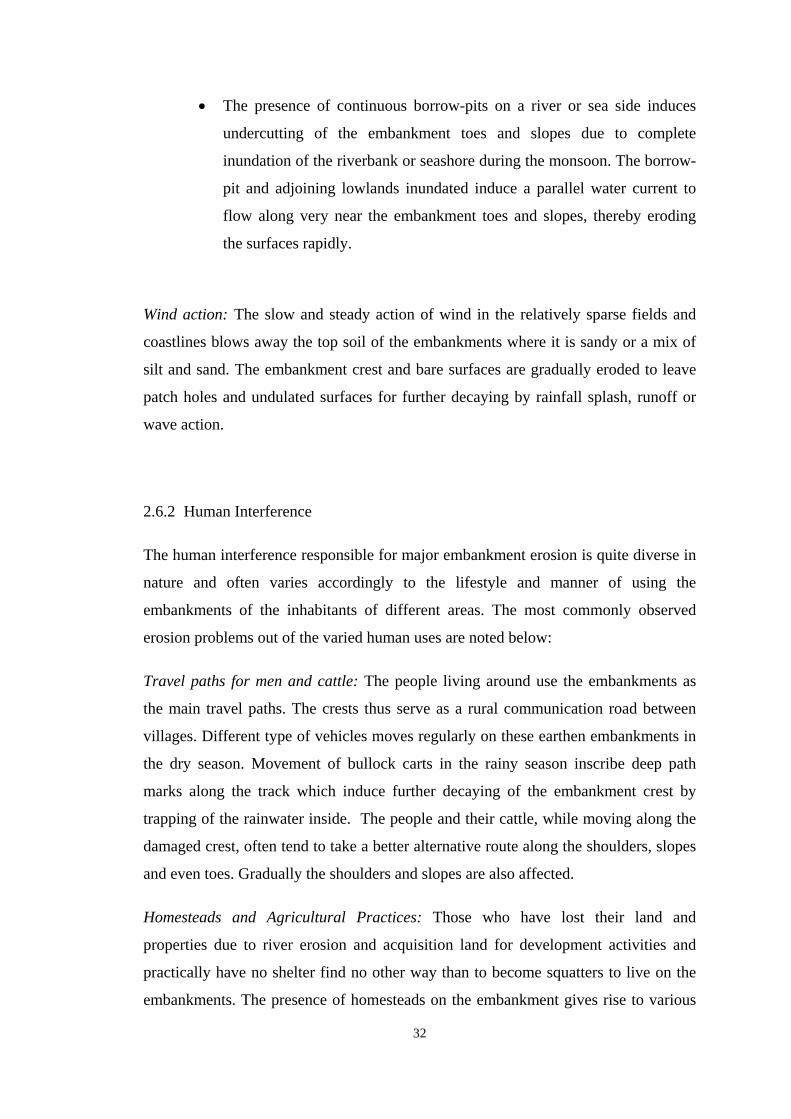
• The presence of continuous borrow-pits on a river or sea side induces
undercutting of the embankment toes and slopes due to complete
inundation of the riverbank or seashore during the monsoon. The borrow-
pit and adjoining lowlands inundated induce a parallel water current to
flow along very near the embankment toes and slopes, thereby eroding
the surfaces rapidly.
Wind action: The slow and steady action of wind in the relatively sparse fields and
coastlines blows away the top soil of the embankments where it is sandy or a mix of
silt and sand. The embankment crest and bare surfaces are gradually eroded to leave
patch holes and undulated surfaces for further decaying by rainfall splash, runoff or
wave action.
2.6.2 Human Interference
The human interference responsible for major embankment erosion is quite diverse in
nature and often varies accordingly to the lifestyle and manner of using the
embankments of the inhabitants of different areas. The most commonly observed
erosion problems out of the varied human uses are noted below:
Travel paths for men and cattle: The people living around use the embankments as
the main travel paths. The crests thus serve as a rural communication road between
villages. Different type of vehicles moves regularly on these earthen embankments in
the dry season. Movement of bullock carts in the rainy season inscribe deep path
marks along the track which induce further decaying of the embankment crest by
trapping of the rainwater inside. The people and their cattle, while moving along the
damaged crest, often tend to take a better alternative route along the shoulders, slopes
and even toes. Gradually the shoulders and slopes are also affected.
Homesteads and Agricultural Practices: Those who have lost their land and
properties due to river erosion and acquisition land for development activities and
practically have no shelter find no other way than to become squatters to live on the
embankments. The presence of homesteads on the embankment gives rise to various

33
other associated uses, including raising agricultural produce for subsistence and
intensive cattle grazing. By loosening the soil and denuding it, repeated soil tillage
results in severe erosion.
Cattle Grazing: Cattle, mainly belonging to people living on the embankment, cause
erosion by uncontrolled browsing of natural grasses. When the embankment is
overgrazed plant species and the vegetative cover, especially the grasses, show
retarded growth, weaken and cannot continue to ensure adequate protection of the
embankment. The squatters, most of them are poor and landless, prefer to keep goats
as pet animals with their limited scope at the embankment homesteads. The grazing of
goats is particularly harmful to the vegetative cover.
Public cuts: Public cuts and tubes linking a river or seaside with the countryside of its
embankment are frequently observed. These cuts weaken the embankments, exposing
them to slow but continual erosive forces. During flood or cyclone storm, breaching
or major erosion occurs at those points. The people mainly cut the embankment to
fulfill their purposes:
• To get rid of poor and inadequate drainage condition of the existing structures,
they arrange quick removal of excess floodwater from the polder area to the
river or the sea. This is failure of the planning and design end not to take care
of this problem appropriately.
• They create temporary irrigation inlets for applying sweet river water to the
copping fields when there are prolonged droughts in the polder area. This
problem arises due to a need of adequate people participation during planning
and design of the embankment.
• For short-term economic purposes yielding individual-level benefits,
sometimes people allow river or seawater to penetrate inside the polder for
shrimp cultivation or any other fishing requirement or salt planning.
Unplanned afforestation of embankment slopes: Afforestation without appropriate
planning and management techniques destroys the undergrowth grass cover and
34
becomes ineffective for erosion protection. In such cases, afforestation results in the
weakening of the embankment without any substantial contribution to its ability.
2.7 CAUSES OF FAILURE OF EARTH FILL EMBANKMENTS
Failures of earthen embankment dams or dikes can generally be grouped into three
classifications: hydraulic, seepage and structural.
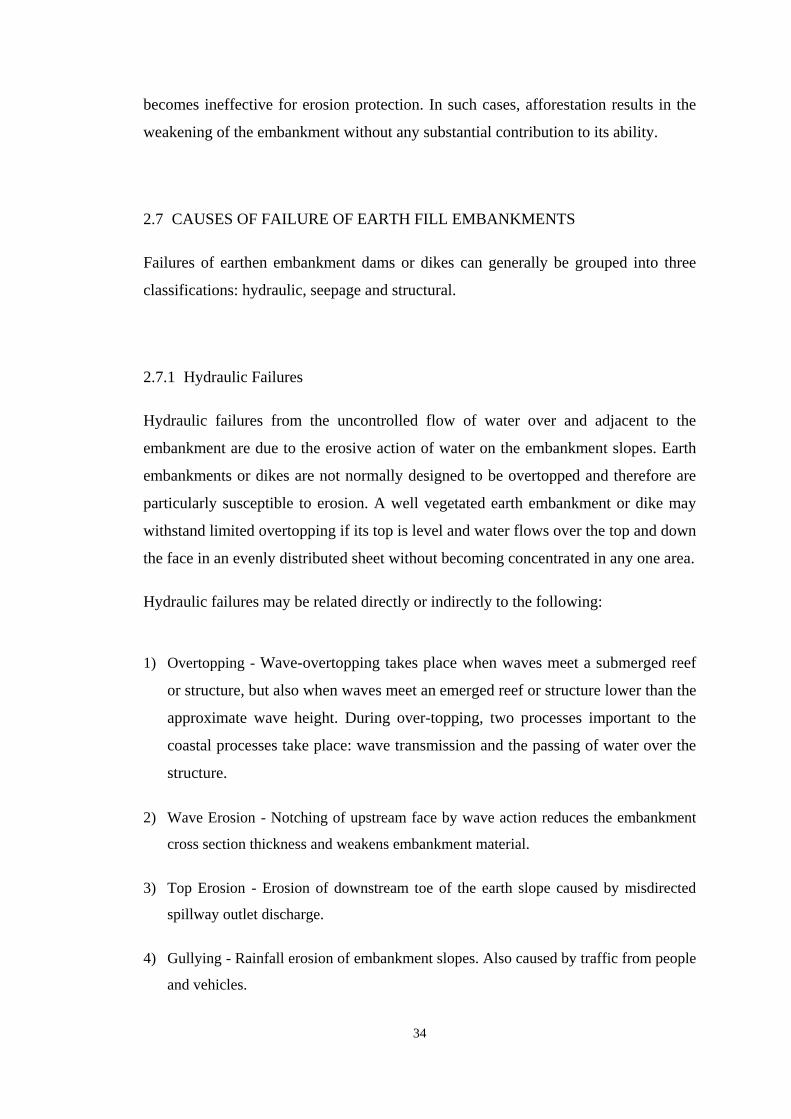
2.7.1 Hydraulic Failures
Hydraulic failures from the uncontrolled flow of water over and adjacent to the
embankment are due to the erosive action of water on the embankment slopes. Earth
embankments or dikes are not normally designed to be overtopped and therefore are
particularly susceptible to erosion. A well vegetated earth embankment or dike may
withstand limited overtopping if its top is level and water flows over the top and down
the face in an evenly distributed sheet without becoming concentrated in any one area.
Hydraulic failures may be related directly or indirectly to the following:
1) Overtopping - Wave-overtopping takes place when waves meet a submerged reef
or structure, but also when waves meet an emerged reef or structure lower than the
approximate wave height. During over-topping, two processes important to the
coastal processes take place: wave transmission and the passing of water over the
structure.
2) Wave Erosion - Notching of upstream face by wave action reduces the embankment
cross section thickness and weakens embankment material.
3) Top Erosion - Erosion of downstream toe of the earth slope caused by misdirected
spillway outlet discharge.
4) Gullying - Rainfall erosion of embankment slopes. Also caused by traffic from people
and vehicles.
35
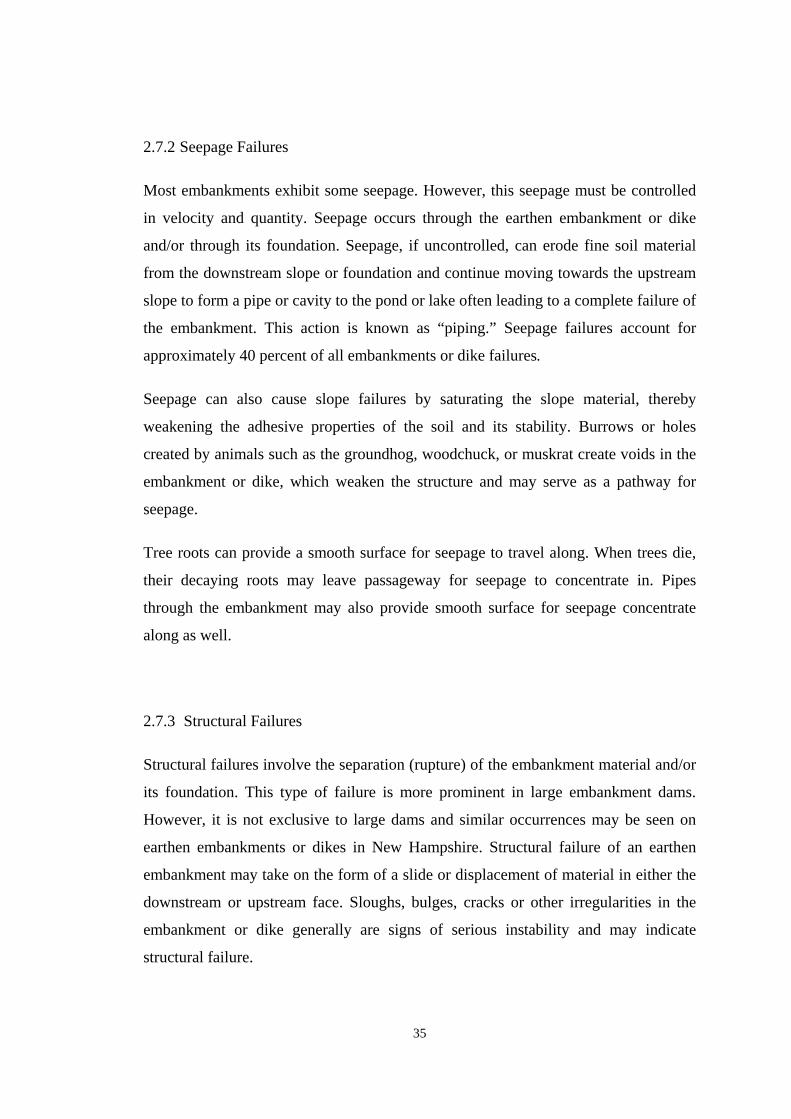
2.7.2 Seepage Failures
Most embankments exhibit some seepage. However, this seepage must be controlled
in velocity and quantity. Seepage occurs through the earthen embankment or dike
and/or through its foundation. Seepage, if uncontrolled, can erode fine soil material
from the downstream slope or foundation and continue moving towards the upstream
slope to form a pipe or cavity to the pond or lake often leading to a complete failure of
the embankment. This action is known as “piping.” Seepage failures account for
approximately 40 percent of all embankments or dike failures.
Seepage can also cause slope failures by saturating the slope material, thereby
weakening the adhesive properties of the soil and its stability. Burrows or holes
created by animals such as the groundhog, woodchuck, or muskrat create voids in the
embankment or dike, which weaken the structure and may serve as a pathway for
seepage.
Tree roots can provide a smooth surface for seepage to travel along. When trees die,
their decaying roots may leave passageway for seepage to concentrate in. Pipes
through the embankment may also provide smooth surface for seepage concentrate
along as well.
2.7.3 Structural Failures
Structural failures involve the separation (rupture) of the embankment material and/or
its foundation. This type of failure is more prominent in large embankment dams.
However, it is not exclusive to large dams and similar occurrences may be seen on
earthen embankments or dikes in New Hampshire. Structural failure of an earthen
embankment may take on the form of a slide or displacement of material in either the
downstream or upstream face. Sloughs, bulges, cracks or other irregularities in the
embankment or dike generally are signs of serious instability and may indicate
structural failure.
36
2.7.4 Other
Tree growth on an earthen embankment or dike can be a contributing factor in the
failure of an earthen structure and part of any one of the three previously described
type of failures. Tree growth directly on the crest or top of the structure could lead to
a hydraulic failure should the tree be blown over. This may displace embankment
material within the root ball creating a low area susceptible to flows from the
impoundment. Tree root systems may also create seepage paths through an earthen
embankment or dike and structural failure of an upstream or downstream slope could
occur with the displacement of a large tree implanted within the earth slope.
37
CHAPTER 3 : TEST PROGRAM
3.1 GENERAL
Damaged embankment of polder no. 14/1 at Patakhali, Dakkhin Betkashi, Koyra
under the district of Khulna was selected as the study area for this project.
Reconstruction of two closures at Patakhali and Padmapukur was going on in full
swing at that time. Sufficient amount of bulk samples were collected from the study
area. Determination of SPT and sample collection was done at two locations: one at
the damaged part of the old embankment and the other is at the proposed construction
area near Patakhali closure. Laboratory tests were performed at the Geotechnical
Laboratory of Civil Engineering Department of Bangladesh University of Engineering
and Technology (BUET) to find index properties, double hydrometer ratio, Standard
Proctor Density and optimum moisture content.
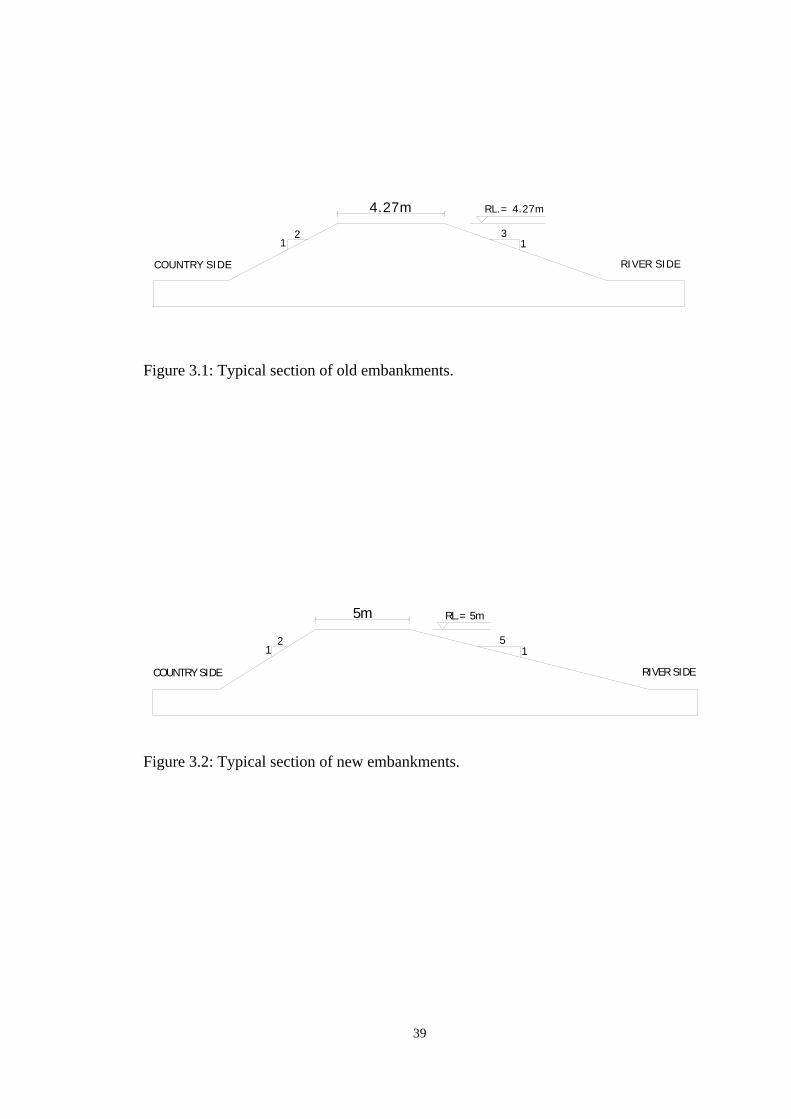
3.2 POLDER EMBANKMENT SECTION
Existing polder embankment section was measured during site visit. A typical section
of old embankments is shown in Figure 3.1. A typical section of new embankment
was collected from BWDB engineers and shown in Figure 3.2.
3.3 FIELD TESTS
Two points at the site of proposed closure were selected for collecting soil sample and
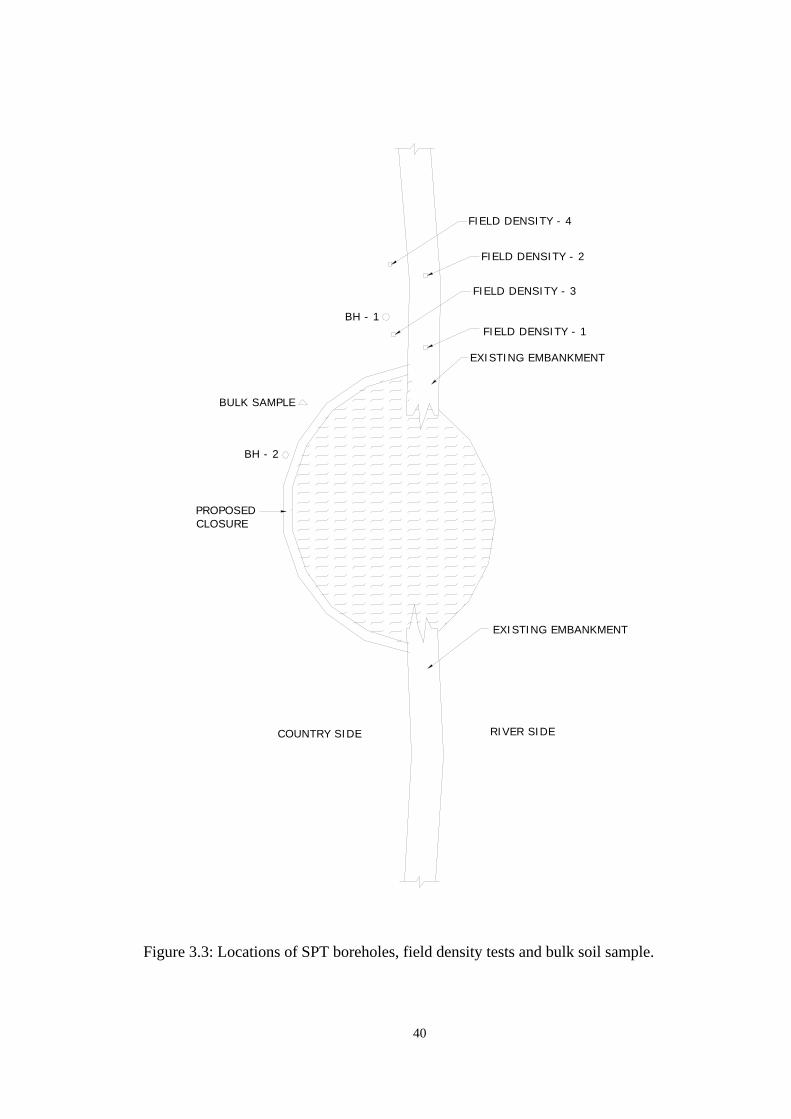
field tests. The bore hole locations and bulk sample location are shown in Figure 3.3.
It is a very remote area near Sundarbans and very difficult to reach. So, all the field
works were completed in one tour. Field density, SPT values and collection of
samples were the main tasks which were performed at the site.
38
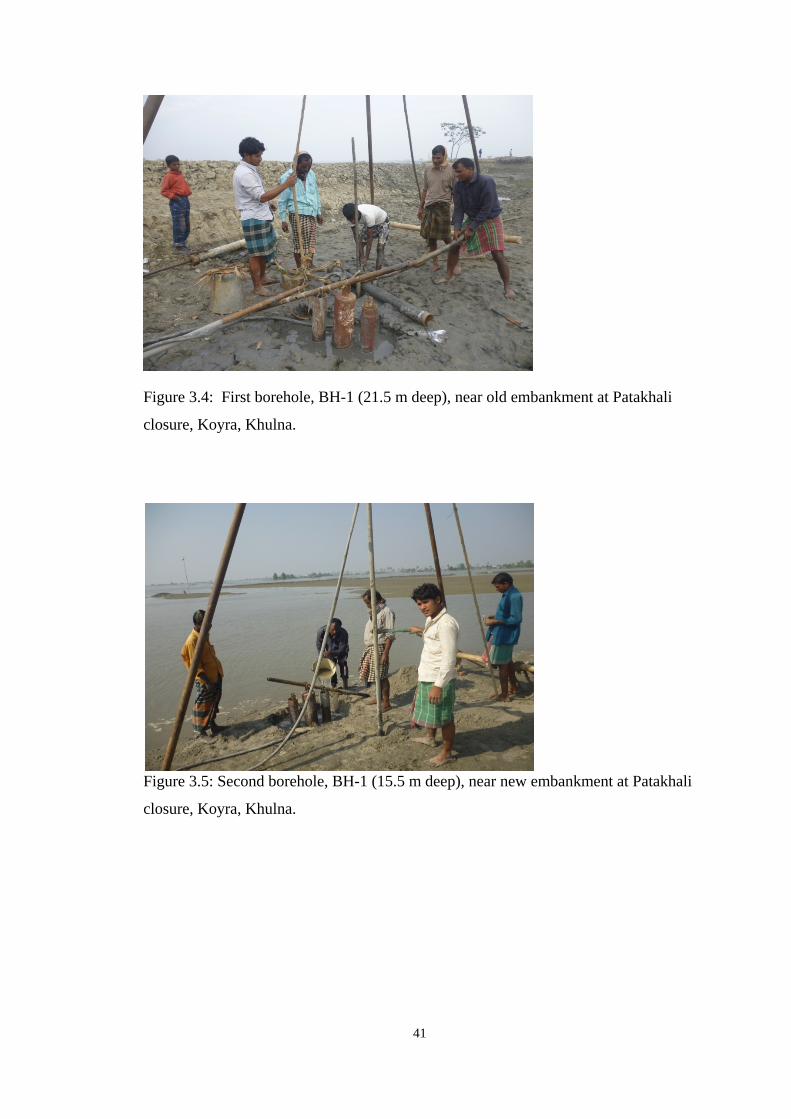
SPT values of the sub-soil strata were collected from both old (damaged) and new
(proposed) embankment area. A 21.5m deep boring was dug at the old embankment
(shown in Figure 3.4) and SPT for every 1.5 m interval was recorded. Samples, at the
same interval, for laboratory tests were collected carefully and preserved. Undisturbed
samples at every 3m depth were tried to collect by inserting Shelby tube but it was not
possible to collect any undisturbed Shelby tube sample. Because the soil throughout
the depth was soft grey lean clay, non-plastic silt, silt with sand and sandy silt. On the
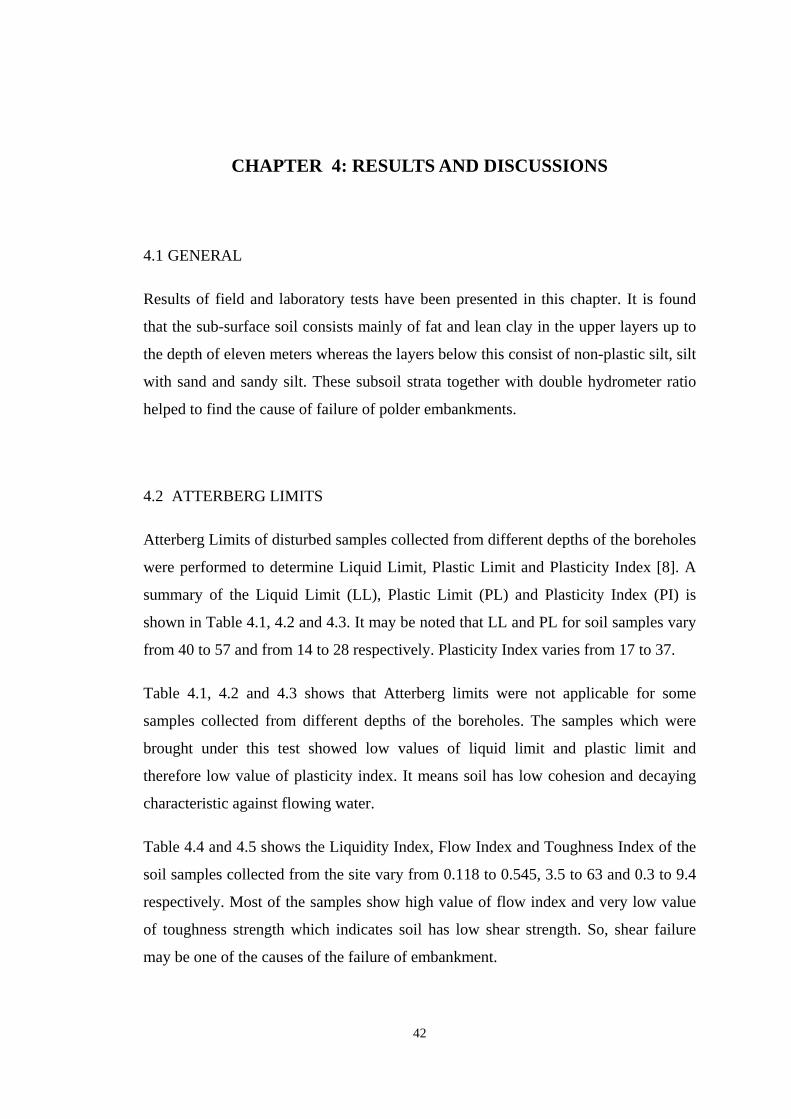
other hand, a 15.5 m boring was done at the new embankment area (shown in Figure
3.5). SPT values at 1.5 m intervals were recorded and disturbed samples for lab test
were collected. Like the first boring it was not possible to collect any undisturbed
sample from this borehole. Here the soil was lean clay, silt with sand and sandy silt.
Approximately 15 kg bulk sample (see Figure 3.3) was collected from adjacent to
closure area at 1.5 m depth by manually excavating top soil. Two in-situ field density
test using sand cone method were performed; one on the top of the existing
embankment and another at the toe of the existing embankment (see Figure 3.3).
3.4 LABORATORY TESTS
A detailed laboratory investigation was carried out on soil samples collected from the
boreholes drilled at the site. All samples were taken to Geotechnical Laboratory of
BUET to perform Atterberg Limits, Specific Gravity Test, Sieve Analysis,
Hydrometer Analysis, Standard Proctor Compaction Test, and Double Hydrometer
Ratio Test.
The Double Hydrometer Ratio Test also known as Soil Conservation Service
Laboratory Dispersion Test was performed to identify the dispersiveness of soil. The
particle size distribution of the soil is first determined using the standard hydrometer
test where the soil is dispersed in distilled water with chemical dispersant. A parallel
hydrometer test is then made on a same soil specimen but without a chemical
dispersant. The percent dispersion is the ratio of the dry mass of particles smaller than
0.005mm diameter of the second test to the first expressed as a percentage.
39
COUNTRY SIDE RIVER SIDE
RL.= 4.27m
21
31
4.27m
Figure 3.1: Typical section of old embankments.
COUNTRY SIDE RIVER SIDE
RL.= 5m
21
51
5m
Figure 3.2: Typical section of new embankments.
40
EXISTING EMBANKMENT
EXISTING EMBANKMENT
FIELD DENSITY - 1
FIELD DENSITY - 3
BH - 1
BH - 2
BULK SAMPLE
PROPOSEDCLOSURE
FIELD DENSITY - 4
FIELD DENSITY - 2
RIVER SIDECOUNTRY SIDE
Figure 3.3: Locations of SPT boreholes, field density tests and bulk soil sample.
41
Figure 3.4: First borehole, BH-1 (21.5 m deep), near old embankment at Patakhali
closure, Koyra, Khulna.
Figure 3.5: Second borehole, BH-1 (15.5 m deep), near new embankment at Patakhali
closure, Koyra, Khulna.
42
CHAPTER 4: RESULTS AND DISCUSSIONS
4.1 GENERAL
Results of field and laboratory tests have been presented in this chapter. It is found
that the sub-surface soil consists mainly of fat and lean clay in the upper layers up to
the depth of eleven meters whereas the layers below this consist of non-plastic silt, silt
with sand and sandy silt. These subsoil strata together with double hydrometer ratio
helped to find the cause of failure of polder embankments.
4.2 ATTERBERG LIMITS
Atterberg Limits of disturbed samples collected from different depths of the boreholes
were performed to determine Liquid Limit, Plastic Limit and Plasticity Index [8]. A
summary of the Liquid Limit (LL), Plastic Limit (PL) and Plasticity Index (PI) is
shown in Table 4.1, 4.2 and 4.3. It may be noted that LL and PL for soil samples vary
from 40 to 57 and from 14 to 28 respectively. Plasticity Index varies from 17 to 37.
Table 4.1, 4.2 and 4.3 shows that Atterberg limits were not applicable for some
samples collected from different depths of the boreholes. The samples which were
brought under this test showed low values of liquid limit and plastic limit and
therefore low value of plasticity index. It means soil has low cohesion and decaying
characteristic against flowing water.
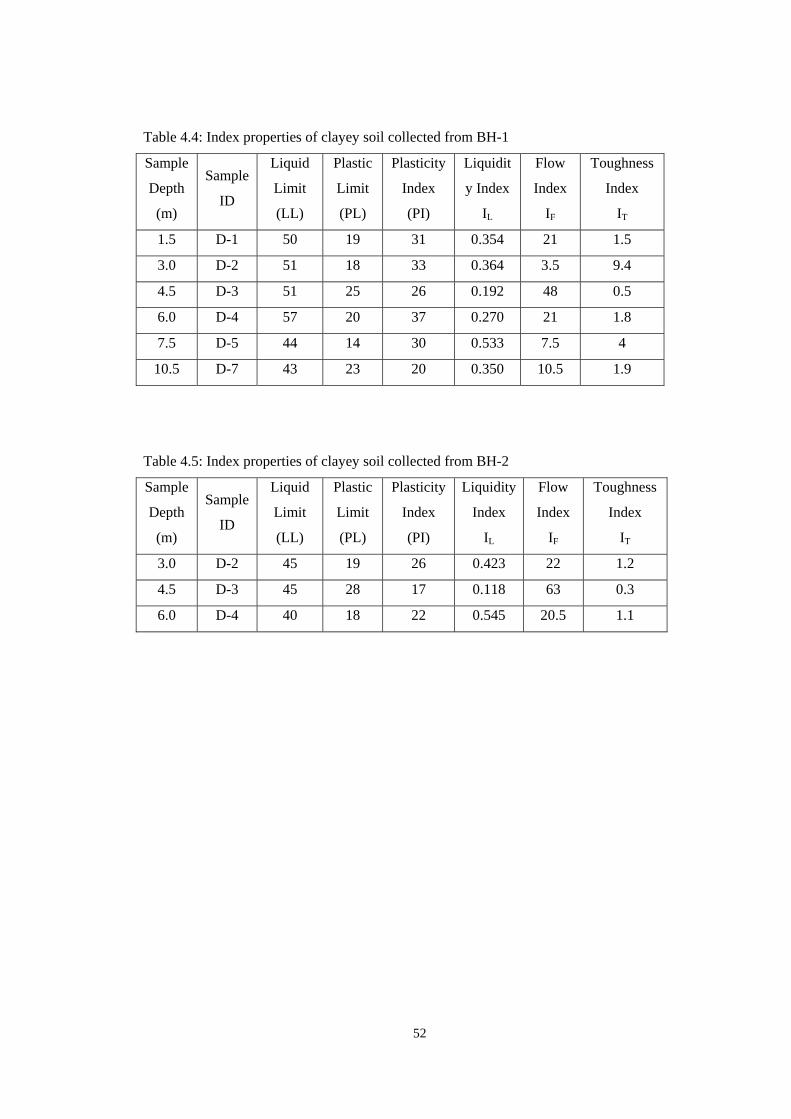
Table 4.4 and 4.5 shows the Liquidity Index, Flow Index and Toughness Index of the
soil samples collected from the site vary from 0.118 to 0.545, 3.5 to 63 and 0.3 to 9.4
respectively. Most of the samples show high value of flow index and very low value
of toughness strength which indicates soil has low shear strength. So, shear failure
may be one of the causes of the failure of embankment.
43
4.3 GRAIN SIZE DISTRIBUTION
Wet Sieving method of sieve analysis was performed on 23 soil samples collected
from two boreholes as per [9] in order to determine the grain size distribution of the
collected soil samples at different depths. Percentage of sand fraction is shown in
Table 4.1, 4.2 and 4.3. It may be noted that percent sand ranges from 0 to 49.6. Below
7.5 m depth of BH-2 which is adjacent to closure, have more percentages of sand than
that of BH-1. This might be the one reason why it was very difficult to construct the
closure in several attempts.
4.4 USCS CLASSIFICATION OF SOIL SAMPLES
For classification of the soil samples Unified Soil Classification System [8] was used.
Tables 4.1, 4.2 and 4.3 show the USCS classification of soils. At old embankment
area sub soil layers consist of lean clay and non-plastic silt whereas lean clay, silt with
sand and sandy silt dominates in the layers of soil at the new embankment area. Bulk
sample collected from the surface is classified as lean clay.
According to above classification it is seen that soil forming the sub-soil strata
consists of lean clay, non-plastic silt and silt with sand which are very weak against
flowing water. This is why it is very difficult to repair any broken embankment
against tidal flow and rapid draw down during ebb-tide which easily washes away soil
particles.
4.5 IDENTIFICATION OF SOILS SUSCEPTIBLE TO DOWNSLOPE
MIGRATION
The problem of downslope migration is most apparent in silts, sandy silts and fine
sands. The minor cohesive properties of these types of soils tend to encourage high
mobility of small single grains at relatively low hydraulic gradients [11].
The distinction between soils susceptible to downslope migration and those not
susceptible is related to grain size, permeability and degree of cohesion.
44
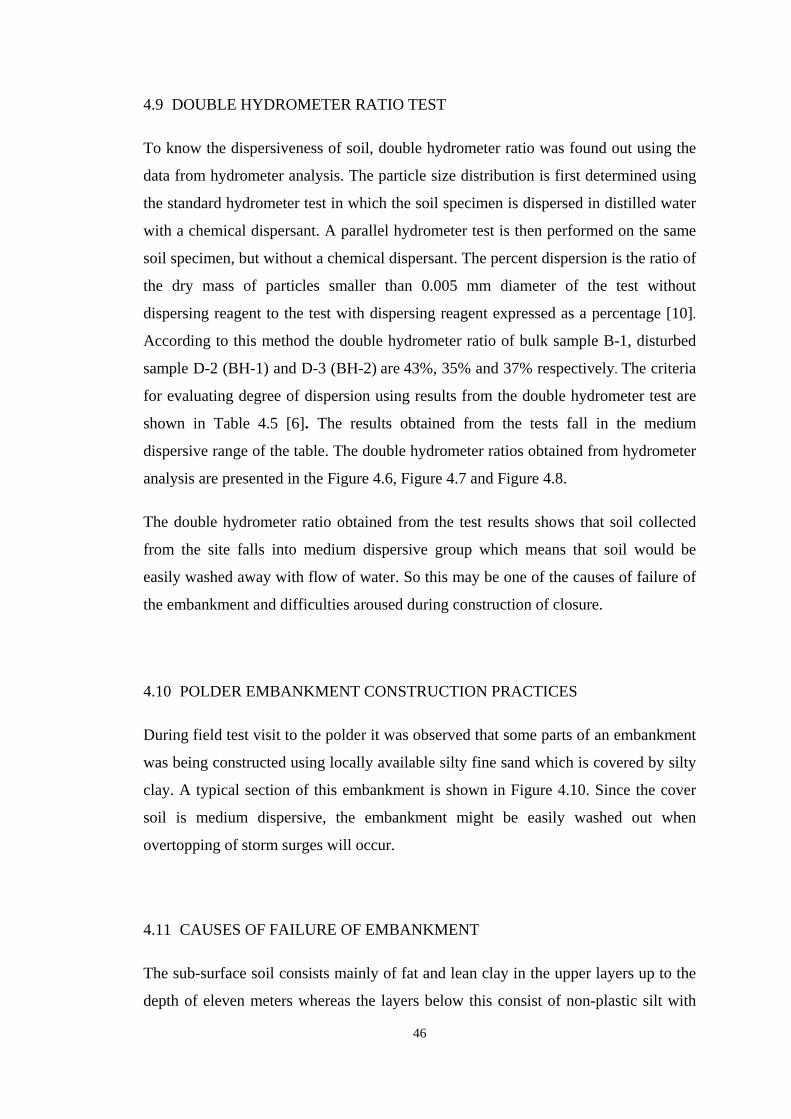
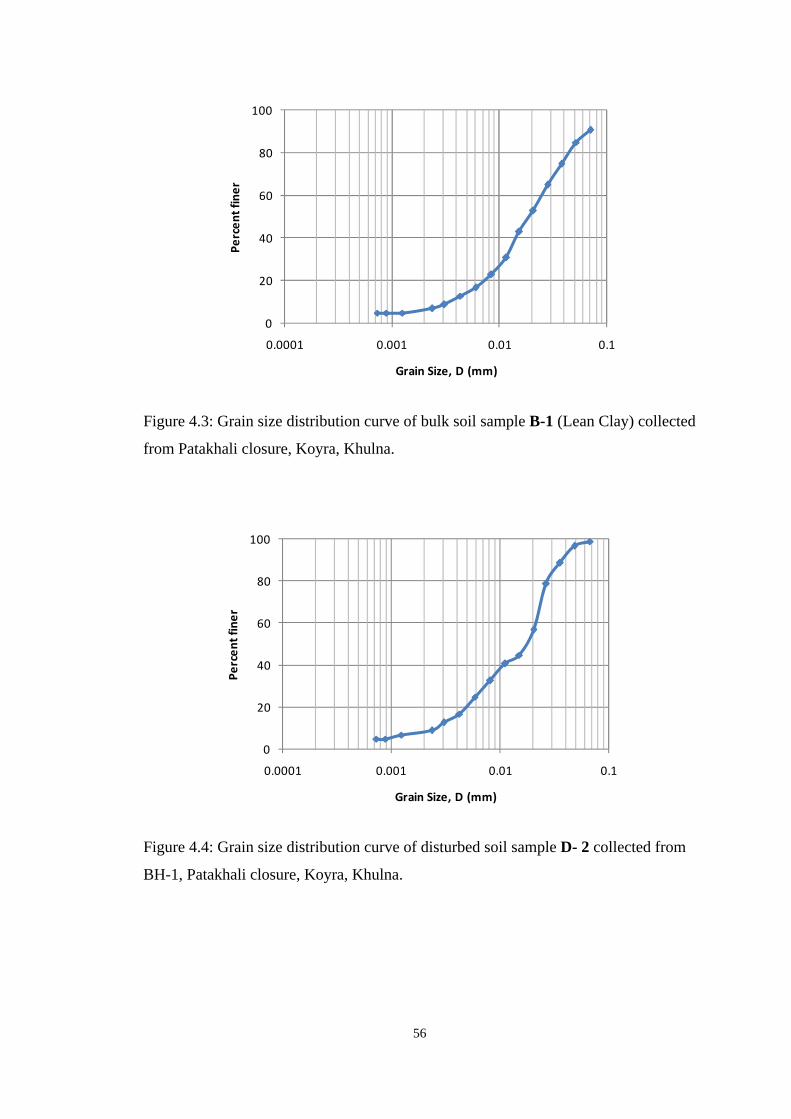
In most of samples shown in the figures (Figure 4.3, Figure 4.4 and Figure 4.5) it is
seen that 85 % of the soil particles have diameter smaller than 0.06 mm. That means it
satisfies the susceptibility of downslope migration as per PIANC [11].
Additionally, the coefficient of uniformity of the soil samples calculated from the
above mentioned graphs are 7.2, 7.8 and 6.8 respectively, all of which are
significantly below the upper limit 15. This criteria of downslope migration
susceptibility is also satisfied by the embankment and subsoil. An average of 40% of
the particles lies in the range 0.02 mm < d < 0.10 mm, which does not satisfy the
criteria of downslope migration susceptibility. Plasticity Index of the collected
samples from embankment and subsoil under embankment was found to be greater
than 15 which satisfy the criteria of downslope migration susceptibility of soil.
Considering all these criteria and soil properties, it can be concluded that embankment
soil and subsoil are susceptible to downslope migration.
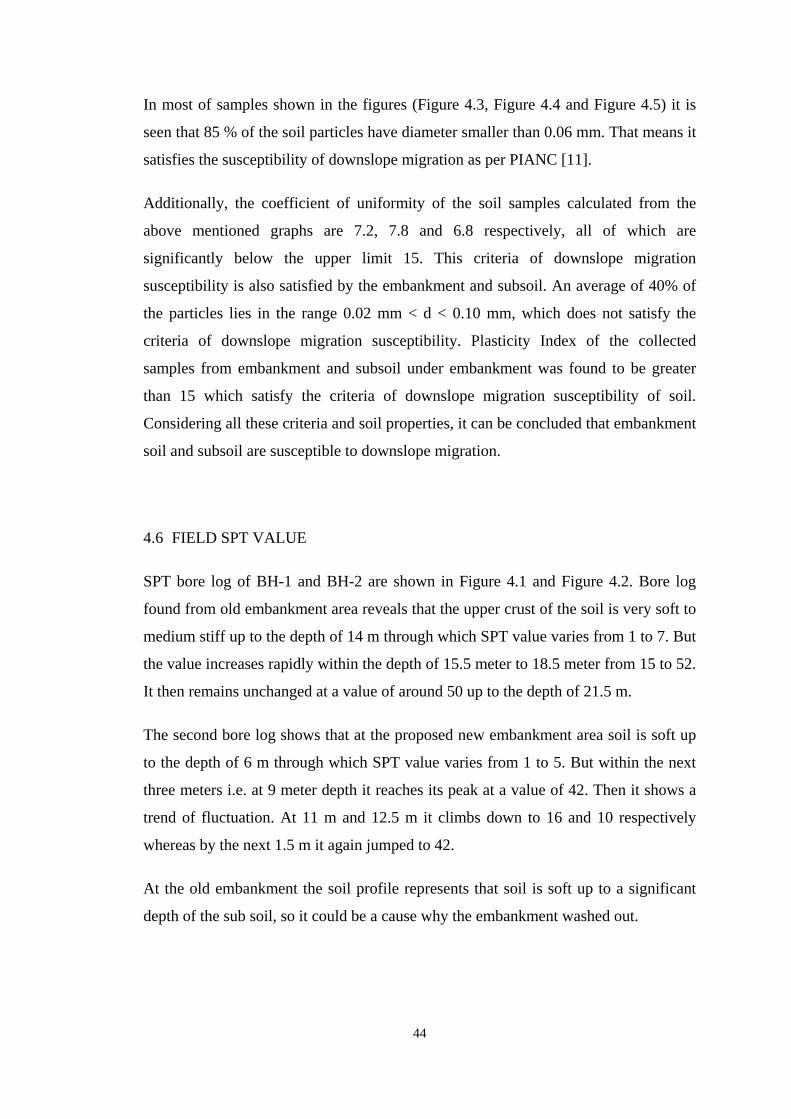
4.6 FIELD SPT VALUE
SPT bore log of BH-1 and BH-2 are shown in Figure 4.1 and Figure 4.2. Bore log
found from old embankment area reveals that the upper crust of the soil is very soft to
medium stiff up to the depth of 14 m through which SPT value varies from 1 to 7. But
the value increases rapidly within the depth of 15.5 meter to 18.5 meter from 15 to 52.
It then remains unchanged at a value of around 50 up to the depth of 21.5 m.
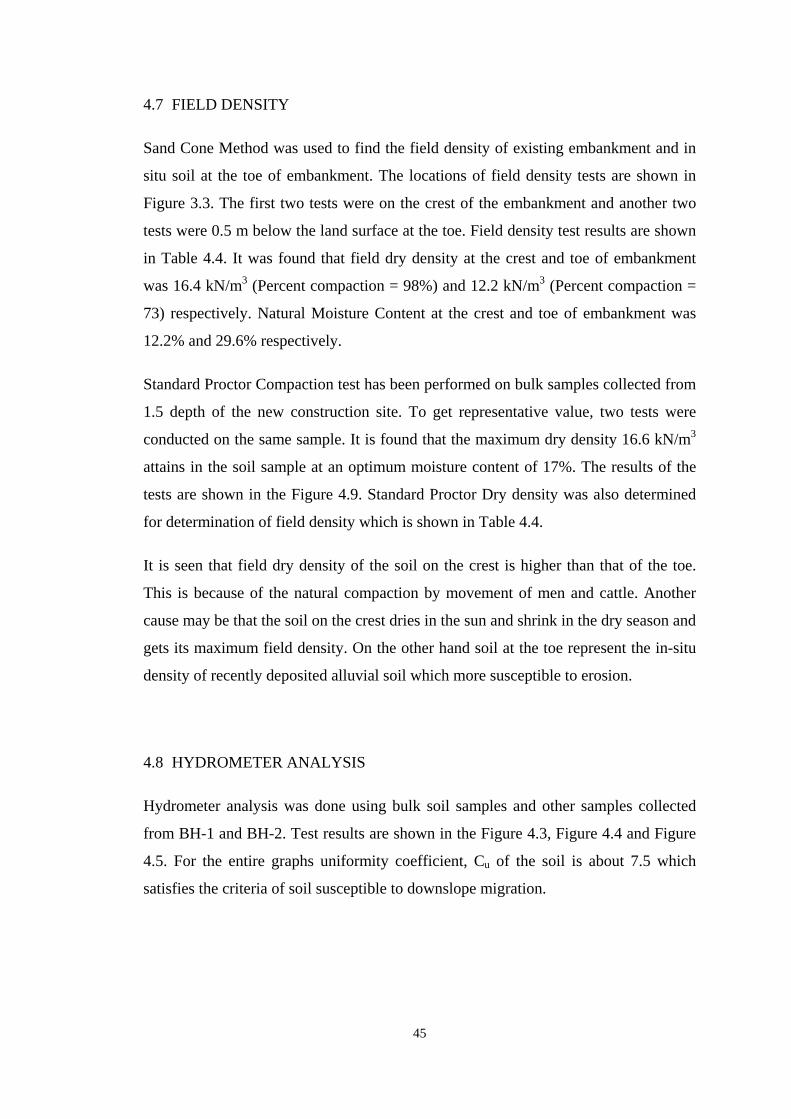
The second bore log shows that at the proposed new embankment area soil is soft up
to the depth of 6 m through which SPT value varies from 1 to 5. But within the next
three meters i.e. at 9 meter depth it reaches its peak at a value of 42. Then it shows a
trend of fluctuation. At 11 m and 12.5 m it climbs down to 16 and 10 respectively
whereas by the next 1.5 m it again jumped to 42.
At the old embankment the soil profile represents that soil is soft up to a significant
depth of the sub soil, so it could be a cause why the embankment washed out.
45
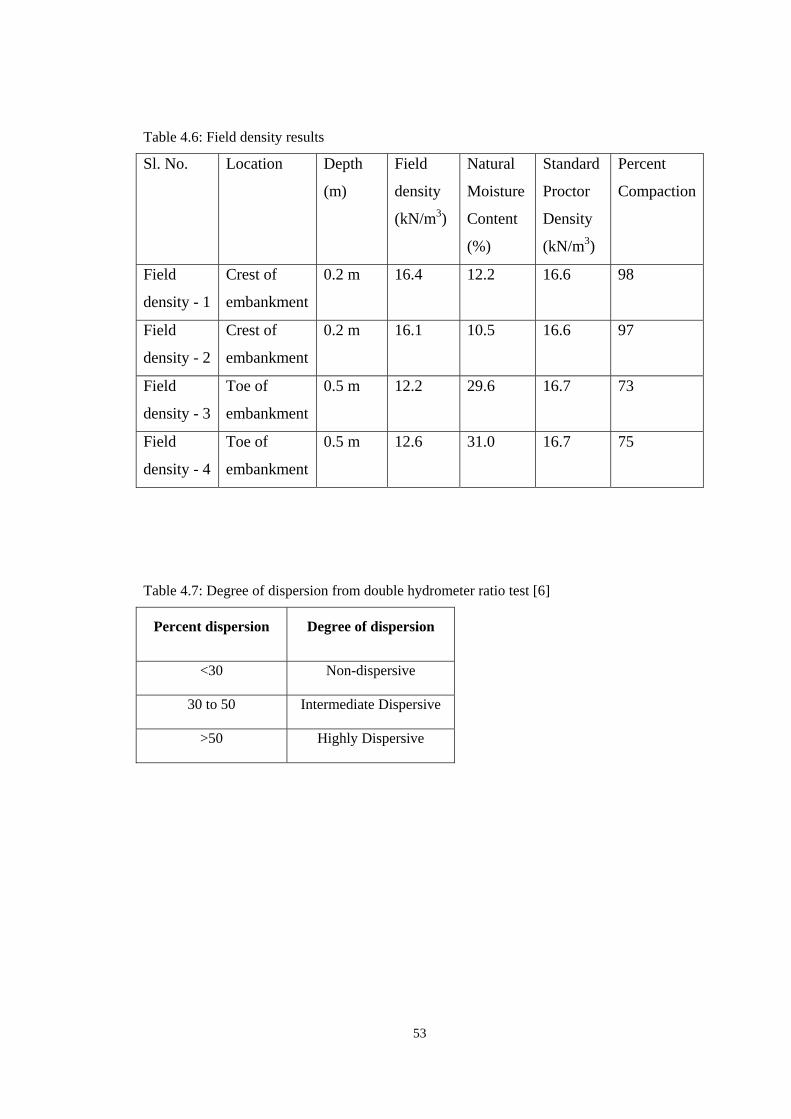
4.7 FIELD DENSITY
Sand Cone Method was used to find the field density of existing embankment and in
situ soil at the toe of embankment. The locations of field density tests are shown in
Figure 3.3. The first two tests were on the crest of the embankment and another two
tests were 0.5 m below the land surface at the toe. Field density test results are shown
in Table 4.4. It was found that field dry density at the crest and toe of embankment
was 16.4 kN/m3 (Percent compaction = 98%) and 12.2 kN/m3 (Percent compaction =
73) respectively. Natural Moisture Content at the crest and toe of embankment was
12.2% and 29.6% respectively.
Standard Proctor Compaction test has been performed on bulk samples collected from
1.5 depth of the new construction site. To get representative value, two tests were
conducted on the same sample. It is found that the maximum dry density 16.6 kN/m3
attains in the soil sample at an optimum moisture content of 17%. The results of the
tests are shown in the Figure 4.9. Standard Proctor Dry density was also determined
for determination of field density which is shown in Table 4.4.
It is seen that field dry density of the soil on the crest is higher than that of the toe.
This is because of the natural compaction by movement of men and cattle. Another
cause may be that the soil on the crest dries in the sun and shrink in the dry season and
gets its maximum field density. On the other hand soil at the toe represent the in-situ
density of recently deposited alluvial soil which more susceptible to erosion.
4.8 HYDROMETER ANALYSIS
Hydrometer analysis was done using bulk soil samples and other samples collected
from BH-1 and BH-2. Test results are shown in the Figure 4.3, Figure 4.4 and Figure
4.5. For the entire graphs uniformity coefficient, Cu of the soil is about 7.5 which
satisfies the criteria of soil susceptible to downslope migration.
46
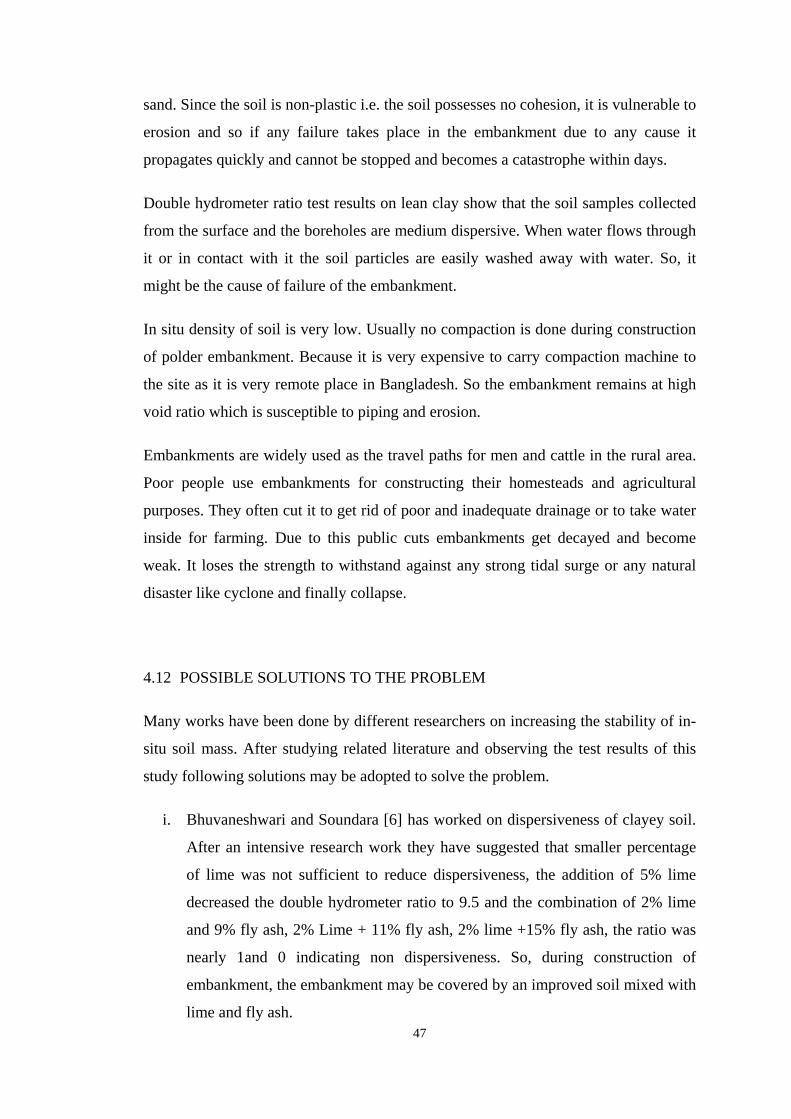
4.9 DOUBLE HYDROMETER RATIO TEST
To know the dispersiveness of soil, double hydrometer ratio was found out using the
data from hydrometer analysis. The particle size distribution is first determined using
the standard hydrometer test in which the soil specimen is dispersed in distilled water
with a chemical dispersant. A parallel hydrometer test is then performed on the same
soil specimen, but without a chemical dispersant. The percent dispersion is the ratio of
the dry mass of particles smaller than 0.005 mm diameter of the test without
dispersing reagent to the test with dispersing reagent expressed as a percentage [10].
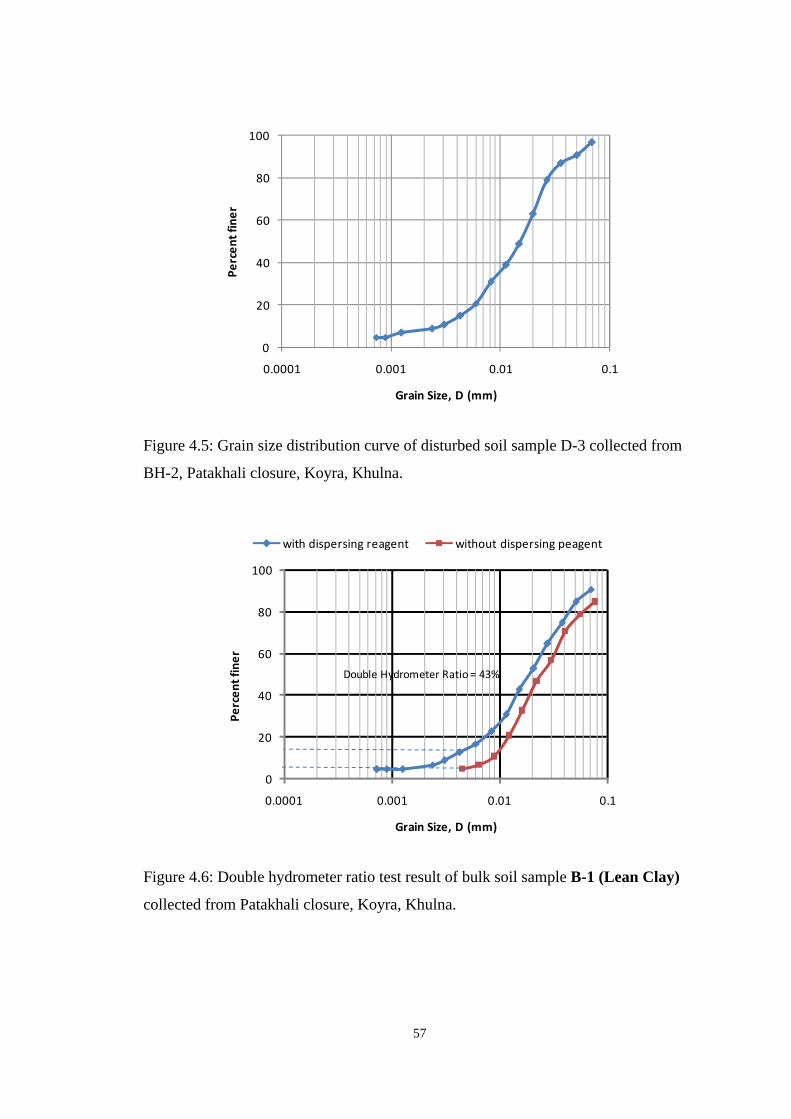
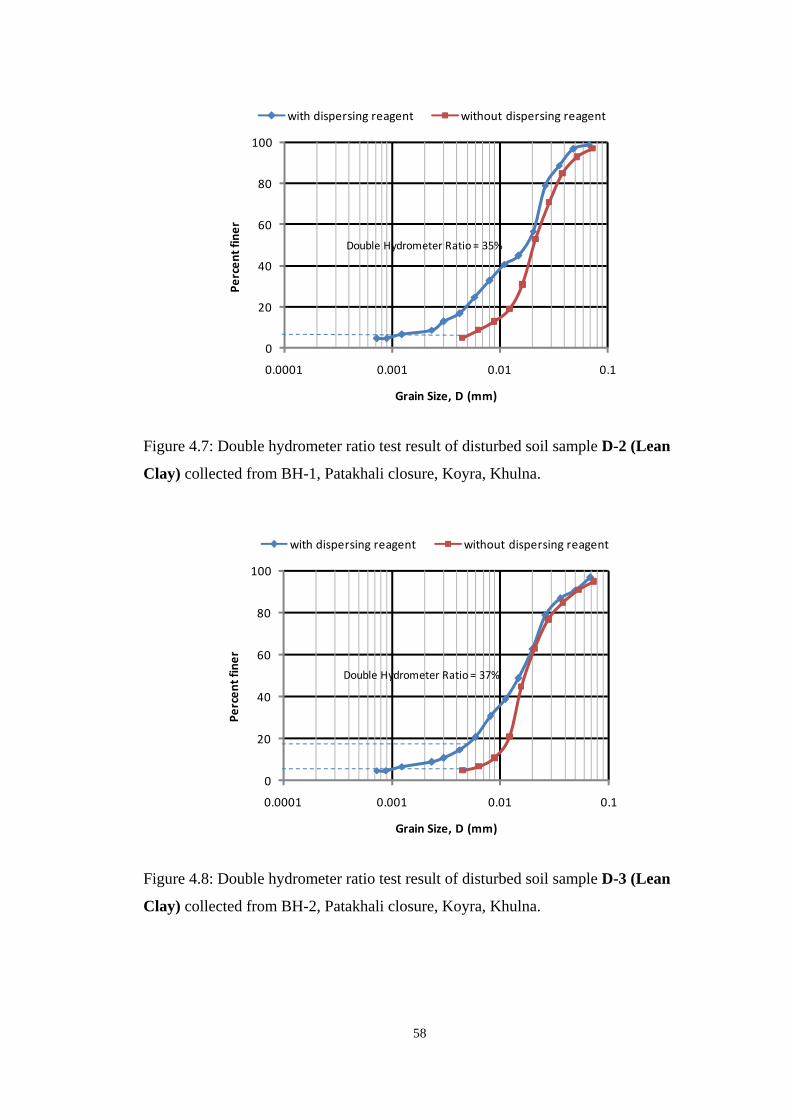
According to this method the double hydrometer ratio of bulk sample B-1, disturbed
sample D-2 (BH-1) and D-3 (BH-2) are 43%, 35% and 37% respectively. The criteria
for evaluating degree of dispersion using results from the double hydrometer test are
shown in Table 4.5 [6]. The results obtained from the tests fall in the medium
dispersive range of the table. The double hydrometer ratios obtained from hydrometer
analysis are presented in the Figure 4.6, Figure 4.7 and Figure 4.8.
The double hydrometer ratio obtained from the test results shows that soil collected
from the site falls into medium dispersive group which means that soil would be
easily washed away with flow of water. So this may be one of the causes of failure of
the embankment and difficulties aroused during construction of closure.
4.10 POLDER EMBANKMENT CONSTRUCTION PRACTICES
During field test visit to the polder it was observed that some parts of an embankment
was being constructed using locally available silty fine sand which is covered by silty
clay. A typical section of this embankment is shown in Figure 4.10. Since the cover
soil is medium dispersive, the embankment might be easily washed out when
overtopping of storm surges will occur.
4.11 CAUSES OF FAILURE OF EMBANKMENT
The sub-surface soil consists mainly of fat and lean clay in the upper layers up to the
depth of eleven meters whereas the layers below this consist of non-plastic silt with
47
sand. Since the soil is non-plastic i.e. the soil possesses no cohesion, it is vulnerable to
erosion and so if any failure takes place in the embankment due to any cause it
propagates quickly and cannot be stopped and becomes a catastrophe within days.
Double hydrometer ratio test results on lean clay show that the soil samples collected
from the surface and the boreholes are medium dispersive. When water flows through
it or in contact with it the soil particles are easily washed away with water. So, it
might be the cause of failure of the embankment.
In situ density of soil is very low. Usually no compaction is done during construction
of polder embankment. Because it is very expensive to carry compaction machine to
the site as it is very remote place in Bangladesh. So the embankment remains at high
void ratio which is susceptible to piping and erosion.
Embankments are widely used as the travel paths for men and cattle in the rural area.
Poor people use embankments for constructing their homesteads and agricultural
purposes. They often cut it to get rid of poor and inadequate drainage or to take water
inside for farming. Due to this public cuts embankments get decayed and become
weak. It loses the strength to withstand against any strong tidal surge or any natural
disaster like cyclone and finally collapse.
4.12 POSSIBLE SOLUTIONS TO THE PROBLEM
Many works have been done by different researchers on increasing the stability of in-
situ soil mass. After studying related literature and observing the test results of this
study following solutions may be adopted to solve the problem.
i. Bhuvaneshwari and Soundara [6] has worked on dispersiveness of clayey soil.
After an intensive research work they have suggested that smaller percentage
of lime was not sufficient to reduce dispersiveness, the addition of 5% lime
decreased the double hydrometer ratio to 9.5 and the combination of 2% lime
and 9% fly ash, 2% Lime + 11% fly ash, 2% lime +15% fly ash, the ratio was
nearly 1and 0 indicating non dispersiveness. So, during construction of
embankment, the embankment may be covered by an improved soil mixed with
lime and fly ash.
48
ii. Embankments are widely used as the travel paths for men and cattle in the rural
area. Poor people use embankments for constructing their homesteads and
agricultural purposes. They often cut it to get rid of poor and inadequate
drainage or to take water inside for farming. Due to this public cuts
embankments get decayed and become weak. It loses the strength to withstand
against any strong tidal surge or any natural disaster like cyclone and finally
collapse. Increasing awareness among the people who live near the
embankment about the adverse effects of those practices may reduce the
possibility of failure.
iii. The shoulders and side slope of embankment can be vegetated with grass and
shrubs so that the soils can be protected against being washed out or erosion. In
this case salinity could be a problem that can have adverse effect on plantation.
Some selected type of grass which can grow in saline water can be planted to
overcome the problem. It will be easier and economic since these types of
plants are available in the nearby Sundarbans.
iv. Concrete block can be used as revetment to protect the embankment from high
wave of tide. But the materials needed for preparing blocks are unavailable in
the area and very costly. So, it may be economic.
v. Crest of the embankment can be covered with brick soling or lime mixed soil
or cement mixed soil. In this case, bricks are available in the area but cement
and lime are to be brought from outside which will be expensive. So brick
soling may be a solution to protect the crest from erosion.
vi. Islam et al [4] has studied the effectiveness of Vetiver grass against the
protection of embankment. He discussed that the special attributes of Vetiver
grass is its longer life, high resistance to extreme climatic variation, finely
structured root system, cost effectiveness and environment friendliness. It is
found that in the climatic and soil condition of the coast of Bangladesh, Vetiver
grass can grow and survive. He also studied that strong and finely structured
root system of vetiver increases the shear strength of the soil. It means that
vetiver will be effective to protect the coastal embankments against cyclonic
49
tidal surge. so in the side slope, Vetiver grass may be planted to protect the
embankment.
vii. According to PIANC, there are three ways of preventing serious downslope
migration: (a) attenuation of the hydraulic gradient – this can be achieved by
incorporating a granular sublayer between the geotextile and the coverlayer. In
practice the granular material should be fine enough to provide an adequate
damping effect yet coarse enough to be retained by the cover layer. The
sublayer should have a thickness of between 100 mm and 500 mm. (b)
stabilization of the soil surface – experience has shown that a thick layer of
coarse fibres attached to the back of the geotextile filter integrates with the soil
surface, thus reducing downslope migration of soil particles within this layer.
(c) application of a constraining load – this can be achieved by using a heavy
weight coverlayer which imparts a significant load into the bank slope thereby
resisting uplift pressures caused by excess pore water pressures.
50
Table 4.1: USCS Classification of soil samples collected from BH-1 at Old Embankment of
Patakhali closure, Koyra, Khulna.
Sample
Depth
(m)
Sample
ID
Sand
Fracti
on
(%)
Liquid
Limit
(LL)
Plastic
Limit
(PL)
Plastici
ty
Index
(PI)
Color USCS
Classification
1.5 D-1 6.0 50 19 31 Dark Grey Fat Clay
3.0 D-2 4.8 51 18 33 Dark Grey Fat Clay
4.5 D-3 7.6 51 25 26 Dark Grey Fat Clay
6.0 D-4 6.6 57 20 37 Dark Grey Fat Clay
7.5 D-5 5.7 44 14 30 Dark Grey Lean Clay
9.0 D-6 2.8 N/A N/A N/A Grey Non Plastic Silt
10.5 D-7 2.6 43 23 20 Grey Lean Clay
12.0 D-8 3.3 N/A N/A N/A Grey Non Plastic Silt
13.5 D-9 4.7 N/A N/A N/A Grey Non Plastic Silt
15.0 D-10 24.9 N/A N/A N/A Grey Non Plastic Silt
with sand
16.5 D-11 6.2 N/A N/A N/A Grey Non Plastic Silt
18.0 D-12 4.8 N/A N/A N/A Grey Non Plastic Silt
20.0 D-13 5.7 N/A N/A N/A Grey Non Plastic Silt
21.5 D-14 5.1 N/A N/A N/A Grey Non Plastic Silt
51
Table 4.2: USCS Classification of soil samples collected from BH-2 at New Embankment of
Patakhali closure, Koyra, Khulna
Sample
Depth
(m)
Sample
ID
Sand
Fraction
(%)
Liquid
Limit
(LL)
Plastic
Limit
(PL)
Plastic
ity
Index
(PI)
Color
USCS
Classificatio
n
1.5 D-1 0 N/A N/A Grey Non Plastic
Silt
3.0 D-2 0 45 19 26 Dark Grey Lean Clay
4.5 D-3 5.7 45 28 17 Dark Grey Lean Clay
6.0 D-4 3.8 40 18 22 Dark Grey Lean Clay
7.5 D-5 22.8 N/A N/A N/A Grey Silt with
Sand
9.0 D-6 26 N/A N/A N/A Grey Silt with
Sand
10.5 D-7 35.2 N/A N/A N/A Grey Sandy Silt
12 D-8 36.9 N/A N/A N/A Grey Sandy Silt
13.5 D-9 46.6 N/A N/A N/A Grey Sandy Silt
15 D-10 49.6 N/A N/A N/A Grey Sandy Silt
Table 4.3: USCS Classification of bulk sample collected from 1.5 m depth
Sample
Depth
(m)
Sample
ID
Sand
Fraction
(%)
Liquid
Limit
(LL)
Plastic
Limit
(PL)
Plastic
ity
Index
(PI)
Color
USCS
Classificati
on
1.5 BL-1 0 45 24 21 Dark Grey Lean Clay
1.5 BL-2 0 43 23 20 Dark Grey Lean Clay
52
Table 4.4: Index properties of clayey soil collected from BH-1
Sample
Depth
(m)
Sample
ID
Liquid
Limit
(LL)
Plastic
Limit
(PL)
Plasticity
Index
(PI)
Liquidit
y Index
IL
Flow
Index
IF
Toughness
Index
IT
1.5 D-1 50 19 31 0.354 21 1.5
3.0 D-2 51 18 33 0.364 3.5 9.4
4.5 D-3 51 25 26 0.192 48 0.5
6.0 D-4 57 20 37 0.270 21 1.8
7.5 D-5 44 14 30 0.533 7.5 4
10.5 D-7 43 23 20 0.350 10.5 1.9
Table 4.5: Index properties of clayey soil collected from BH-2
Sample
Depth
(m)
Sample
ID
Liquid
Limit
(LL)
Plastic
Limit
(PL)
Plasticity
Index
(PI)
Liquidity
Index
IL
Flow
Index
IF
Toughness
Index
IT
3.0 D-2 45 19 26 0.423 22 1.2
4.5 D-3 45 28 17 0.118 63 0.3
6.0 D-4 40 18 22 0.545 20.5 1.1
53
Table 4.6: Field density results
Sl. No. Location Depth
(m)
Field
density
(kN/m3)
Natural
Moisture
Content
(%)
Standard
Proctor
Density
(kN/m3)
Percent
Compaction
Field
density - 1
Crest of
embankment
0.2 m 16.4 12.2 16.6 98
Field
density - 2
Crest of
embankment
0.2 m 16.1 10.5 16.6 97
Field
density - 3
Toe of
embankment
0.5 m 12.2 29.6 16.7 73
Field
density - 4
Toe of
embankment
0.5 m 12.6 31.0 16.7 75
Table 4.7: Degree of dispersion from double hydrometer ratio test [6]
Percent dispersion Degree of dispersion
<30 Non-dispersive
30 to 50 Intermediate Dispersive
>50 Highly Dispersive
54
Grey Non Plastic Silt
6.0
1.5
1.5
1.5
11.0
D7
D8
D6
Dark Grey Fat Clay
Dark Grey Lean Clay
Grey Non Plastic Silt
Grey Lean Clay
100m
m
0.0
PROJECT: M. Engineering Research Work
LOG
DA
TE STANDARD PENETRATION RESISTANCE (BLOWS PER FT)
D1
DIA
. OF
BO
RIN
G
LOCATION :
TYPE
OF
SAM
PLE
Patakhali Closure, Polder-14/1, Koyra, Khulna
SAM
PLE
ID
DEP
TH(m
)
BORE HOLE NO. BH-01 ( 21.5m)
GR. R.L. : - 3m From Top of Embankment
GROUND WATER TABLE : 2.4m from E.G.L
THIC
KN
ESS
(m) SOIL LAYER
DESCRIPTION
NO
TE:D
IST. SAM
PLE:
TIME: 09:00 AM
UN
DIST. SA
MPLE:
24 -
12 -
2011
As Per Visual Classification
D14
D13
D10
D11
D2
D5
D3
D12
D4
D9
1
2
1
3
4
7
1
5
7
15
32
52
50
50
1.5
3.0
4.5
6.0
7.5
9.0
10.5
12.0
13.5
15.0
16.5
18.0
19.5
21.0
0 50 100
DEP
TH (m
)
SPT-N1.5
Figure 4.1: Bore log of BH-1 near old embankment at Patakhali closure, Koyra,
Khulna
55
D10
0.0
D2
D7
THIC
KN
ESS
(m) SOIL LAYER
DESCRIPTION
Grey Non Plastic Silt
PROJECT: M. Engineering Research Work
LOG
DA
TE STANDARD PENETRATION RESISTANCE (BLOWS PER FT)
BORE HOLE NO.25
- 12
- 20
11
D1
DIA
. OF
BO
RIN
G
LOCATION :
TYPE
OF
SAM
PLE
Patakhali Closure, Polder-14/1, Koyra, Khulna
SAM
PLE
ID
DEP
TH(m
)
UN
DIST. SA
MPLE:
GR. R.L. : - 3m From Top of Embankment
GROUND WATER TABLE : 2.4m from E.G.L
100m
m φ
NO
TE:
BH-02 (15.5m) TIME: 09:00 AM
DIST. SA
MPLE:
As Per Visual Classification
D6
D9
D8
D3
D5
D4Dark Grey Lean Clay
Grey Silt with Sand
Grey Sandy Silt
1.5
6.0
3.0
4.5
1
2
3
5
17
43
16
18
43
19
1.5
3.0
4.5
6.0
7.5
9.0
10.5
12.0
13.5
15.0
16.5
18.0
19.5
21.0
0 50
DEP
TH (m
)
SPT-N 1.5
Figure 4.2: Bore log of BH-2 near new embankment at Patakhali closure, Koyra,
Khulna
56
0
20
40
60
80
100
0.0001 0.001 0.01 0.1
Percen
t finer
Grain Size, D (mm)
Figure 4.3: Grain size distribution curve of bulk soil sample B-1 (Lean Clay) collected
from Patakhali closure, Koyra, Khulna.
0
20
40
60
80
100
0.0001 0.001 0.01 0.1
Percen
t finer
Grain Size, D (mm)
Figure 4.4: Grain size distribution curve of disturbed soil sample D- 2 collected from
BH-1, Patakhali closure, Koyra, Khulna.
57
0
20
40
60
80
100
0.0001 0.001 0.01 0.1
Percen
t finer
Grain Size, D (mm)
Figure 4.5: Grain size distribution curve of disturbed soil sample D-3 collected from
BH-2, Patakhali closure, Koyra, Khulna.
0
20
40
60
80
100
0.0001 0.001 0.01 0.1
Percen
t finer
Grain Size, D (mm)
with dispersing reagent without dispersing peagent
Double Hydrometer Ratio = 43%
Figure 4.6: Double hydrometer ratio test result of bulk soil sample B-1 (Lean Clay)
collected from Patakhali closure, Koyra, Khulna.
58
0
20
40
60
80
100
0.0001 0.001 0.01 0.1
Percen
t finer
Grain Size, D (mm)
with dispersing reagent without dispersing reagent
Double Hydrometer Ratio = 35%
Figure 4.7: Double hydrometer ratio test result of disturbed soil sample D-2 (Lean
Clay) collected from BH-1, Patakhali closure, Koyra, Khulna.
0
20
40
60
80
100
0.0001 0.001 0.01 0.1
Percen
t finer
Grain Size, D (mm)
with dispersing reagent without dispersing reagent
Double Hydrometer Ratio = 37%
Figure 4.8: Double hydrometer ratio test result of disturbed soil sample D-3 (Lean
Clay) collected from BH-2, Patakhali closure, Koyra, Khulna.
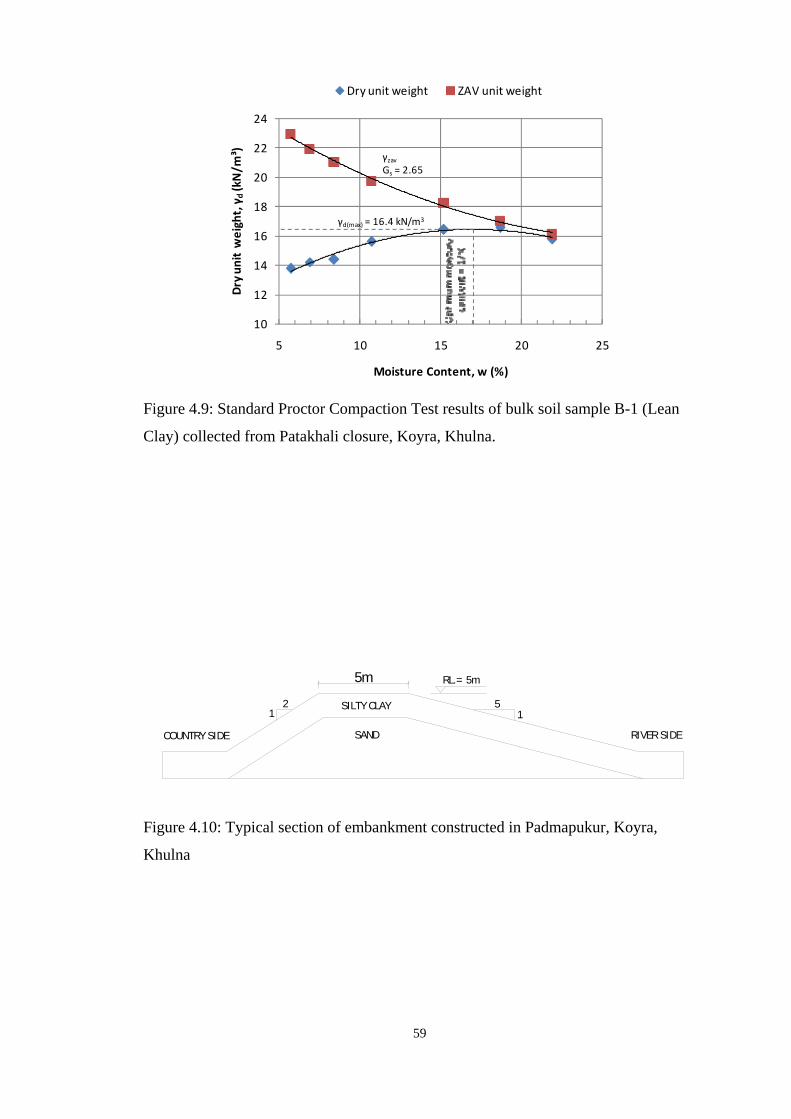
59
Figure 4.9: Standard Proctor Compaction Test results of bulk soil sample B-1 (Lean
Clay) collected from Patakhali closure, Koyra, Khulna.
COUNTRY SIDE RIVER SIDE
RL.= 5m
21
51
5m
SAND
SILTY CLAY
Figure 4.10: Typical section of embankment constructed in Padmapukur, Koyra,
Khulna
10
12
14
16
18
20
22
24
5 10 15 20 25
Dry u
nit weight, γ d
(kN/m
³)
Moisture Content, w (%)
Dry unit weight ZAV unit weight
γd(max) = 16.4 kN/m3
γzavGs = 2.65
60
CHAPTER 5: CONCLUSIONS
5.1 GENERAL
In this study, USCS soil classification, dispersivity, unconfined compression strength
maximum dry density of soil were determined from the samples collected from
surface and boreholes through several tests performed in the field and in the
laboratory. Then these are studied and analyzed and compared with specifications.
Conclusions were made according to the results and comparison. The study was
undertaken to show the causes of failure of the embankment by studying and
analyzing the properties of the soil sample collected from the site.
5.2 CONCLUSIONS
Field and laboratory tests were performed on the samples collected from the breached
embankment site of the selected polder. From the test results following conclusions
may be drawn:
i. The sub-surface soil consists mainly of lean clay in the upper layers up to the
depth of eleven meters whereas the layers below this consist of non-plastic silt
with sand. Since the soil is non-plastic i.e. the soil possesses no cohesion, it is
vulnerable to erosion and so if any failure takes place in the embankment due
to any cause it propagates quickly and cannot be stopped and becomes a
catastrophe within days.
ii. Double hydrometer ratio test results on lean clay show that the soil samples
collected from the surface and the boreholes are medium dispersive. When
water flows through it or in contact with it the soil particles are easily washed
away with water. So, it might be the cause of failure of the embankment.
iii. In situ density of soil is very low. Usually no compaction is done during
construction of polder embankment. Because it is very expensive to carry
compaction machine to the site as it is very remote place in Bangladesh. So the
61
embankment remains at high void ratio which is susceptible to piping and
erosion.
5.3 RECOMMENDATIONS FOR FUTURE STUDY
From the lessons of the present study, the recommendations for future study may be
summarized as follows:
i. In this study, only two boreholes were dug to collect soil samples and their test
results are analyzed. More vulnerable sites of the embankment of the coastal
polder should be included and extensive study could be taken place to find out
the property and performance of the soil.
ii. More attention should be paid during sampling and transportation of the
samples to avoid irregularities and incoherence of test results.
62
REFERENCES
[1] Agarwala et al (2003). “Development and Climate Change in Bangladesh: Focus
on the Coastal Flooding and Sundarbans”, OECD, Head of the publication service,
75775 Paris, Cedex 16, France.
[2] Ali, A. (1996). “Vulnerability of Bangladesh to Climate Change and Sea Level
Rise through Tropical Cyclones and Storm Surges, Water Air and Soil Pollution 92”
pp.171 – 179, Kluwer Academic Publishers, Printed in the Netherlands.
[3] ASTM D 4221-99 (2005). “Standard Test method for dispersive characteristics of clay soil by Double Hydrometer”. [4] Hossain, M. Z. and Sakai, T. (2008). “Severity of Flood Embankments in
Bangladesh and Its Remedial Approach”, Agricultural Engineering International: the
CIGR E-journal. Manuscript LW 08 004, Vol. X.
[5] Islam et al (2010). “In-situ Shear Strength of Vetiver Grass Rooted Soil”,
Proceedings of Bangladesh Geotechnical Conference 2010, pp.274-279, 4-5
November, 2010.
[6] Bhuvaneshwari, S. and Soundara, B. (2011). “Stabilization and Microstructural
Modification of Dispersive Clayey Soil”,
[7 Umesh et al (2011). “Characterization of Dispersive Soil”, Materials Sciences and
Applications, 2011, 2, 629-633, doi: 10.4236/msa.2011.26085 Published Online June
2011.
[8] Das, B. M. (1997). “Soil Mechanics Laboratory Manuals”, Fifth Edition, Austin,
Texas, USA.
[9] ASTMD 4318-84 (2006), “Standard Test Method for Liquid Limit, Plastic Limit
and Plasticity Index of Soils”, Designation: D4318-84, Annual Book of ASTM
Standards, Vol.04.08.pp580-589.
[10] ASTM D 2487-98 (2006), “Standard Practice for Classification of Soils for
Engineering Purposes (Unified Soil Classification Purposes)”, Designation: D2487-

63
98, Annual Book of ASTM Standards, Vol.04.08.pp220-230.
[11] Permanent International Association of Navigation Congress (PIANC) :
Supplement to Bulletin no. 57 (1987)

64
Appendix A

65
WASH SIEVE GRAIN SIZE ANALYSIS TEST RESULTS
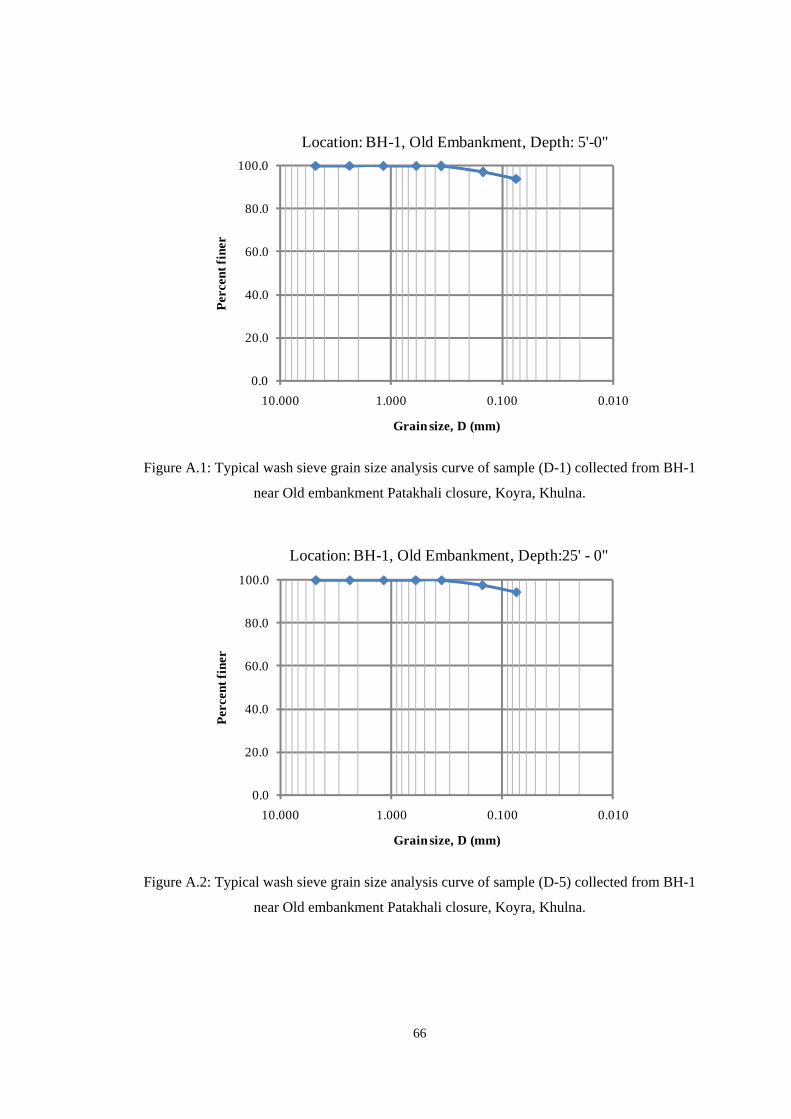
66
0.0
20.0
40.0
60.0
80.0
100.0
0.0100.1001.00010.000
Perc
ent f
iner
Grain size, D (mm)
Location: BH-1, Old Embankment, Depth: 5'-0"
Figure A.1: Typical wash sieve grain size analysis curve of sample (D-1) collected from BH-1
near Old embankment Patakhali closure, Koyra, Khulna.
0.0
20.0
40.0
60.0
80.0
100.0
0.0100.1001.00010.000
Perc
ent f
iner
Grain size, D (mm)
Location: BH-1, Old Embankment, Depth:25' - 0"
Figure A.2: Typical wash sieve grain size analysis curve of sample (D-5) collected from BH-1
near Old embankment Patakhali closure, Koyra, Khulna.
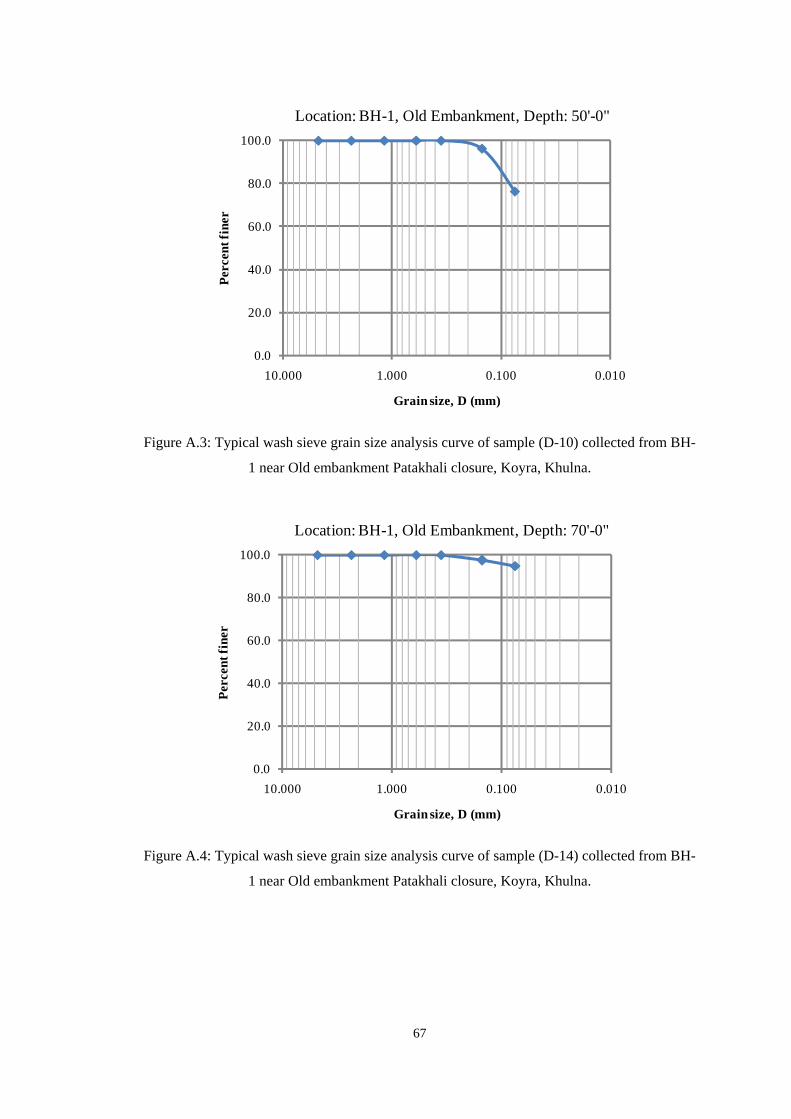
67
0.0
20.0
40.0
60.0
80.0
100.0
0.0100.1001.00010.000
Perc
ent f
iner
Grain size, D (mm)
Location: BH-1, Old Embankment, Depth: 50'-0"
Figure A.3: Typical wash sieve grain size analysis curve of sample (D-10) collected from BH-
1 near Old embankment Patakhali closure, Koyra, Khulna.
0.0
20.0
40.0
60.0
80.0
100.0
0.0100.1001.00010.000
Perc
ent f
iner
Grain size, D (mm)
Location: BH-1, Old Embankment, Depth: 70'-0"
Figure A.4: Typical wash sieve grain size analysis curve of sample (D-14) collected from BH-
1 near Old embankment Patakhali closure, Koyra, Khulna.
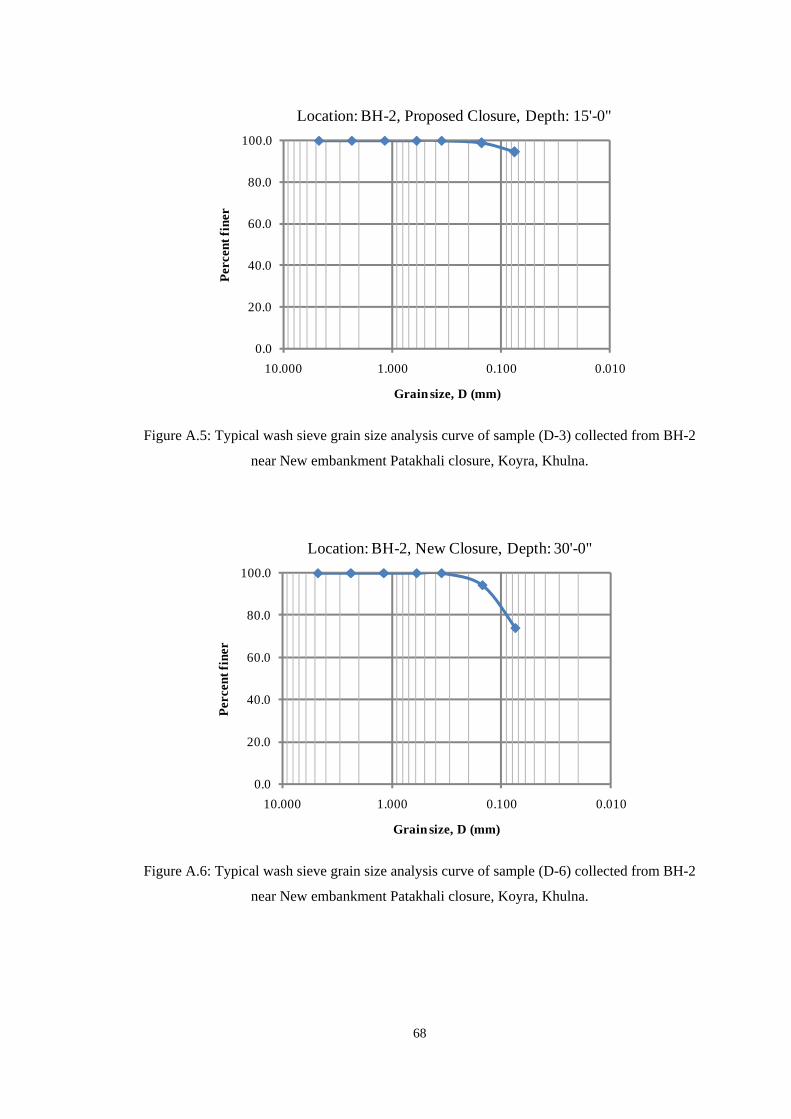
68
0.0
20.0
40.0
60.0
80.0
100.0
0.0100.1001.00010.000
Perc
ent f
iner
Grain size, D (mm)
Location: BH-2, Proposed Closure, Depth: 15'-0"
Figure A.5: Typical wash sieve grain size analysis curve of sample (D-3) collected from BH-2
near New embankment Patakhali closure, Koyra, Khulna.
0.0
20.0
40.0
60.0
80.0
100.0
0.0100.1001.00010.000
Perc
ent f
iner
Grain size, D (mm)
Location: BH-2, New Closure, Depth: 30'-0"
Figure A.6: Typical wash sieve grain size analysis curve of sample (D-6) collected from BH-2
near New embankment Patakhali closure, Koyra, Khulna.
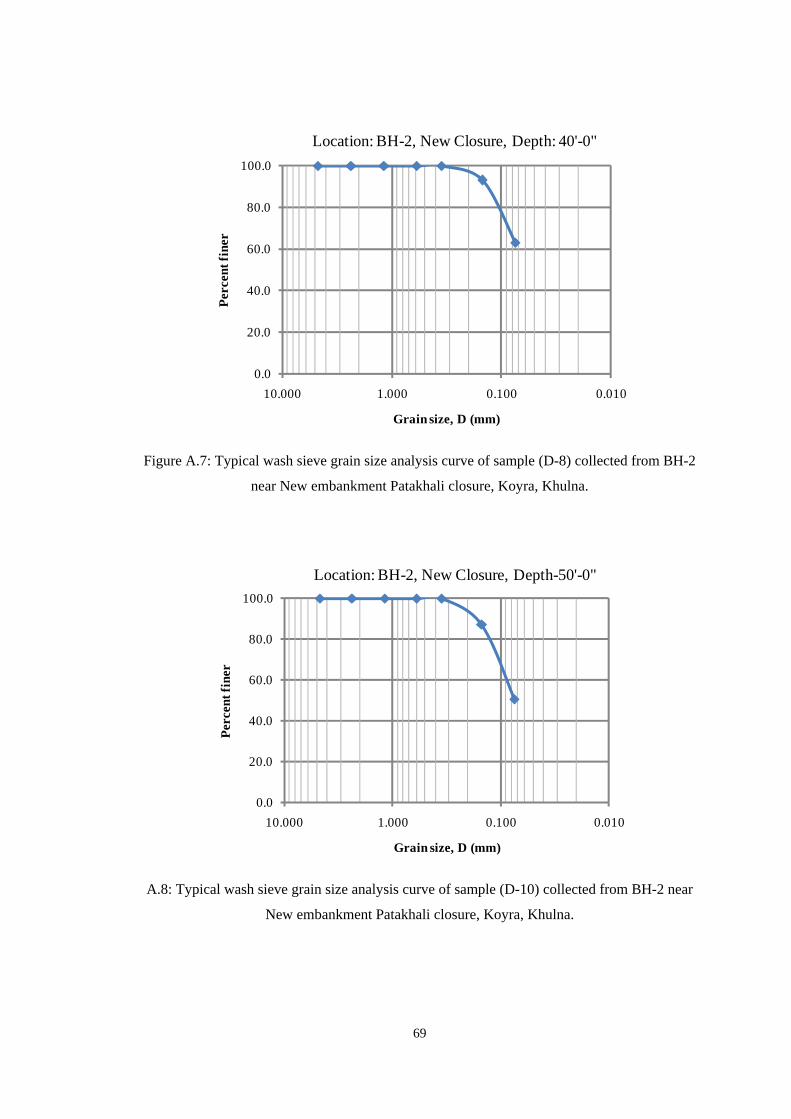
69
0.0
20.0
40.0
60.0
80.0
100.0
0.0100.1001.00010.000
Perc
ent f
iner
Grain size, D (mm)
Location: BH-2, New Closure, Depth: 40'-0"
Figure A.7: Typical wash sieve grain size analysis curve of sample (D-8) collected from BH-2
near New embankment Patakhali closure, Koyra, Khulna.
0.0
20.0
40.0
60.0
80.0
100.0
0.0100.1001.00010.000
Perc
ent f
iner
Grain size, D (mm)
Location: BH-2, New Closure, Depth-50'-0"
A.8: Typical wash sieve grain size analysis curve of sample (D-10) collected from BH-2 near
New embankment Patakhali closure, Koyra, Khulna.
70
HYDROMETER ANALYSIS TEST RESULTS
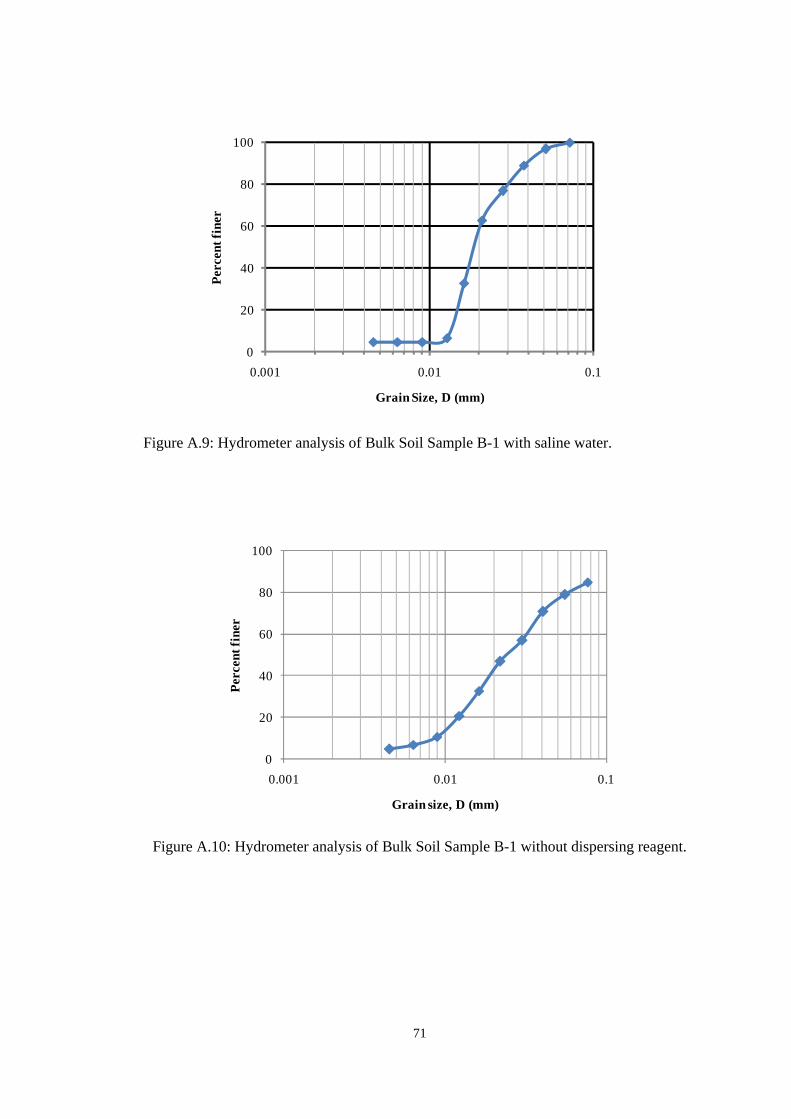
71
0
20
40
60
80
100
0.001 0.01 0.1
Perc
ent f
iner
Grain Size, D (mm)
Figure A.9: Hydrometer analysis of Bulk Soil Sample B-1 with saline water.
0
20
40
60
80
100
0.001 0.01 0.1
Perc
ent f
iner
Grain size, D (mm)
Figure A.10: Hydrometer analysis of Bulk Soil Sample B-1 without dispersing reagent.
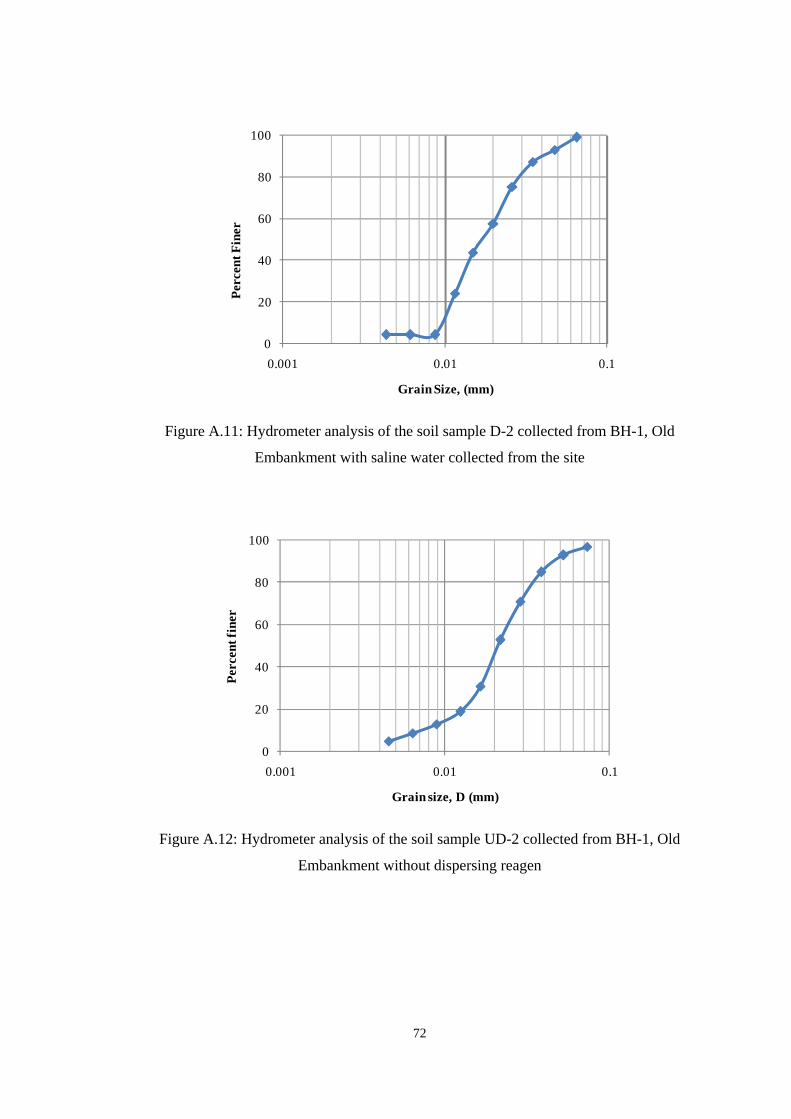
72
0
20
40
60
80
100
0.001 0.01 0.1
Perc
ent F
iner
Grain Size, (mm)
Figure A.11: Hydrometer analysis of the soil sample D-2 collected from BH-1, Old
Embankment with saline water collected from the site
0
20
40
60
80
100
0.001 0.01 0.1
Perc
ent f
iner
Grain size, D (mm)
Figure A.12: Hydrometer analysis of the soil sample UD-2 collected from BH-1, Old
Embankment without dispersing reagen
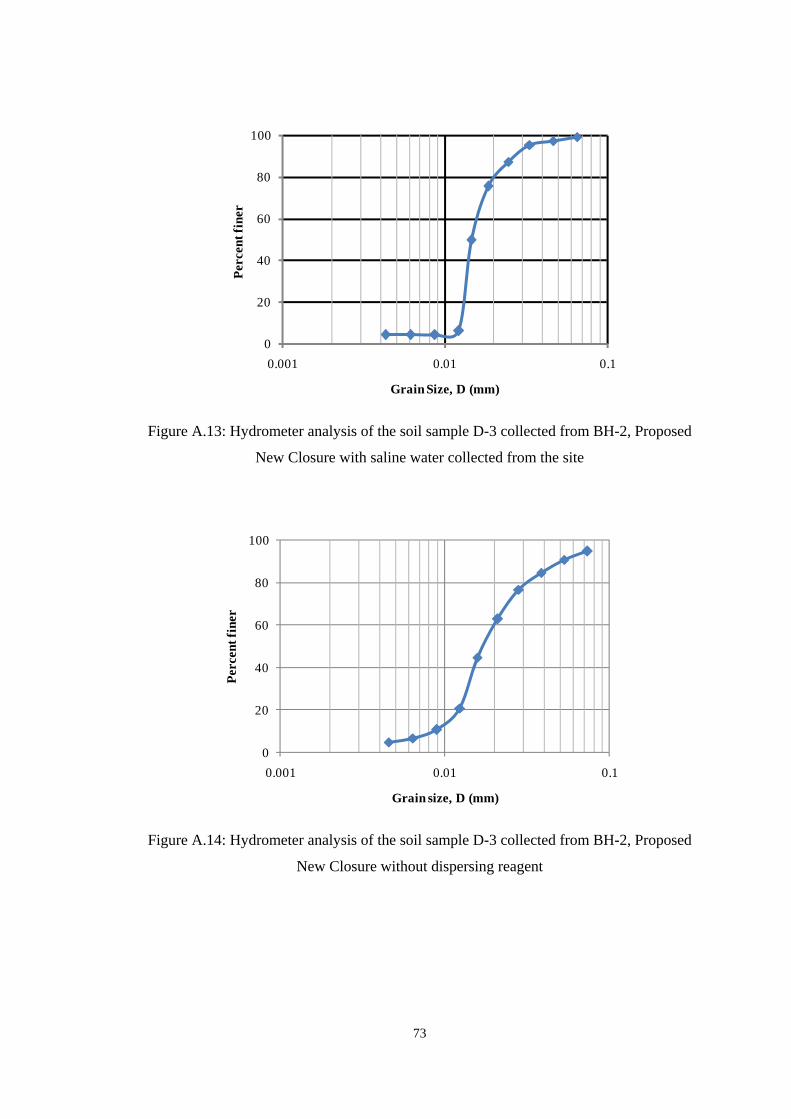
73
0
20
40
60
80
100
0.001 0.01 0.1
Perc
ent f
iner
Grain Size, D (mm)
Figure A.13: Hydrometer analysis of the soil sample D-3 collected from BH-2, Proposed
New Closure with saline water collected from the site
0
20
40
60
80
100
0.001 0.01 0.1
Perc
ent f
iner
Grain size, D (mm)
Figure A.14: Hydrometer analysis of the soil sample D-3 collected from BH-2, Proposed
New Closure without dispersing reagent

74
ATTERBERG LIMITS TEST RESULTS
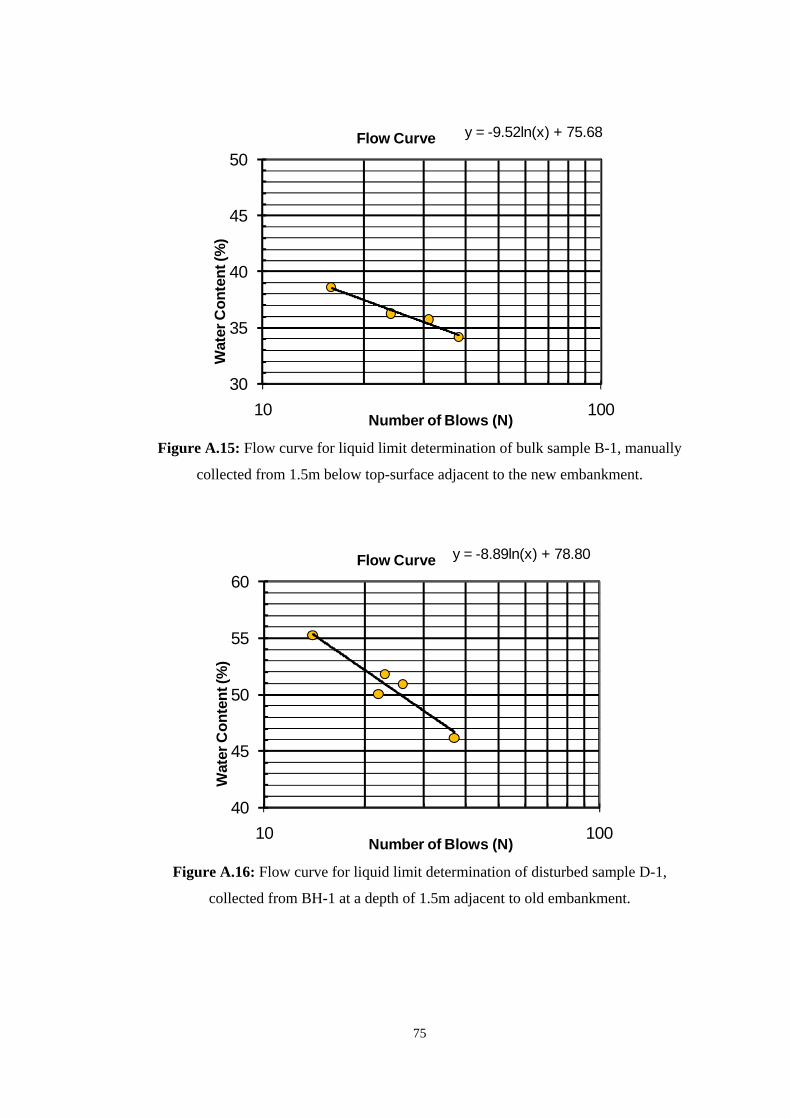
75
y = -9.52ln(x) + 75.68
30
35
40
45
50
10 100
Wat
er C
onte
nt (%
)
Number of Blows (N)
Flow Curve
Figure A.15: Flow curve for liquid limit determination of bulk sample B-1, manually
collected from 1.5m below top-surface adjacent to the new embankment.
y = -8.89ln(x) + 78.80
40
45
50
55
60
10 100
Wat
er C
onte
nt (%
)
Number of Blows (N)
Flow Curve
Figure A.16: Flow curve for liquid limit determination of disturbed sample D-1,
collected from BH-1 at a depth of 1.5m adjacent to old embankment.
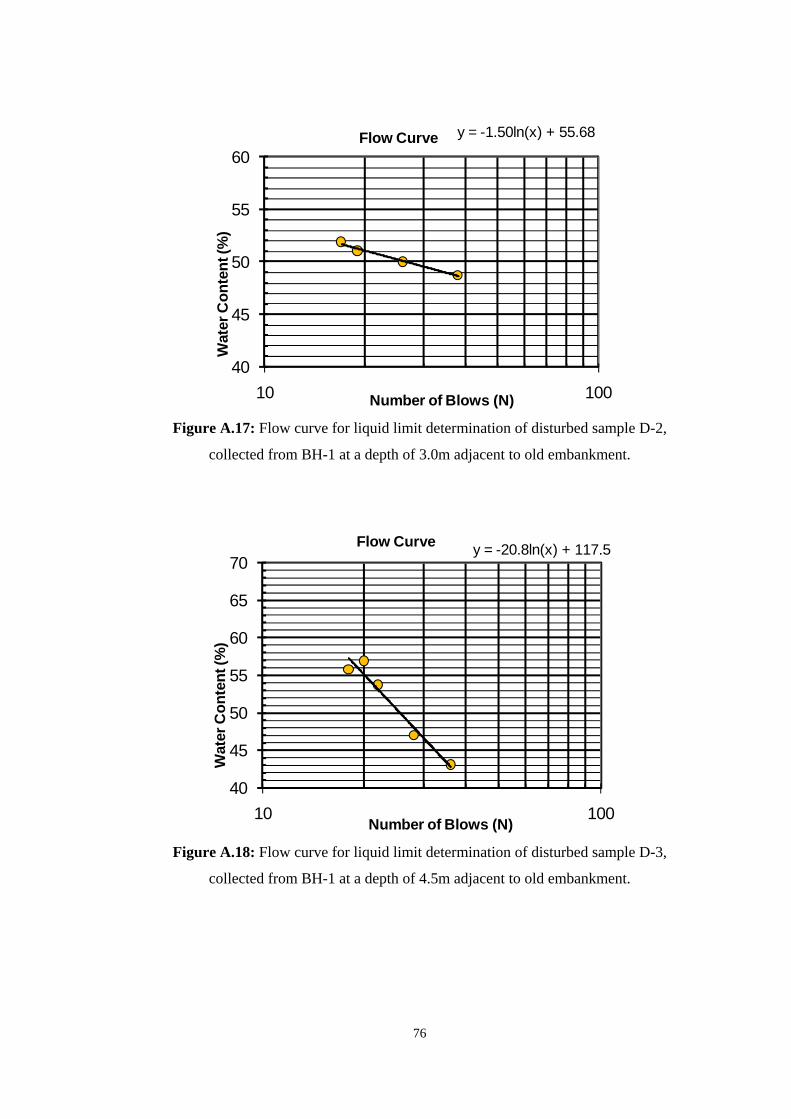
76
y = -1.50ln(x) + 55.68
40
45
50
55
60
10 100
Wat
er C
onte
nt (%
)
Number of Blows (N)
Flow Curve
Figure A.17: Flow curve for liquid limit determination of disturbed sample D-2,
collected from BH-1 at a depth of 3.0m adjacent to old embankment.
y = -20.8ln(x) + 117.5
40
45
50
55
60
65
70
10 100
Wat
er C
onte
nt (%
)
Number of Blows (N)
Flow Curve
Figure A.18: Flow curve for liquid limit determination of disturbed sample D-3,
collected from BH-1 at a depth of 4.5m adjacent to old embankment.
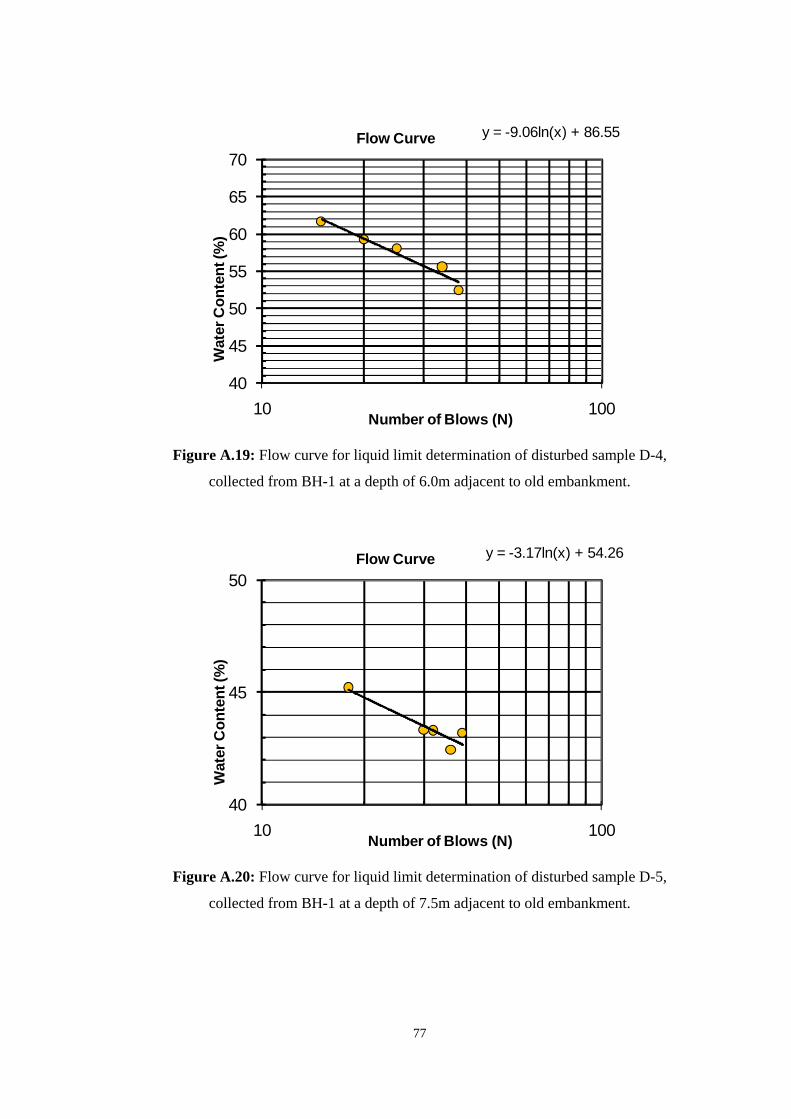
77
y = -9.06ln(x) + 86.55
40
45
50
55
60
65
70
10 100
Wat
er C
onte
nt (%
)
Number of Blows (N)
Flow Curve
Figure A.19: Flow curve for liquid limit determination of disturbed sample D-4,
collected from BH-1 at a depth of 6.0m adjacent to old embankment.
y = -3.17ln(x) + 54.26
40
45
50
10 100
Wat
er C
onte
nt (%
)
Number of Blows (N)
Flow Curve
Figure A.20: Flow curve for liquid limit determination of disturbed sample D-5,
collected from BH-1 at a depth of 7.5m adjacent to old embankment.
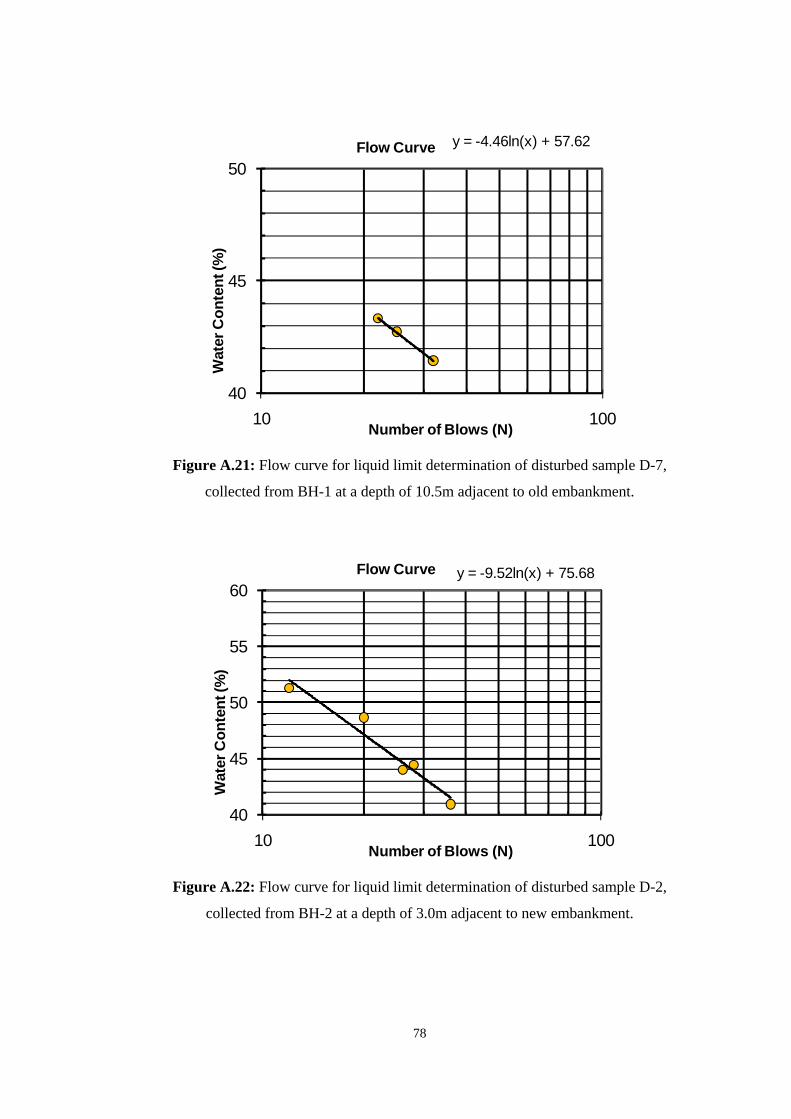
78
y = -4.46ln(x) + 57.62
40
45
50
10 100
Wat
er C
onte
nt (%
)
Number of Blows (N)
Flow Curve
Figure A.21: Flow curve for liquid limit determination of disturbed sample D-7,
collected from BH-1 at a depth of 10.5m adjacent to old embankment.
y = -9.52ln(x) + 75.68
40
45
50
55
60
10 100
Wat
er C
onte
nt (%
)
Number of Blows (N)
Flow Curve
Figure A.22: Flow curve for liquid limit determination of disturbed sample D-2,
collected from BH-2 at a depth of 3.0m adjacent to new embankment.
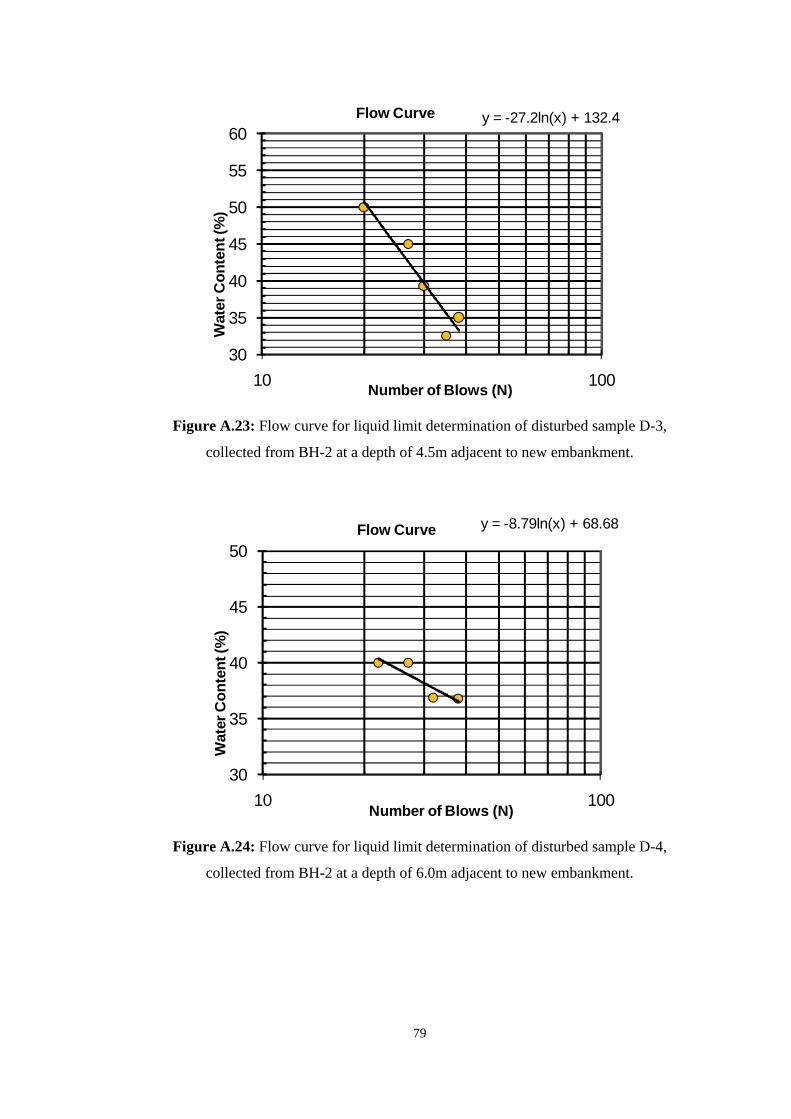
79
y = -27.2ln(x) + 132.4
30
35
40
45
50
55
60
10 100
Wat
er C
onte
nt (%
)
Number of Blows (N)
Flow Curve
Figure A.23: Flow curve for liquid limit determination of disturbed sample D-3,
collected from BH-2 at a depth of 4.5m adjacent to new embankment.
y = -8.79ln(x) + 68.68
30
35
40
45
50
10 100
Wat
er C
onte
nt (%
)
Number of Blows (N)
Flow Curve
Figure A.24: Flow curve for liquid limit determination of disturbed sample D-4,
collected from BH-2 at a depth of 6.0m adjacent to new embankment.