Embed Size (px)
Citation preview
Geotechnical Characterization and Finite Element Pipe/Soil Interaction Modeling of a Pipeline Installed in an Actively Moving, Permafrost Slope Andrew Bidwell, M. Eng., P. Eng. AMEC Earth & Environmental, Calgary, Alberta Millan Sen, Ph.D., P. Eng. Enbridge Pipelines Inc., Edmonton, Alberta Nader Yoosef-Ghodsi, Ph.D., P. Eng. C-FER Technologies, Edmonton, Alberta Ingrid Pederson, P. Eng. Enbridge Pipelines Inc., Edmonton, Alberta ABSTRACT Enbridge Pipelines Inc. has operated a 324 mm diameter, 870 km crude oil pipeline from Norman Wells, Northwest Territories to Zama, Alberta since 1985. The integrity of the pipeline with respect to slope instability and other geotechnical issues is managed with an ongoing, comprehensive geotechnical monitoring program. Of particular interest is the long term stability of permafrost slopes along the route. The slopes at an unnamed creek crossing between Tulita and Wrigley, NT have received considerable attention since the late 1990’s due to slope movement measurements from slope inclinometer data and the corresponding pipe strain measurements from in-line inspection data. The measured pipe strains to date have been within the design limits for the pipeline and overall it is judged that the ongoing slope movements will continue for the foreseeable future without immediate threat to the integrity of the pipeline. However, the potential for a rapid, relatively large increment of ground movement that could significantly strain the pipeline cannot be conclusively ruled out. Therefore, a finite element pipe/soil interaction model was developed in order to estimate the potential for such movement to exceed the strain capacity of the pipeline in such a “worst case” scenario. The model showed that it is unlikely for the strain capacity of the pipeline to be exceeded if there is sudden large increment ground movement at this slope. This paper will describe the soil, permafrost, and slope movement conditions at this site, and will summarize the methodology and results of the pipe/soil interaction model. RÉSUMÉ Enbridge Pipelines Inc. exploite depuis 1985 un pipeline de pétrole brut de 324 mm de diamètre et 870 km de longueur entre Norman Wells, Territoires du Nord-Ouest et Zama, Alberta. L'intégrité de la canalisation quant aux instabilités de pentes et autres problématiques de nature géotechnique est gérée au moyen d’un programme comprehensif de surveillance continue. Un intérêt particulier à long terme est la stabilité des pentes aménagées dans le pergélisol le long du tracé. Les pentes aux abords d’un ruisseau sans nom situé entre Tulita et Wrigley, TNO ont reçu une attention particulière depuis la fin des années 1990 et ce, en raison des déplacements mesurés au moyen d’inclinomètres et des contraintes associées dans la conduite établies à partir de données d'inspection. Les contraintes mesurées à ce jour sont inférieures aux limites de conception de la conduite et dans l'ensemble, il est anticipé que les mouvements de pente se poursuivront dans le futur sans menace immédiate à l'intégrité du pipeline. Toutefois, la possibilité d’un mouvement soudain et important du terrain qui pourrait induire des contraintes considérables dans la conduite ne peut pas être définitivement écartée. À cet effet, un modèle numérique a été développé pour étudier l’interaction entre la conduite et le sol et ce, afin d'évaluer le risque que de tels mouvements puissent dépasser la capacité de déformation du tuyau. Le modèle numérique a démontré qu'il est peu probable que la capacité de déformation du tuyau soit excédée si un important mouvement de terrain devait survenir soudainement à cet endroit. Cet article décrit le sol, le pergélisol et les mouvement de terrains sur le site. Il résume aussi la méthodologie retenue et les résultats du modèle numérique développé pour étudier l’interaction entre la conduite et le sol. 1 INTRODUCTION Enbridge Pipelines Inc. has operated a 324 mm diameter, 870 km crude oil pipeline from Norman Wells, Northwest Territories to Zama, Alberta since 1985 (Figure 1). This pipeline is the first completely buried oil pipeline constructed within the discontinuous permafrost zone of Canada. This pipeline was constructed over two winter
seasons, and since 1985 has transported roughly 200 million barrels of crude oil to southern markets without significant interruption. The design, construction and operation of the Norman Wells pipeline is a valuable case history relevant to other proposed northern pipelines and linear infrastructure developments through permafrost terrain. The
562
geotechnical and permafrost design issues for this pipeline have been well documented in Naviq and AMEC (2007). The experience to date with the pipeline operation and monitoring of the geotechnical and permafrost conditions along the right-of-way have been presented in Doblanko et al (2002) and Pederson et al (2010). The primary design and operational issue for the Norman Wells pipeline is minimizing the thermal impact of the construction and operation of the pipeline on the ground along the right-of-way and adjacent areas. This is required in order to minimize pipe strains and deformations due to thaw settlement in permafrost areas as well as potential frost heave in areas along the pipeline that are located pipeline downstream of a transition between permafrost and unfrozen ground. This was addressed by designing and operating the pipeline as an ambient temperature pipeline, initially with the oil chilled to -2°C at the pipeline inlet and since 1993 with warmer oil temperatures permitted during the summer months and colder oil in the winter months to maintain a mean annual inlet oil temperature of -1°C (Naviq and AMEC, 2007). Another aspect of minimizing the thermal impact of the pipeline on the right-of-way and adjacent areas was the potential for thawing and subsequent instability of permafrost slopes along the right-of-way. Oswell and Skibinsky (2006) provide an outline of the slope design process for the pipeline, summarized as follows:
• 70 of the 164 slopes along the pipeline route that were evaluated for design purposes required mitigation to ensure long-term stability, primarily due to the potential for post-construction thawing of ice-rich permafrost soils.
• The designers selected a primary mitigation
strategy of surface insulation by placing a layer of wood chips on the right-of-way surface immediately after pipeline construction. The thickness of the wood chip layer ranged from 0.5 to 1.2 m depending on the slope angle. The intent of the wood chip insulation was to retard the rate of post-construction thawing such that excessive pore water pressures would not develop at the thaw front in ice-rich soils during rapid thawing.
• Selected right-of-way slopes were instrumented
with thermistor cables and piezometers in order to monitor the ground temperatures and thaw front progression as well as pore water pressures in the slopes.
The use of wood chip insulation as described above has been found to be effective in preventing or retarding the rate of post-construction ground thawing (Oswell and Skibinsky, 2006, Naviq and AMEC, 2007). Nonetheless, post-construction ground movement has been detected at
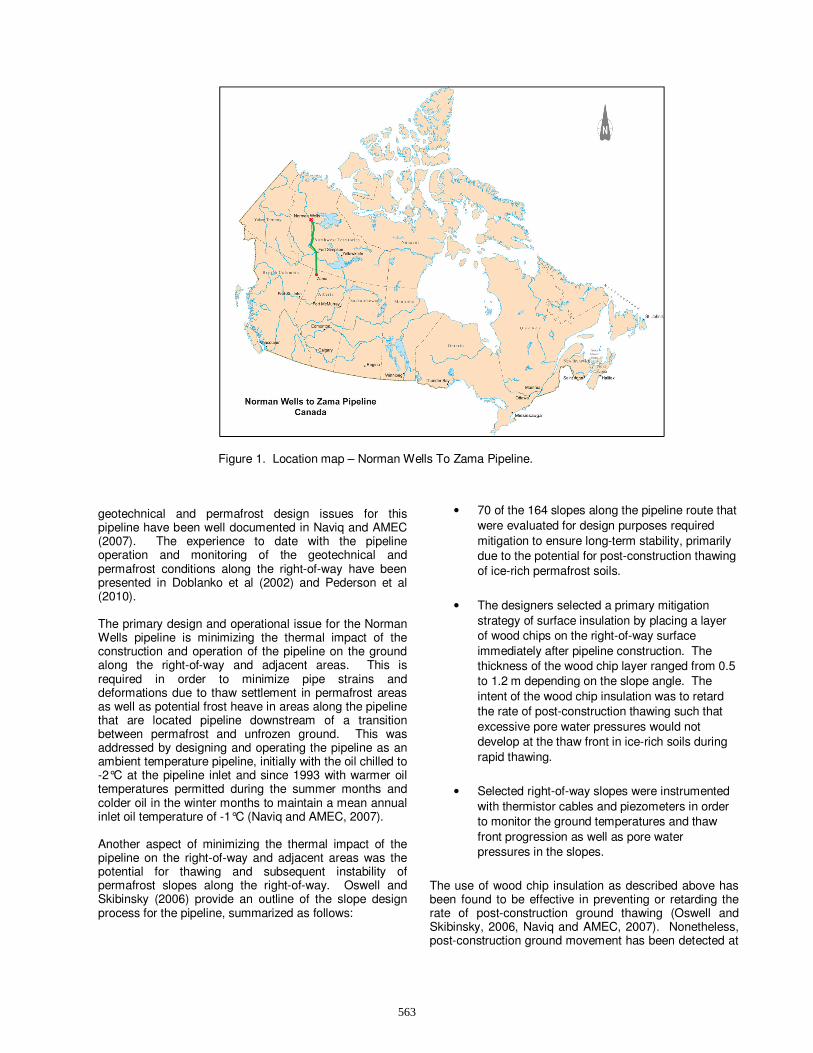
Figure 1. Location map – Norman Wells To Zama Pipeline.
563
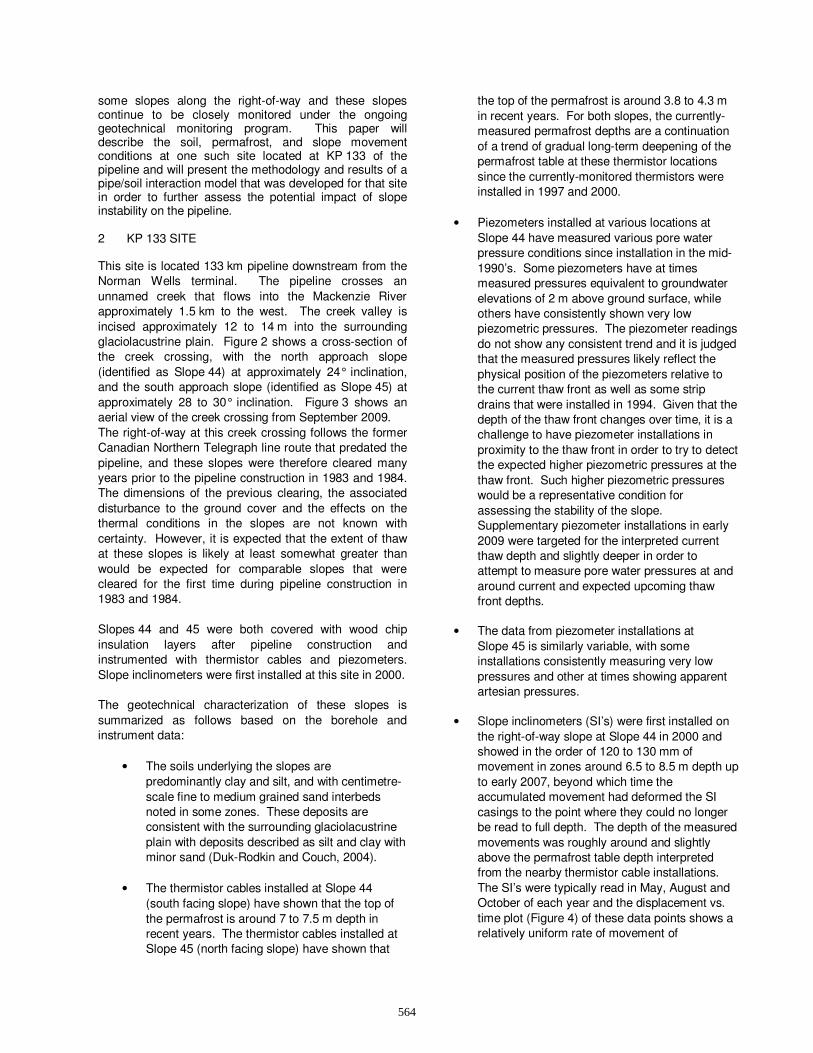
some slopes along the right-of-way and these slopes continue to be closely monitored under the ongoing geotechnical monitoring program. This paper will describe the soil, permafrost, and slope movement conditions at one such site located at KP 133 of the pipeline and will present the methodology and results of a pipe/soil interaction model that was developed for that site in order to further assess the potential impact of slope instability on the pipeline. 2 KP 133 SITE This site is located 133 km pipeline downstream from the Norman Wells terminal. The pipeline crosses an unnamed creek that flows into the Mackenzie River approximately 1.5 km to the west. The creek valley is incised approximately 12 to 14 m into the surrounding glaciolacustrine plain. Figure 2 shows a cross-section of the creek crossing, with the north approach slope (identified as Slope 44) at approximately 24° inclination, and the south approach slope (identified as Slope 45) at approximately 28 to 30° inclination. Figure 3 shows an aerial view of the creek crossing from September 2009. The right-of-way at this creek crossing follows the former Canadian Northern Telegraph line route that predated the pipeline, and these slopes were therefore cleared many years prior to the pipeline construction in 1983 and 1984. The dimensions of the previous clearing, the associated disturbance to the ground cover and the effects on the thermal conditions in the slopes are not known with certainty. However, it is expected that the extent of thaw at these slopes is likely at least somewhat greater than would be expected for comparable slopes that were cleared for the first time during pipeline construction in 1983 and 1984. Slopes 44 and 45 were both covered with wood chip insulation layers after pipeline construction and instrumented with thermistor cables and piezometers. Slope inclinometers were first installed at this site in 2000. The geotechnical characterization of these slopes is summarized as follows based on the borehole and instrument data:
• The soils underlying the slopes are predominantly clay and silt, and with centimetre-scale fine to medium grained sand interbeds noted in some zones. These deposits are consistent with the surrounding glaciolacustrine plain with deposits described as silt and clay with minor sand (Duk-Rodkin and Couch, 2004).
• The thermistor cables installed at Slope 44
(south facing slope) have shown that the top of the permafrost is around 7 to 7.5 m depth in recent years. The thermistor cables installed at Slope 45 (north facing slope) have shown that
the top of the permafrost is around 3.8 to 4.3 m in recent years. For both slopes, the currently-measured permafrost depths are a continuation of a trend of gradual long-term deepening of the permafrost table at these thermistor locations since the currently-monitored thermistors were installed in 1997 and 2000.
• Piezometers installed at various locations at
Slope 44 have measured various pore water pressure conditions since installation in the mid-1990’s. Some piezometers have at times measured pressures equivalent to groundwater elevations of 2 m above ground surface, while others have consistently shown very low piezometric pressures. The piezometer readings do not show any consistent trend and it is judged that the measured pressures likely reflect the physical position of the piezometers relative to the current thaw front as well as some strip drains that were installed in 1994. Given that the depth of the thaw front changes over time, it is a challenge to have piezometer installations in proximity to the thaw front in order to try to detect the expected higher piezometric pressures at the thaw front. Such higher piezometric pressures would be a representative condition for assessing the stability of the slope. Supplementary piezometer installations in early 2009 were targeted for the interpreted current thaw depth and slightly deeper in order to attempt to measure pore water pressures at and around current and expected upcoming thaw front depths.
• The data from piezometer installations at Slope 45 is similarly variable, with some installations consistently measuring very low pressures and other at times showing apparent artesian pressures.
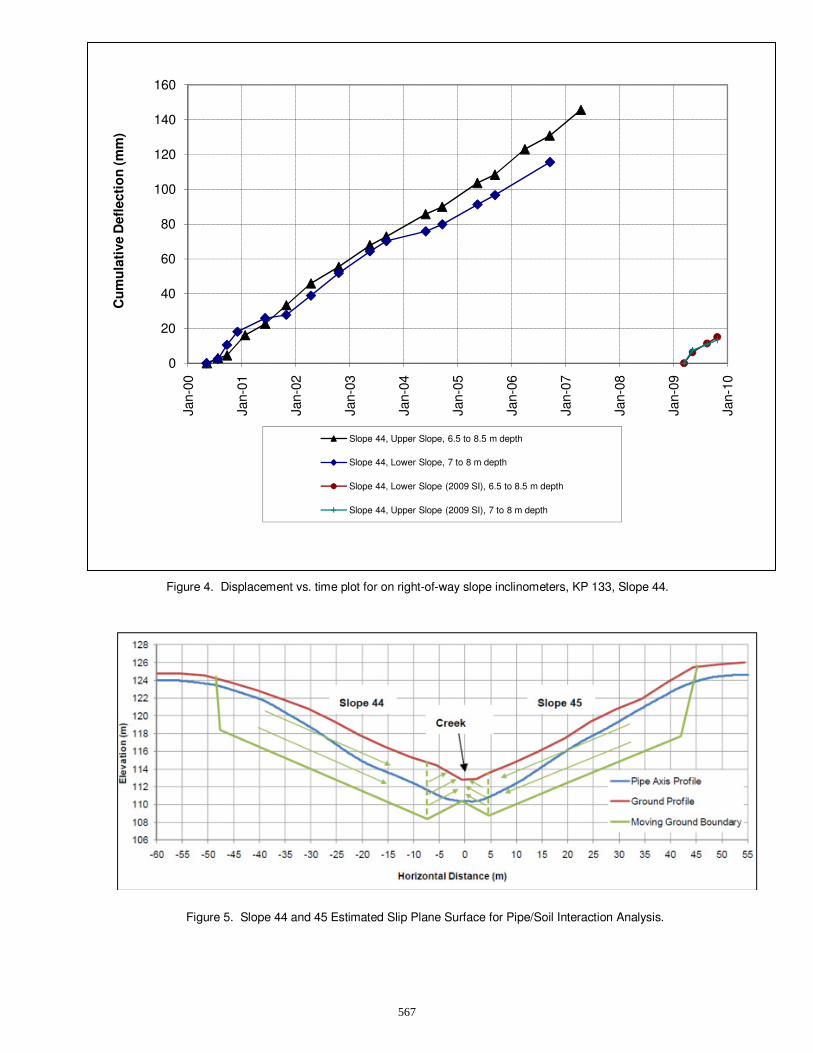
• Slope inclinometers (SI’s) were first installed on the right-of-way slope at Slope 44 in 2000 and showed in the order of 120 to 130 mm of movement in zones around 6.5 to 8.5 m depth up to early 2007, beyond which time the accumulated movement had deformed the SI casings to the point where they could no longer be read to full depth. The depth of the measured movements was roughly around and slightly above the permafrost table depth interpreted from the nearby thermistor cable installations. The SI’s were typically read in May, August and October of each year and the displacement vs. time plot (Figure 4) of these data points shows a relatively uniform rate of movement of
564
Figure 2. Cross-section (facing east) of Slopes 44 and 45 at KP 133.
Figure 3. Aerial view of KP 133 site, Slope 44 (left) and Slope 45 (right). September 2009 photo, facing east.
565

approximately 1.6 mm/month (19 to 20 mm/year) calculated from the data points. Replacement SI’s installed in March 2009 showed similar movement rates up to the October 2009 readings. Data from the planned May 2010 and later readings were not available at the time of writing.
• A single SI was also installed on the right-of-way
at Slope 45 in 2000 and it showed approximately 70 mm of movement in the uppermost 4 m up to October 2002, along with a discrete movement zone around 6 to 7 m depth that showed approximately 40 mm of movement over the same period. This SI could not be read after October 2002 due to the accumulated casing deformation.
• Two additional SI’s were installed at Slope 45 in
2004:
a. One SI on the right-of-way, which showed multiple movement zones up to early 2009 after which it could no longer be read due to accumulated casing deformation.
• Greater than 100 mm of movement across the
upper 6 to 7 m.
• Greater than 100 mm of movement in an interpreted separate zone between 7 and 10 m depth.
• Possible movement zones between 11.5 and
14 m depth and at 17 and 19 m depth, each with less than 5 mm of apparent movement and considered unconfirmed up to the last reading in early 2009.
A replacement SI has been scheduled for installation for early 2011.
b. One SI approximately 5 m off the right-of-way
which remains in service as of early 2010, and has shown:
• Roughly 100 mm of movement across the upper
3 to 4 m.
• Roughly 40 mm of movement in a zone between approximately 5 and 8 m depth.
• Possible minor movement zones at 10/11, 13
and 19 m depth, but each with less than 10 mm of apparent movement and no consistent
movement trend over time and therefore considered unconfirmed at this point.
The generally shallow and slightly lesser movements measured at the off right-of-way SI at Slope 45 are consistent with relatively less permafrost thaw over time at the off right-of-way vs. on right-of-way location.
The annual in-line inspection (GEOPIG) data that has been collected from 1989 - 2009 have shown moderate strains at this site that are well within the pipeline’s strain capacity. Overall, the characterization and data for these slopes are indicative of slopes of marginal stability (with respect to a mass slope failure) with relatively steady and ongoing ground movement occurring. The measured depths of movement are below the pipe depth at both slopes and, while a headscarp of the ground movement areas has not been discerned during the annual geotechnical ground inspections of the slopes nor during more frequent line patrols by maintenance personnel, it is interpreted that the shear plane of the ongoing ground movement crosses the pipeline. This raises the possibility of the ongoing movement and/or a future acceleration of movement/large increment of movement could strain or deform the pipeline. Based on the available data, it is judged that the apparently ongoing and relatively steady ground movement measured at Slopes 44 and 45 will continue for the foreseeable future. Monitoring of the instruments will continue in order to watch for changes/accelerations of movement along with changes in piezometric pressures around the thaw fronts. This monitoring is supplemented with the annual GEOPIG surveys to check for additional pipe straining that may begin to approach tolerable values and thus trigger mitigative actions. However, the possibility of a short-term acceleration of movement with a relatively large increment of displacement cannot be entirely ruled out with the available data. It was decided to evaluate the effects of this potential sudden large scale movement on the pipeline, as it could occur without warning from the pipeline patrols or annual GEOPIG runs.
3 PIPE/STRAIN ASSESSMENT A rapid large magnitude slope movement could potentially cause the pipeline to experience longitudinal strains that are beyond the pipeline strain capacity. This could cause either wrinkling or tensile failure of the pipe along the slope, and a possible loss of containment. Accordingly, an Engineering Critical Assessment (ECA) was conducted. This ECA assessed the effect of a large magnitude slope movement on the structural integrity of the pipeline with a large displacement, nonlinear, pipe soil interaction analysis using the ABAQUS software package. The results of the analysis evaluated the strains that would be induced to the pipeline if there was a mass soil movement, and thereby assisted in the decision of
566
0
20
40
60
80
100
120
140
160
Jan-
00
Jan-
01
Jan-
02
Jan-
03
Jan-
04
Jan-
05
Jan-
06
Jan-
07
Jan-
08
Jan-
09
Jan-
10
Cu
mu
lati
ve D
efl
ecti
on
(m
m)
Slope 44, Upper Slope, 6.5 to 8.5 m depth
Slope 44, Lower Slope, 7 to 8 m depth
Slope 44, Lower Slope (2009 SI), 6.5 to 8.5 m depth
Slope 44, Upper Slope (2009 SI), 7 to 8 m depth
Figure 4. Displacement vs. time plot for on right-of-way slope inclinometers, KP 133, Slope 44.
Figure 5. Slope 44 and 45 Estimated Slip Plane Surface for Pipe/Soil Interaction Analysis.
567
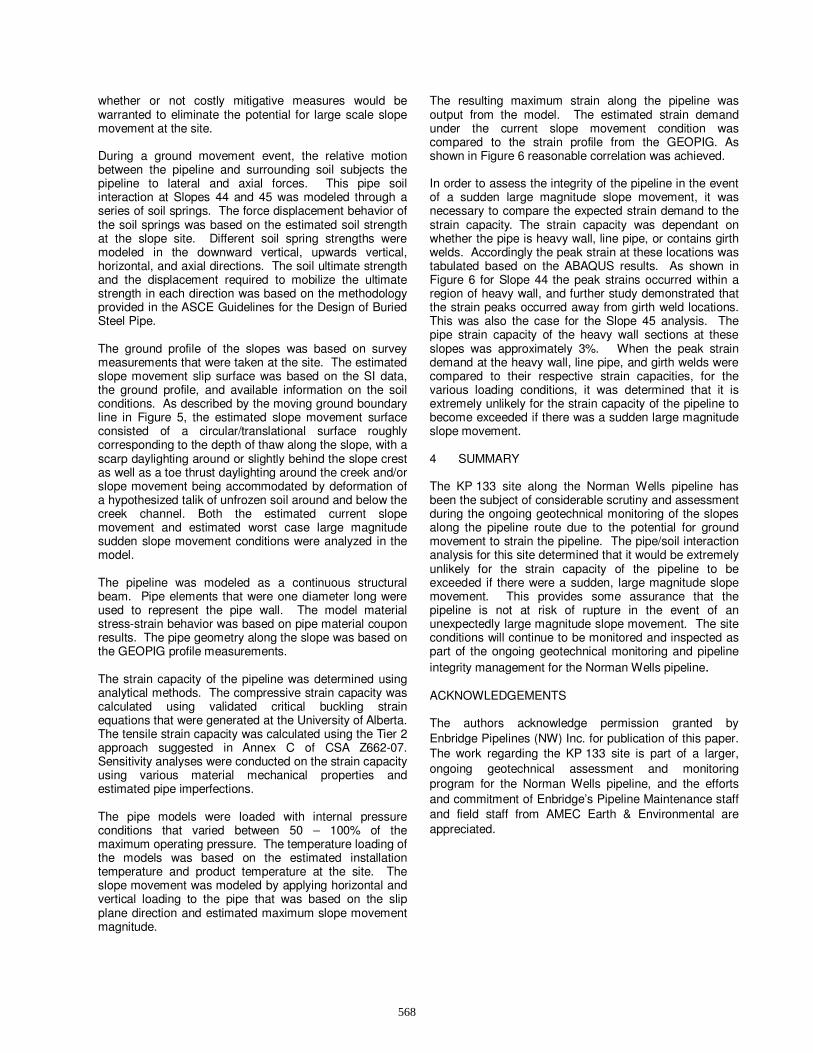
whether or not costly mitigative measures would be warranted to eliminate the potential for large scale slope movement at the site. During a ground movement event, the relative motion between the pipeline and surrounding soil subjects the pipeline to lateral and axial forces. This pipe soil interaction at Slopes 44 and 45 was modeled through a series of soil springs. The force displacement behavior of the soil springs was based on the estimated soil strength at the slope site. Different soil spring strengths were modeled in the downward vertical, upwards vertical, horizontal, and axial directions. The soil ultimate strength and the displacement required to mobilize the ultimate strength in each direction was based on the methodology provided in the ASCE Guidelines for the Design of Buried Steel Pipe. The ground profile of the slopes was based on survey measurements that were taken at the site. The estimated slope movement slip surface was based on the SI data, the ground profile, and available information on the soil conditions. As described by the moving ground boundary line in Figure 5, the estimated slope movement surface consisted of a circular/translational surface roughly corresponding to the depth of thaw along the slope, with a scarp daylighting around or slightly behind the slope crest as well as a toe thrust daylighting around the creek and/or slope movement being accommodated by deformation of a hypothesized talik of unfrozen soil around and below the creek channel. Both the estimated current slope movement and estimated worst case large magnitude sudden slope movement conditions were analyzed in the model. The pipeline was modeled as a continuous structural beam. Pipe elements that were one diameter long were used to represent the pipe wall. The model material stress-strain behavior was based on pipe material coupon results. The pipe geometry along the slope was based on the GEOPIG profile measurements. The strain capacity of the pipeline was determined using analytical methods. The compressive strain capacity was calculated using validated critical buckling strain equations that were generated at the University of Alberta. The tensile strain capacity was calculated using the Tier 2 approach suggested in Annex C of CSA Z662-07. Sensitivity analyses were conducted on the strain capacity using various material mechanical properties and estimated pipe imperfections. The pipe models were loaded with internal pressure conditions that varied between 50 – 100% of the maximum operating pressure. The temperature loading of the models was based on the estimated installation temperature and product temperature at the site. The slope movement was modeled by applying horizontal and vertical loading to the pipe that was based on the slip plane direction and estimated maximum slope movement magnitude.
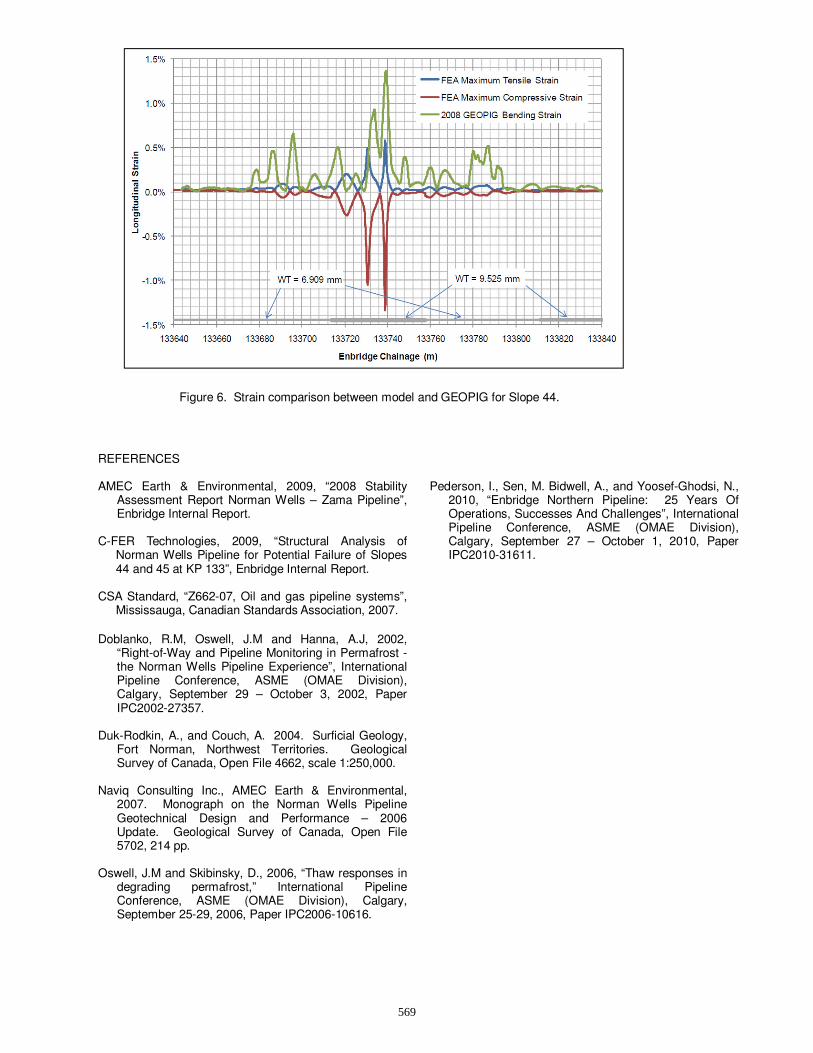
The resulting maximum strain along the pipeline was output from the model. The estimated strain demand under the current slope movement condition was compared to the strain profile from the GEOPIG. As shown in Figure 6 reasonable correlation was achieved. In order to assess the integrity of the pipeline in the event of a sudden large magnitude slope movement, it was necessary to compare the expected strain demand to the strain capacity. The strain capacity was dependant on whether the pipe is heavy wall, line pipe, or contains girth welds. Accordingly the peak strain at these locations was tabulated based on the ABAQUS results. As shown in Figure 6 for Slope 44 the peak strains occurred within a region of heavy wall, and further study demonstrated that the strain peaks occurred away from girth weld locations. This was also the case for the Slope 45 analysis. The pipe strain capacity of the heavy wall sections at these slopes was approximately 3%. When the peak strain demand at the heavy wall, line pipe, and girth welds were compared to their respective strain capacities, for the various loading conditions, it was determined that it is extremely unlikely for the strain capacity of the pipeline to become exceeded if there was a sudden large magnitude slope movement. 4 SUMMARY The KP 133 site along the Norman Wells pipeline has been the subject of considerable scrutiny and assessment during the ongoing geotechnical monitoring of the slopes along the pipeline route due to the potential for ground movement to strain the pipeline. The pipe/soil interaction analysis for this site determined that it would be extremely unlikely for the strain capacity of the pipeline to be exceeded if there were a sudden, large magnitude slope movement. This provides some assurance that the pipeline is not at risk of rupture in the event of an unexpectedly large magnitude slope movement. The site conditions will continue to be monitored and inspected as part of the ongoing geotechnical monitoring and pipeline integrity management for the Norman Wells pipeline. ACKNOWLEDGEMENTS The authors acknowledge permission granted by Enbridge Pipelines (NW) Inc. for publication of this paper. The work regarding the KP 133 site is part of a larger, ongoing geotechnical assessment and monitoring program for the Norman Wells pipeline, and the efforts and commitment of Enbridge’s Pipeline Maintenance staff and field staff from AMEC Earth & Environmental are appreciated.
568
REFERENCES AMEC Earth & Environmental, 2009, “2008 Stability
Assessment Report Norman Wells – Zama Pipeline”, Enbridge Internal Report.
C-FER Technologies, 2009, “Structural Analysis of
Norman Wells Pipeline for Potential Failure of Slopes 44 and 45 at KP 133”, Enbridge Internal Report.
CSA Standard, “Z662-07, Oil and gas pipeline systems”,
Mississauga, Canadian Standards Association, 2007. Doblanko, R.M, Oswell, J.M and Hanna, A.J, 2002,
“Right-of-Way and Pipeline Monitoring in Permafrost - the Norman Wells Pipeline Experience”, International Pipeline Conference, ASME (OMAE Division), Calgary, September 29 – October 3, 2002, Paper IPC2002-27357.
Duk-Rodkin, A., and Couch, A. 2004. Surficial Geology,
Fort Norman, Northwest Territories. Geological Survey of Canada, Open File 4662, scale 1:250,000.
Naviq Consulting Inc., AMEC Earth & Environmental,
2007. Monograph on the Norman Wells Pipeline Geotechnical Design and Performance – 2006 Update. Geological Survey of Canada, Open File 5702, 214 pp.
Oswell, J.M and Skibinsky, D., 2006, “Thaw responses in
degrading permafrost,” International Pipeline Conference, ASME (OMAE Division), Calgary, September 25-29, 2006, Paper IPC2006-10616.
Pederson, I., Sen, M. Bidwell, A., and Yoosef-Ghodsi, N.,
2010, “Enbridge Northern Pipeline: 25 Years Of Operations, Successes And Challenges”, International Pipeline Conference, ASME (OMAE Division), Calgary, September 27 – October 1, 2010, Paper IPC2010-31611.
Figure 6. Strain comparison between model and GEOPIG for Slope 44.
569


![[USACE] Geotechnical Analysis by the Finite Element Method](https://img.pdfslide.net/doc/110x75/546a5959b4af9f752c8b468c/usace-geotechnical-analysis-by-the-finite-element-method.jpg)