Embed Size (px)
Citation preview
Geotechnical Data Report PERU STP SCRP(4)
Bromley Mountain Ski Resort
Peru, Vermont
PIN: 07b106
July 01, 2014
Terracon Project No. J1145128
Prepared for:
Vermont Agency of Transportation
Montpelier, Vermont
Prepared by:
Terracon Consultants, Inc.
Manchester, New Hampshire
Responsive ■ Resourceful ■ Reliable i
Page
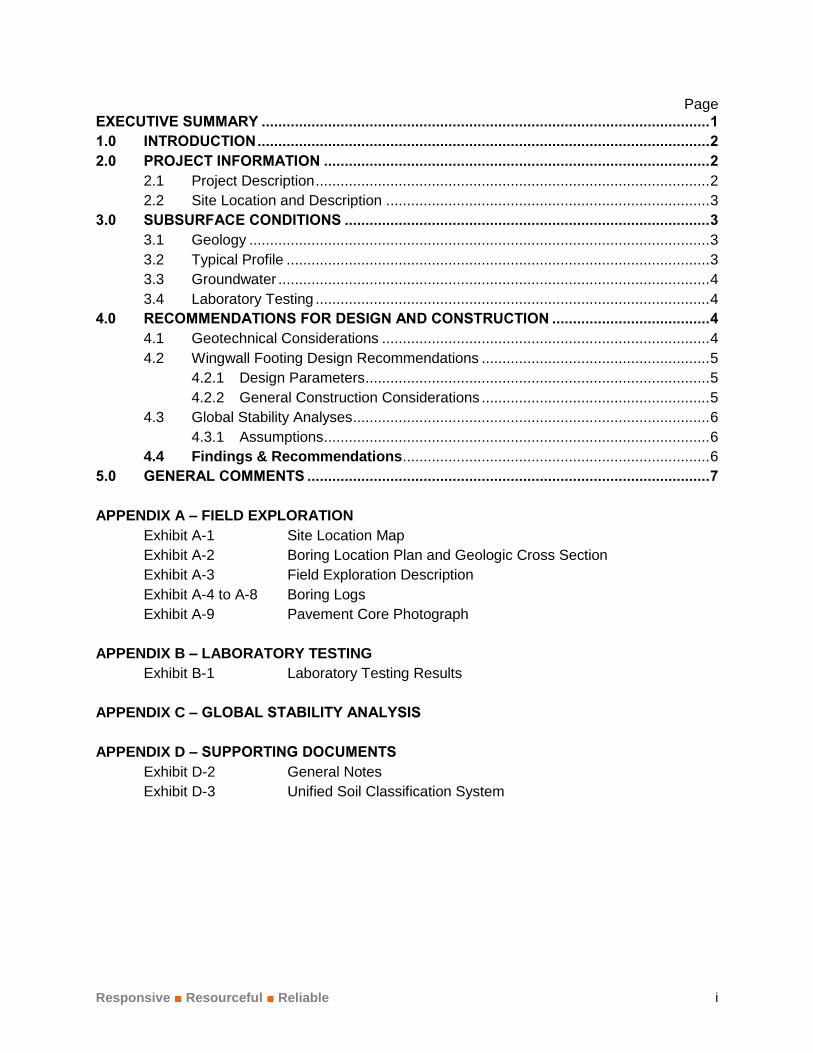
EXECUTIVE SUMMARY ............................................................................................................ 1
1.0 INTRODUCTION ............................................................................................................. 2
2.0 PROJECT INFORMATION ............................................................................................. 2
2.1 Project Description ............................................................................................... 2
2.2 Site Location and Description .............................................................................. 3
3.0 SUBSURFACE CONDITIONS ........................................................................................ 3
3.1 Geology ............................................................................................................... 3
3.2 Typical Profile ...................................................................................................... 3
3.3 Groundwater ........................................................................................................ 4
3.4 Laboratory Testing ............................................................................................... 4
4.0 RECOMMENDATIONS FOR DESIGN AND CONSTRUCTION ...................................... 4
4.1 Geotechnical Considerations ............................................................................... 4
4.2 Wingwall Footing Design Recommendations ....................................................... 5
4.2.1 Design Parameters ................................................................................... 5
4.2.2 General Construction Considerations ....................................................... 5
4.3 Global Stability Analyses ...................................................................................... 6
4.3.1 Assumptions ............................................................................................. 6
4.4 Findings & Recommendations .......................................................................... 6
5.0 GENERAL COMMENTS ................................................................................................. 7
APPENDIX A – FIELD EXPLORATION
Exhibit A-1 Site Location Map
Exhibit A-2 Boring Location Plan and Geologic Cross Section
Exhibit A-3 Field Exploration Description
Exhibit A-4 to A-8 Boring Logs
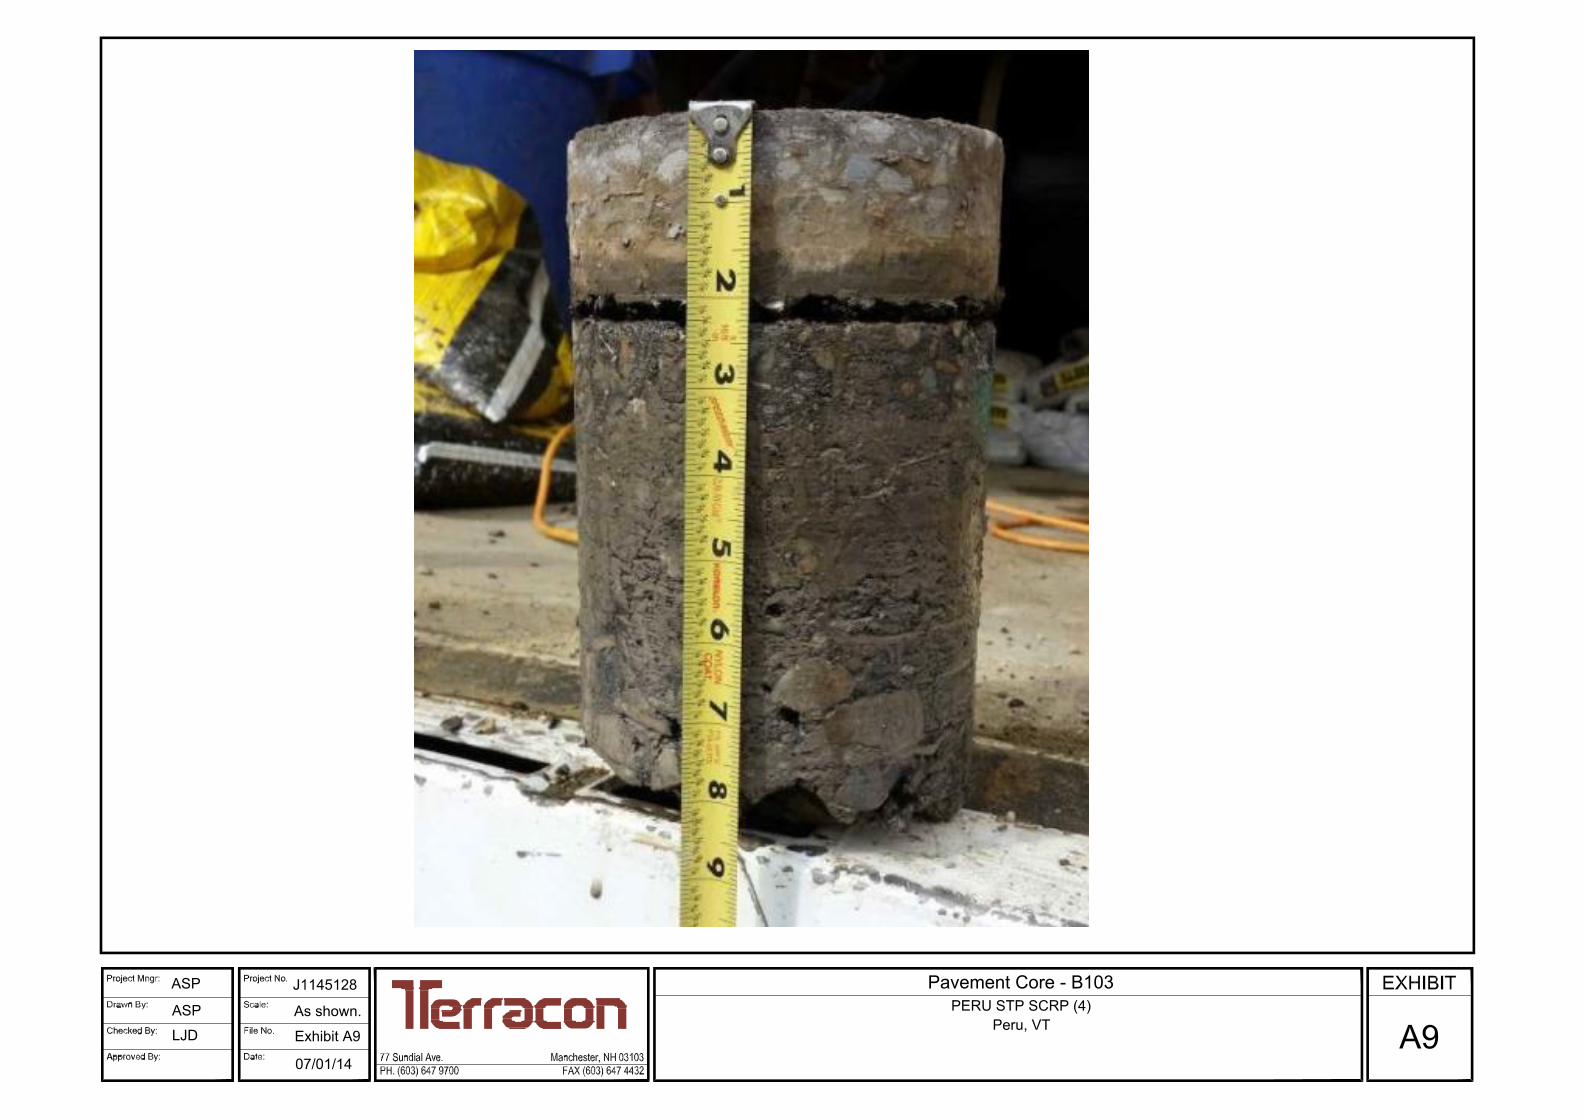
Exhibit A-9 Pavement Core Photograph
APPENDIX B – LABORATORY TESTING
Exhibit B-1 Laboratory Testing Results
APPENDIX C – GLOBAL STABILITY ANALYSIS
APPENDIX D – SUPPORTING DOCUMENTS
Exhibit D-2 General Notes
Exhibit D-3 Unified Soil Classification System
Responsive ■ Resourceful ■ Reliable 1
GEOTECHNICAL DATA REPORT
PERU STP SCRP(4),
PERU, VERMONT PIN:07b106
Terracon Project No. J1145128
July 01, 2014
EXECUTIVE SUMMARY
A geotechnical engineering data report has been completed for the proposed culvert design and
construction in Peru, Vermont. Five test borings were advanced to depths ranging from
approximately 22 to 45 feet below existing grade to provide geotechnical information. The
following geotechnical considerations for wingwall design and construction were identified and
are discussed in the report:
Site subsurface conditions generally consist of topsoil or asphalt pavement
underlain by granular fill underlain by glacial till. The proposed wing walls may
be supported on shallow foundations designed for factored bearing resistance of
8 ksf bearing on undisturbed glacial till.
Global stability analyses indicate a resistance factor of 0.65 (FS=1.54) for
the proposed geometry with construction loading. Stability analyses
indicate the FS for the proposed slope configuration will satisfy the
AASHTO recommended maximum resistance factor of 0.65 (FS=1.54).
This summary should be used in conjunction with the entire report for design purposes. Details
are not included or fully developed in this summary; the report must be read in its entirety for a
comprehensive understanding of the information contained herein. The section titled GENERAL
COMMENTS should be read for an understanding of the report limitations.
Geotechnical Data Report PERU STP SCRP (4) ■ Peru, Vermont July 01, 2014 ■ Terracon Project No. J1145128
Responsive ■ Resourceful ■ Reliable 2
1.0 INTRODUCTION
This geotechnical data report presents the results of drilling for the proposed replacement
culvert under Route 11 in front of Bromley Mountain Ski Resort in Peru, Vermont. The purpose
of our services is to provide potential design-builders with the subsurface information for the
proposed culvert replacement.
Our geotechnical engineering scope of services included advancing up to five test borings,
designated B-101 thru B-105, to depths identified on the Geotechnical Services Request Form
prepared by Vermont Agency of Transportation (VAOT) and perform stability analyses for the
proposed wing walls.
The borings were drilled to depths varying from 22 feet to 45 feet. B-101 and B102 were
inaccessible due to a steep embankment slope and were relocated upslope from the proposed
boring location. Test borings were completed from June 3, 2014 through June 6, 2014 using a
mud rotary drilling method. Borings were advanced using both an all-terrain vehicle and truck
mounted rotary drill rig, owned and operated by New Hampshire Boring Inc. of Londonderry, New
Hampshire. Terracon personnel monitored advancement of the borings within the project site.
The proposed borings were located by a Terracon representative using a scaled site plan
provided by VAOT. Ground surface elevations indicated on the boring logs were estimated
based on the grading plan provided by VAOT. The locations and elevations of the borings
should be considered accurate only to the degree implied by the means and methods used to
define them.
The boring locations are shown on the Exploration Location Plan and Geologic Cross Section in
Appendix A. Logs of the borings along with a Site Location Map are also included in Appendix
A.
2.0 PROJECT INFORMATION
2.1 Project Description
Item Description
Site layout See Appendix A, Exhibit A-2: Exploration Location Plan and
Geologic Cross Section.
Structure The project consists of replacing existing culverts beneath the Route
11 embankment.
Cut and fill slopes Cut and fill slopes will depend on the construction method selected.
Geotechnical Data Report PERU STP SCRP (4) ■ Peru, Vermont July 01, 2014 ■ Terracon Project No. J1145128
Responsive ■ Resourceful ■ Reliable 3
Item Description
Finish Elevation
Anticipated to be similar grade as the existing culverts and
roadways with minor benches and wing walls constructed for the
new culvert, where it outlets into a pond.
2.2 Site Location and Description
Item Description
Location
The proposed culvert will be located beneath Route 11, in front of
the Bromley Mountain Ski Resort. The new culvert alignment starts
at the ski lift tower, proceeds beneath the parking lot, and Route
11, and terminates at a detention pond to the south.
Existing improvements The existing cuverts consist of 42 inch diameter ACCMPs draining
to the south.
Current ground cover Paved roadway with sloping embankment shoulders lined with
riprap as well as asphalt parking lot and landscape areas.
Existing topography Approximate elevation (El) 1,997 feet at the ski lift tower, and El
1,930 feet at the detention pond.
3.0 SUBSURFACE CONDITIONS
3.1 Geology
As mapped in the Surficial Geology Map of Vermont (1970), surficial soils at the project site
primarily consist of glacial till which is then underlain by bedrock. The till typically blankets the
bedrock with thicker deposits in the valleys and thinner deposits on the uplands.
3.2 Typical Profile
Based on the results of the borings, subsurface conditions can be generalized as follows:
Stratum
Approximate Depth
to Bottom of
Stratum (feet)
Material Description Consistency/
Density
Bituminous
Concrete 0.7 N/A N/A
Imported Fill
(Roadway
Base/Subbase)
3.5 Silty, fine to coarse sandy gravel,
brown.
Dense to very
dense.
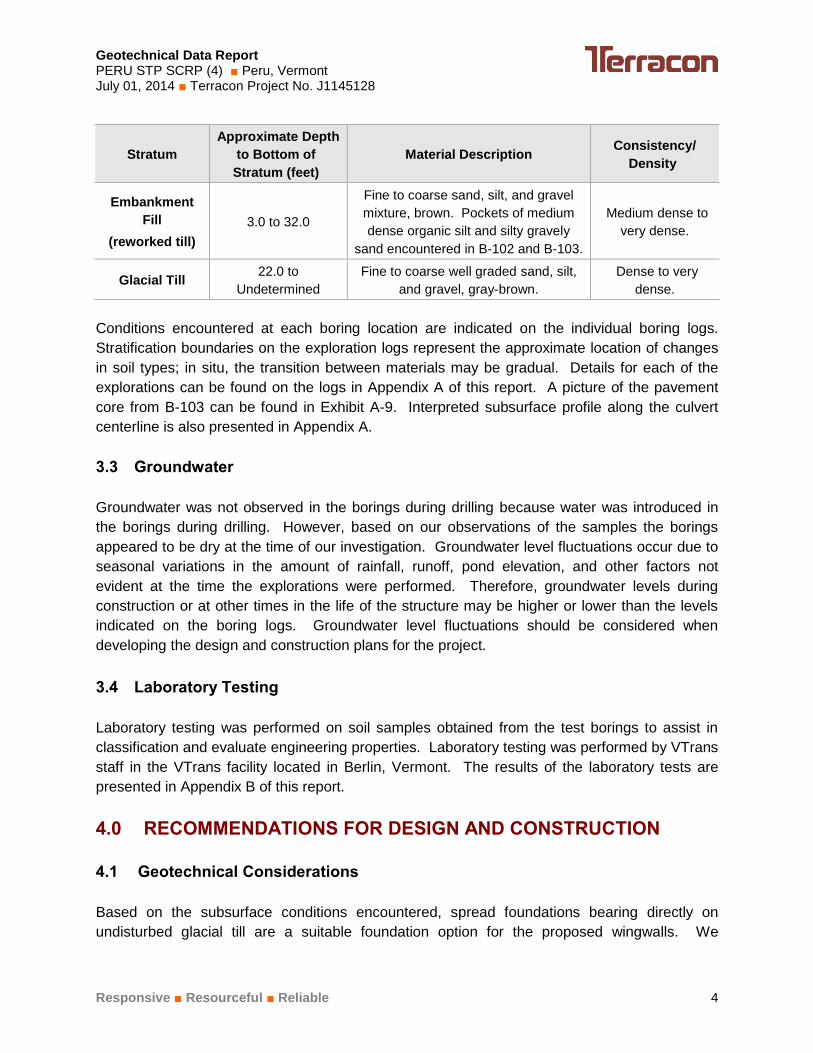
Geotechnical Data Report PERU STP SCRP (4) ■ Peru, Vermont July 01, 2014 ■ Terracon Project No. J1145128
Responsive ■ Resourceful ■ Reliable 4
Stratum
Approximate Depth
to Bottom of
Stratum (feet)
Material Description Consistency/
Density
Embankment
Fill
(reworked till)
3.0 to 32.0
Fine to coarse sand, silt, and gravel
mixture, brown. Pockets of medium
dense organic silt and silty gravely
sand encountered in B-102 and B-103.
Medium dense to
very dense.
Glacial Till 22.0 to
Undetermined
Fine to coarse well graded sand, silt,
and gravel, gray-brown.
Dense to very
dense.
Conditions encountered at each boring location are indicated on the individual boring logs.
Stratification boundaries on the exploration logs represent the approximate location of changes
in soil types; in situ, the transition between materials may be gradual. Details for each of the
explorations can be found on the logs in Appendix A of this report. A picture of the pavement
core from B-103 can be found in Exhibit A-9. Interpreted subsurface profile along the culvert
centerline is also presented in Appendix A.
3.3 Groundwater
Groundwater was not observed in the borings during drilling because water was introduced in
the borings during drilling. However, based on our observations of the samples the borings
appeared to be dry at the time of our investigation. Groundwater level fluctuations occur due to
seasonal variations in the amount of rainfall, runoff, pond elevation, and other factors not
evident at the time the explorations were performed. Therefore, groundwater levels during
construction or at other times in the life of the structure may be higher or lower than the levels
indicated on the boring logs. Groundwater level fluctuations should be considered when
developing the design and construction plans for the project.
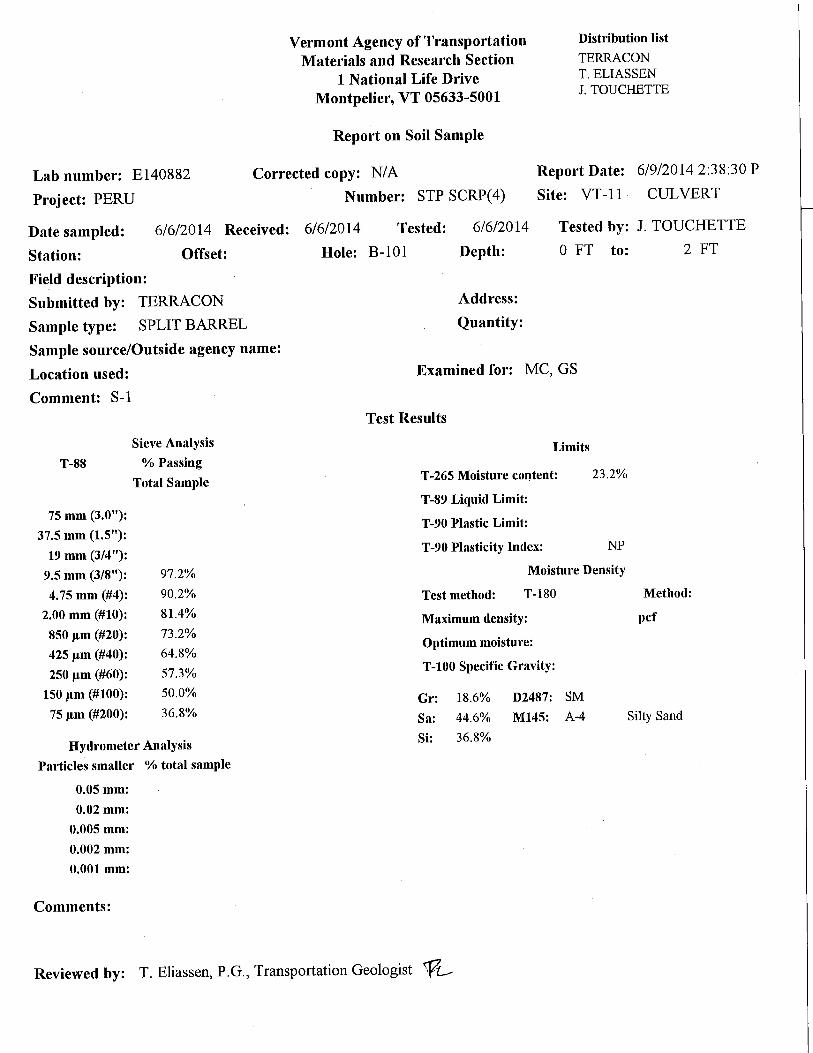
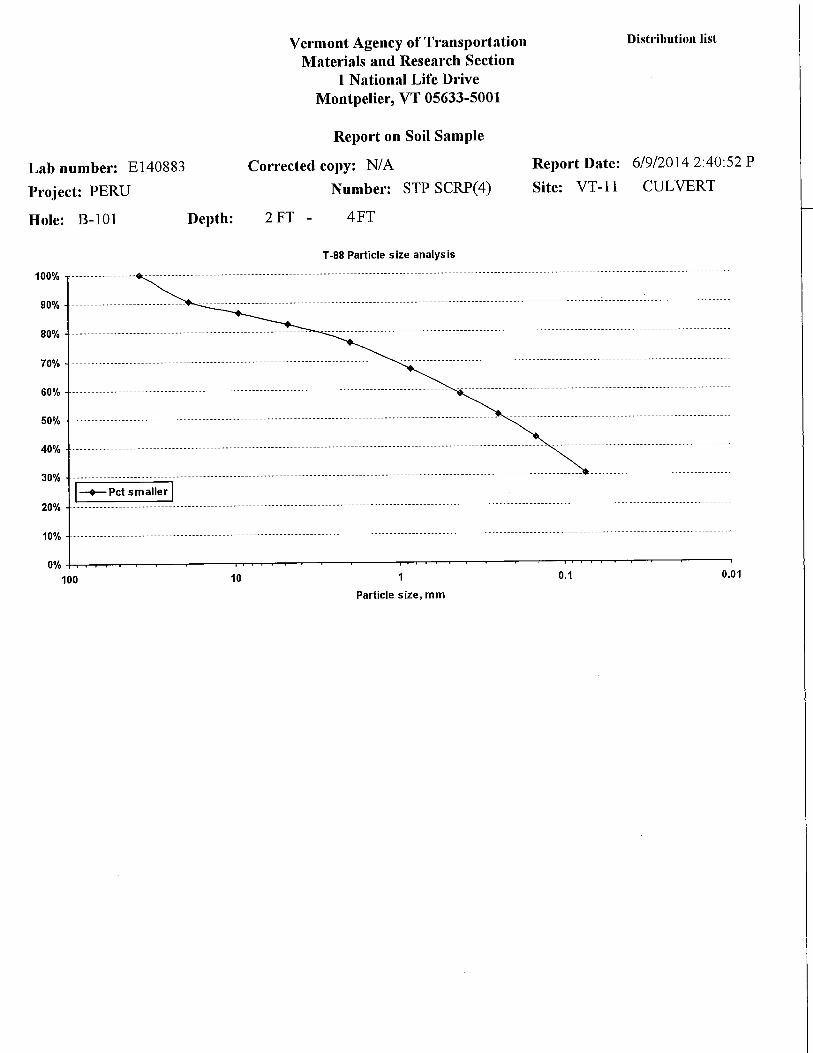
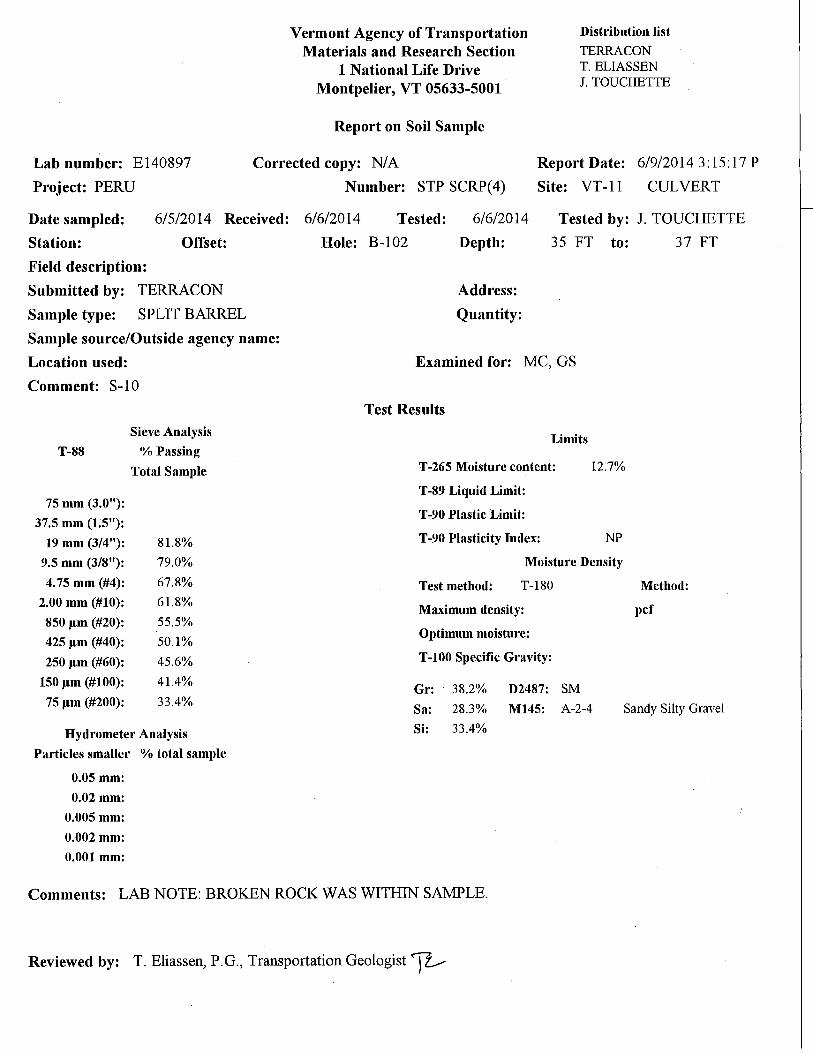
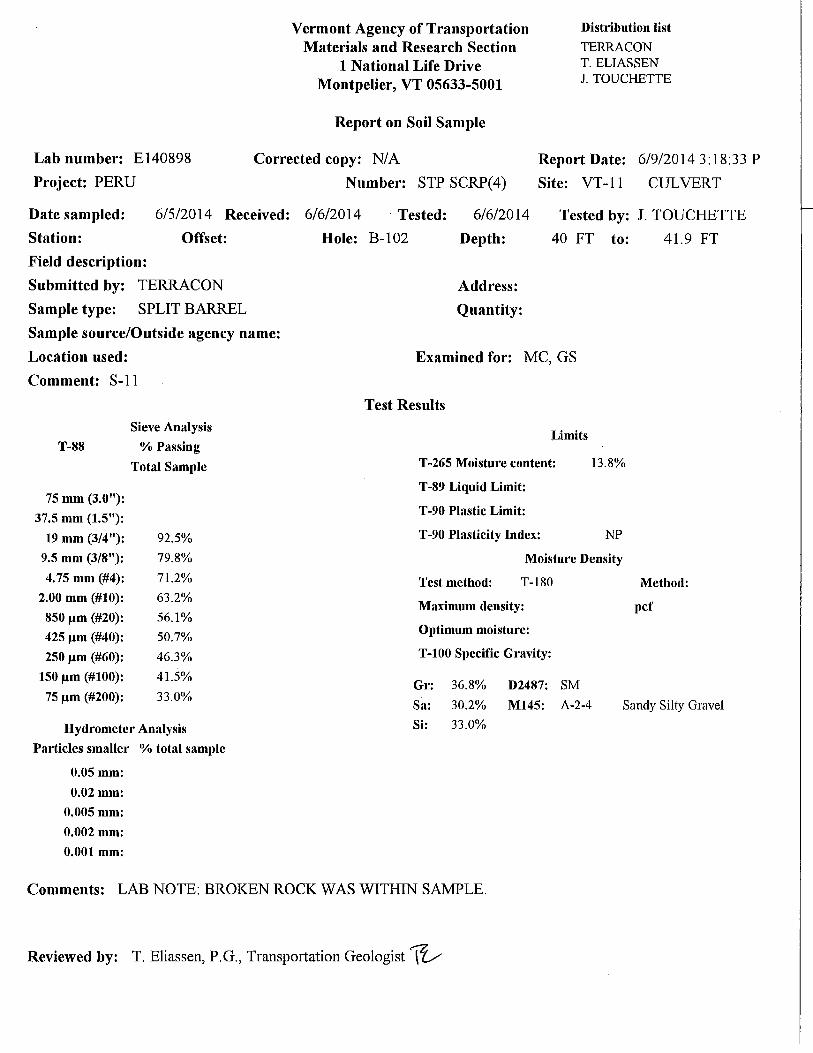
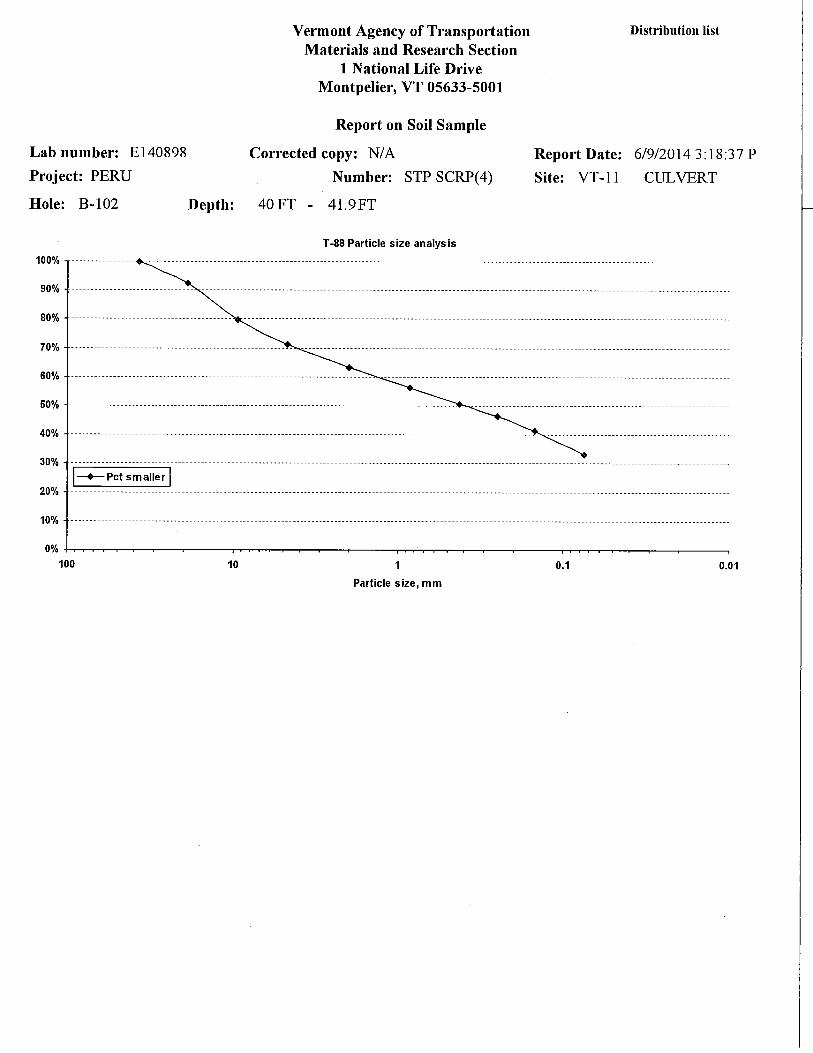
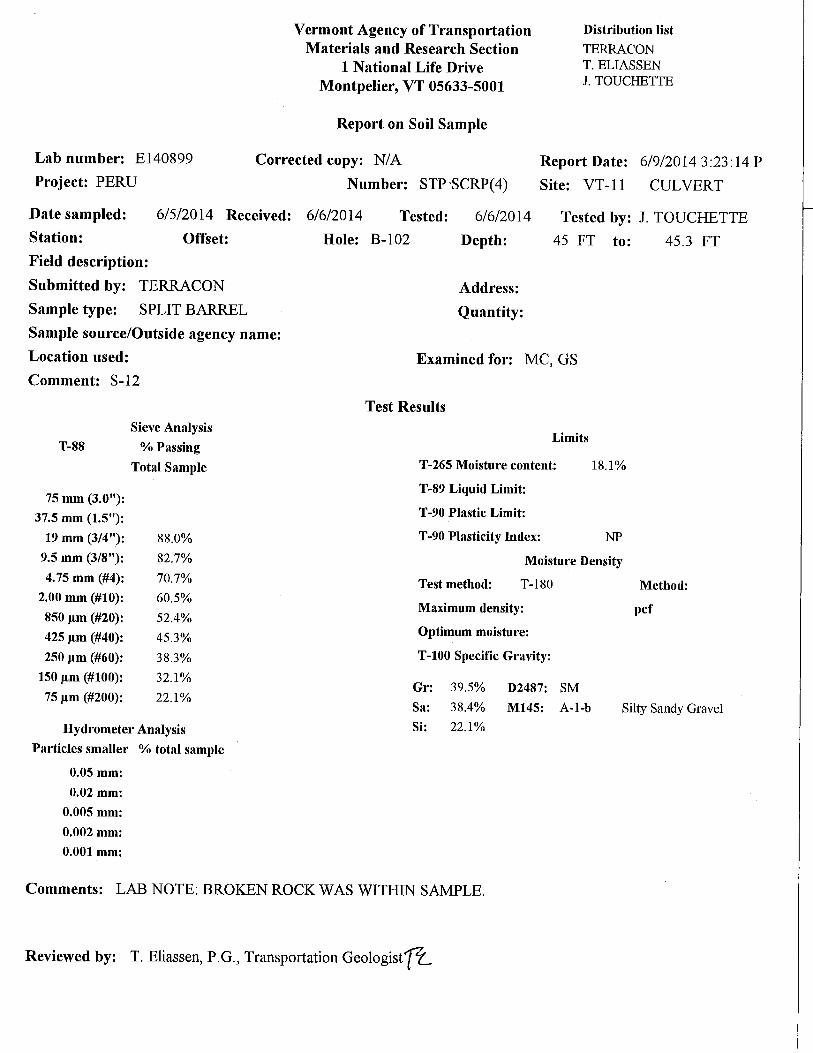
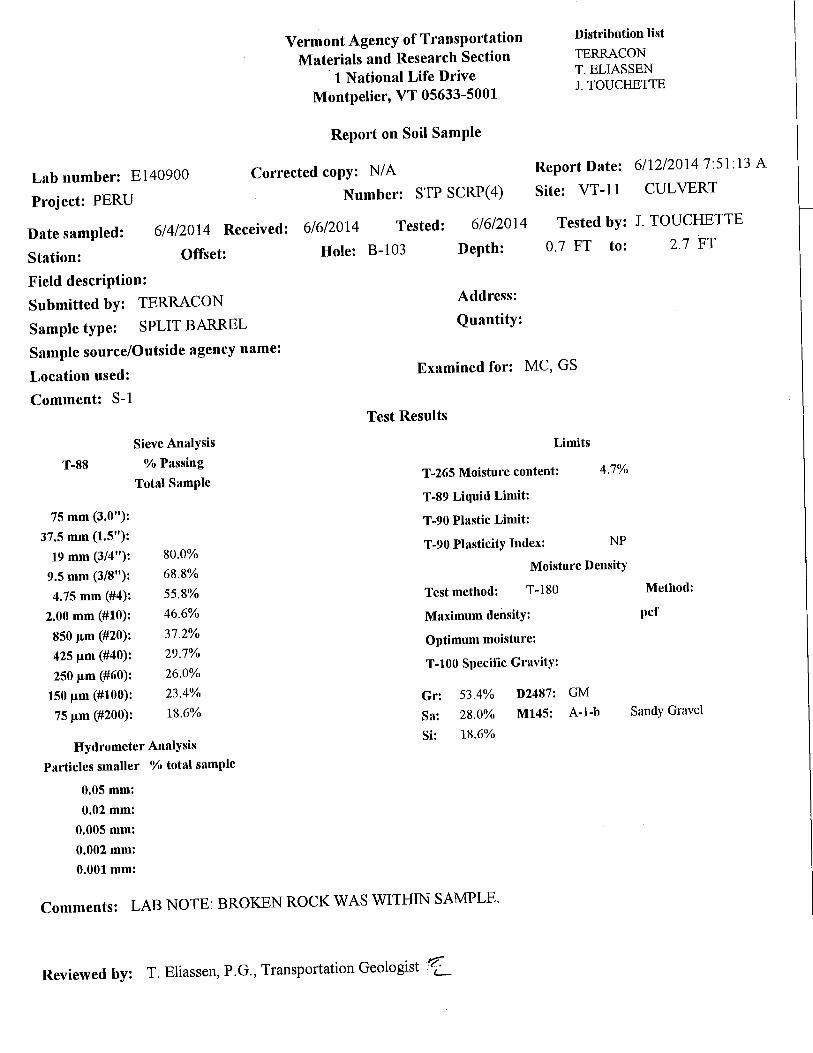
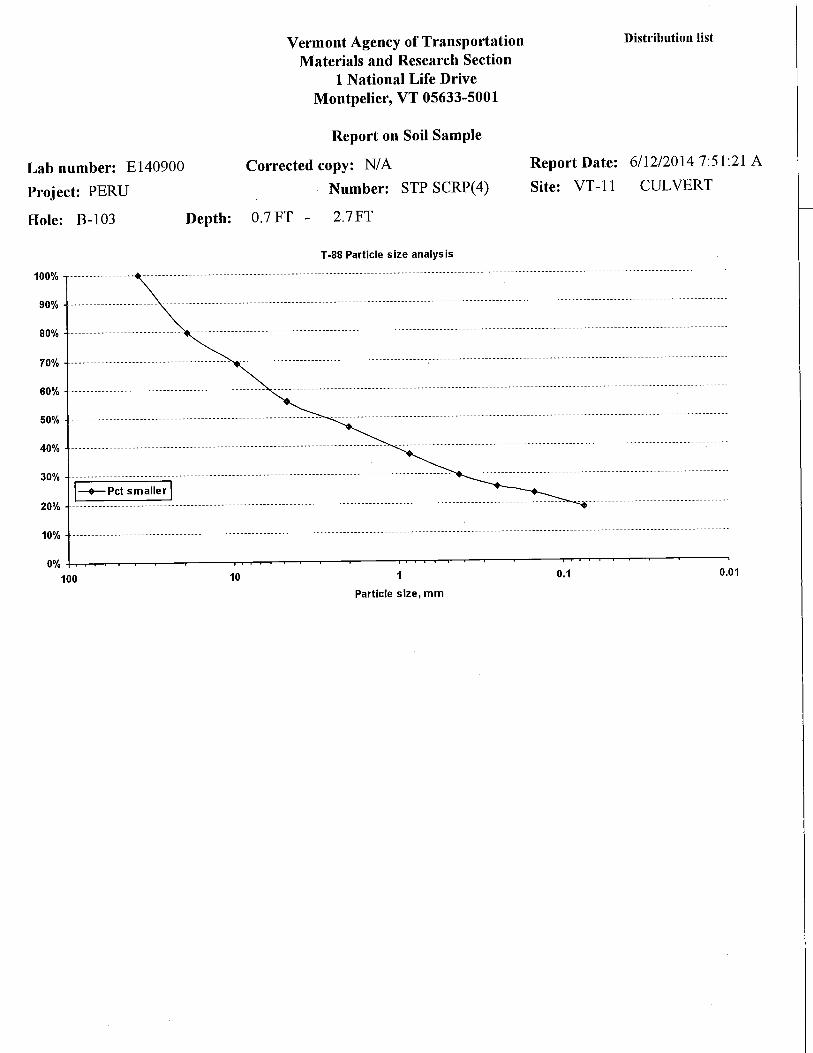
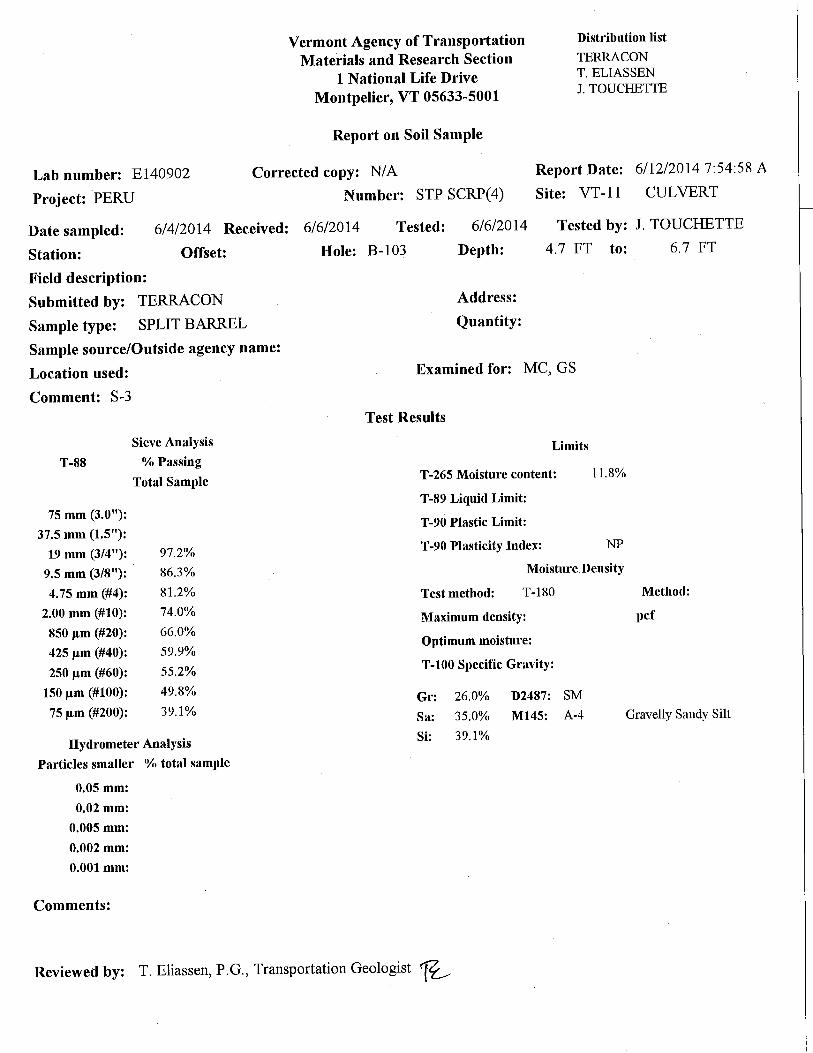
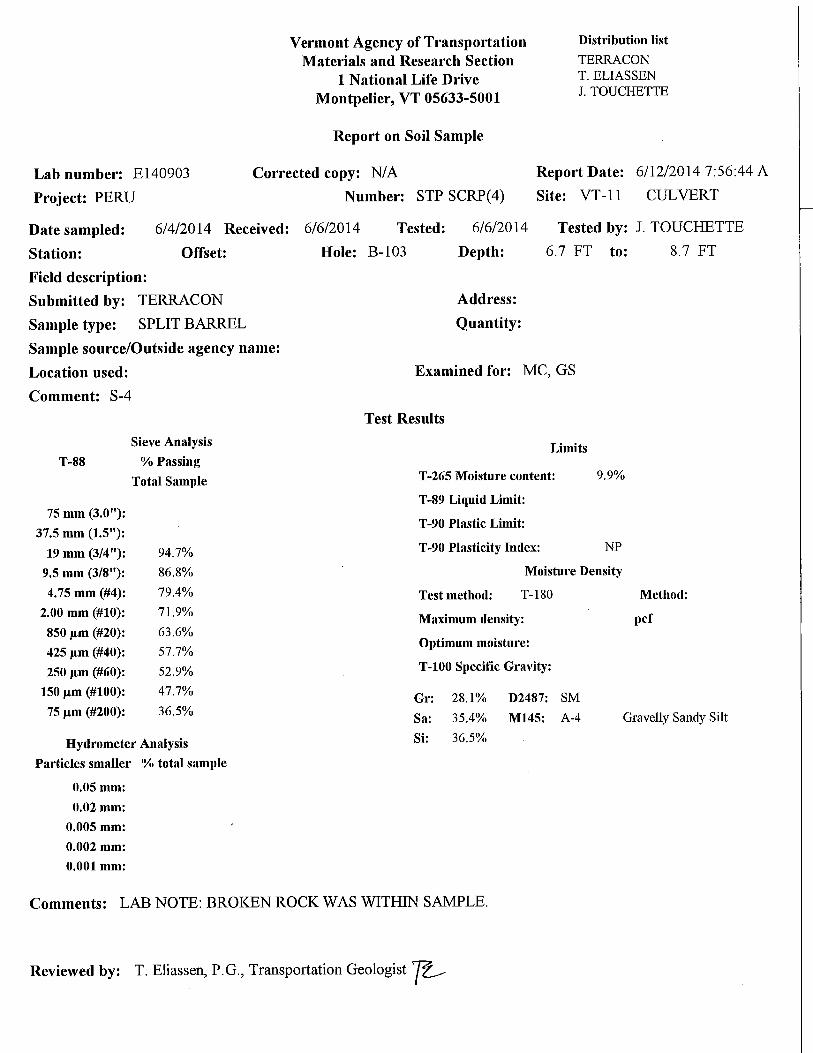
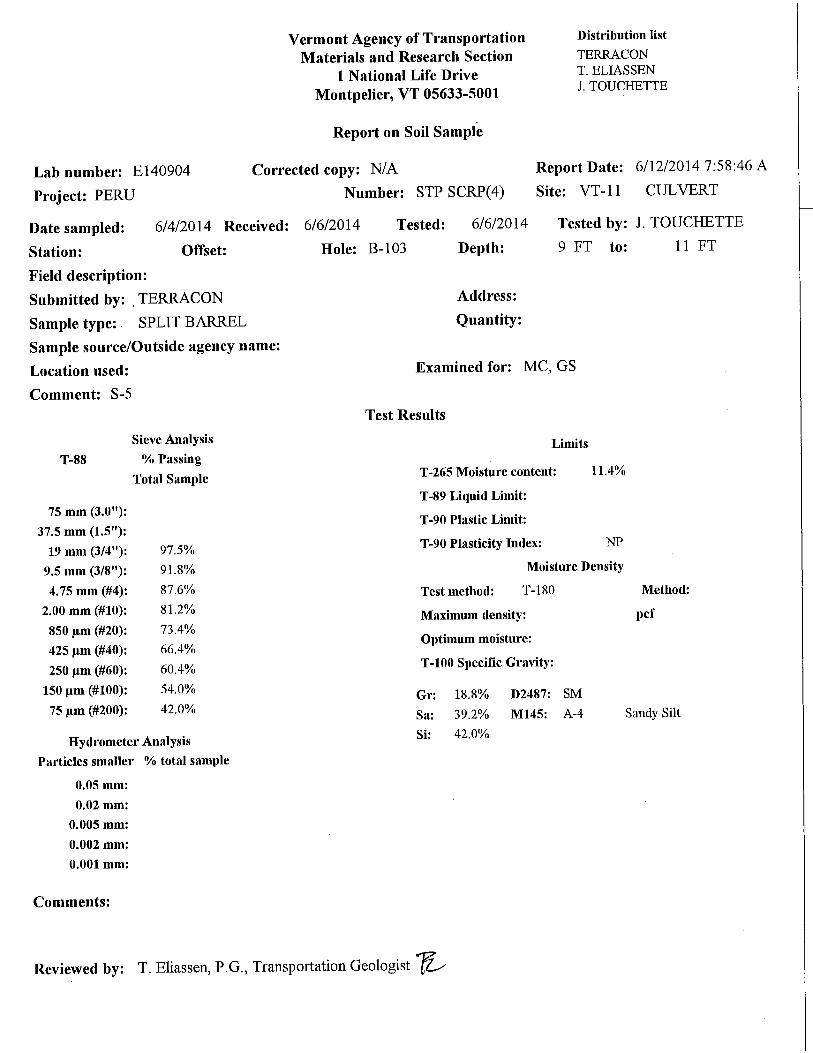
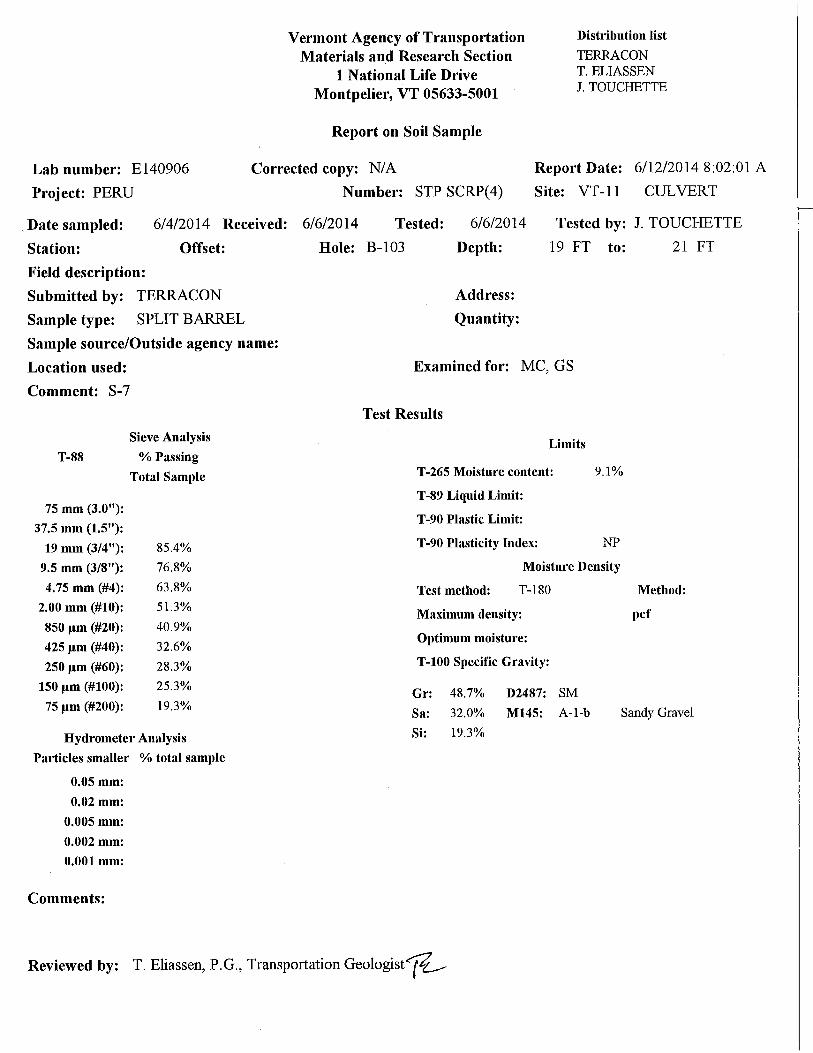
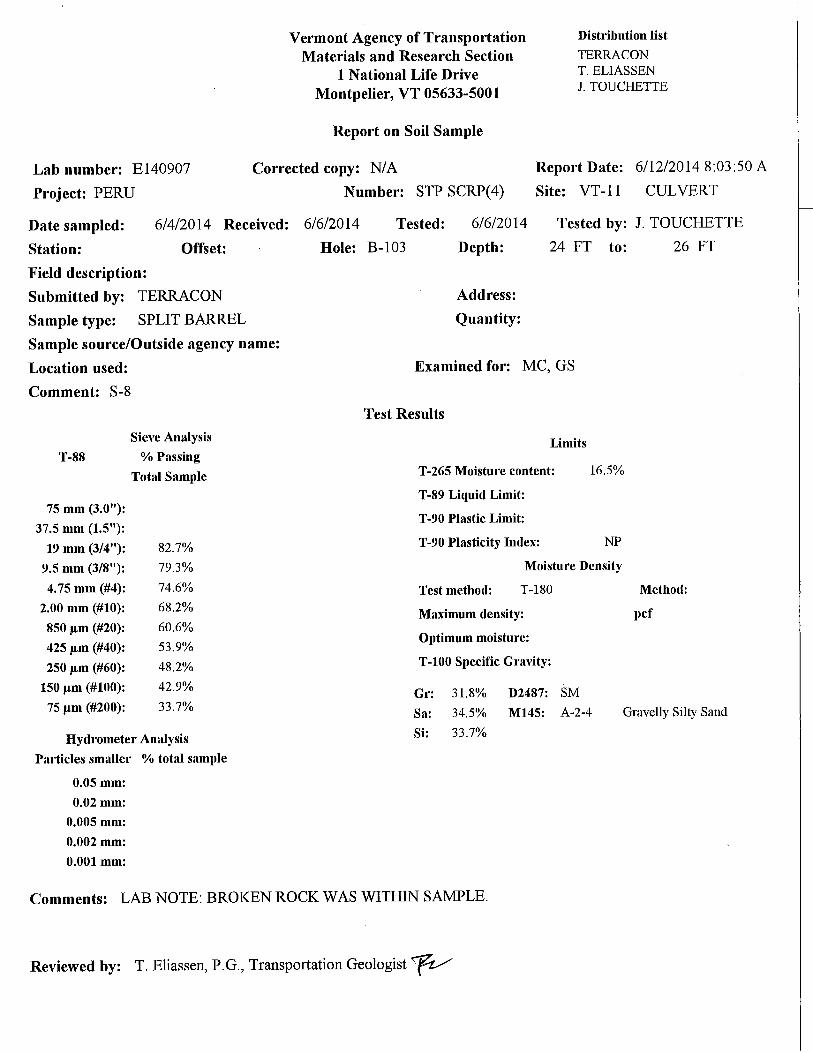
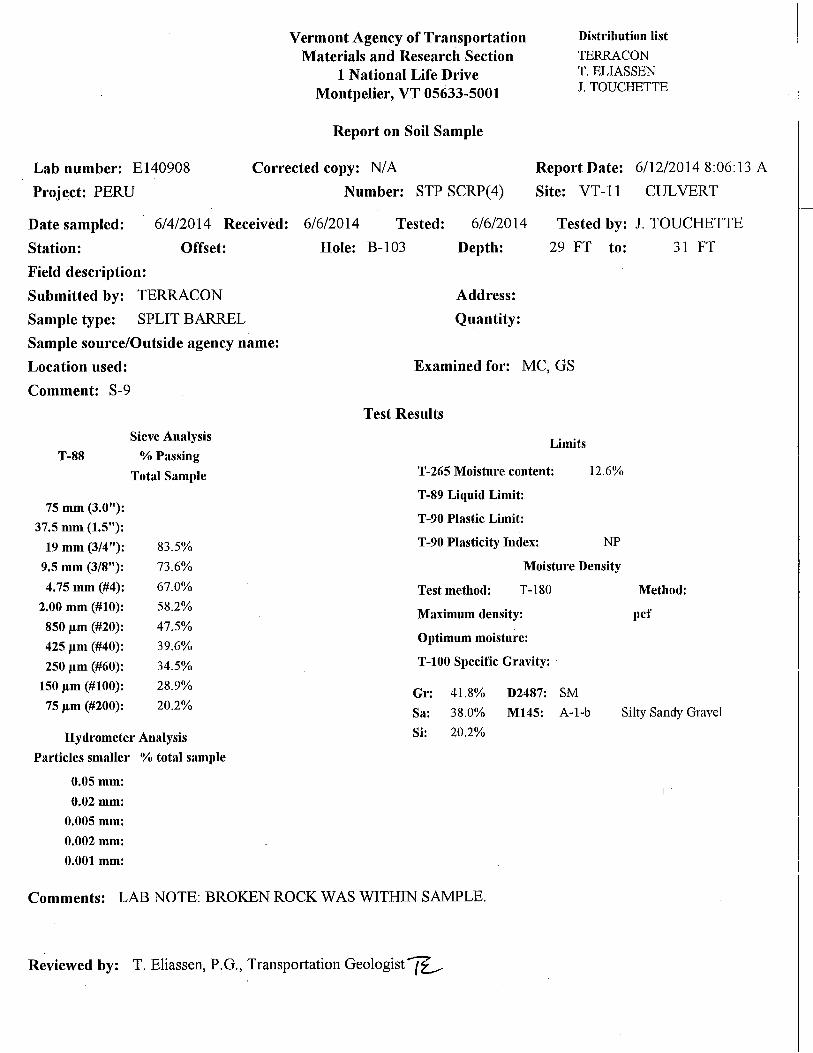
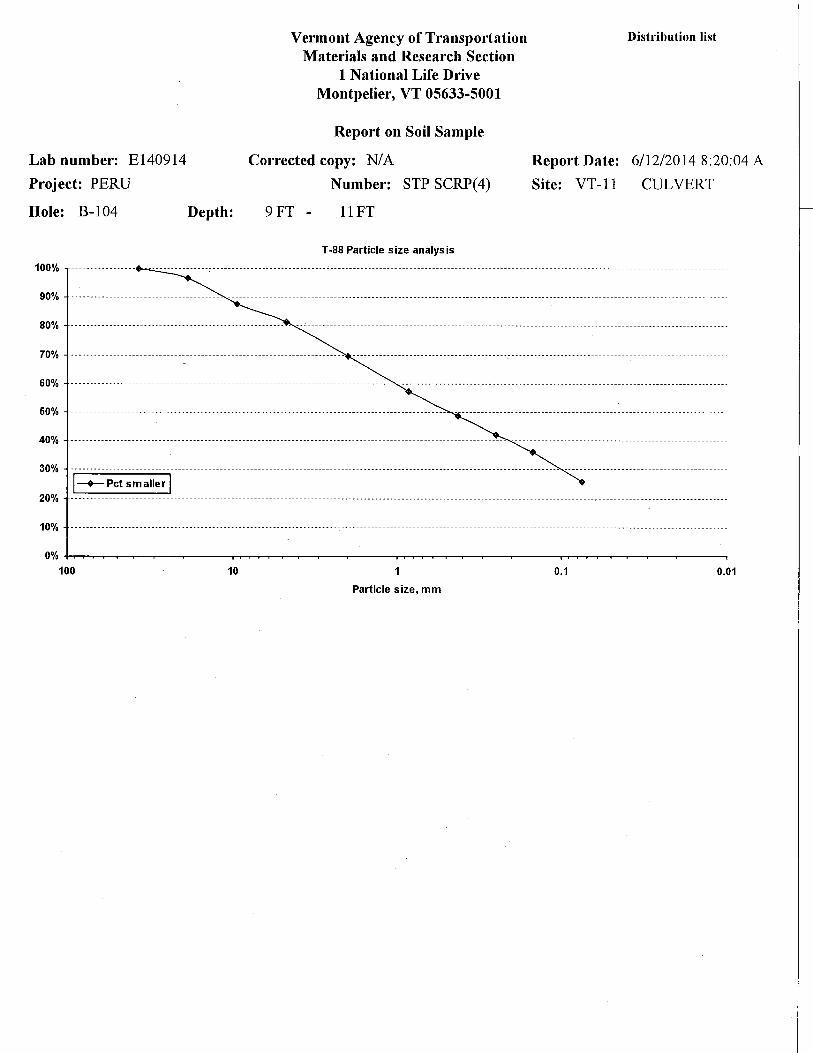
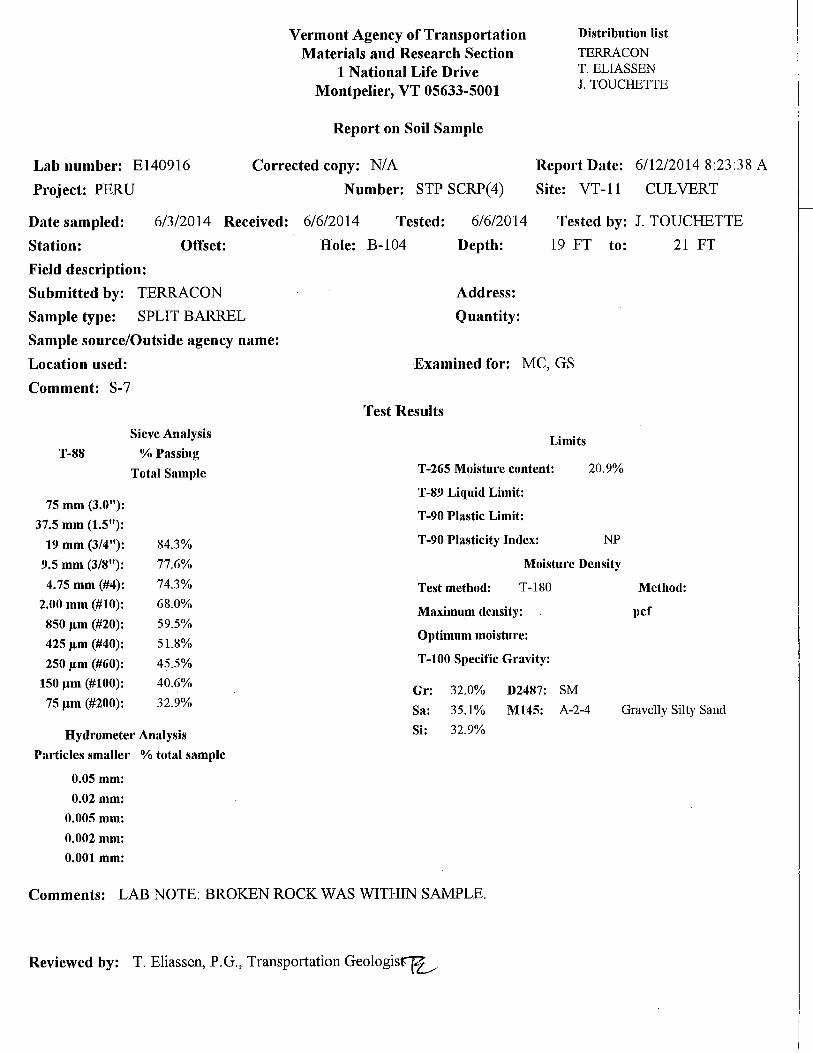
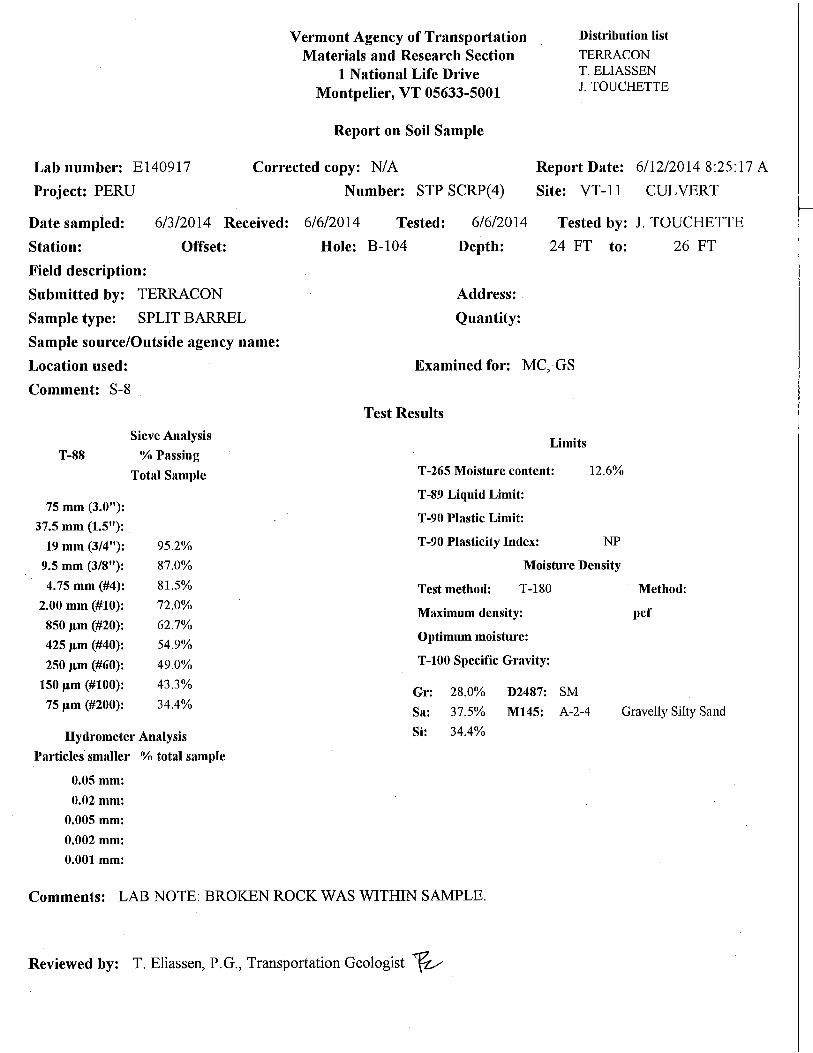
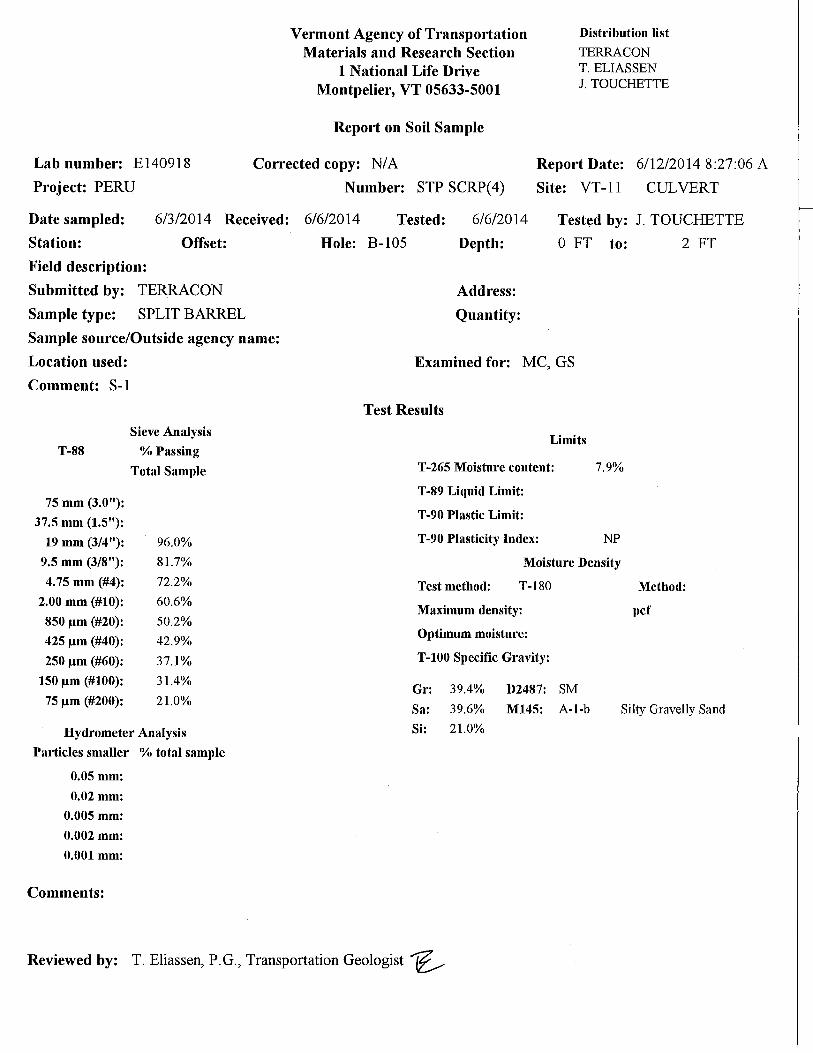
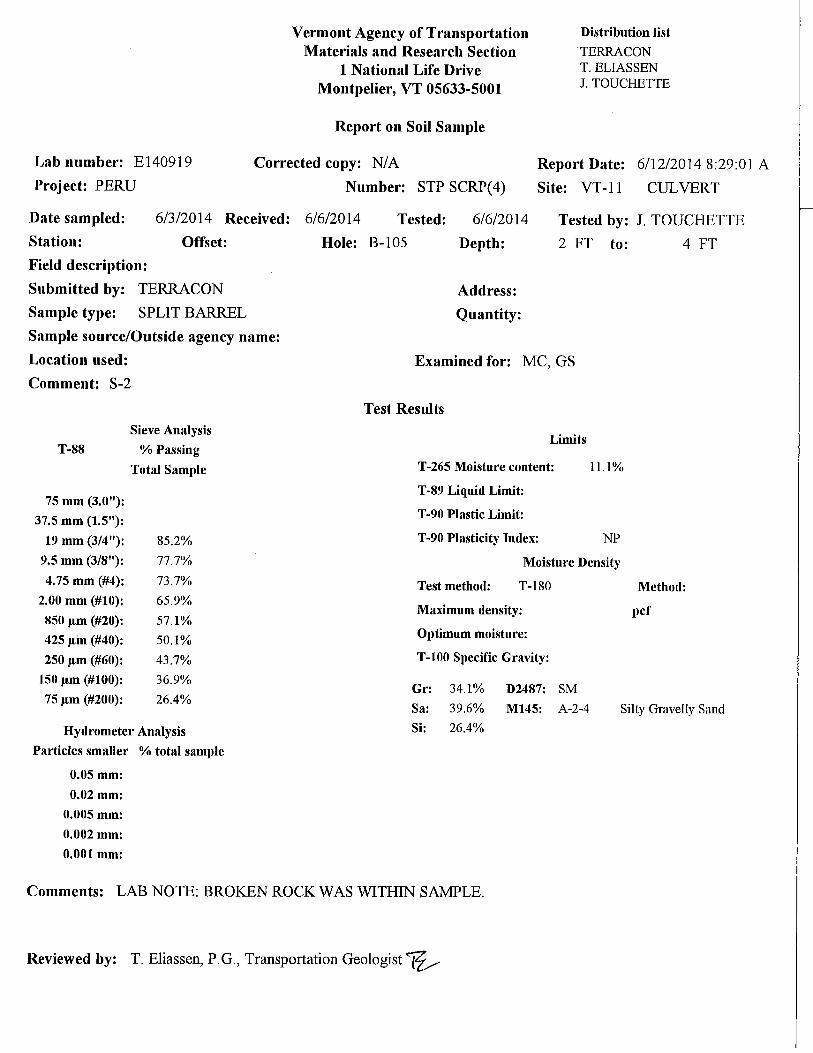
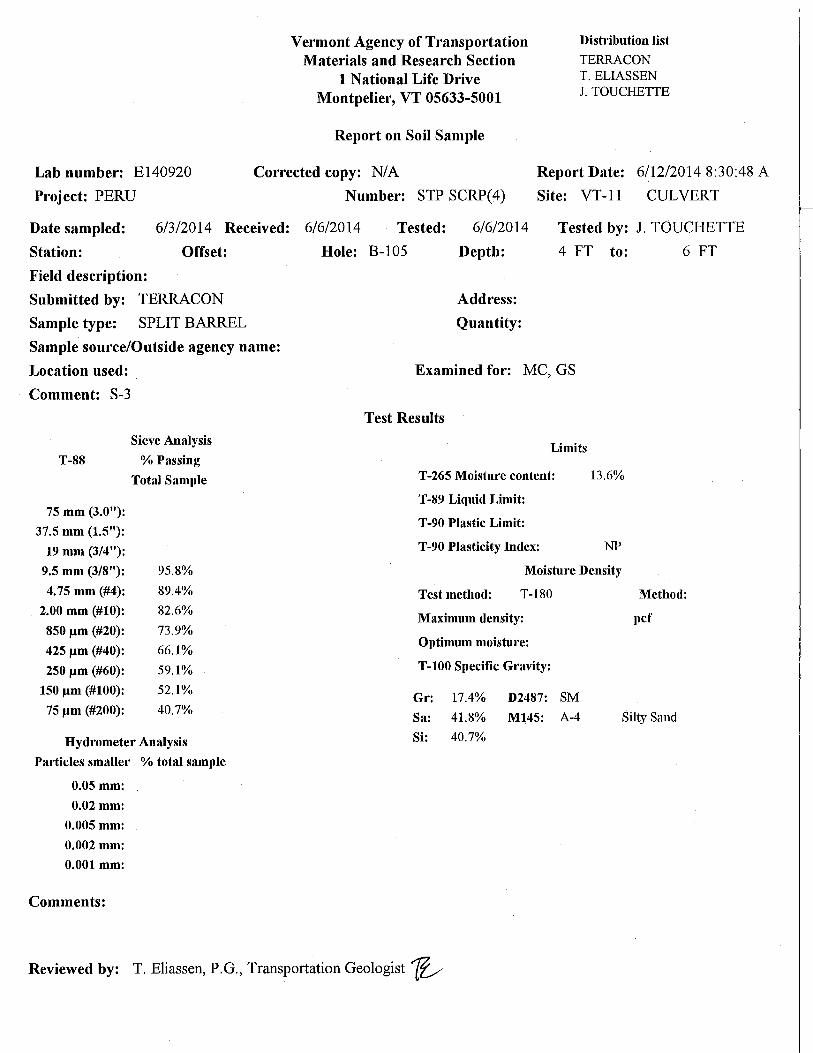
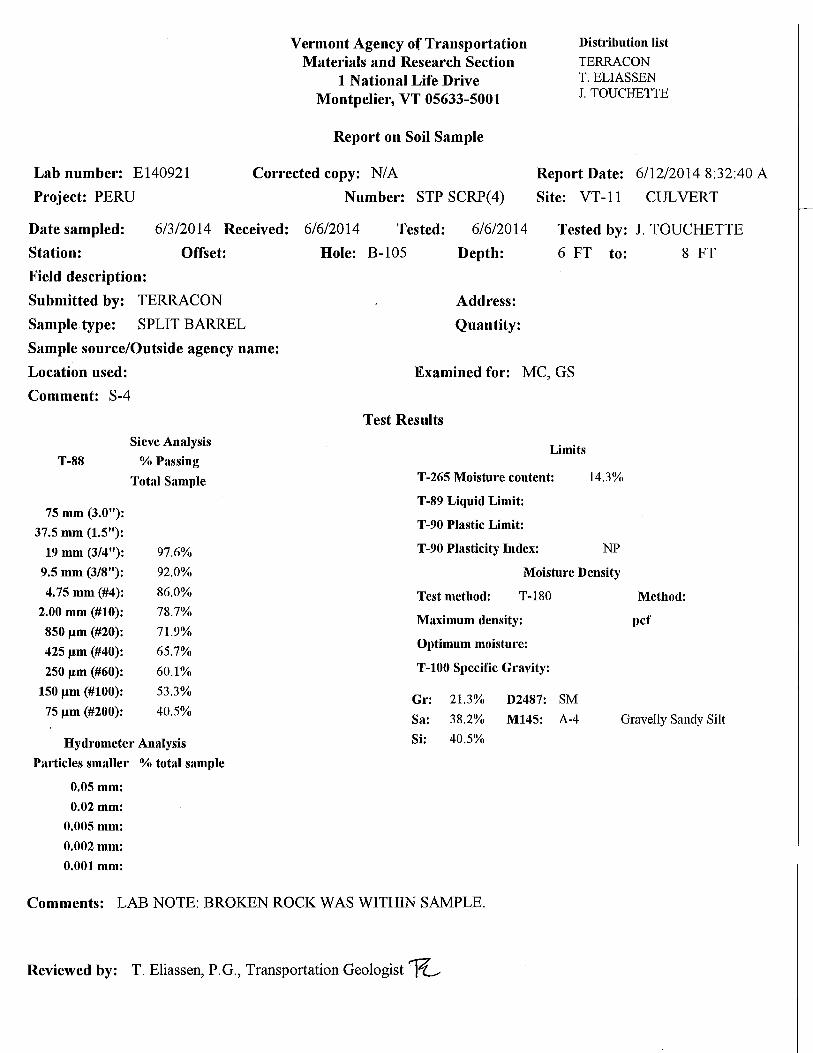
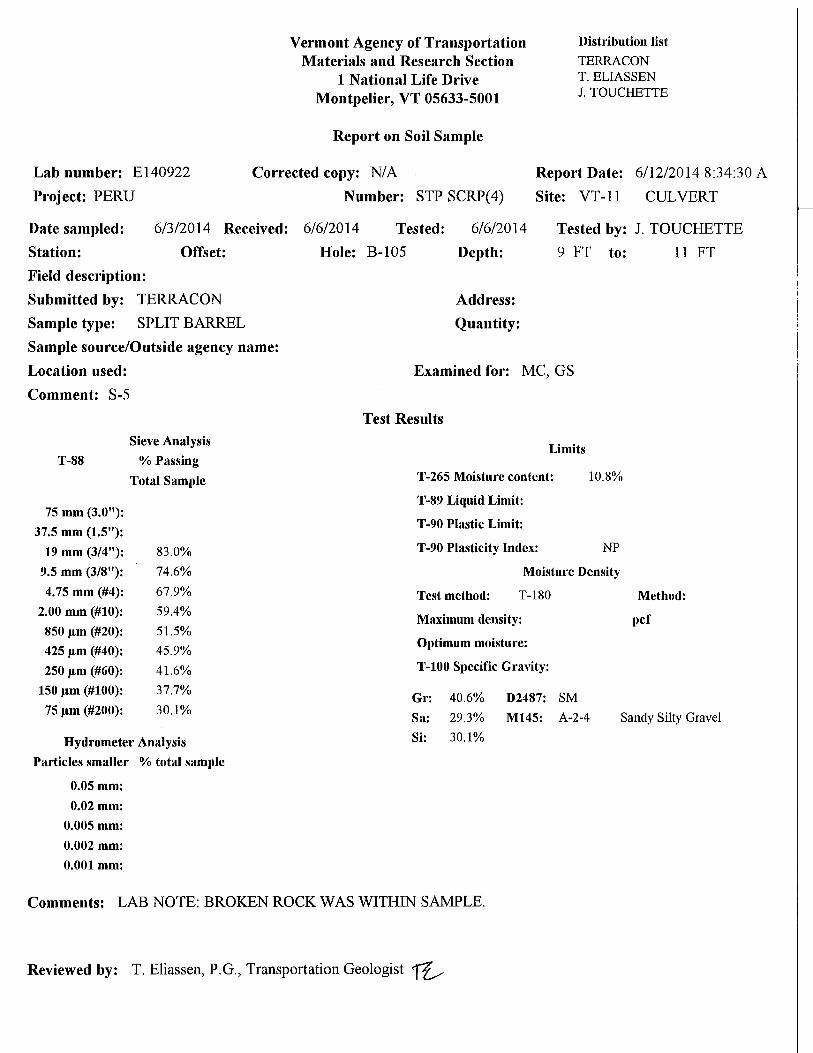
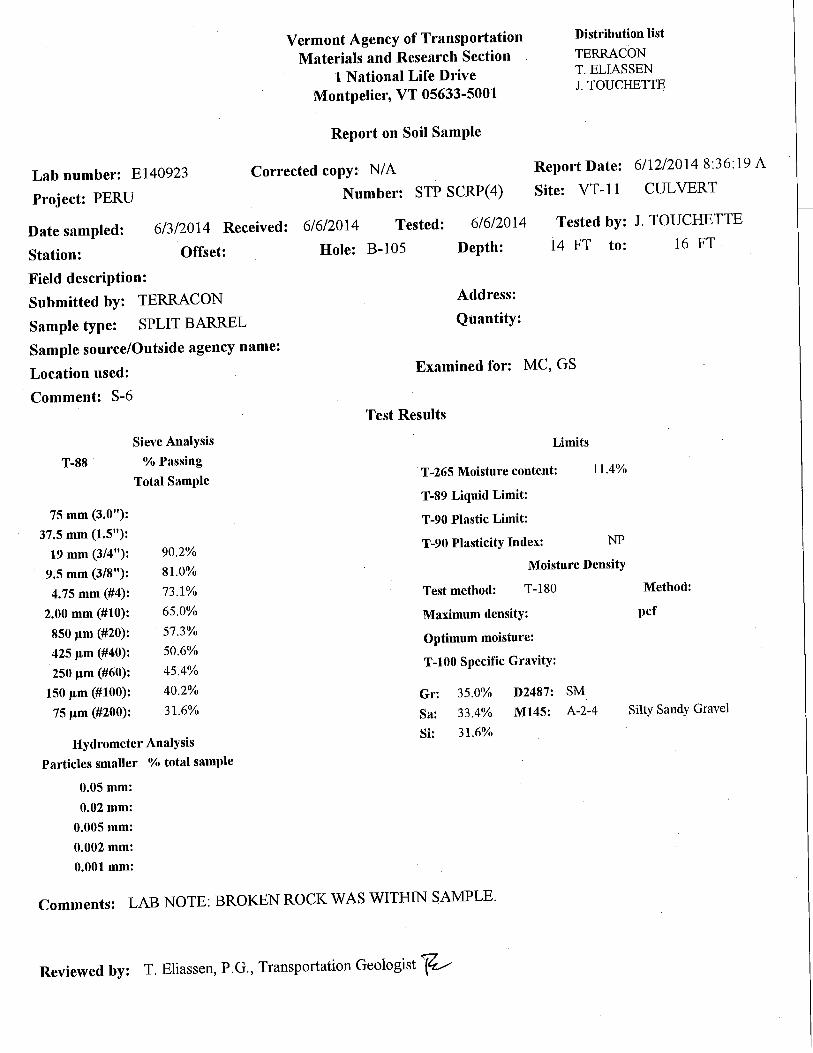
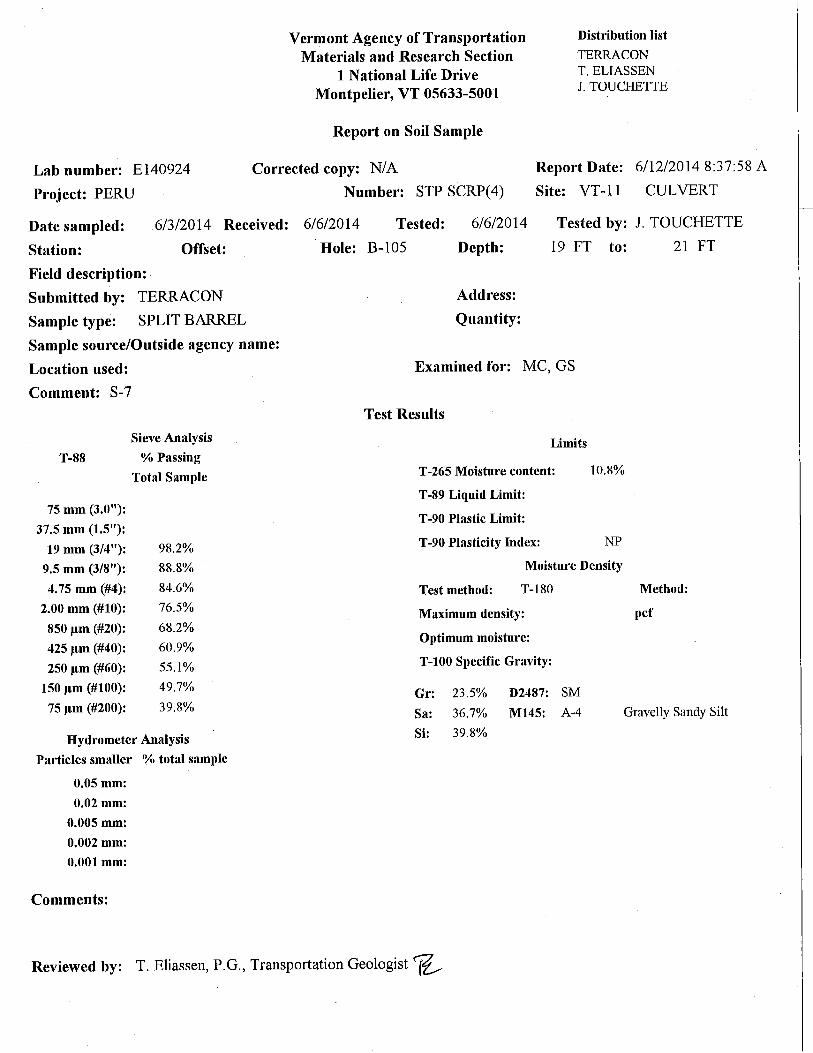
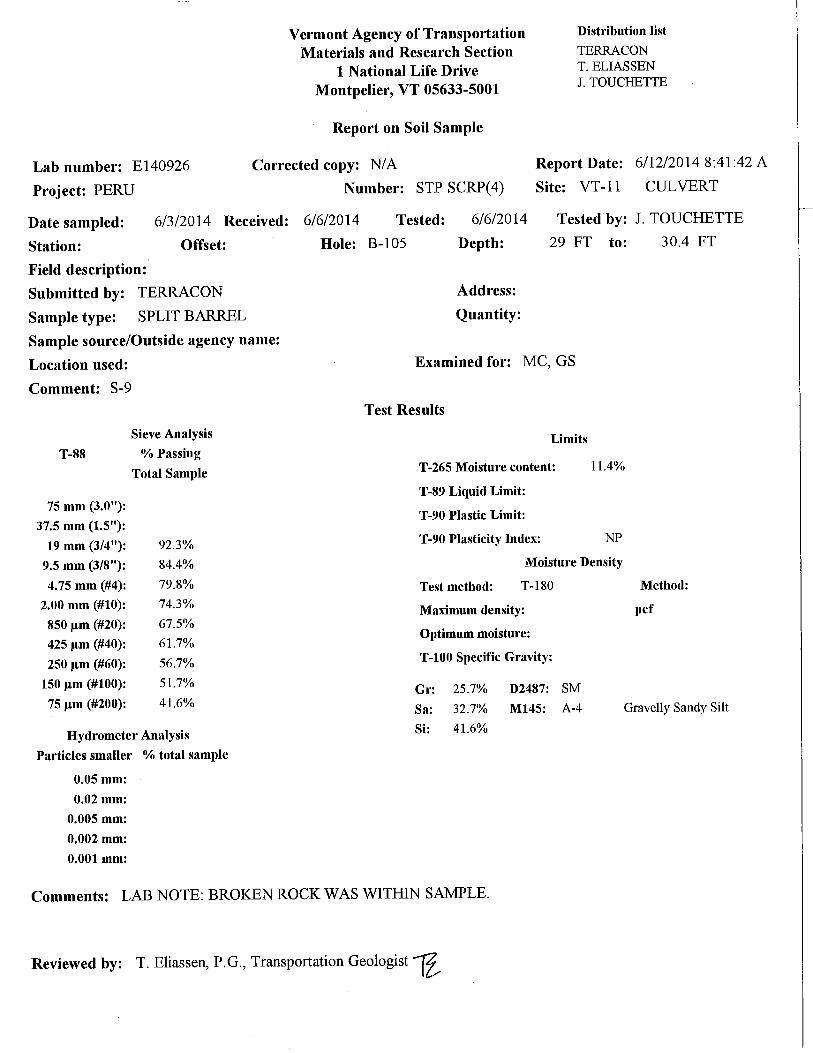
3.4 Laboratory Testing
Laboratory testing was performed on soil samples obtained from the test borings to assist in
classification and evaluate engineering properties. Laboratory testing was performed by VTrans
staff in the VTrans facility located in Berlin, Vermont. The results of the laboratory tests are
presented in Appendix B of this report.
4.0 RECOMMENDATIONS FOR DESIGN AND CONSTRUCTION
4.1 Geotechnical Considerations
Based on the subsurface conditions encountered, spread foundations bearing directly on
undisturbed glacial till are a suitable foundation option for the proposed wingwalls. We
Geotechnical Data Report PERU STP SCRP (4) ■ Peru, Vermont July 01, 2014 ■ Terracon Project No. J1145128
Responsive ■ Resourceful ■ Reliable 5
recommend a geotechnical engineer evaluate the exposed subgrades after excavation to
proposed grade before placing concrete, or lean concrete fill. The recommendations for
foundation design presented herein were developed using the 2012 American Association of
State Highway and Transportation Officials (AASHTO) LRFD Bridge Design Specifications with
Interim Revisions.
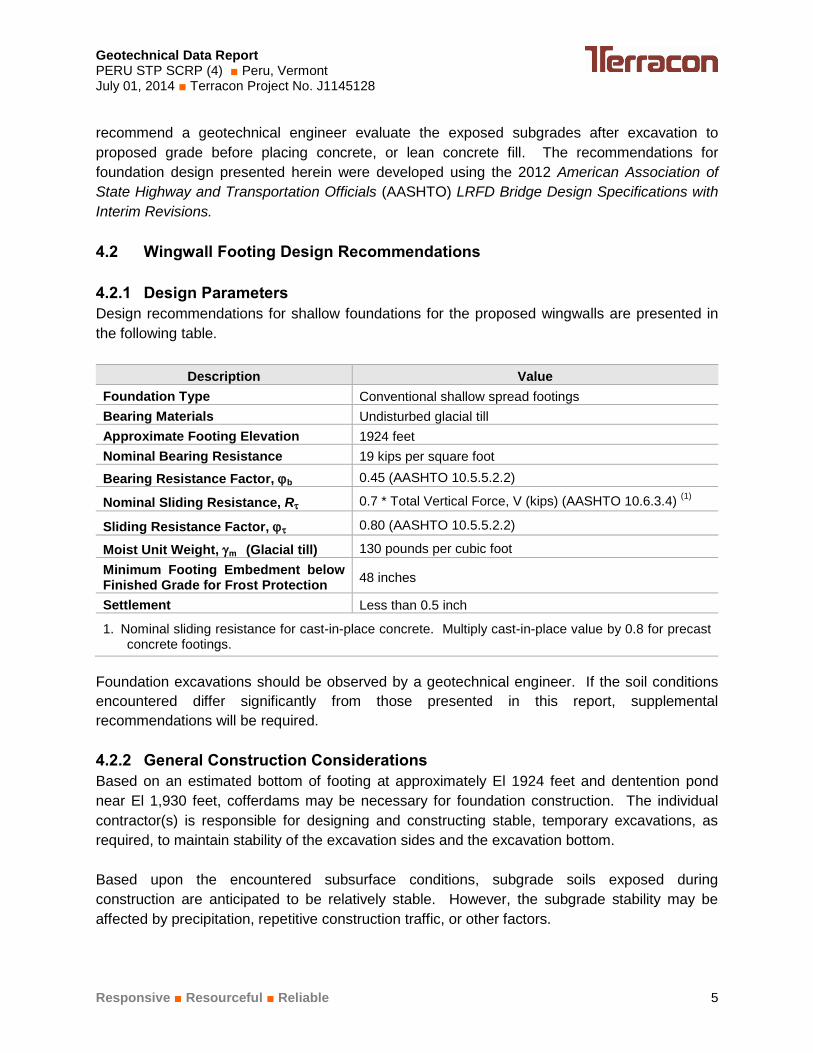
4.2 Wingwall Footing Design Recommendations
4.2.1 Design Parameters
Design recommendations for shallow foundations for the proposed wingwalls are presented in
the following table.
Description Value
Foundation Type Conventional shallow spread footings
Bearing Materials Undisturbed glacial till
Approximate Footing Elevation 1924 feet
Nominal Bearing Resistance 19 kips per square foot
Bearing Resistance Factor, b 0.45 (AASHTO 10.5.5.2.2)
Nominal Sliding Resistance, R 0.7 * Total Vertical Force, V (kips) (AASHTO 10.6.3.4) (1)
Sliding Resistance Factor, 0.80 (AASHTO 10.5.5.2.2)
Moist Unit Weight, m (Glacial till) 130 pounds per cubic foot
Minimum Footing Embedment below Finished Grade for Frost Protection
48 inches
Settlement Less than 0.5 inch
1. Nominal sliding resistance for cast-in-place concrete. Multiply cast-in-place value by 0.8 for precast concrete footings.
Foundation excavations should be observed by a geotechnical engineer. If the soil conditions
encountered differ significantly from those presented in this report, supplemental
recommendations will be required.
4.2.2 General Construction Considerations
Based on an estimated bottom of footing at approximately El 1924 feet and dentention pond
near El 1,930 feet, cofferdams may be necessary for foundation construction. The individual
contractor(s) is responsible for designing and constructing stable, temporary excavations, as
required, to maintain stability of the excavation sides and the excavation bottom.
Based upon the encountered subsurface conditions, subgrade soils exposed during
construction are anticipated to be relatively stable. However, the subgrade stability may be
affected by precipitation, repetitive construction traffic, or other factors.
Geotechnical Data Report PERU STP SCRP (4) ■ Peru, Vermont July 01, 2014 ■ Terracon Project No. J1145128
Responsive ■ Resourceful ■ Reliable 6
Construction dewatering should be anticipated for foundation construction. The contractor
should select a dewatering method to facilitate footing construction. The use of a crushed stone
layer above the glacial till may facilitate dewatering and protect the till subgrade. Crushed
stone, if used, should be underlain by a geotextile filter such as Mirafi 160N.
4.3 Global Stability Analyses
4.3.1 Assumptions
The site currently slopes from approximately El 1,994 feet at the resort parking lot and Route 11
to EL 1928 at the detention pond. The slope is approximately 150 feet long and is overall
inclined at about 2.5 horizontal (H) to 1 vertical (V). The existing slope is segmented by two
benches within the existing slope with steeper middle slope.
Global stability analyses were performed for the proposed wing wall geometry to evaluate the
stability of the overall slope. Our stability analyses were performed using ground surface
contours depicted on the site plan provided by VAOT. Soil strength parameters and
groundwater conditions were estimated from test boring data and laboratory test results. A
uniform surcharge load equal to 250 pounds per square foot (psf) was incorporated into the
global stability analyses for construction loading.
The existing conditions were modeled using the SLIDE Version 5.0 software. The computer
program analyzes the stability of a slope using a two-dimensional, limit-equilibrium method.
Limit-equilibrium method of slices is used to compute the Factor of Safety (FS) against slope
failure under normal loading conditions.
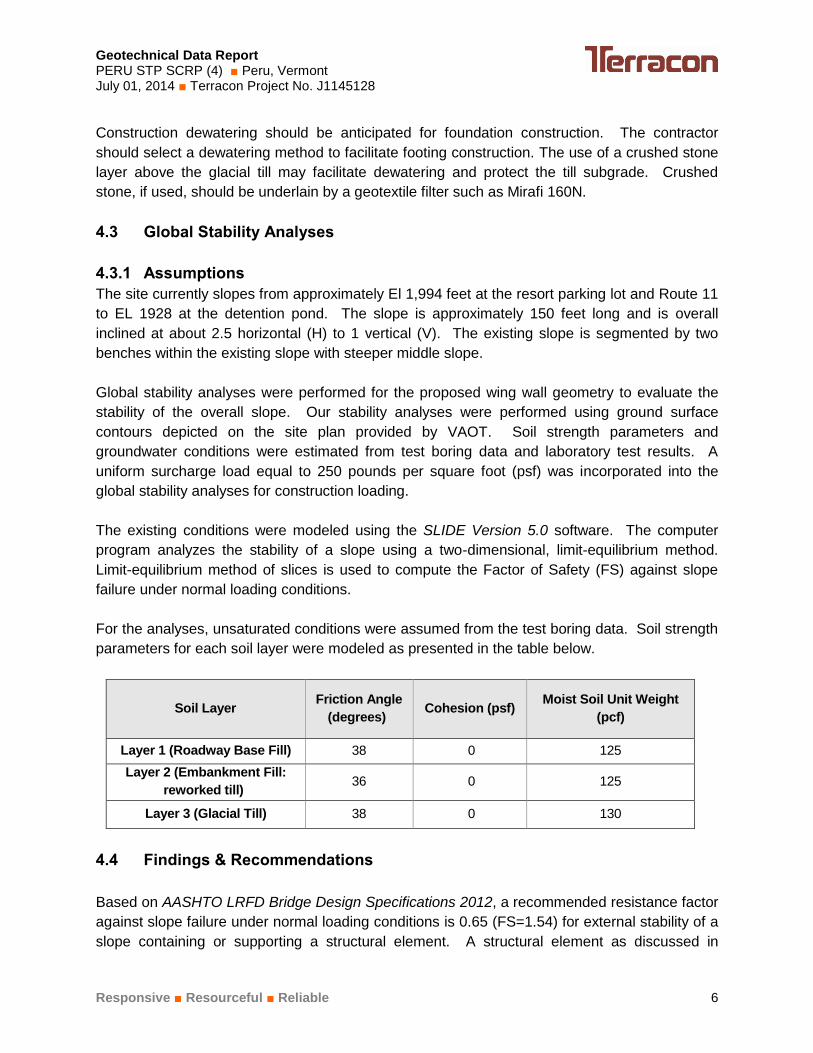
For the analyses, unsaturated conditions were assumed from the test boring data. Soil strength
parameters for each soil layer were modeled as presented in the table below.
Soil Layer Friction Angle
(degrees) Cohesion (psf)
Moist Soil Unit Weight
(pcf)
Layer 1 (Roadway Base Fill) 38 0 125
Layer 2 (Embankment Fill:
reworked till) 36 0 125
Layer 3 (Glacial Till) 38 0 130
4.4 Findings & Recommendations
Based on AASHTO LRFD Bridge Design Specifications 2012, a recommended resistance factor
against slope failure under normal loading conditions is 0.65 (FS=1.54) for external stability of a
slope containing or supporting a structural element. A structural element as discussed in
Geotechnical Data Report PERU STP SCRP (4) ■ Peru, Vermont July 01, 2014 ■ Terracon Project No. J1145128
Responsive ■ Resourceful ■ Reliable 7
AASHTO C11-6.2.3 would be a bridge or pipe arch foundation, a building foundation, a
pipeline, a critical utility or a retaining wall. In our opinion, the culvert headwall is a type of
retaining wall and therefore we recommend use of resistance factor of 0.65 (FS=1.54) for
external stability.
Our global stability analyses indicated the primary mode of failure is a relatively shallow circular
failure surface extending from mid-slope to the toe of the slope and beneath the headwall
foundation. Our analyses indicates a resistance factor of 0.65 (FS=1.54) against slope failure
under construction loading conditions for the proposed slope configuration. A plot of the critical
failure surface as well as the soil properties are shown in Appendix C.
Since the existing slope configuration appears suitable, we recommend final ground surface
contours above the proposed culvert be restored and surface water at the top of the slope be
diverted away from the slope. Disturbed or removed vegetation should be replaced with similar
vegetation to provide erosion protection. The finished slope near the detention pond should
also be restored with riprap similar to the riprap currently in place.
5.0 GENERAL COMMENTS
The interpretations presented in this report are based upon the data obtained from the borings
performed at the indicated locations and from other information discussed in this report. This
report does not reflect variations that may occur between borings, across the site, or due to the
modifying effects of construction or weather. The nature and extent of such variations may not
become evident until during or after construction. If variations appear, we should be
immediately notified so that further evaluation and supplemental recommendations can be
provided.
The scope of services for this project does not include either specifically or by implication any
environmental or biological (e.g., mold, fungi, bacteria) assessment of the site or identification or
prevention of pollutants, hazardous materials or conditions. If the owner is concerned about the
potential for such contamination or pollution, other studies should be undertaken.
This report has been prepared for the exclusive use of our client for specific application to the
project discussed and has been prepared in accordance with generally accepted geotechnical
engineering practices. No warranties, either express or implied, are intended or made. Site
safety, excavation support, and dewatering requirements are the responsibility of others. In the
event that changes in the nature, design, or location of the project as outlined in this report are
planned, the conclusions and recommendations contained in this report shall not be considered
valid unless Terracon reviews the changes and either verifies or modifies the conclusions of this
report in writing.
APPENDIX A
FIELD EXPLORATION
43
25
B-101
23
11
- TEST BORING DESIGNATION
- SPT N VALUE
- OBSERVED WATER LEVEL
LEGEND:
ELEVATION
OFFSET
BOE- BOTTOM OF EXPLORATION
- STRATUM OR SUBSTRATUM CHANGE
77 Sundial Ave. Manchester, NH 03103PH. (603)647-9700 FAX (603) 647-4432
BORING STATION (ft) OFFSET (ft) NORTHING (ft) EASTING (ft)
B-101 10+28.6 3.0L 9936.08 50213.63
B-102 10+75.4 4.0L 10003.10 50224.48
B-103 11+84.4 0.0R 10089.25 50229.26
B-104 13+11.8 0.0R 10216.83 50183.59
B-105 14+25.0 1.1R 10298.35 50147.43
BORING CHART
B-101
- SOIL BORING LOCATION
Geotechnical Data Report PERU STP SCRP (4) ■ Peru, Vermont July 01, 2014 ■ Terracon Project No. J1145128
Responsive ■ Resourceful ■ Reliable Exhibit A-3
Field Exploration Description
Five test borings were completed at the site on June 3, 2014 through June 6, 2014 and monitored
by Terracon personnel. Borings were advanced using an all-terrain vehicle and truck mounted
rotary drill rig and a truck mounted rotary drill rigs, owned and operated by New Hampshire Boring
Inc. of Derry, New Hampshire. Borings (B-1 through B-5) were advanced to depths ranging from
approximately 22 to 45 feet below existing grade.
The proposed borings were located by a Terracon representative using a scaled site plan
provided by Vermont of Agency of Transportation (VAOT). Ground surface elevations indicated
on the boring logs were estimated based on the grading plan provided by VAOT. The locations
and elevations of the borings should be considered accurate only to the degree implied by the
means and methods used to define them.
Samples of the soil encountered in the borings were obtained using the split-barrel sampling
procedures. In the split-barrel sampling procedure, the number of blows required to advance a
standard 2-inch O.D. split-barrel sampler the last 12 inches of the typical total 18-inch
penetration by means of a 140-pound hammer with a free fall of 30 inches, is the standard
penetration resistance value (SPT-N). This value is used to estimate the in-situ relative density
of cohesionless soils and consistency of cohesive soils.
The samples were tagged for identification, sealed to reduce moisture loss, and taken to the
VAOT laboratory for further examination, testing, and classification. Information provided on the
boring logs attached to this report includes soil descriptions, consistency evaluations, boring
depths, sampling intervals, and groundwater conditions. The borings were backfilled with
cuttings prior to the drill crew leaving the site.
A field log of each boring was prepared by the drill crew. These logs included visual
classifications of the materials encountered during drilling as well as the driller’s interpretation of
the subsurface conditions between samples. Final boring logs included with this report
represent the engineer's interpretation of the field logs and include modifications based on
laboratory observation and tests of the samples.
23.2
16.6
18.8
13.6
10.7
12.6
12.2
18.6
23.5
20.1
4.4
57.9
27.4
23.3
44.6
45.7
50.3
68.2
34.5
37.5
38.7
36.8
30.8
29.6
27.4
7.6
35.1
38.0
A-4, SiSa, Rec. = 1.17 ft, 2-inches topsoil over Fill
A-2-4, GrSiSa, Rec. = 0.5 ft, Fill
A-2-4, GrSiSa, Rec. = 1.5 ft, Fill
A-2-4, SiSa, Rec. = 0.67 ft, Fill
A-1-a, SaGr, Rec. = 0.67 ft, Fill
(FILL)(TILL)
A-2-4, GrSiSa, Rec. = 0.83 ft, Till
A-4, GrSiSa, Rec. = 1.0 ft, Till
Hole stopped @ 22.0 ft
6-10-8-16
(18)21-10-
8-9(18)
13-17-20-38(37)
20-33-50-50(83)
13-16-43-50/3"
(59)
14-15-25-25(40)
26-40-39-42(79)
SPT
STATE OF VERMONTAGENCY OF TRANSPORTATION
MATERIALS & RESEARCH SECTIONSUBSURFACE INFORMATION
BORING LOG
Dep
th(f
t)
5
10
15
20
25
30
35
40
45
Boring Crew: Roger Burn, TT
Date Started: 6/05/14 Date Finished: 6/05/14
VTSPG NAD83: N 9936.08 ft E 50213.63 ft
Ground Elevation: 1945.62 ft
Boring No.: B-101
Page No.: 1 of 1
Pin No.: 07b106
Checked By: ASP
Date
STP SCRP(4)
Depth(ft)
Notes:
Hammer Fall:Hammer Wt:I.D.:Type:
06/15/14 Dry , after drilling
CE = 1.3
Moi
stur
eC
onte
nt %
Rig: D-50Hammer/Rod Type: Safety
Station: 10+28.60
2 in140 lb.30 in.
Flushwall4 in
300 lb.30 in.
Casing Sampler
Offset: 3.0L
Gra
vel %
San
d %
Fin
es %
Groundwater ObservationsS
trat
a (1
)
CLASSIFICATION OF MATERIALS(Description)
Blo
ws/
6"(N
Val
ue)
1. Stratification lines represent approximate boundary between material types. Transition may be gradual.2. N Values have not been corrected for hammer energy. CE is the hammer energy correction factor. CE is an estimated value.3. Water level readings have been made at times and under conditions stated.Fluctuations of groundwater may occur due to other factors than those present at the time measurements were made.4. Ground surface elevations indicated on the boring logs were estimated based on the grading plan provided by VAOT.
Peru
Notes
2010
CO
PY
J11
4512
8.G
PJ
VE
RM
ON
T A
OT
.GD
T
7/2/
14

13.6
11.2
15.8
8.1
29.8
93.7
29.4
14.1
12.7
13.8
18.1
27.1
28.7
13.5
50.8
23.4
29.6
38.2
36.8
39.5
47.9
43.5
53.5
32.1
41.5
34.2
28.4
30.2
38.4
25.0
27.8
33.0
17.1
35.1
36.2
33.4
33.0
22.1
A-1-B, SiGrSa, Rec. = 0.83 ft, 4-inches topsoil over Fill
A-2-4, SiGrSa, Rec. = 0.5 ft, Fill
Rec. = 0.0 ft, 4.0 ft - 6.0 ft, boulders from 5 to 14 feet, Fill
A-2-4, SiSa, Rec. = 0.33 ft, broken rock, wood pieces, Fill
A-1-B, SaGr, Rec. = 0.67 ft, Fill
A-2-4, GrSiSa, Rec. = 1.0 ft, Fill
Organic silt with broken rock, Fill, Rec. = 1.2 ft
Silt with organic matter and broken rock, Fill, Rec. = 0.33 ft
A-4, GrSaSi, Rec. = 0.83 ft, Fill(FILL)
(TILL)
A-2-4, SaSiGr, Rec. = 0.07 ft, Till
A-2-4, SaSiGr, Rec. = 0.5 ft, Till
A-1-B, SiSaGr, Rec. = 0.2 ft, TillHole stopped @ 45.3 ft
1-4-13-20
(17)20-16-26-16(42)
12-10-3-3(13)
28-29-18-10(47)
22-15-20-21(35)
4-5-8-15
(13)
9-5-6-11
(11)
39-60/6"(60+)
30-40-40-57(80)
46-80-50/1"
(130+)
51-100/5"(100+)
100/3"
SPT
STATE OF VERMONTAGENCY OF TRANSPORTATION
MATERIALS & RESEARCH SECTIONSUBSURFACE INFORMATION
BORING LOG
Dep
th(f
t)
5
10
15
20
25
30
35
40
45
Boring Crew: Roger Burn, TT
Date Started: 6/05/14 Date Finished: 6/05/14
VTSPG NAD83: N 10003.10 ft E 50224.48 ft
Ground Elevation: 1973.85 ft
Boring No.: B-102
Page No.: 1 of 1
Pin No.: 07b106
Checked By: ASP
Date
STP SCRP(4)
Depth(ft)
Notes:
Hammer Fall:Hammer Wt:I.D.:Type:
06/15/14 Dry , after drilling
CE = 1.3
Moi
stur
eC
onte
nt %
Rig: D-50Hammer/Rod Type: Safety
Station: 10+75.40
2 in140 lb.30 in.
Flushwall4 in
300 lb.30 in.
Casing Sampler
Offset: 4.0L
Gra
vel %
San
d %
Fin
es %
Groundwater ObservationsS
trat
a (1
)
CLASSIFICATION OF MATERIALS(Description)
Blo
ws/
6"(N
Val
ue)
1. Stratification lines represent approximate boundary between material types. Transition may be gradual.2. N Values have not been corrected for hammer energy. CE is the hammer energy correction factor. CE is an estimated value.3. Water level readings have been made at times and under conditions stated.Fluctuations of groundwater may occur due to other factors than those present at the time measurements were made.4. Ground surface elevations indicated on the boring logs were estimated based on the grading plan provided by VAOT.
Peru
Notes
2010
CO
PY
J11
4512
8.G
PJ
VE
RM
ON
T A
OT
.GD
T
7/2/
14
4.7
7.7
11.8
9.9
11.4
11.5
9.1
16.5
12.6
11.2
53.4
39.1
26.0
28.1
18.8
28.2
48.7
31.8
41.8
46.3
28.0
30.6
34.9
35.4
39.2
40.0
32.0
34.5
38.0
29.2
18.6
30.3
39.1
36.5
42.0
31.8
19.3
33.7
20.2
24.5
8-inches bituminous asphalt pavementA-1-B, SaGr, Rec. = 0.67 ft, Fill
A-2-4, SiSaGr, Rec. = 0.67 ft, Fill(IMPORTED FILL)
(FILL)A-4, GrSaSi, Rec. = 1.0 ft, Fill
A-4, GrSaSi, Rec. = 0.83 ft, drill rig rocking and grinding noises, Fill
A-4, SaSi, Rec. = 1.17 ft, drill rig rocking and grinding noises, Fill
A-2-4, GrSiSa, Rec. = 1.0 ft, Fill
A-1-B, SaGr, Rec. = 0.33 ft, Fill
A-2-4, GrSiSa, Rec. = 0.5 ft, Fill(FILL)(TILL)
A-1-B, SiSaGr, Rec. = 1.0 ft, Till
A-1-B, SiSaGr, Rec. = 0.83 ft, Till
Hole stopped @ 36.0 ft
16-26-29-31(65)
26-24-16-18(40)
11-16-20-20(36)
20-34-60-75(94)
35-39-40-44(79)
38-42-50-60(92)
14-12-14-11(26)
5-5-6-8(11)
16-36-41-39(77)
16-16-16-17(32)
SPT
STATE OF VERMONTAGENCY OF TRANSPORTATION
MATERIALS & RESEARCH SECTIONSUBSURFACE INFORMATION
BORING LOG
Dep
th(f
t)
5
10
15
20
25
30
35
40
45
Boring Crew: Peter Labossion, TT
Date Started: 6/04/14 Date Finished: 6/04/14
VTSPG NAD83: N 10089.25 ft E 50229.26 ft
Ground Elevation: 1988.78 ft
Boring No.: B-103
Page No.: 1 of 1
Pin No.: 07b106
Checked By: ASP
Date
STP SCRP(4)
Depth(ft)
Notes:
Hammer Fall:Hammer Wt:I.D.:Type:
06/14/14 Dry , after drilling
CE = 1.0
Moi
stur
eC
onte
nt %
Rig: B-47Hammer/Rod Type: Cathead
Station: 11+84.40
2 in140 lb.30 in.
Flushwall4 in
300 lb.30 in.
Casing Sampler
Offset: 0.0R
Gra
vel %
San
d %
Fin
es %
Groundwater ObservationsS
trat
a (1
)
CLASSIFICATION OF MATERIALS(Description)
Blo
ws/
6"(N
Val
ue)
1. Stratification lines represent approximate boundary between material types. Transition may be gradual.2. N Values have not been corrected for hammer energy. CE is the hammer energy correction factor. CE is an estimated value.3. Water level readings have been made at times and under conditions stated.Fluctuations of groundwater may occur due to other factors than those present at the time measurements were made.4. Ground surface elevations indicated on the boring logs were estimated based on the grading plan provided by VAOT.
Peru
Notes
2010
CO
PY
J11
4512
8.G
PJ
VE
RM
ON
T A
OT
.GD
T
7/2/
14
9.7
6.2
10.8
15.1
11.5
10.6
20.9
12.6
29.0
34.0
23.3
30.3
33.9
32.0
28.0
42.6
39.6
42.8
43.8
31.0
35.1
37.6
28.4
26.4
33.9
25.9
35.1
32.9
34.4
2-inches asphalt pavementA-2-4, SiGrSa, Rec. = 0.67 ft, Fill
Rec. = 0.2 ft, 2.5 ft - 4.5 ft, Fill
A-2-4, SiGrSa, Rec. = 0.83 ft, Fill(FILL)(TILL)
A-2-4, GrSiSa, Rec. = 1.17 ft, drill rig rocking and grinding noises, Till
A-2-4, SiGrSa, Rec. = 1.0 ft, Till
A-2-4, SaGrSi, Rec. = 0.67 ft, Till
Tough drilling at 18 feetA-2-4, GrSiSa, Rec. = 0.25 ft, Till
A-2-4, GrSiSa, Rec. = 1.17 ft, Till, weathered shale in the tip
Weathered shale, Rec. = 0.0 ftHole stopped @ 29.1 ft
10-7-3-5
(10)11-10-12-14(22)9-12-11-15(23)
21-23-40-25(63)
19-19-27-27(46)
30-30-43-52(73)
22-32-37-56(69)
38-38-42-52(80)
50/1"(50+)
SPT
STATE OF VERMONTAGENCY OF TRANSPORTATION
MATERIALS & RESEARCH SECTIONSUBSURFACE INFORMATION
BORING LOG
Dep
th(f
t)
5
10
15
20
25
30
35
40
45
Boring Crew: Peter Labossion, TT
Date Started: 6/03/14 Date Finished: 6/03/14
VTSPG NAD83: N 10216.83 ft E 50183.59 ft
Ground Elevation: 1991.36 ft
Boring No.: B-104
Page No.: 1 of 1
Pin No.: 07b106
Checked By: ASP
Date
STP SCRP(4)
Depth(ft)
Notes:
Hammer Fall:Hammer Wt:I.D.:Type:
06/13/14 Dry , after drilling
CE = 1.0
Moi
stur
eC
onte
nt %
Rig: B-47Hammer/Rod Type: Cathead
Station: 13+11.80
2 in140 lb.30 in.
Flushwall4 in
300 lb.30 in.
Casing Sampler
Offset: 0.0R
Gra
vel %
San
d %
Fin
es %
Groundwater ObservationsS
trat
a (1
)
CLASSIFICATION OF MATERIALS(Description)
Blo
ws/
6"(N
Val
ue)
1. Stratification lines represent approximate boundary between material types. Transition may be gradual.2. N Values have not been corrected for hammer energy. CE is the hammer energy correction factor. CE is an estimated value.3. Water level readings have been made at times and under conditions stated.Fluctuations of groundwater may occur due to other factors than those present at the time measurements were made.4. Ground surface elevations indicated on the boring logs were estimated based on the grading plan provided by VAOT.
Peru
Notes
2010
CO
PY
J11
4512
8.G
PJ
VE
RM
ON
T A
OT
.GD
T
7/2/
14
7.9
11.1
13.6
14.3
10.8
11.4
10.8
10.9
11.4
39.4
34.1
17.4
21.3
40.6
35.0
23.5
21.8
25.7
39.6
39.5
41.9
38.2
29.3
33.4
36.7
37.0
32.7
21.0
26.4
40.7
40.5
30.1
31.6
39.8
41.2
41.6
A-1-B, SiGrSa, Rec. = 0.83 ft, Fill
A-2-4, SiGrSa, Rec. = 1.0 ft, Fill(FILL)(TILL)
A-4, SiSa, Rec. = 1.17 ft, drill rig rocking and grinding noises, Till
A-4, GrSaSi, Rec. = 1.0 ft, Till
A-2-4, SaSiGr, Rec. = 0.67 ft, roller bit grinding on cobbles/gravel, Till
A-2-4, SiSaGr, Rec. = 0.67 ft, Till
A-4, GrSaSi, Rec. = 1.0 ft, Till
A-4, GrSaSi, Rec. = 1.0 ft, Till
A-4, GrSaSi, Rec. = 1.0 ft, Till
Hole stopped @ 30.4 ft
11-15-18-16(33)
12-20-40-42(60)
24-40-34-38(74)
42-34-40-38(74)
16-16-30-47(46)
30-30-28-39(58)
24-45-42-45(87)
23-29-32-44(61)
38-40-80/5"
(120+)
SPT
STATE OF VERMONTAGENCY OF TRANSPORTATION
MATERIALS & RESEARCH SECTIONSUBSURFACE INFORMATION
BORING LOG
Dep
th(f
t)
5
10
15
20
25
30
35
40
45
Boring Crew: Peter Labossion, TT
Date Started: 6/03/14 Date Finished: 6/03/14
VTSPG NAD83: N 10298.35 ft E 50147.43 ft
Ground Elevation: 1997.41 ft
Boring No.: B-105
Page No.: 1 of 1
Pin No.: 07b106
Checked By: ASP
Date
STP SCRP(4)
Depth(ft)
Notes:
Hammer Fall:Hammer Wt:I.D.:Type:
06/13/14 Dry , after drilling
CE = 1.0
Moi
stur
eC
onte
nt %
Rig: B-47Hammer/Rod Type: Cathead
Station: 14+25.00
2 in140 lb.30 in.
Flushwall4 in
300 lb.30 in.
Casing Sampler
Offset: 1.1R
Gra
vel %
San
d %
Fin
es %
Groundwater ObservationsS
trat
a (1
)
CLASSIFICATION OF MATERIALS(Description)
Blo
ws/
6"(N
Val
ue)
1. Stratification lines represent approximate boundary between material types. Transition may be gradual.2. N Values have not been corrected for hammer energy. CE is the hammer energy correction factor. CE is an estimated value.3. Water level readings have been made at times and under conditions stated.Fluctuations of groundwater may occur due to other factors than those present at the time measurements were made.4. Ground surface elevations indicated on the boring logs were estimated based on the grading plan provided by VAOT.
Peru
Notes
2010
CO
PY
J11
4512
8.G
PJ
VE
RM
ON
T A
OT
.GD
T
7/2/
14
APPENDIX B
LABORATORY TEST RESULTS


APPENDIX C
GLOBAL STABILITY ANALYSIS

APPENDIX D
SUPPORTING DOCUMENTS
EXHIBIT D-2
GENERAL NOTES
DRILLING & SAMPLING SYMBOLS:
SS: Split Spoon - 1-3/8" I.D., 2" O.D., unless otherwise noted HS: Hollow Stem Auger
ST: Thin-Walled Tube – 2” O.D., 3" O.D., unless otherwise noted PA: Power Auger (Solid Stem)
RS: Ring Sampler - 2.42" I.D., 3" O.D., unless otherwise noted HA: Hand Auger
DB: Diamond Bit Coring - 4", N, B RB: Rock Bit
BS: Bulk Sample or Auger Sample WB Wash Boring or Mud Rotary
The number of blows required to advance a standard 2-inch O.D. split-spoon sampler (SS) typically the middle 12 inches of the total 24-
inch penetration with a 140-pound hammer falling 30 inches is considered the “Standard Penetration” or “N-value”.
WATER LEVEL MEASUREMENT SYMBOLS:
WL: Water Level WS: While Sampling BCR: Before Casing Removal
WCI: Wet Cave in WD: While Drilling ACR: After Casing Removal
DCI: Dry Cave in AB: After Boring N/E: Not Encountered
Water levels indicated on the boring logs are the levels measured in the borings at the times indicated. Groundwater levels at other times and other locations across the site could vary. In pervious soils, the indicated levels may reflect the location of groundwater. In low permeability soils, the accurate determination of groundwater levels may not be possible with only short-term observations. DESCRIPTIVE SOIL CLASSIFICATION: Soil classification is based on the Unified Soil Classification System. Coarse Grained Soils
have more than 50% of their dry weight retained on a #200 sieve; their principal descriptors are: boulders, cobbles, gravel or sand. Fine Grained Soils have less than 50% of their dry weight retained on a #200 sieve; they are principally described as clays if they are plastic, and silts if they are slightly plastic or non-plastic. Major constituents may be added as modifiers and minor constituents may be added according to the relative proportions based on grain size. In addition to gradation, coarse-grained soils are defined on the basis of their in-place relative density and fine-grained soils on the basis of their consistency.
CONSISTENCY OF FINE-GRAINED SOILS RELATIVE DENSITY OF COARSE-GRAINED SOILS
Unconfined
Compressive
Strength, Qu, psf
Standard Penetration
or N-value (SS)
Blows/Ft.
Consistency
Standard Penetration
or N-value (SS)
Blows/Ft.
Relative Density
< 500 0 - 1 Very Soft 0 – 3 Very Loose
500 – 1,000 2 - 4 Soft 4 – 9 Loose
1,000 – 2,000 4 - 8 Medium Stiff 10 – 29 Medium Dense
2,000 – 4,000 8 - 15 Stiff 30 – 50 Dense
4,000 – 8,000 15 - 30 Very Stiff > 50 Very Dense
8,000+ > 30 Hard
RELATIVE PROPORTIONS OF SAND AND GRAVEL GRAIN SIZE TERMINOLOGY
Descriptive Term(s)
of other constituents
Percent of
Dry Weight
Major Component
of Sample Particle Size
Trace < 15 Boulders Over 12 in. (300mm)
With 15 – 29 Cobbles 12 in. to 3 in. (300mm to 75mm)
Modifier ≥ 30 Gravel 3 in. to #4 sieve (75mm to 4.75mm)
Sand #4 to #200 sieve (4.75 to 0.075mm)
Silt or Clay Passing #200 Sieve (0.075mm)
RELATIVE PROPORTIONS OF FINES PLASTICITY DESCRIPTION
Descriptive Term(s)
of other constituents
Percent of
Dry Weight Term
Plasticity
Index
Trace < 5 Non-plastic 0
With 5 – 12 Low 1-10
Modifier > 12 Medium 11-30
High > 30
EXHIBIT D-3
UNIFIED SOIL CLASSIFICATION SYSTEM
Criteria for Assigning Group Symbols and Group Names Using Laboratory Tests A
Soil Classification
Group
Symbol Group Name
B
Coarse Grained Soils:
More than 50% retained
on No. 200 sieve
Gravels:
More than 50% of
coarse
fraction retained on
No. 4 sieve
Clean Gravels:
Less than 5% fines C
Cu 4 and 1 Cc 3 E
GW Well-graded gravel F
Cu 4 and/or 1 Cc 3 E
GP Poorly graded gravel F
Gravels with Fines:
More than 12% fines C
Fines classify as ML or MH GM Silty gravel F,G, H
Fines classify as CL or CH GC Clayey gravel F,G,H
Sands:
50% or more of coarse
fraction passes
No. 4 sieve
Clean Sands:
Less than 5% fines D
Cu 6 and 1 Cc 3 E
SW Well-graded sand I
Cu 6 and/or 1 Cc 3 E
SP Poorly graded sand I
Sands with Fines:
More than 12% fines D
Fines classify as ML or MH SM Silty sand G,H,I
Fines Classify as CL or CH SC Clayey sand G,H,I
Fine-Grained Soils:
50% or more passes the
No. 200 sieve
Silts and Clays:
Liquid limit less than 50
Inorganic: PI 7 and plots on or above “A” line
J CL Lean clay
K,L,M
PI 4 or plots below “A” line J ML Silt
K,L,M
Organic: Liquid limit - oven dried
0.75 OL Organic clay
K,L,M,N
Liquid limit - not dried Organic silt K,L,M,O
Silts and Clays:
Liquid limit 50 or more
Inorganic: PI plots on or above “A” line CH Fat clay
K,L,M
PI plots below “A” line MH Elastic Silt K,L,M
Organic: Liquid limit - oven dried
0.75 OH Organic clay
K,L,M,P
Liquid limit - not dried Organic silt K,L,M,Q
Highly organic soils: Primarily organic matter, dark in color, and organic odor PT Peat
A Based on the material passing the 3-in. (75-mm) sieve
B If field sample contained cobbles or boulders, or both, add “with
cobbles or boulders, or both” to group name. C
Gravels with 5 to 12% fines require dual symbols: GW-GM well-
graded gravel with silt, GW-GC well-graded gravel with clay, GP-GM poorly
graded gravel with silt, GP-GC poorly graded gravel with clay. D
Sands with 5 to 12% fines require dual symbols: SW-SM well-
graded sand with silt, SW-SC well-graded sand with clay, SP-SM poorly
graded sand with silt, SP-SC poorly graded sand with clay
E Cu = D60/D10 Cc =
6010
2
30
DxD
)(D
F If soil contains 15% sand, add “with sand” to group name.
G If fines classify as CL-ML, use dual symbol GC-GM, or SC-SM.
H If fines are organic, add “with organic fines” to group name.
I If soil contains 15% gravel, add “with gravel” to group name.
J If Atterberg limits plot in shaded area, soil is a CL-ML, silty clay.
K If soil contains 15 to 29% plus No. 200, add “with sand” or “with
gravel,” whichever is predominant. L
If soil contains 30% plus No. 200 predominantly sand, add
“sandy” to group name. M
If soil contains 30% plus No. 200, predominantly gravel, add
“gravelly” to group name. N
PI 4 and plots on or above “A” line. O
PI 4 or plots below “A” line. P
PI plots on or above “A” line. Q
PI plots below “A” line.