Embed Size (px)
Citation preview
4 4 1 2 S W C O R B E T T A V E N U E
P O R T L A N D , O R 9 7 2 3 9
5 0 3 . 2 4 8 . 1 9 3 9 M A I N
8 6 6 . 7 2 7 . 0 1 4 0 F A X
P B S U S A . C O M
Geotechnical Engineering Report Eugene Riverfront Development
East 3rd Street to East 8th Avenue
Eugene, Oregon
Prepared for:
City of Eugene
99 East Broadway, Suite 400
Eugene, Oregon 97401
April 24, 2019
PBS Project 73368.001
© 2 0 19 PBS Engineering and Environmental Inc.
4 4 1 2 S W C O R B E T T A V E N U E , P O R T L A N D , O R 9 7 2 3 9 5 0 3 . 2 4 8 . 1 9 3 9 M A I N 8 6 6 . 7 2 7 . 0 1 4 0 F A X P B S U S A . C O M
Geotechnical Engineering Report
Eugene Riverfront Development
East 3rd Street to East 8th Avenue
Eugene, Oregon
Prepared for:
City of Eugene
99 East Broadway, Suite 400
Eugene, Oregon 97401
April 24, 2019
PBS Project 73368.001
Prepared by:
Dave Eibert, GIT
Staff Geologist
Reviewed by:
Saiid Behboodi, PE, GE
Principal Geotechnical Engineer
Ryan White, PE, GE
Geotechnical Engineering Group Manager
6/30/2020
Geotechnical Engineering Report
City of Eugene
Eugene Riverfront Development
Eugene, Oregon
i
April 24, 2019
PBS Project 73368.001
Table of Contents
1 INTRODUCTION ................................................................................................................................................. 1
General ........................................................................................................................................................................................... 1 1.1
Purpose and Scope ................................................................................................................................................................... 1 1.2
Literature and Records Review ................................................................................................................................ 1 1.2.1
Subsurface Explorations ............................................................................................................................................. 1 1.2.2
Field Infiltration Testing .............................................................................................................................................. 1 1.2.3
Soils Testing .................................................................................................................................................................... 1 1.2.4
Geotechnical Engineering Analysis ........................................................................................................................ 1 1.2.5
Report Preparation ....................................................................................................................................................... 1 1.2.6
Project Understanding ............................................................................................................................................................. 2 1.3
2 SITE CONDITIONS .............................................................................................................................................. 2
Surface Description ................................................................................................................................................................... 2 2.1
Geologic Setting......................................................................................................................................................................... 3 2.1
Regional Geology .......................................................................................................................................................... 3 2.1.1
Local Geology ................................................................................................................................................................. 3 2.1.2
3 GEOLOGIC HAZARDS ......................................................................................................................................... 4
Seismicity and Faulting ............................................................................................................................................................ 4 3.1
Historical Seismicity...................................................................................................................................................... 4 3.1.1
Seismic Sources.............................................................................................................................................................. 4 3.1.2
Cascadia Subduction Zone (CSZ) – Interface Earthquakes .......................................................... 4 3.1.2.1
Intraslab Earthquakes.................................................................................................................................. 4 3.1.2.2
Crustal Earthquakes and Faults ............................................................................................................... 4 3.1.2.3
Seismic Hazards ............................................................................................................................................................. 5 3.1.3
Liquefaction and lateral spreading ........................................................................................................ 5 3.1.3.1
Flooding ........................................................................................................................................................................................ 5 3.2
Subsurface Conditions ............................................................................................................................................................. 5 3.3
Groundwater ................................................................................................................................................................................ 6 3.4
Piezometers ..................................................................................................................................................................... 6 3.4.1
Infiltration Testing ..................................................................................................................................................................... 6 3.5
4 CONCLUSIONS AND RECOMMENDATIONS .................................................................................................. 7
Geotechnical Design Considerations ................................................................................................................................. 7 4.1
Groundwater Control ............................................................................................................................................................... 7 4.2
Retaining Building Walls ......................................................................................................................................................... 7 4.3
Drainage ........................................................................................................................................................................... 8 4.3.1
Seismic Design Considerations ............................................................................................................................................ 8 4.4
Code-Based Seismic Design Parameters ............................................................................................................. 8 4.4.1
Preliminary Pavement Section Recommendations ...................................................................................................... 8 4.5
Asphalt Concrete ........................................................................................................................................................... 8 4.5.1
Portland Cement Concrete ........................................................................................................................................ 9 4.5.2
Construction Considerations .................................................................................................................................... 9 4.5.3
General.............................................................................................................................................................. 9 4.5.3.1
PCC Pavement ............................................................................................................................................... 9 4.5.3.2
Geotechnical Engineering Report
City of Eugene
Eugene Riverfront Development
Eugene, Oregon
ii
April 24, 2019
PBS Project 73368.001
Temporary Shoring ................................................................................................................................................................. 10 4.6
Soldier Pile Wall (with Tiebacks) ............................................................................................................................ 10 4.6.1
Braces and Struts ......................................................................................................................................................... 10 4.6.2
Soil Parameters ............................................................................................................................................................ 10 4.6.3
5 CONSTRUCTION RECOMMENDATIONS .......................................................................................................11
Site Preparation ........................................................................................................................................................................ 11 5.1
Proofrolling/Subgrade Verification ...................................................................................................................... 11 5.1.1
Wet/Freezing Weather and Wet Soil Conditions ........................................................................................... 11 5.1.2
Excavation ................................................................................................................................................................................... 12 5.2
Structural Fill .............................................................................................................................................................................. 12 5.3
On-Site Soil .................................................................................................................................................................... 12 5.3.1
Borrow Material ........................................................................................................................................................... 13 5.3.2
Select Granular Fill ...................................................................................................................................................... 13 5.3.3
Crushed Aggregate Base .......................................................................................................................................... 13 5.3.4
Utility Trench Backfill ................................................................................................................................................. 13 5.3.5
Stabilization Material ................................................................................................................................................. 14 5.3.6
6 ADDITIONAL SERVICES AND CONSTRUCTION OBSERVATIONS ..............................................................14
7 LIMITATIONS ....................................................................................................................................................14
8 REFERENCES ......................................................................................................................................................16

Geotechnical Engineering Report
City of Eugene
Eugene Riverfront Development
Eugene, Oregon
iii
April 24, 2019
PBS Project 73368.001
Supporting Data
TABLES
Table 1. 2014 OSSC Seismic Design Parameters Table 2. Minimum AC Pavement Sections Table 3. Minimum PCC Pavement Sections Table 4. Soil Parameters for Temporary Shoring
FIGURES
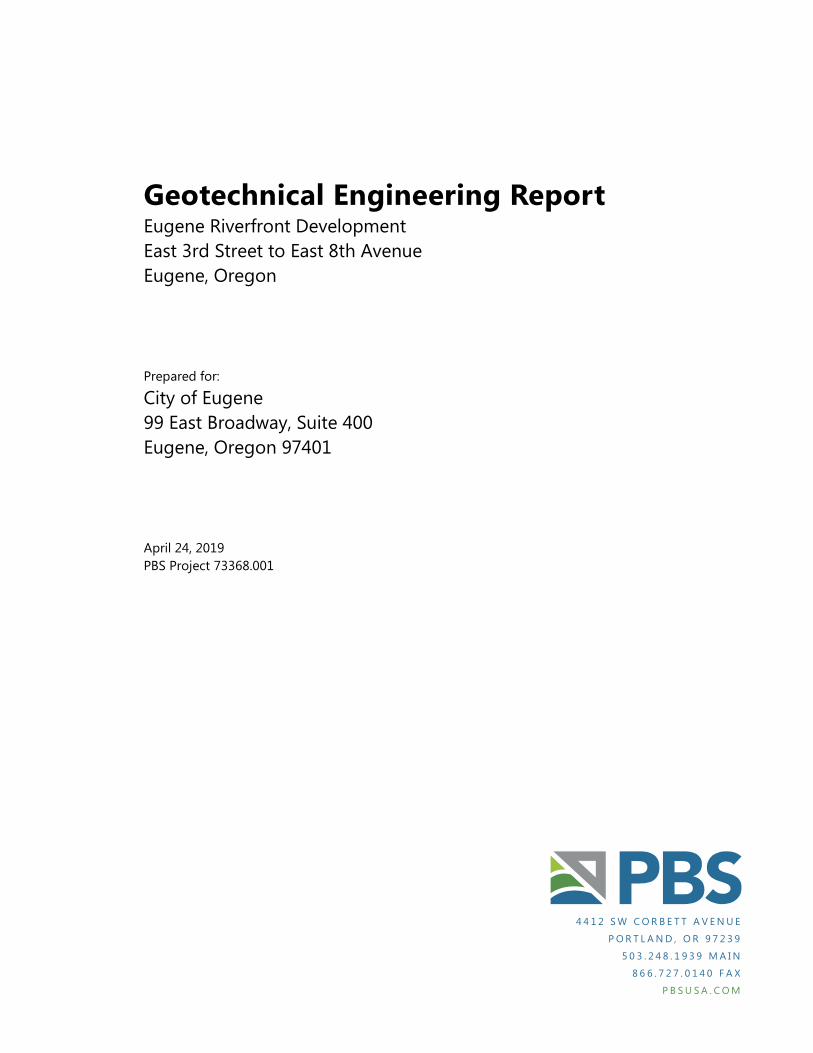
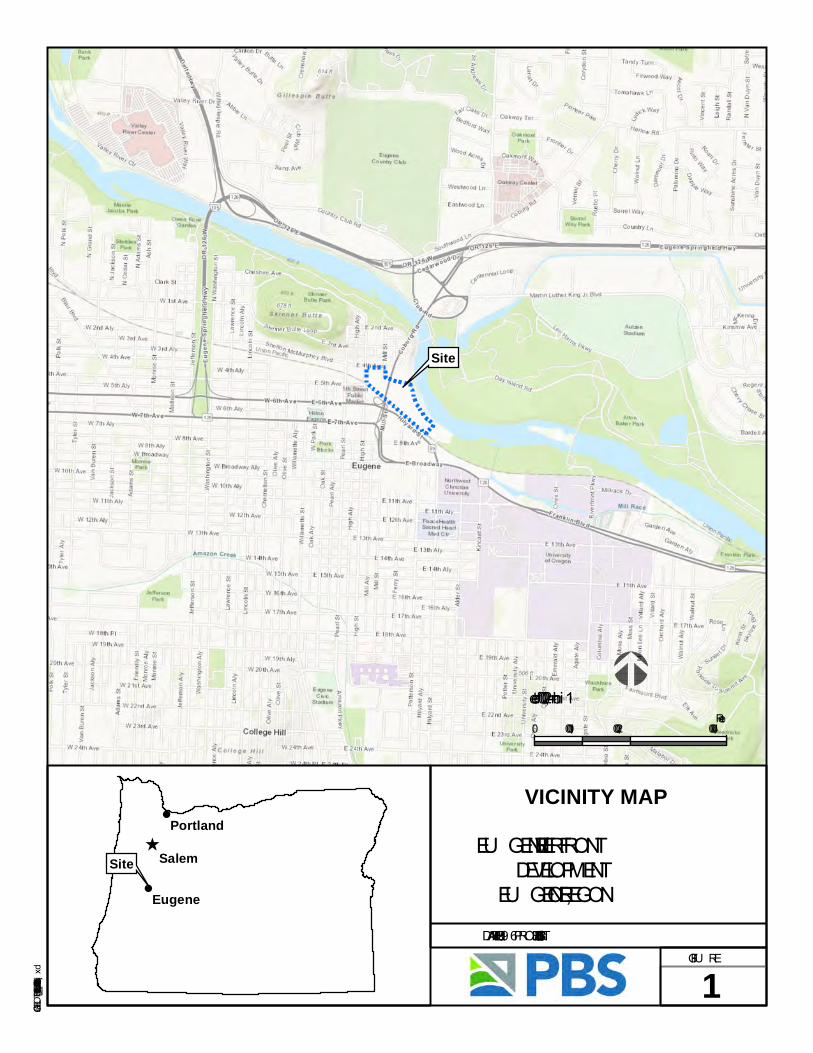
Figure 1. Vicinity Map
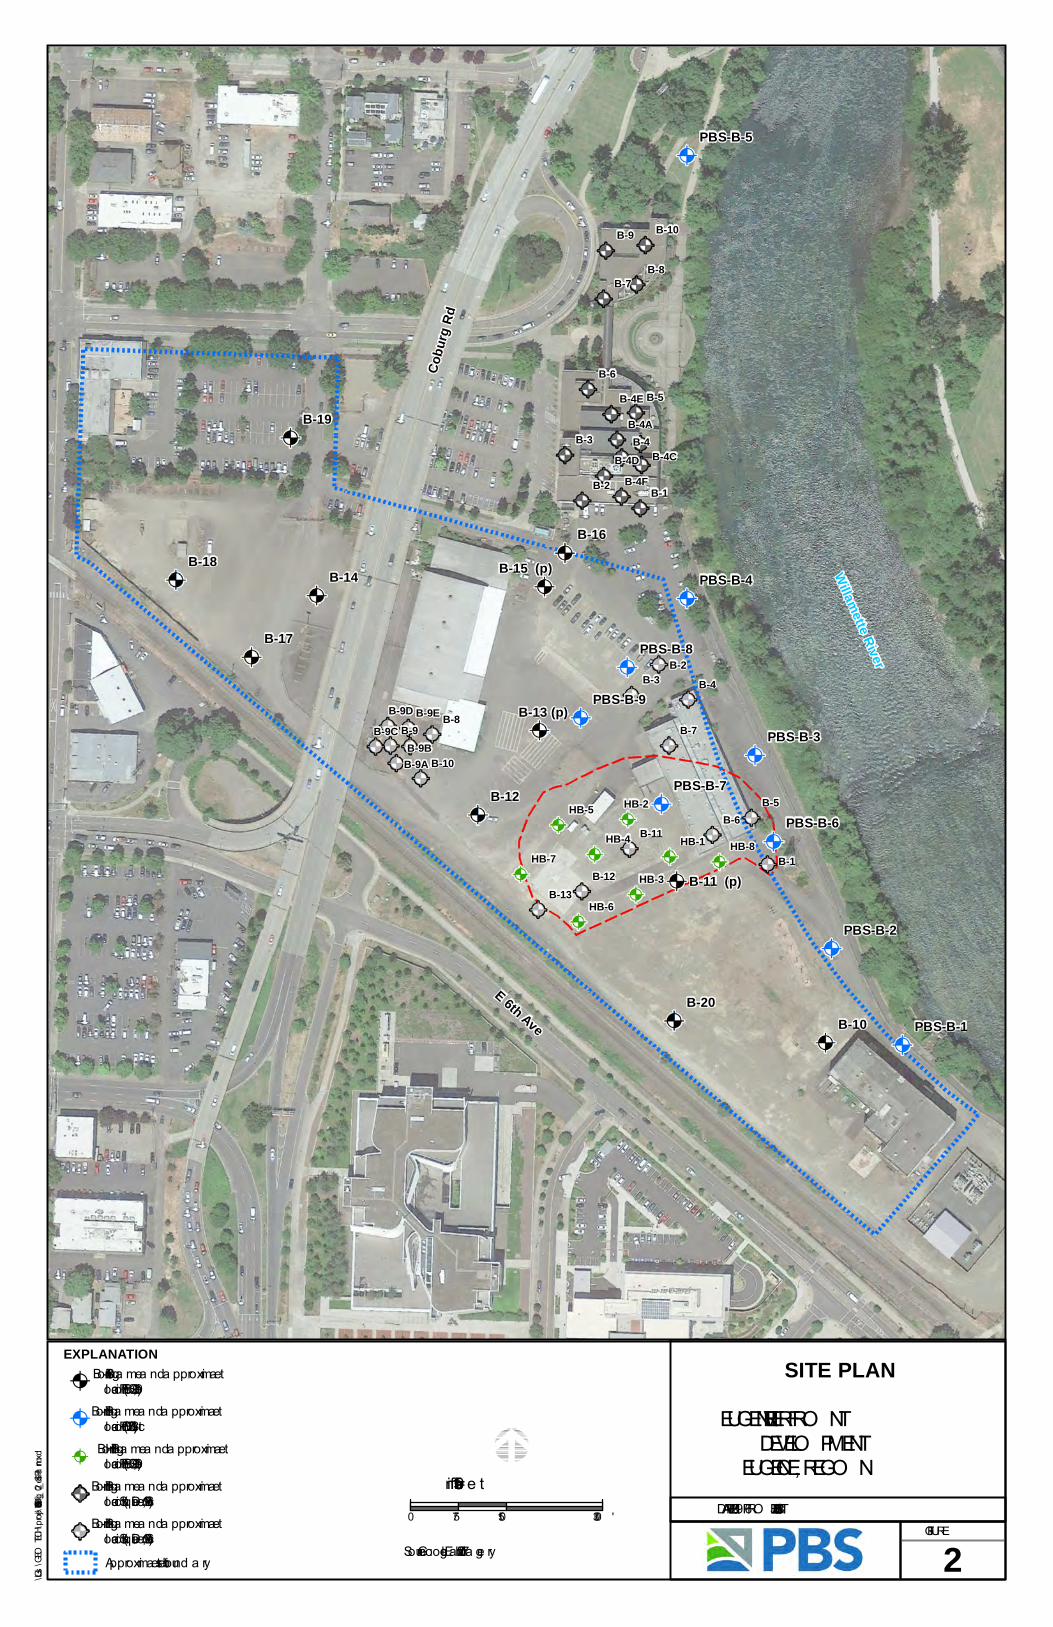
Figure 2. Site Plan
Figure 3. Tectonic Setting of the Pacific Northwest
Figure 4. Geologic Map
Figure 5. Regional Fault Map
Figure 6. Historical Seismicity
Figure 7. Retaining Wall Earth Pressure Diagram
Figure 8. Lateral Surcharge Detail
APPENDICES
Appendix A: Field Explorations
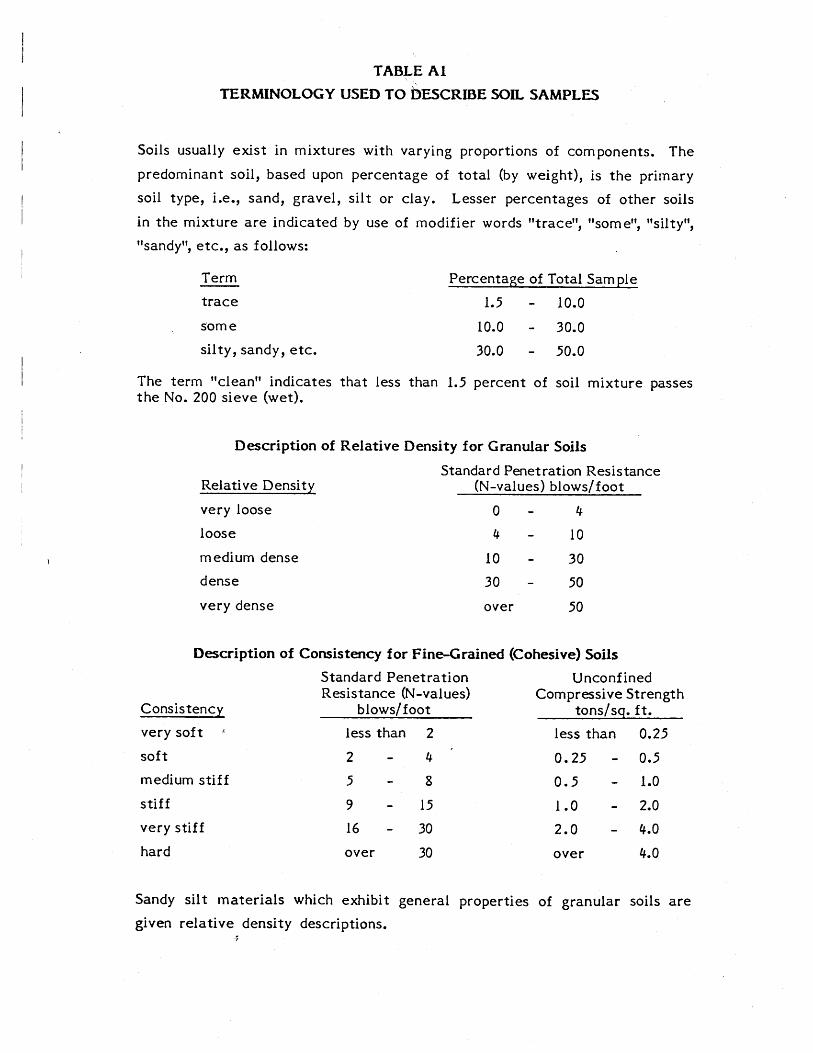
Table A-1. Terminology Used to Describe Soil
Table A-2. Key to Test Pit and Boring Log Symbols
Figures A1–A11. Logs for Borings B-10 through B-20
Appendix B: Laboratory Testing
Figure B1. Atterberg Limits Test Results
Figure B2. Particle-size Analysis Test Results
Figure B3. Summary of Laboratory Data
Appendix C: Field Explorations by PBS and Others
Geotechnical Engineering Report
City of Eugene
Eugene Riverfront Development
Eugene, Oregon
1
April 24, 2019
PBS Project 73368.001
1 INTRODUCTION
General 1.1
This report presents results of PBS Engineering and Environmental Inc. (PBS) geotechnical engineering services
for the proposed Eugene Riverfront development located at East 3rd Street to East 8th Avenue in Eugene,
Oregon (site). This is a continuation of PBS’s involvement in the project, including previous reports regarding
the presence and possible presence of hog fuel dated February 6, 2019, and a Level 1 investigation providing
initial infrastructure recommendations dated February 19, 2019. The general site location is shown on the
Vicinity Map, Figure 1. The locations of PBS’ explorations in relation to existing site features are shown on the
Site Plan, Figure 2.
Purpose and Scope 1.2
The purpose of PBS’ services was to develop geotechnical design and construction recommendations in
support of the planned Eugene Riverfront development. This was accomplished by performing the following
scope of services.
Literature and Records Review 1.2.1
PBS reviewed various published geologic maps of the area for information regarding geologic conditions and
hazards at or near the site. PBS also reviewed previously completed reports for the project site and vicinity.
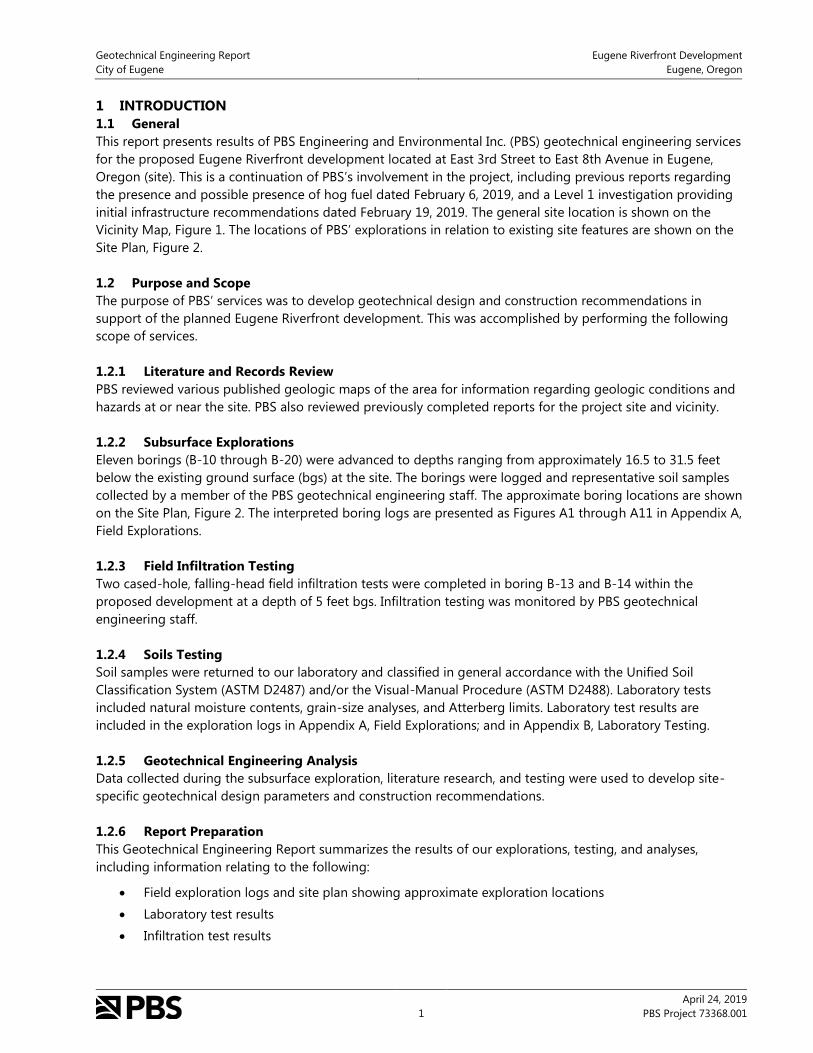
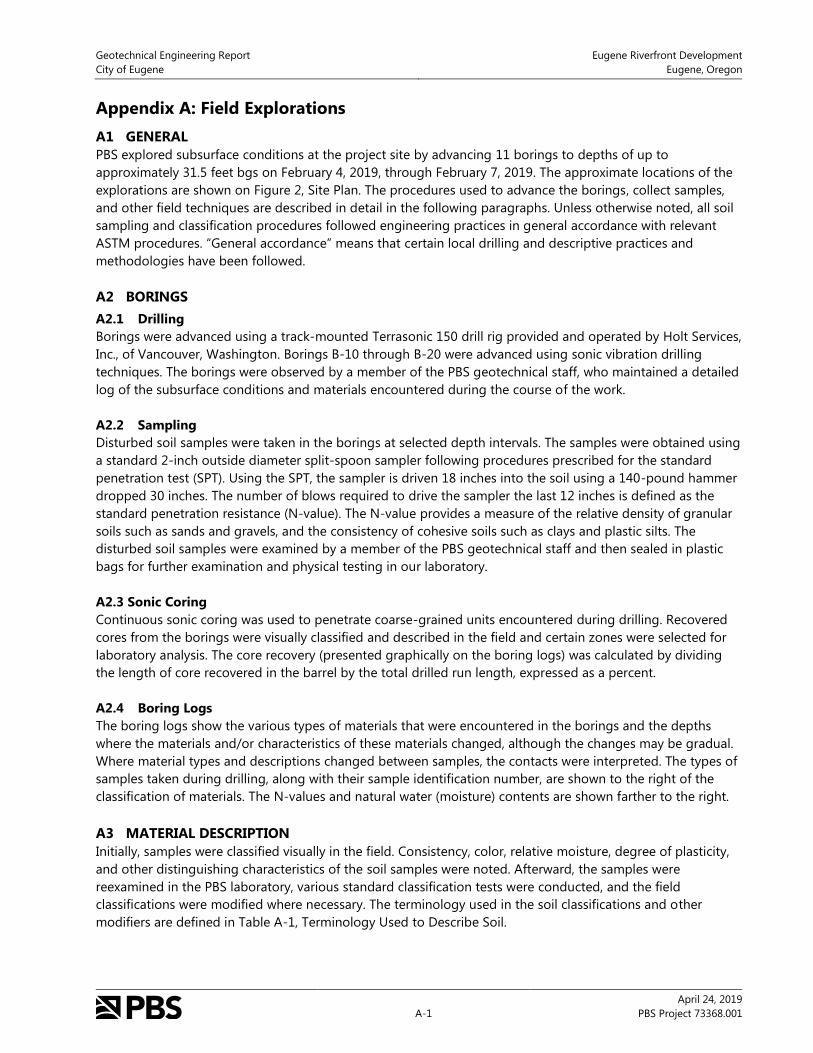
Subsurface Explorations 1.2.2
Eleven borings (B-10 through B-20) were advanced to depths ranging from approximately 16.5 to 31.5 feet
below the existing ground surface (bgs) at the site. The borings were logged and representative soil samples
collected by a member of the PBS geotechnical engineering staff. The approximate boring locations are shown
on the Site Plan, Figure 2. The interpreted boring logs are presented as Figures A1 through A11 in Appendix A,
Field Explorations.
Field Infiltration Testing 1.2.3
Two cased-hole, falling-head field infiltration tests were completed in boring B-13 and B-14 within the
proposed development at a depth of 5 feet bgs. Infiltration testing was monitored by PBS geotechnical
engineering staff.
Soils Testing 1.2.4
Soil samples were returned to our laboratory and classified in general accordance with the Unified Soil
Classification System (ASTM D2487) and/or the Visual-Manual Procedure (ASTM D2488). Laboratory tests
included natural moisture contents, grain-size analyses, and Atterberg limits. Laboratory test results are
included in the exploration logs in Appendix A, Field Explorations; and in Appendix B, Laboratory Testing.
Geotechnical Engineering Analysis 1.2.5
Data collected during the subsurface exploration, literature research, and testing were used to develop site-
specific geotechnical design parameters and construction recommendations.
Report Preparation 1.2.6
This Geotechnical Engineering Report summarizes the results of our explorations, testing, and analyses,
including information relating to the following:
Field exploration logs and site plan showing approximate exploration locations
Laboratory test results
Infiltration test results
Geotechnical Engineering Report
City of Eugene
Eugene Riverfront Development
Eugene, Oregon
2
April 24, 2019
PBS Project 73368.001
Groundwater considerations
Seismic site hazard study that includes:
o Discussion of geologic and seismic hazards impacting the site
o Locations of nearby faults
o Evaluation of liquefaction potential
Lateral earth pressures for retaining wall design, including:
o Active, passive, and at-rest earth pressures
o Seismic lateral force
o Sliding coefficient
o Allowable bearing pressure
o Groundwater and drainage considerations
Soil parameters for use in temporary shoring design
Utility trench excavation and backfill requirements
Earthwork and grading, cut, and fill recommendations:
o Structural fill materials and preparation, and reuse of on-site soils
o Wet weather considerations
o Temporary and permanent slope inclinations
Seismic design criteria in accordance with the 2014 Oregon Structural Specialty Code (OSSC)
Pavement subgrade preparation recommendations
Recommended asphalt concrete (AC) pavement sections
Project Understanding 1.3
PBS recently provided geotechnical engineering services for design and construction of the adjacent 2.5-acre
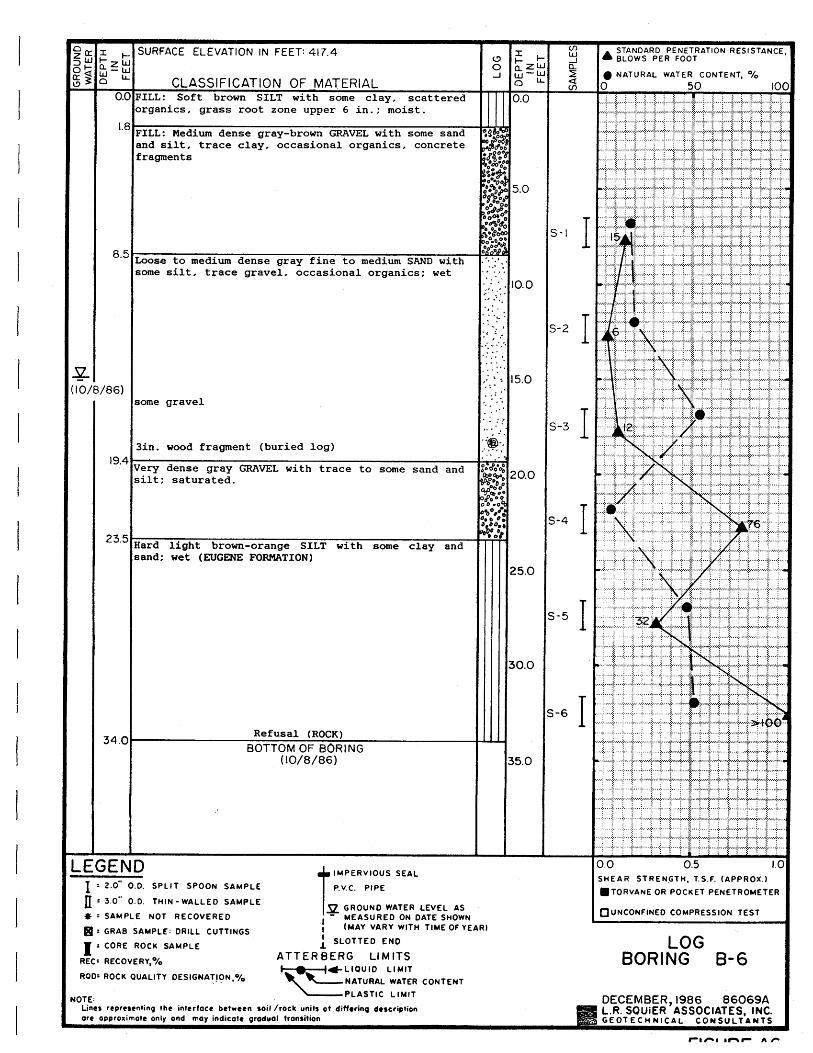
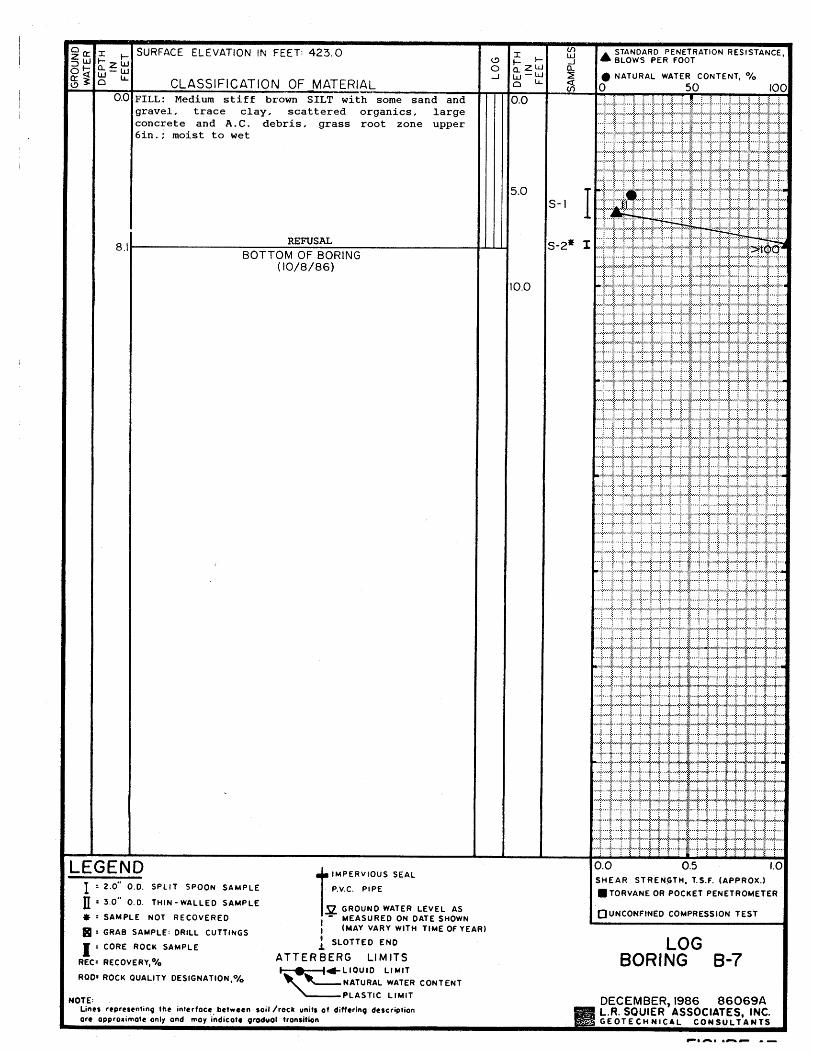
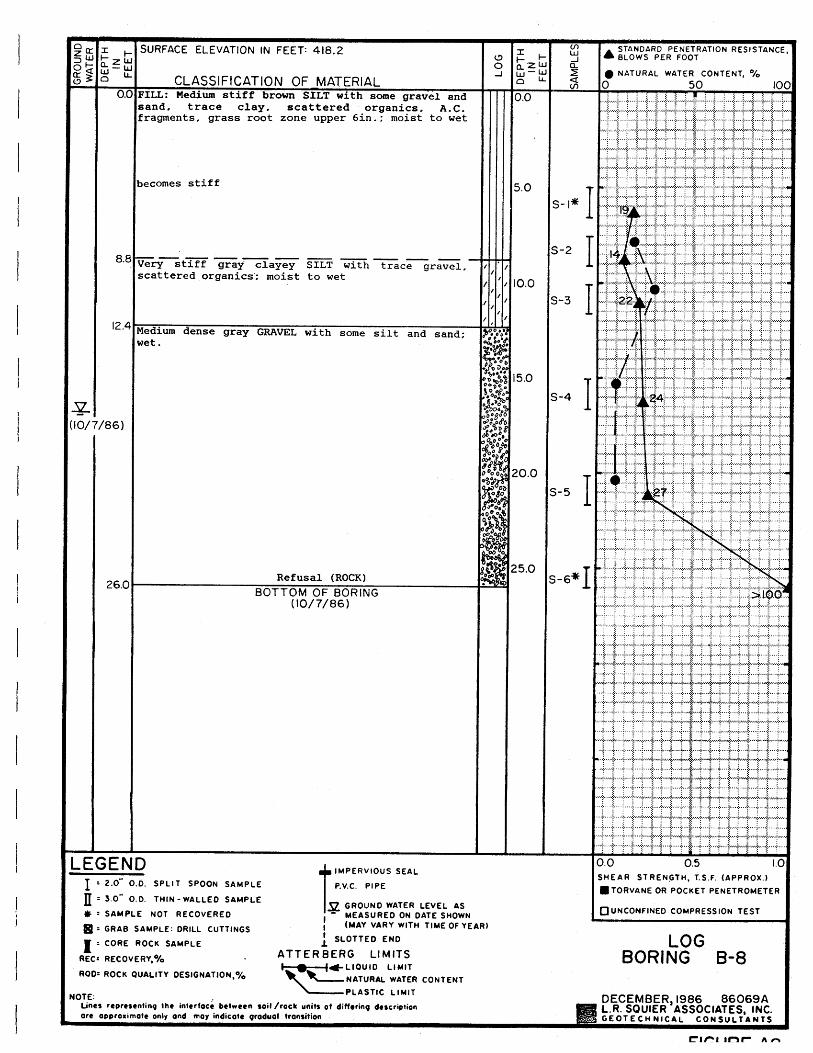
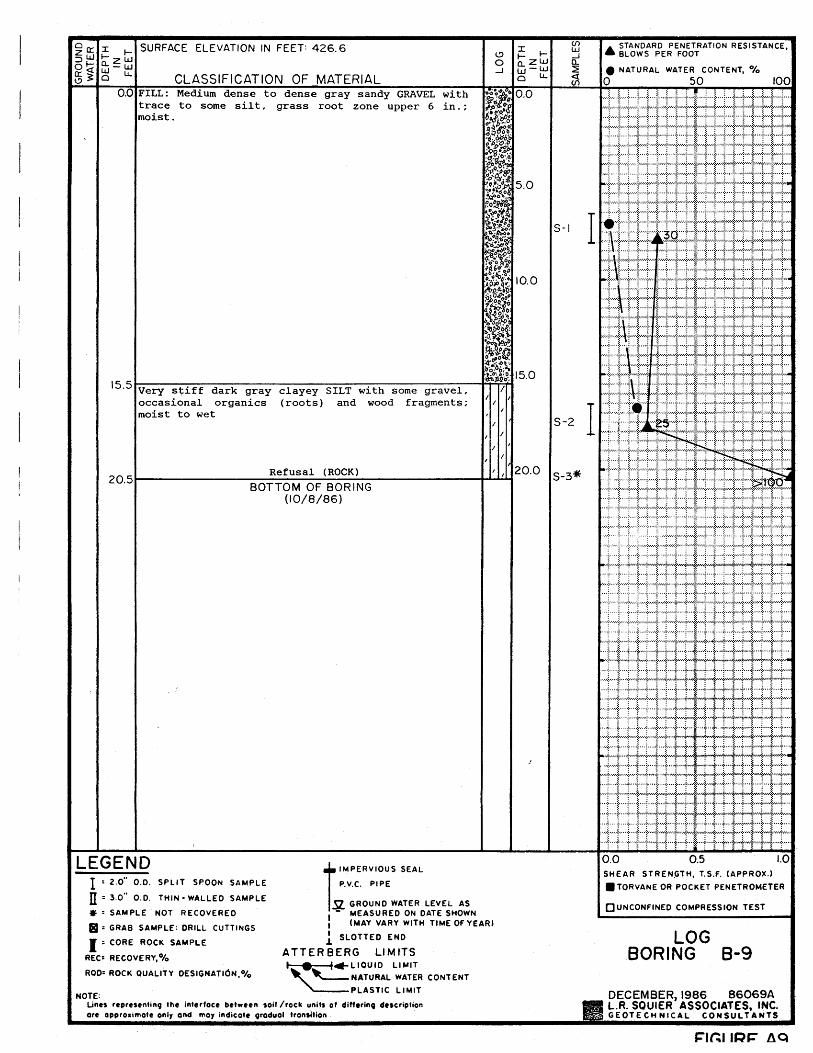
Eugene Riverfront Park. PBS’ work at the site included completing nine borings (PBS-B-1 through PBS-B-9),
laboratory testing, and engineering analyses. Our services were summarized in a geotechnical engineering
report for the project dated October 19, 2018. PBS also advanced 8 shallow borings to evaluate the possible
presence wood chip fill (hog fuel) and presented these findings in a letter report dated February 6, 2019. This
geotechnical engineering report is a continuation of PBS’ involvement in the project to develop
recommendations for site grading and infrastructure for the approximately 20-acre area encompassing nearly
nine City blocks.
2 SITE CONDITIONS
Surface Description 2.1
The site is located on a roughly triangular shaped parcel of land within the Eugene metropolitan area adjacent
to the Willamette River. The site is bordered to the north by parking areas, commercial buildings, and the
Eugene Water & Electric Board Headquarters (EWEB); to the west by High Street; to the south by a railroad line
and E 6th Avenue; and to the east by the Willamette River. Coburg Road is elevated through the site and runs
roughly north-south before crossing the Willamette River just north of the site. Several buildings currently
occupy the site, including buildings that served as EWEB operations and other associated outbuildings.
Review of available LiDAR data acquired through the DOGAMI Lidar Viewer indicates the site is generally flat
and positioned on a fluvial terrace elevated approximately 25 feet above the Willamette River along a cut bank.
Surface elevations measured from the LiDAR data indicate a relatively flat terrace surface that ranges in
elevation between 426 feet above mean sea level (amsl) and 429 feet amsl (NAVD88; DOGAMI, 2019). The site

Geotechnical Engineering Report
City of Eugene
Eugene Riverfront Development
Eugene, Oregon
3
April 24, 2019
PBS Project 73368.001
slopes abruptly down to the Willamette River at an inclination of approximately 50 to 60 degrees along the cut
bank.
Geologic Setting 2.1
Regional Geology 2.1.1
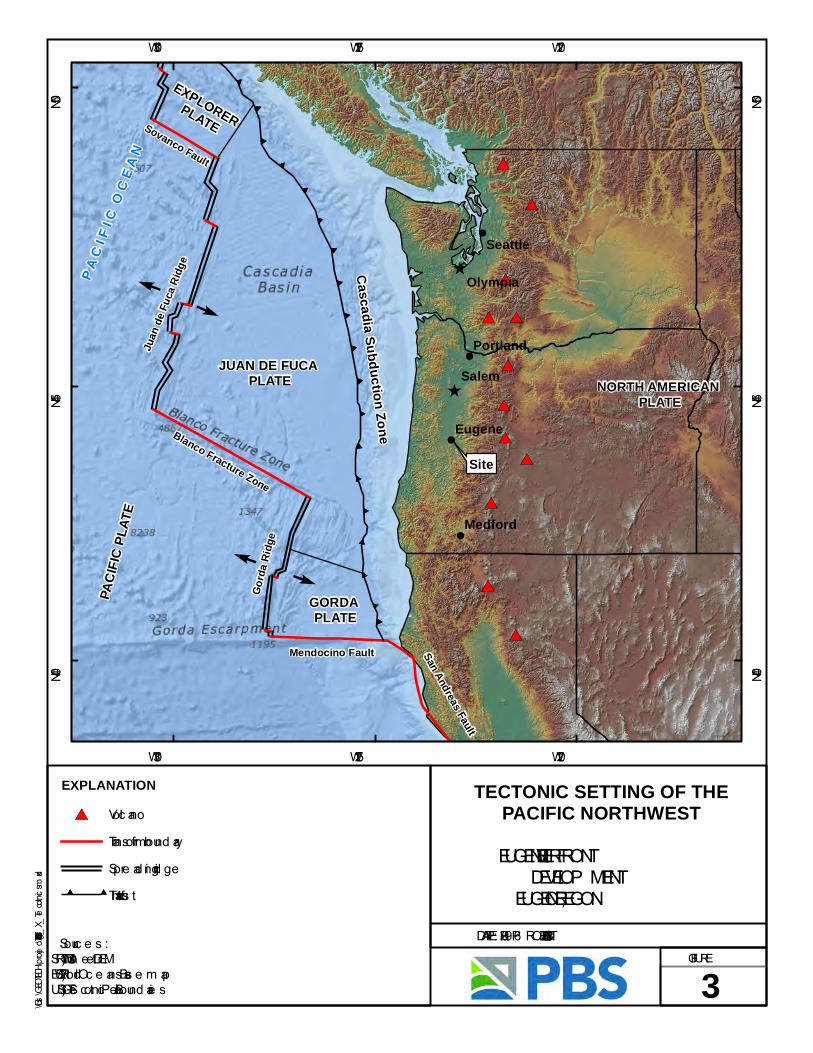
The site is located at the southern end of the Willamette Valley; a tectonic depression within the physiographic
province of the Puget-Willamette Lowland that separates the Cascade Range from the Coast Range, and
extends from the Puget Sound, Washington to Eugene, Oregon (Yeats et al., 1996). The Puget-Willamette
Lowland is situated along the Cascadia Subduction Zone (CSZ) where oceanic rocks of the Juan de Fuca Plate
are subducting beneath the North American Plate, resulting in deformation and uplift of the Coast Range and
volcanism in the Cascade Range (Figure 3). Northwest-trending faults accommodating clockwise rotation of
the North American Plate are found throughout the Puget-Willamette lowland (Brocher et al., 2017; USGS,
2019).
Structural features of the southern Willamette Valley include the north-northeast oriented Eocene age
Harrisburg anticline, numerous northwest- and northeast-trending normal faults, as well as northwest-
trending strike slip faults (McClaughry et al., 2010). Similar structures exist outside of the valley and in the
surrounding Coast Range and Cascade Range. These structures are responsible for deforming and offsetting
basement rocks and are perceived as inactive tectonic features.
The Willamette Valley forms a broad alluvial basin with the Willamette River draining northward along the axis
of the valley. Extensive valley infilling and catastrophic flooding related to the Missoula Floods during the
Quaternary has subsequently buried older Oligocene and Eocene sedimentary and volcanic basement rocks
and concealed many of the structural features throughout the valley (Wiley, 2006). Willamette River tributaries
exiting the Coast Range and Cascade Range have contributed to terrace formations and broad alluvial fans
protruding from range fronts into the valley.
The Willamette and McKenzie Rivers enter the Willamette Valley east of Eugene and form a confluence just
north of the city. These rivers continue to deposit sediments and reworked older sediments throughout much
of Eugene. Both rivers are positioned within prominent meander belts readily distinguishable within the
DOGAMI LiDAR data, and meandered freely prior to urban development.
The southern Willamette Valley terminates south of Eugene where the Cascade and coastal mountains
converge (McClaughry et al., 2010). Along the eastern margin of the valley, Oligocene volcanic rocks of the
Cascade mountains begin to emerge from younger valley sediments that are interfingered with alluvial fans
and debris fans formed from Cascade detritus. West of the Willamette Valley, accreted Eocene to Oligocene
deep marine sedimentary sequences and subaerial volcanism is encountered.
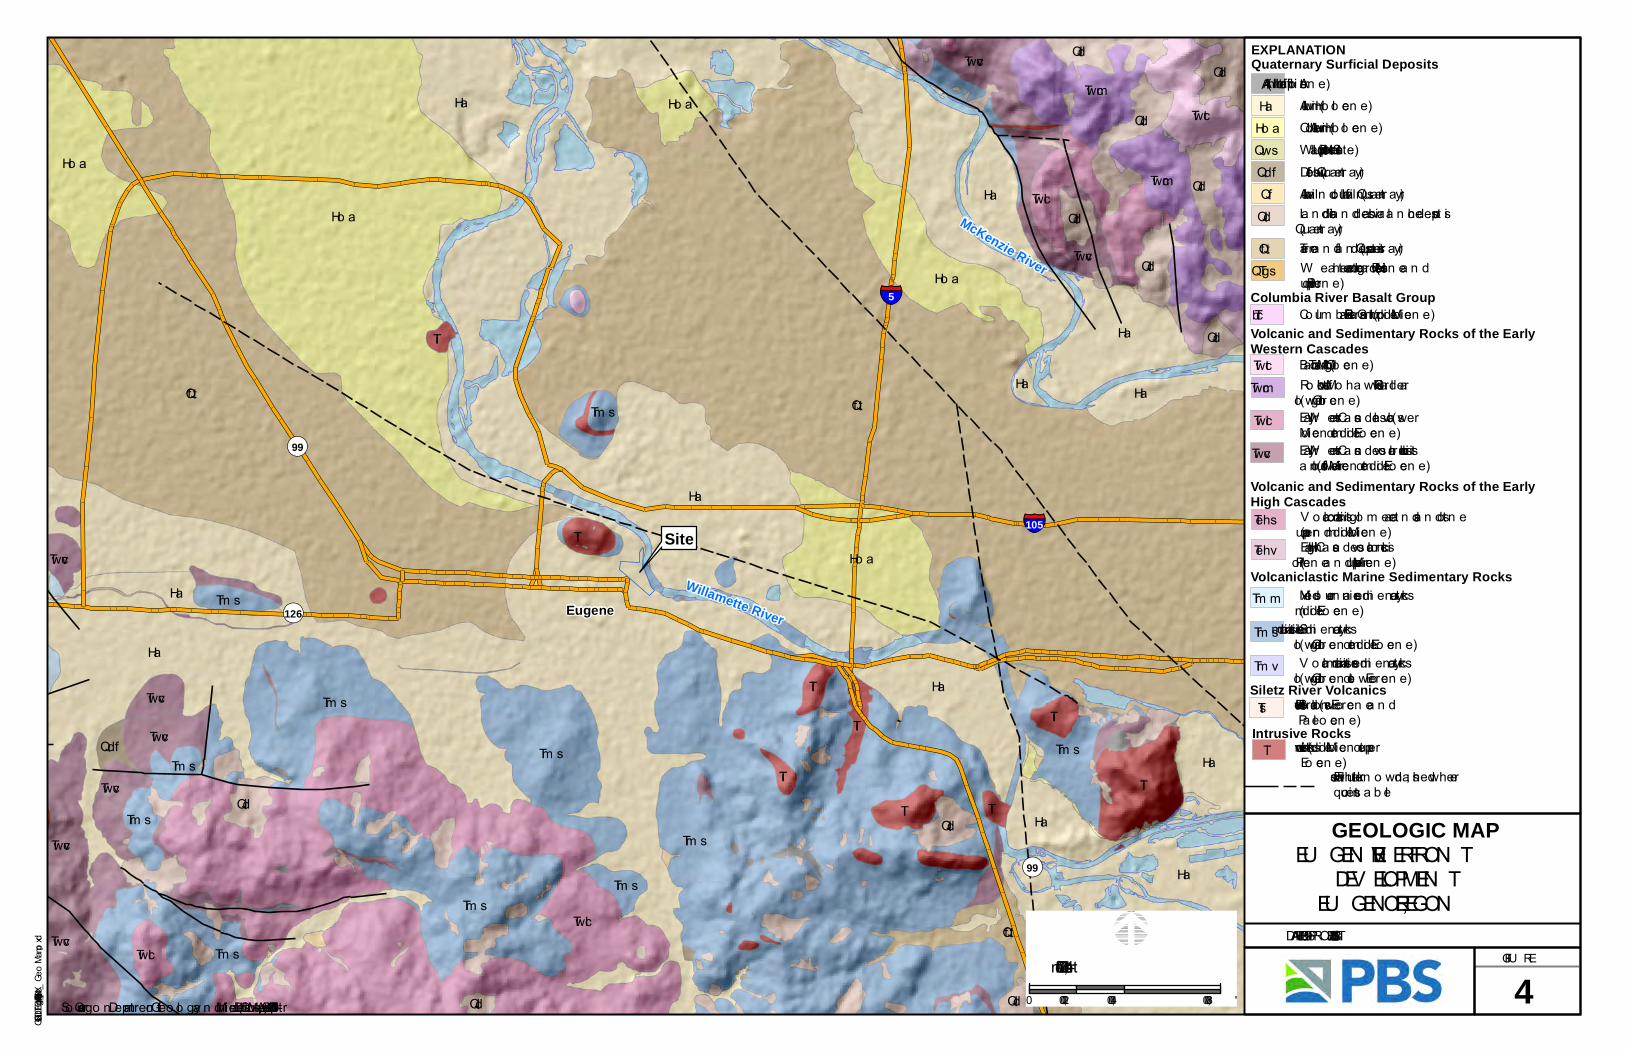
Local Geology 2.1.2
The site is underlain by Holocene alluvial sediments deposited by the Willamette River (map unit Ha, Figure 4;
McClaughry et al., 2010). These sediments consist of unconsolidated gravel, sand, silt, and clay that were
deposited within active channels and modern floodplains. These young alluvial sediments have been identified
as persisting to depths of up 50 feet bgs in the Willamette Valley and are indicated by isopach mapping by
Madin and Murray (2004) to persist to depths of approximately 25 feet below the site.
Older Oligocene to Eocene marine sedimentary rocks and mafic intrusions of the coastal range underlie the
younger Holocene and Quaternary basin fill (map unit Tms, Figure 4; McClaughry et al., 2010). These rocks are
described as micaceous and arkosic sandstone and siltstone with minor volcaniclastic conglomerates of the
Geotechnical Engineering Report
City of Eugene
Eugene Riverfront Development
Eugene, Oregon
4
April 24, 2019
PBS Project 73368.001
Tyee Formation and Lorane Shale along the western margin of the Willamette Valley, and Eugene Formation
along the eastern margin of the valley. These rocks are synonymous with previous mapping of the Eugene
Formation by Madin and Murray (2004) within the vicinity of the site. Madin and Murray (2004) described the
Eugene Formation as shallow marine sandstone and siltstone with thin conglomerate beds, colors range from
tan to brown, and are either extensively weathered or hydrothermally altered to soft pale sandstone composed
of quartz, mica, and white clay.
3 GEOLOGIC HAZARDS
Geologic and seismic hazards are defined as conditions associated with the geologic and seismic environment
that could influence existing and/or proposed improvements. Geologic and seismic hazards that could affect
the site’s development are identified below and should be considered during the planning process.
Seismicity and Faulting 3.1
Historical Seismicity 3.1.1
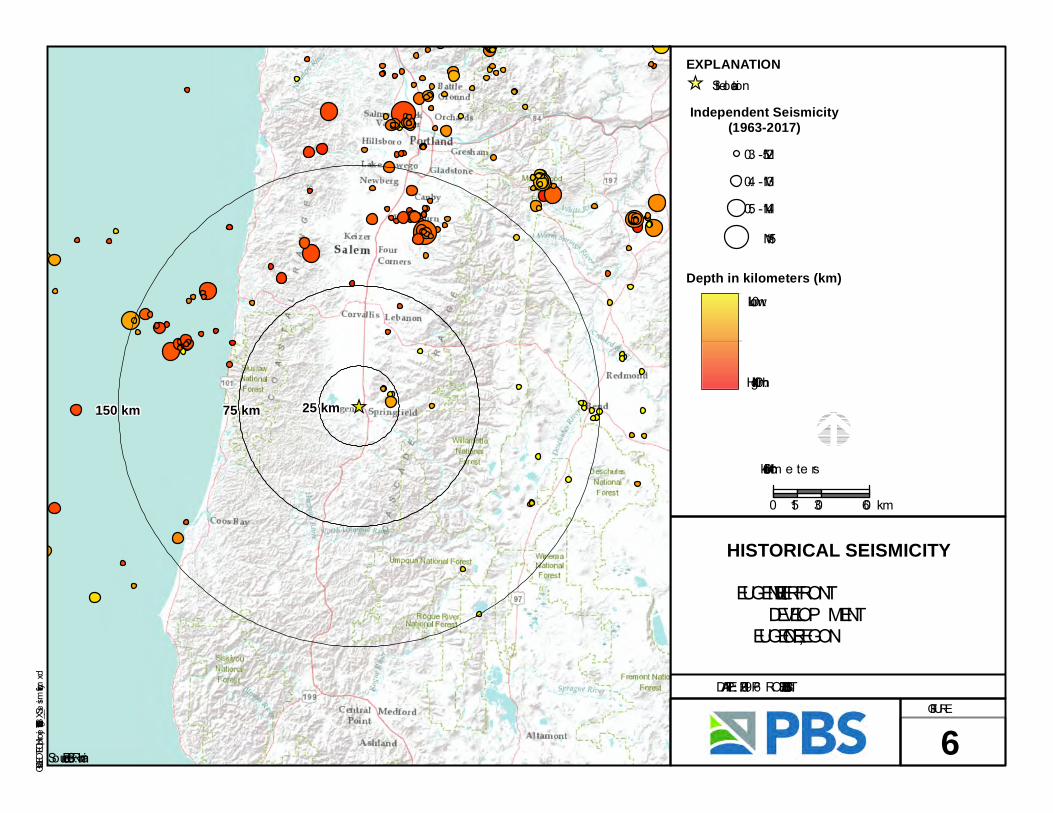
Regional historical seismicity information was acquired from the Advanced National Seismic System (ANSS)
Comprehensive Catalog, hosted by the Northern California Earthquake Data Center (NCEDC), and is presented
on Figure 6. These data include earthquakes with magnitudes exceeding M 2.5, within a 150-km radius of the
city of Eugene, Oregon, and recorded between 1963 and 2017 (NCEDC, 2017). Magnitudes within the ANSS
dataset are recorded as local magnitude, surface-wave magnitude, body-wave magnitude, moment
magnitude, and magnitude of completeness.
Seismic Sources 3.1.2
Several types of seismic sources exist in the Pacific Northwest, which are outlined below. Volcanic sources
beneath the Cascade Range are not considered further in this study. Cascade Range earthquakes rarely exceed
about M 5.0 in size and are believed be far enough removed to not pose a threat to the site (NCEDC, 2017).
Cascadia Subduction Zone (CSZ) – Interface Earthquakes 3.1.2.1
The CSZ represents the boundary between the subducting Juan de Fuca tectonic plate and the overriding
North American tectonic plate (Figure 3). Recurrence intervals for subduction zone earthquakes are based on
studies of the geologic record, with studies estimating a recurrence interval between 300 to 600 years (Atwater
and Hemphill-Haley, 1997). Geologic evidence and written records from Japan suggest the most recent
earthquake occurred in January 1700. The 1700 earthquake probably ruptured much of the approximate 620-
mile (1,000 km) length of the CSZ and was estimated at moment magnitudes of MW 9.0. The horizontal
distance from the edge of the CSZ megathrust is located approximately 115 miles (180 km) from Eugene,
Oregon. The current US Geological Survey risk-based maximum credible earthquake for CSZ megathrust is MW
9.0±0.2 (USGS, 2008).
Intraslab Earthquakes 3.1.2.2
Intraslab earthquakes occur within the subducting slab. They are problematic in the sense that they do not
have a surface expression or rupture the ground surface and their seismicity generates deformation along
many faults within the slab (Kirby et al., 2002). The CSZ has generated significant intraslab destructive
earthquakes including the 2001 MW 6.8 Nisqually earthquake in the Puget lowland. The estimated depth to the
subducting Juan de Fuca plate under Eugene is less than 50 km (Blair et al., 2011). Therefore, intraslab
earthquakes are a seismic hazard that must be considered.
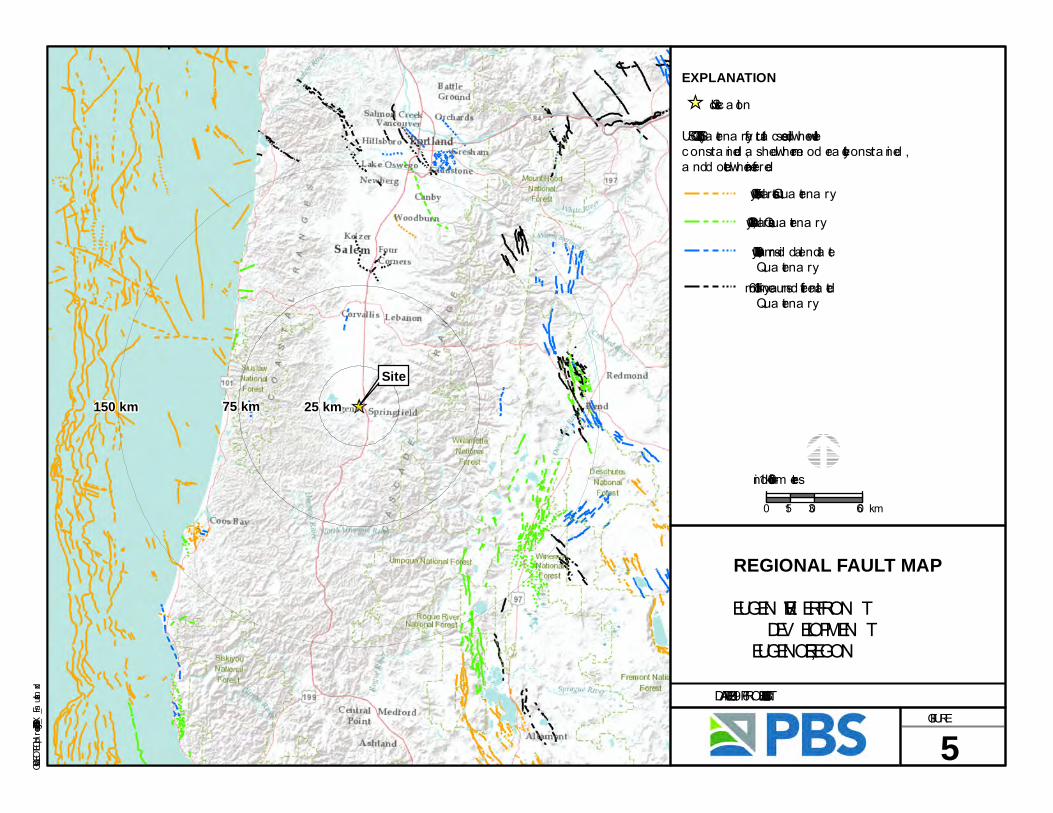
Crustal Earthquakes and Faults 3.1.2.3
Review of the USGS Quaternary Fault Database indicates the site is not located within close proximity (less than
25 km) to any Quaternary faults or tectonic features (Figure 5; USGS, 2019).
Geotechnical Engineering Report
City of Eugene
Eugene Riverfront Development
Eugene, Oregon
5
April 24, 2019
PBS Project 73368.001
Seismic Hazards 3.1.3
Other site-specific seismic hazards considered include earthquake-induced landslides, fault rupture, seiche and
tsunami inundation, and earthquake shaking. Based on the flat surface topography and geology at the site, the
risk from landslides and earthquake-induced landslides is absent. Due to the location of the site, the risk of
seiche and tsunami inundation are also absent. Review of Oregon HazVu indicates the site is located within a
zone of moderate liquefaction hazards, which will be discussed in further detail below (DOGAMI, 2019). Strong
earthquake ground shaking will occur during a code-based seismic event on the CSZ as well as from local
faults. Based on our current project understanding, our opinion is that effects of earthquake ground motions
can be accounted for by using code-based design procedures and the code-based design response spectrum.
Liquefaction and lateral spreading 3.1.3.1
Liquefaction is defined as a decrease in the shear resistance of loose, saturated, cohesionless soil (e.g., sand) or
low plasticity silt soils, due to the buildup of excess pore pressures generated during an earthquake. This could
result in a temporary transformation of the soil deposit into a viscous fluid. Liquefaction can result in ground
settlement, foundation bearing capacity failure, and lateral spreading of ground.
Based on a review of the Oregon Statewide Geohazard Viewer (HazVu), the site is shown as having a moderate
liquefaction hazard; however, based on the estimated depth of groundwater, soil types, and relative density of
site soils encountered below groundwater elevations in our explorations, our current opinion is that the risk of
structurally damaging liquefaction settlement and lateral spreading at the site is low. Subsequently, the risk of
structurally damaging lateral spreading is also low.
Flooding 3.2
Flooding occurs when local creeks, streams, rivers, and bays are not able to transfer water away from a local
area faster than the rate of accumulating water. This can occur on a local or regional scale and is highly
variable based upon the configuration of individual watersheds. In the context of the Willamette River, distant
upland precipitation or rapid snowmelt can have significant impact far downstream where the weather may be
different. Regardless, destruction of land, infrastructure, and personal property can occur when banks, levees,
and flood plains are inundated with stormwater or rapid snowmelt.
The shoreline and embankment immediately adjacent to the Willamette River is mapped within an area
susceptible to 100-year flood events (FEMA, 1999). While the site is outside of the 100-year mapped flood
zone due to elevation, we note that the cut bank is mapped within the flood zone; therefore, this bank may be
subject to erosion during high discharge and flooding. The western portion of the site is within the 500-year
flood model and will become submerged during such a flood event.
Subsurface Conditions 3.3
The site was explored by drilling eleven borings, designated B-10 through B-20, to depths of 16.5 to 31.5 feet
bgs. The drilling was performed by Holt Services, Inc., of Vancouver, Washington, using a track-mounted
Terrasonic 150 drill rig and sonic vibratory drilling techniques.
Geotechnical Engineering Report
City of Eugene
Eugene Riverfront Development
Eugene, Oregon
6
April 24, 2019
PBS Project 73368.001
PBS has summarized the subsurface units as follows:
ASPHALT: Asphalt was encountered in borings B-11 through B-19 from the ground surface and
was approximately 6 inches thick.
GRAVEL FILL
(GW/GP FILL):
Well-graded to poorly graded gravel fill was encountered in all borings from the ground
surface or below the asphalt to depths between 1.5 to 15 feet bgs. In general, the
material was loose to dense, olive-brown to gray, moist, contained rounded to angular
gravel, fine- to medium-grained sand, varying amounts of fines from silt to clay, and old
construction materials including concrete and rebar.
ELASTIC SILT,
SILT, AND
ORGANIC SOIL
(MH, ML, OL):
Fine-grained fluvial deposits with interbedded lenses of coarse-grained materials were
encountered in all borings between 1.5 and 22.5 feet bgs. The material was soft to very
stiff, dark gray to brown, moist to wet, exhibited low- to high-plasticity, contained fine-
to medium-grained sand, rounded to subrounded gravels, and decomposed organics.
POORLY
GRADED
GRAVEL AND
POORLY
GRADED SAND
(GP-GM, SP-
SM):
Coarse-grained fluvial deposits were encountered in all borings between 3 to 30 feet bgs
and were interbedded to various degrees with the above-mentioned fine-grained soils.
The materials encountered ranged from poorly graded gravel with sand, silt, and clay to
poorly graded sand with gravel. The material ranged in density from loose to dense,
gray to brown, moist to wet, with fine- to coarse-, rounded- to subrounded-gravels,
fine- to coarse-grained sand, and varying amounts of silt and clay.
WEATHERED
BEDROCK AND
LEAN CLAY (RX,
CL):
Lean clay and weathered bedrock were encountered in borings B-10, B-11, B-12, B-13,
B-14, B-15, and B-17 at depths of 26, 21, 25, 30, 22, 26, and 26 feet bgs, respectively, to
termination depth. The material was stiff to hard, olive-gray, greenish-gray, olive-yellow,
and blue-gray, exhibited medium to high plasticity, and contained medium- to coarse-
grained sand and trace gravels.
Groundwater 3.4
Based on the presence of relatively permeable gravel at the site and its proximity to the Willamette River, we
estimate these are hydraulically connected and the water levels in the river may reflect the elevation of
groundwater on the site. Previous geotechnical explorations at the site generally encountered groundwater at
depths of 18 to 20 feet bgs. Samples collected from borings were generally characterized as wet below depths
of 15 to 20 feet bgs. Please note that groundwater levels can fluctuate during the year depending on climate,
irrigation season, extended periods of precipitation, drought, and other factors.
Piezometers 3.4.1
Three piezometers were installed to depths of 30 feet bgs in borings B-11, B-13, and B-15 to collect
groundwater depths through the spring and summer. Piezometers consist of 1-inch diameter PVC casing with
10 feet of screen, backfilled with sand, sealed from the surface with bentonite, and protected with a flush
monument embedded in concrete.
Infiltration Testing 3.5
PBS completed two cased-hole, falling head infiltration tests in borings B-13 and B-14 at a depth of 5 feet bgs.
The infiltration tests were conducted within the 6-inch inside diameter casing used to advance the sonic
boring. The casing was filled with water to achieve a minimum 1-foot-high column of water. After a period of
saturation, the height of the water column in the casing was then measured initially and at regular, timed
Geotechnical Engineering Report
City of Eugene
Eugene Riverfront Development
Eugene, Oregon
7
April 24, 2019
PBS Project 73368.001
intervals. No measurable change was observed in the water level during testing; therefore, infiltration in these
areas and at these depths is not recommended.
4 CONCLUSIONS AND RECOMMENDATIONS
Geotechnical Design Considerations 4.1
The subsurface conditions at the site consist of clay, silt, sand, gravel, and mixtures of those materials. Based on
our observations and analyses, conventional foundation support on shallow spread footings is likely feasible
for support of lightly loaded structures. Deep foundations that derive their capacity from embedment into the
underlying gravel and siltstone will likely be required for multi-story structures. Excavation with conventional
equipment is feasible at the site.
The grading and final development plans for the project had not been completed when this report was
prepared. Once completed, PBS should be engaged to review the project plans and update our
recommendations as necessary.
Groundwater Control 4.2
Due to the rapid response of groundwater to water levels in the adjacent Willamette River, we recommend
design groundwater levels be assumed as near the river flood elevations for the 100- and 500-year events.
Therefore, we recommend the below-grade portions of the structures be designed as water-tight.
Consideration should be given to resisting buoyant uplift and hydrostatic pressure. Cold joints between
basement walls or between walls and footings should include water stops. The perimeter ground surface and
hardscaping should be sloped to drain away from all structures.
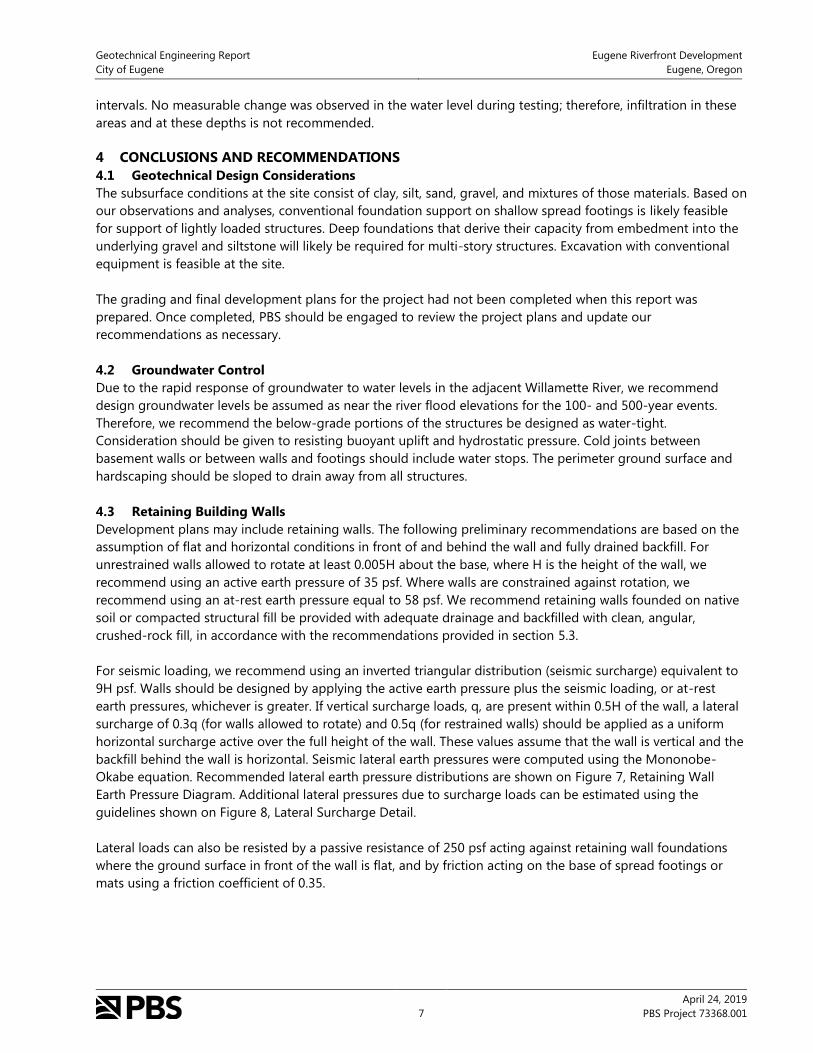
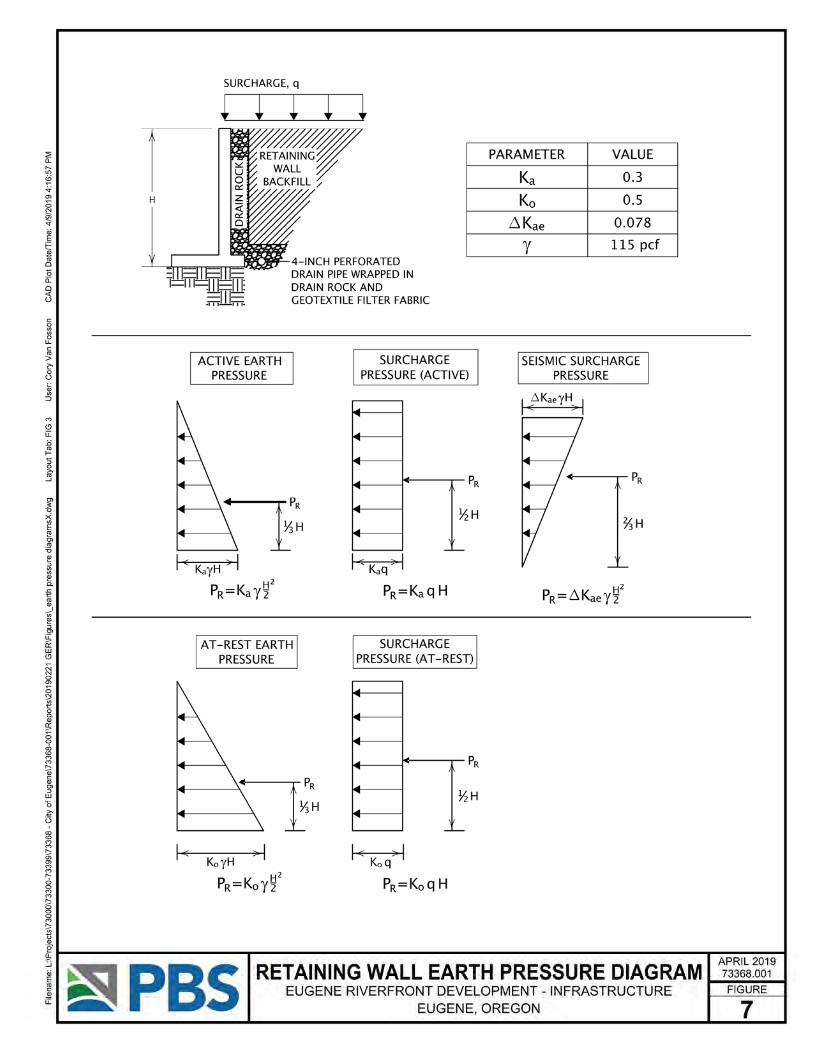
Retaining Building Walls 4.3
Development plans may include retaining walls. The following preliminary recommendations are based on the
assumption of flat and horizontal conditions in front of and behind the wall and fully drained backfill. For
unrestrained walls allowed to rotate at least 0.005H about the base, where H is the height of the wall, we
recommend using an active earth pressure of 35 psf. Where walls are constrained against rotation, we
recommend using an at-rest earth pressure equal to 58 psf. We recommend retaining walls founded on native
soil or compacted structural fill be provided with adequate drainage and backfilled with clean, angular,
crushed-rock fill, in accordance with the recommendations provided in section 5.3.
For seismic loading, we recommend using an inverted triangular distribution (seismic surcharge) equivalent to
9H psf. Walls should be designed by applying the active earth pressure plus the seismic loading, or at-rest
earth pressures, whichever is greater. If vertical surcharge loads, q, are present within 0.5H of the wall, a lateral
surcharge of 0.3q (for walls allowed to rotate) and 0.5q (for restrained walls) should be applied as a uniform
horizontal surcharge active over the full height of the wall. These values assume that the wall is vertical and the
backfill behind the wall is horizontal. Seismic lateral earth pressures were computed using the Mononobe-
Okabe equation. Recommended lateral earth pressure distributions are shown on Figure 7, Retaining Wall
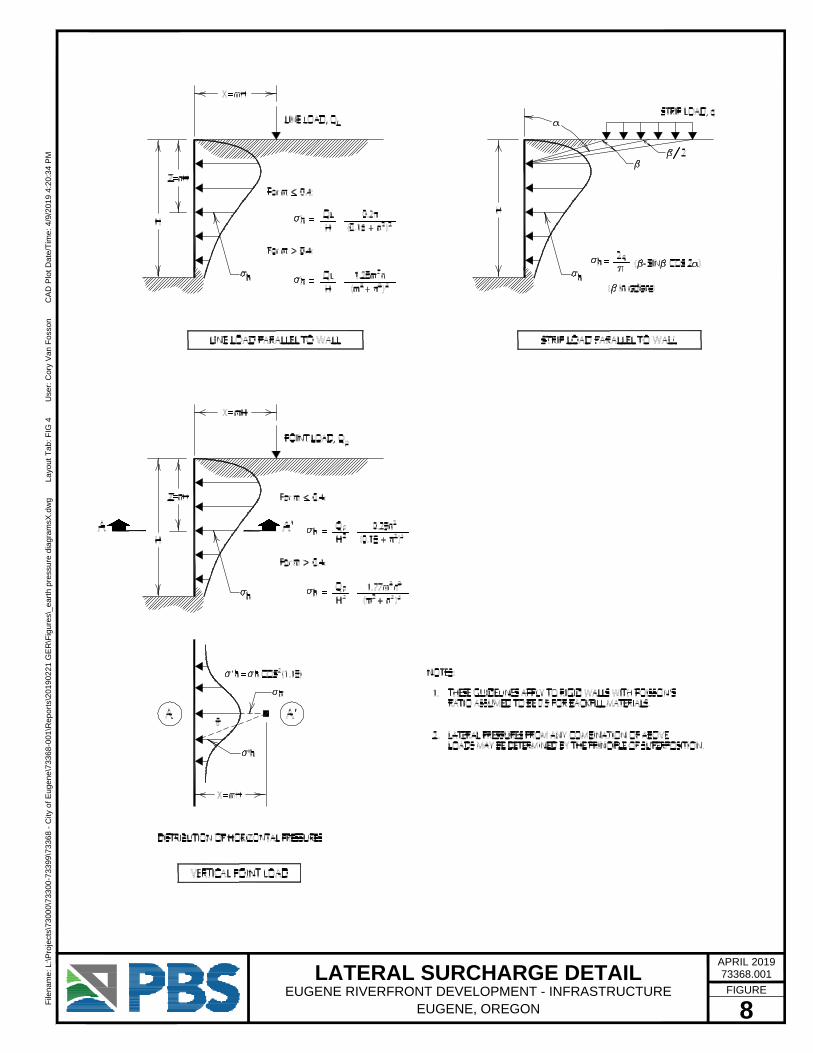
Earth Pressure Diagram. Additional lateral pressures due to surcharge loads can be estimated using the
guidelines shown on Figure 8, Lateral Surcharge Detail.
Lateral loads can also be resisted by a passive resistance of 250 psf acting against retaining wall foundations
where the ground surface in front of the wall is flat, and by friction acting on the base of spread footings or
mats using a friction coefficient of 0.35.
Geotechnical Engineering Report
City of Eugene
Eugene Riverfront Development
Eugene, Oregon
8
April 24, 2019
PBS Project 73368.001
Drainage 4.3.1
Recommended lateral earth pressures assume that walls are fully drained and no hydrostatic pressures
develop. For cantilevered concrete walls, a minimum 2-foot-wide zone of free-draining material should be
installed immediately behind the wall. A 4-inch diameter perforated drain pipe should be installed at the base
of the drain rock and routed to a suitable discharge point approved by the civil engineer.
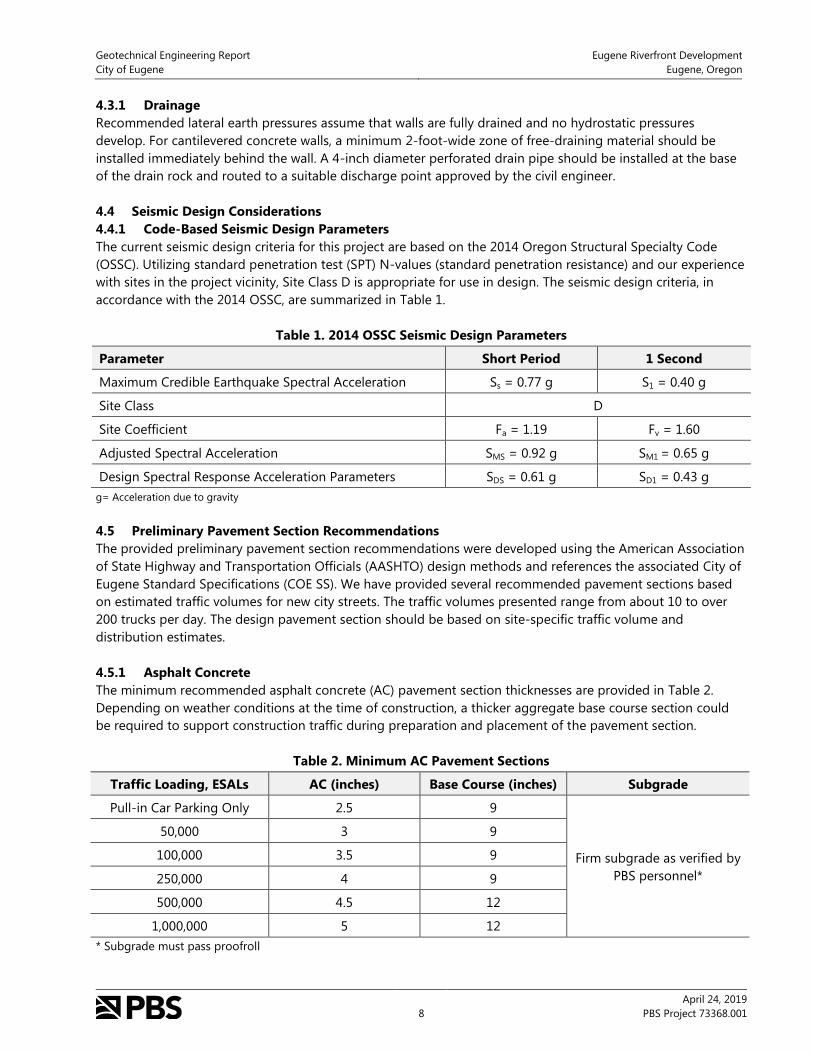
Seismic Design Considerations 4.4
Code-Based Seismic Design Parameters 4.4.1
The current seismic design criteria for this project are based on the 2014 Oregon Structural Specialty Code
(OSSC). Utilizing standard penetration test (SPT) N-values (standard penetration resistance) and our experience
with sites in the project vicinity, Site Class D is appropriate for use in design. The seismic design criteria, in
accordance with the 2014 OSSC, are summarized in Table 1.
Table 1. 2014 OSSC Seismic Design Parameters
Parameter Short Period 1 Second
Maximum Credible Earthquake Spectral Acceleration Ss = 0.77 g S1 = 0.40 g
Site Class D
Site Coefficient Fa = 1.19 Fv = 1.60
Adjusted Spectral Acceleration SMS = 0.92 g SM1 = 0.65 g
Design Spectral Response Acceleration Parameters SDS = 0.61 g SD1 = 0.43 g
g= Acceleration due to gravity
Preliminary Pavement Section Recommendations 4.5
The provided preliminary pavement section recommendations were developed using the American Association
of State Highway and Transportation Officials (AASHTO) design methods and references the associated City of
Eugene Standard Specifications (COE SS). We have provided several recommended pavement sections based
on estimated traffic volumes for new city streets. The traffic volumes presented range from about 10 to over
200 trucks per day. The design pavement section should be based on site-specific traffic volume and
distribution estimates.
Asphalt Concrete 4.5.1
The minimum recommended asphalt concrete (AC) pavement section thicknesses are provided in Table 2.
Depending on weather conditions at the time of construction, a thicker aggregate base course section could
be required to support construction traffic during preparation and placement of the pavement section.
Table 2. Minimum AC Pavement Sections
Traffic Loading, ESALs AC (inches) Base Course (inches) Subgrade
Pull-in Car Parking Only 2.5 9
Firm subgrade as verified by
PBS personnel*
50,000 3 9
100,000 3.5 9
250,000 4 9
500,000 4.5 12
1,000,000 5 12
* Subgrade must pass proofroll
Geotechnical Engineering Report
City of Eugene
Eugene Riverfront Development
Eugene, Oregon
9
April 24, 2019
PBS Project 73368.001
The asphalt cement binder should be selected following COE SS 00744.11 – Asphalt Cement and Additives. The
AC should consist of ½-inch hot mix asphalt concrete (HMAC) with a maximum lift thickness of 3 inches. The
AC should conform to COE SS 00744.13 and 00744.14 and be compacted to 91 percent of the maximum
theoretical density (Rice value) of the mix, as determined in accordance with ASTM D2041.
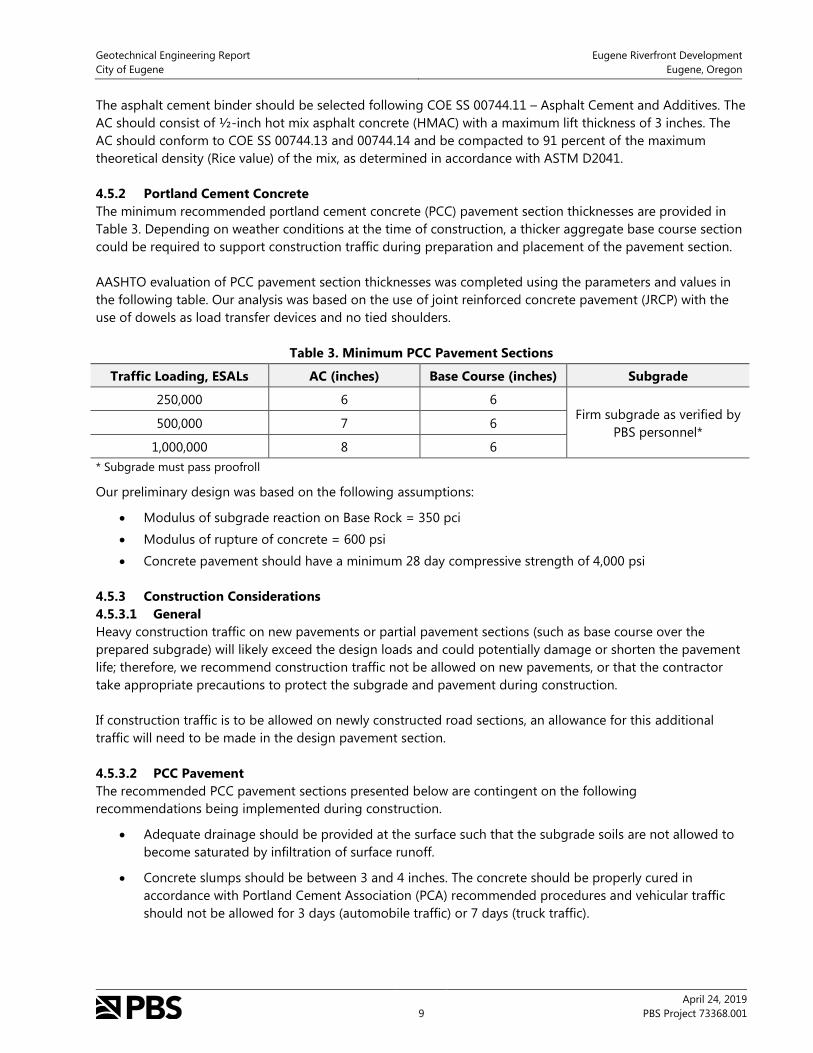
Portland Cement Concrete 4.5.2
The minimum recommended portland cement concrete (PCC) pavement section thicknesses are provided in
Table 3. Depending on weather conditions at the time of construction, a thicker aggregate base course section
could be required to support construction traffic during preparation and placement of the pavement section.
AASHTO evaluation of PCC pavement section thicknesses was completed using the parameters and values in
the following table. Our analysis was based on the use of joint reinforced concrete pavement (JRCP) with the
use of dowels as load transfer devices and no tied shoulders.
Table 3. Minimum PCC Pavement Sections
Traffic Loading, ESALs AC (inches) Base Course (inches) Subgrade
250,000 6 6 Firm subgrade as verified by
PBS personnel* 500,000 7 6
1,000,000 8 6
* Subgrade must pass proofroll
Our preliminary design was based on the following assumptions:
Modulus of subgrade reaction on Base Rock = 350 pci
Modulus of rupture of concrete = 600 psi
Concrete pavement should have a minimum 28 day compressive strength of 4,000 psi
Construction Considerations 4.5.3
General 4.5.3.1
Heavy construction traffic on new pavements or partial pavement sections (such as base course over the
prepared subgrade) will likely exceed the design loads and could potentially damage or shorten the pavement
life; therefore, we recommend construction traffic not be allowed on new pavements, or that the contractor
take appropriate precautions to protect the subgrade and pavement during construction.
If construction traffic is to be allowed on newly constructed road sections, an allowance for this additional
traffic will need to be made in the design pavement section.
PCC Pavement 4.5.3.2
The recommended PCC pavement sections presented below are contingent on the following
recommendations being implemented during construction.
Adequate drainage should be provided at the surface such that the subgrade soils are not allowed to
become saturated by infiltration of surface runoff.
Concrete slumps should be between 3 and 4 inches. The concrete should be properly cured in
accordance with Portland Cement Association (PCA) recommended procedures and vehicular traffic
should not be allowed for 3 days (automobile traffic) or 7 days (truck traffic).
Geotechnical Engineering Report
City of Eugene
Eugene Riverfront Development
Eugene, Oregon
10
April 24, 2019
PBS Project 73368.001
To help offset shrinkage, concrete pavement may be reinforced with at least No. 3 bars, 24 inches on-
center each way, or 6x6-W2.0xW2.0 wire mesh (located 1/3 of the slab thickness from the top of the
slab).
Over-finishing of concrete pavements should be avoided. Typically, a broom or burlap drag finish
should be used.
Temporary Shoring 4.6
A wide variety of shoring systems are available. Among the most commonly used shoring walls in the area are
soldier piles with tiebacks, sheet pile walls, and braces and struts. Sheet pile walls may not be feasible for this
excavation due to the limits on driving or vibrating piles, as well as the gravel content of the subsurface soils. In
our current opinion, a soldier pile wall, combined with braces and struts or tiebacks, which would include piles
installed into drilled holes into the underlying dense gravel, may be used for shoring. These shoring systems
are discussed in general terms in the following paragraphs.
Soldier Pile Wall (with Tiebacks) 4.6.1
For one-level excavation, the soldier pile wall may not require tiebacks (pending structural engineer or wall
designer approval). Soldier pile walls are generally constructed using steel H-piles placed into augered holes
drilled at intervals along the wall alignment. The holes are then backfilled with weak concrete. The soil in front
of the wall is excavated from the top down. As the soil is exposed, the weak concrete is chipped away and
lagging is fitted between the H-piles. Lagging may be inserted behind the flanges or attached to the face of
the flanges. The lagging usually consists of wood planks or steel plates. The soil is temporarily supported by
arching between adjacent steel H-piles until the lagging is installed. However, soft/loose soils (and debris fill)
common to the site vicinity typically slough into the excavation until the lagging is installed and soil is in
contact with the lagging. Tieback soil anchors are installed to provide lateral resistance. They can be provided
at any location along the wall, but are most commonly installed in rows after excavation reaches certain design
levels. Their location, number, and capacities are designed to provide the lateral load capacity needed to resist
the applied earth pressures with a suitable factor of safety. Please note that the potential settlement of
surrounding soils is highly dependent on the contractor’s approach to constructing the wall, and some
additional risk is thereby incurred.
Braces and Struts 4.6.2
Braces and struts are typically used in conjunction with different shoring wall types at locations where external
supports (such as tieback anchors, “dead-man” anchors, and soil nails) cannot be used. Internal supports may
include “cross-lot” braces and diagonal struts or “rakers.” Braces and struts span across the excavation. These
are probably the least practical for use at the site due to the relatively wide spans to be shored.
Soil Parameters 4.6.3
The soil parameters commonly used for the design of temporary excavation shoring and embedded wall
structures are soil unit weight “γ”, soil internal friction angle “ɸ”, and soil cohesion “c”. The soil parameters
recommended for use in the excavation shoring and permanent retaining structure design are presented in the
following Table 4, Soil Parameters for Temporary Shoring. Passive resistance should be neglected over the top
24 inches of embedment.
Geotechnical Engineering Report
City of Eugene
Eugene Riverfront Development
Eugene, Oregon
11
April 24, 2019
PBS Project 73368.001
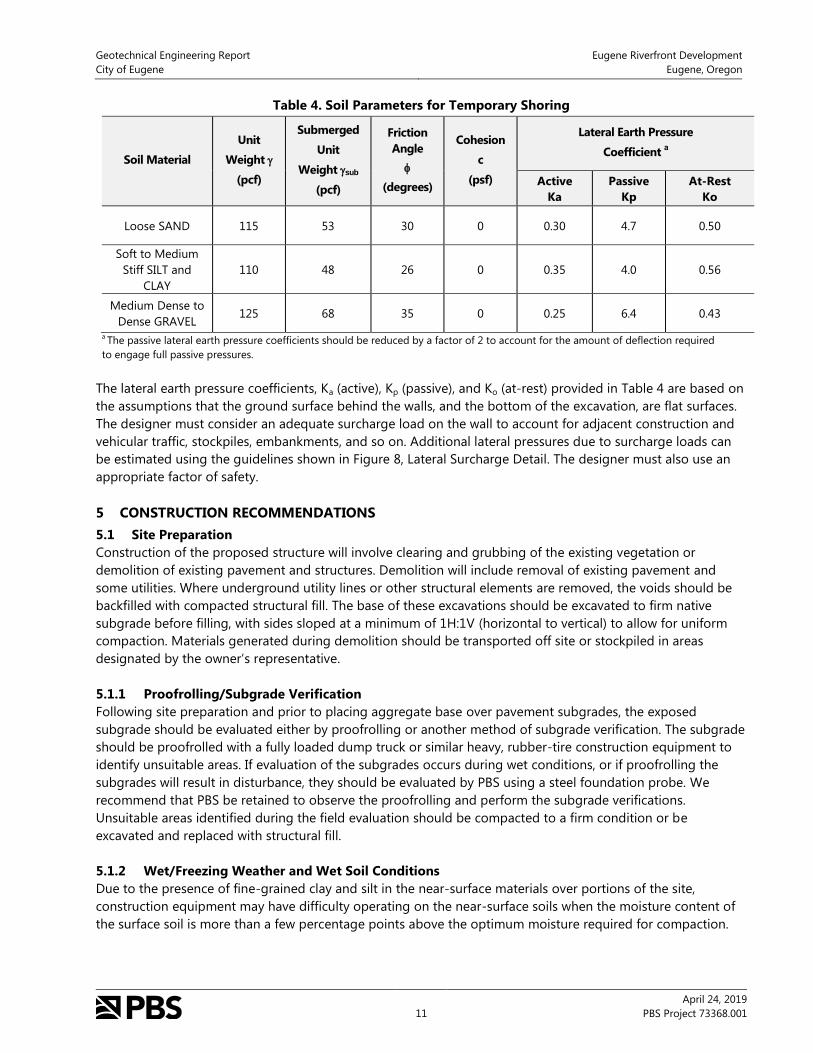
Table 4. Soil Parameters for Temporary Shoring
Soil Material
Unit
Weight
(pcf)
Submerged
Unit
Weight sub
(pcf)
Friction
Angle
(degrees)
Cohesion
c
(psf)
Lateral Earth Pressure
Coefficient a
Active
Ka
Passive
Kp
At-Rest
Ko
Loose SAND 115 53 30 0 0.30 4.7 0.50
Soft to Medium
Stiff SILT and
CLAY
110 48 26 0 0.35 4.0 0.56
Medium Dense to
Dense GRAVEL 125 68 35 0 0.25 6.4 0.43
a The passive lateral earth pressure coefficients should be reduced by a factor of 2 to account for the amount of deflection required
to engage full passive pressures.
The lateral earth pressure coefficients, Ka (active), Kp (passive), and Ko (at-rest) provided in Table 4 are based on
the assumptions that the ground surface behind the walls, and the bottom of the excavation, are flat surfaces.
The designer must consider an adequate surcharge load on the wall to account for adjacent construction and
vehicular traffic, stockpiles, embankments, and so on. Additional lateral pressures due to surcharge loads can
be estimated using the guidelines shown in Figure 8, Lateral Surcharge Detail. The designer must also use an
appropriate factor of safety.
5 CONSTRUCTION RECOMMENDATIONS
Site Preparation 5.1
Construction of the proposed structure will involve clearing and grubbing of the existing vegetation or
demolition of existing pavement and structures. Demolition will include removal of existing pavement and
some utilities. Where underground utility lines or other structural elements are removed, the voids should be
backfilled with compacted structural fill. The base of these excavations should be excavated to firm native
subgrade before filling, with sides sloped at a minimum of 1H:1V (horizontal to vertical) to allow for uniform
compaction. Materials generated during demolition should be transported off site or stockpiled in areas
designated by the owner’s representative.
Proofrolling/Subgrade Verification 5.1.1
Following site preparation and prior to placing aggregate base over pavement subgrades, the exposed
subgrade should be evaluated either by proofrolling or another method of subgrade verification. The subgrade
should be proofrolled with a fully loaded dump truck or similar heavy, rubber-tire construction equipment to
identify unsuitable areas. If evaluation of the subgrades occurs during wet conditions, or if proofrolling the
subgrades will result in disturbance, they should be evaluated by PBS using a steel foundation probe. We
recommend that PBS be retained to observe the proofrolling and perform the subgrade verifications.
Unsuitable areas identified during the field evaluation should be compacted to a firm condition or be
excavated and replaced with structural fill.
Wet/Freezing Weather and Wet Soil Conditions 5.1.2
Due to the presence of fine-grained clay and silt in the near-surface materials over portions of the site,
construction equipment may have difficulty operating on the near-surface soils when the moisture content of
the surface soil is more than a few percentage points above the optimum moisture required for compaction.
Geotechnical Engineering Report
City of Eugene
Eugene Riverfront Development
Eugene, Oregon
12
April 24, 2019
PBS Project 73368.001
Soils disturbed during site preparation activities, or unsuitable areas identified during proofrolling or probing,
should be removed and replaced with compacted structural fill.
Site earthwork and subgrade preparation should not be completed during freezing conditions, except for mass
excavation to the subgrade design elevations.
Protection of the subgrade is the responsibility of the contractor. Construction of granular haul roads to the
project site entrance may help reduce further damage to the pavement and disturbance of site soils. Staging
areas should be a minimum of 12 inches thick and haul roads should at least 18- to 24-inches-thick. The actual
thickness of haul roads and staging areas should be based on the contractors’ approach to site development,
and the amount and type of construction traffic. The imported granular material should be placed in one lift
over the undisturbed subgrade and compacted using a smooth-drum, non-vibratory roller. A geotextile fabric
should be used to separate the subgrade from the imported granular material in areas of repeated
construction traffic. The geotextile should meet the specifications of COE SS Section 02320.10 and 02320.20,
Table 02320-1 for soil separation. The geotextile should be installed in conformance with COE SS 00350 –
Geosynthetic Installation.
Excavation 5.2
The near-surface soils at the site can be excavated with conventional earthwork equipment. Sloughing and
caving should be anticipated. All excavations should be made in accordance with applicable Occupational
Safety and Health Administration (OSHA) and state regulations. The contractor is solely responsible for
adherence to the OSHA requirements. Trench cuts should stand relatively vertical to a depth of approximately
4 feet bgs, provided no groundwater seepage is present in the trench walls. Open excavation techniques may
be used provided the excavation is configured in accordance with the OSHA requirements, groundwater
seepage is not present, and with the understanding that some sloughing may occur. Trenches/excavations
should be flattened if sloughing occurs or seepage is present. Use of a trench shield or other approved
temporary shoring is recommended if vertical walls are desired for cuts deeper than 4 feet bgs. If dewatering is
used, we recommend that the type and design of the dewatering system be the responsibility of the
contractor, who is in the best position to choose systems that fit the overall plan of operation.
Structural Fill 5.3
The extent of site grading is currently unknown; however, PBS estimates that cuts of up to 10 feet to
accommodate utilities and fills of less than 5 feet may be incorporated into the project plans. Structural fill
should be placed over subgrade that has been prepared in conformance with the Site Preparation and
Wet/Freezing Weather and Wet Soil Conditions sections of this report. Structural fill material should consist of
relatively well-graded soil, or an approved rock product that is free of organic material and debris and contains
particles not greater than 4 inches nominal dimension.
The suitability of soil for use as compacted structural fill will depend on the gradation and moisture content of
the soil when it is placed. As the amount of fines (material finer than the US Standard No. 200 Sieve) increases,
soil becomes increasingly sensitive to small changes in moisture content and compaction becomes more
difficult to achieve. Soils containing more than about 5 percent fines, based upon the No. 4 sieve fraction,
cannot consistently be compacted to a dense, non-yielding condition when the water content is significantly
greater (or significantly less) than optimum.
On-Site Soil 5.3.1
On-site soils encountered in our explorations consist of clay, silt, sand, gravel, and mixtures of these materials.
Fine-grained soils free of organics are generally suitable for placement as structural fill during moderate, dry
Geotechnical Engineering Report
City of Eugene
Eugene Riverfront Development
Eugene, Oregon
13
April 24, 2019
PBS Project 73368.001
weather when moisture content can be maintained by air drying and/or addition of water. The fine-grained
fraction of the site soils are moisture sensitive, and during wet weather, may become unworkable because of
excess moisture content. In order to reduce moisture content, some aerating and drying of fine-grained soils
may be required. Sand and gravel with less than 5 percent passing the US No. 200 sieve, may be suitable for
use during wet conditions. These materials should be placed in lifts with a maximum uncompacted thickness of
approximately 8 inches and compacted to at least 92 percent of the maximum dry density, as determined by
ASTM D1557 (modified proctor).
Borrow Material 5.3.2
Borrow material for general structural fill construction should meet the requirements set forth in COE SS
00330.12 – Borrow Material. When used as structural fill, borrow material should be placed in lifts with a
maximum uncompacted thickness of approximately 8 inches and compacted to not less than 92 percent of the
maximum dry density, as determined by ASTM D1557.
Select Granular Fill 5.3.3
Selected granular backfill used during periods of wet weather for structural fill construction should meet the
specifications provided in COE SS 00330.14 – Selected Granular Backfill. The imported granular material should
be uniformly moisture conditioned to within about 2 percent of the optimum moisture content and compacted
in relatively thin lifts using suitable mechanical compaction equipment. Selected granular backfill should be
placed in lifts with a maximum uncompacted thickness of 8 to 12 inches and be compacted to not less than 95
percent of the maximum dry density, as determined by ASTM D1557.
Crushed Aggregate Base 5.3.4
Crushed aggregate base course below floor slabs, spread footings, and asphalt concrete pavements should be
clean crushed rock or crushed gravel that contains no deleterious materials and meets the specifications
provided in COE SS 02630.10 – Dense-Graded Aggregate, and has less than 5 percent by dry weight passing
the US Standard No. 200 Sieve. The crushed aggregate base course should be placed in lifts with a maximum
uncompacted thickness of 8 to 12 inches and be compacted to at least 95 percent of the maximum dry density,
as determined by ASTM D1557.
Utility Trench Backfill 5.3.5
Pipe bedding placed to uniformly support the barrel of pipe should meet specifications provided in COE SS
00405.12 – Pipe Zone Bedding. The pipe zone that extends from the top of the bedding to at least 8 inches
above utility lines should consist of material prescribed by COE SS 00405.13 – Pipe Zone Material. The pipe
zone material should be compacted to at least 90 percent of the maximum dry density, as determined by
ASTM D1557, or as required by the pipe manufacturer.
Under pavements, paths, slabs, or beneath building pads, the remainder of the trench backfill should consist of
well-graded granular material with less than 10 percent by dry weight passing the US Standard No. 200 Sieve,
and should meet standards prescribed by COE SS 00405.14 – Trench Backfill, Class B or D. This material should
be compacted to at least 92 percent of the maximum dry density, as determined by ASTM D1557 or as
required by the pipe manufacturer. The upper 2 feet of the trench backfill should be compacted to at least 95
percent of the maximum dry density, as determined by ASTM D1557. Controlled low-strength material (CLSM),
COE SS 00405.14 – Trench Backfill, Class E, can be used as an alternative.
Outside of structural improvement areas (e.g., pavements, sidewalks, or building pads), trench material placed
above the pipe zone may consist of general structural fill materials that are free of organics and meet COE SS
00405.14 – Trench Backfill, Class A. This general trench backfill should be compacted to at least 90 percent of
Geotechnical Engineering Report
City of Eugene
Eugene Riverfront Development
Eugene, Oregon
14
April 24, 2019
PBS Project 73368.001
the maximum dry density, as determined by ASTM D1557, or as required by the pipe manufacturer or local
jurisdictions.
On-site soils including clay and silt, or sand and gravel containing silt, may not be suitable for use as trench
backfill due to the difficulty achieving and maintaining optimum moisture and compaction in the confined
space. However, this material may be used as trench backfill outside of structural improvement areas.
Stabilization Material 5.3.6
Stabilization rock should consist of pit or quarry run rock that is well-graded, angular, crushed rock consisting
of 4- or 6-inch-minus material with less than 5 percent passing the US Standard No. 4 Sieve. The material
should be free of organic matter and other deleterious material. COE SS 00330.16 – Stone Embankment
Material can be used as a general specification for this material with the stipulation of limiting the maximum
size to 6 inches.
6 ADDITIONAL SERVICES AND CONSTRUCTION OBSERVATIONS
In most cases, other services beyond completion of a final geotechnical engineering report are necessary or
desirable to complete the project. Occasionally, conditions or circumstances arise that require additional work
that was not anticipated when the geotechnical report was written. PBS offers a range of environmental,
geological, geotechnical, and construction services to suit the varying needs of our clients.
PBS should be retained to review the plans and specifications for this project before they are finalized. Such a
review allows us to verify that our recommendations and concerns have been adequately addressed in the
design.
Satisfactory earthwork performance depends on the quality of construction. Sufficient observation of the
contractor's activities is a key part of determining that the work is completed in accordance with the
construction drawings and specifications. We recommend that PBS be retained to observe general excavation,
stripping, fill placement, footing subgrades, and/or pile installation. Subsurface conditions observed during
construction should be compared with those encountered during the subsurface explorations. Recognition of
changed conditions requires experience; therefore, qualified personnel should visit the site with sufficient
frequency to detect whether subsurface conditions change significantly from those anticipated.
7 LIMITATIONS
This report has been prepared for the exclusive use of the addressee, and their architects and engineers, for
aiding in the design and construction of the proposed development and is not to be relied upon by other
parties. It is not to be photographed, photocopied, or similarly reproduced, in total or in part, without express
written consent of the client and PBS. It is the addressee's responsibility to provide this report to the
appropriate design professionals, building officials, and contractors to ensure correct implementation of the
recommendations.
The opinions, comments, and conclusions presented in this report are based upon information derived from
our literature review, field explorations, laboratory testing, and engineering analyses. It is possible that soil,
rock, or groundwater conditions could vary between or beyond the points explored. If soil, rock, or
groundwater conditions are encountered during construction that differ from those described herein, the client
is responsible for ensuring that PBS is notified immediately so that we may reevaluate the recommendations of
this report.

Geotechnical Engineering Report
City of Eugene
Eugene Riverfront Development
Eugene, Oregon
15
April 24, 2019
PBS Project 73368.001
Unanticipated fill, soil and rock conditions, and seasonal soil moisture and groundwater variations are
commonly encountered and cannot be fully determined by merely taking soil samples or completing
explorations such as soil borings. Such variations may result in changes to our recommendations and may
require additional funds for expenses to attain a properly constructed project; therefore, we recommend a
contingency fund to accommodate such potential extra costs.
The scope of work for this subsurface exploration and geotechnical report did not include environmental
assessments or evaluations regarding the presence or absence of wetlands or hazardous substances in the soil,
surface water, or groundwater at this site.
If there is a substantial lapse of time between the submission of this report and the start of work at the site, if
conditions have changed due to natural causes or construction operations at or adjacent to the site, or if the
basic project scheme is significantly modified from that assumed, this report should be reviewed to determine
the applicability of the conclusions and recommendations presented herein. Land use, site conditions (both on
and off site), or other factors may change over time and could materially affect our findings; therefore, this
report should not be relied upon after three years from its issue, or in the event that the site conditions
change.
Geotechnical Engineering Report
City of Eugene
Eugene Riverfront Development
Eugene, Oregon
16
April 24, 2019
PBS Project 73368.001
8 REFERENCES
ASCE. (2010). Minimum Design Loads for Buildings and Other Structures (ASCE 7-10).
Blair, J. L., McCrory, P. A., Oppenheimer, D. H., and Waldhauser, F. (2011, revised 2013). A Geo-referenced 3D
model of the Juan de Fuca Slab and associated seismicity: US Geological Survey Data Series 633, v.1.2,
https://pubs.usgs.gov/ds/633/.
Brocher, T. M., Wells, R. E., Lamb, A. P., and Weaver, C. S. (2017). Evidence for distributed clockwise rotation of
the crust in the northwestern United States from fault geometries and focal mechanisms. Tectonics, Vol. 36,
No.5, pp. 787-818.
City of Eugene. (2014). Stormwater Management Manual. Accessed from City of Eugene web site:
https://www.eugene-or.gov/477/Stormwater-Management-Manual
COE SS. (2018). City of Eugene Standard Specifications, Amendment #1. Eugene, Oregon. Based on Oregon
Standard Specifications for Construction (2018). Salem, Oregon. Oregon Department of Transportation.
DOGAMI. (2019). [Interactive Map]. DOGAMI Lidar Viewer. Oregon Department of Geology and Mineral
Industries, Oregon Lidar Consortium. https://gis.dogami.oregon.gov/maps/lidarviewer/. Accessed on
February 20, 2019.
DOGAMI. (2019). [Interactive Map]. Oregon HazVu: Statewide Geohazards Viewer. Oregon Department of
Geology and Mineral Industries, Earthquake Liquefaction. https://gis.dogami.oregon.gov/maps/hazvu/.
Accessed on February 12, 2019.
Federal Emergency Management Agency (FEMA). (1999). Flood Insurance Rate Map (FIRM) Lane County,
Oregon and Incorporated Areas. Panel 1137 of 2972. Map Number 41039C1137 F.
Kirby, S., Wang, K., and Dunlop, S. (2002). The Cascadia Subduction Zone and Related Subduction Systems –
Seismic Structure, Intraslab Earthquakes and Processes, and Earthquake Hazards. US Geological Survey
Open File Report 02-328 and Geological Survey of Canada Open File 4350.
Madin, I. P. and Murray, R. B. (2004). Preliminary Geologic Map of the Eugene East and Eugene West
Quadrangles, Lane County, Oregon. Oregon Department of Geology and Mineral Industries (DOGAMI).
Open-File Report O-03-11.
McClaughry, J. D., Wiley, T. J., Ferns, M. L., and Madin, I. P. (2010). Digital geologic map of the southern
Willamette Valley, Benton, Lane, Linn, Marion, and Polk Counties, Oregon. DOGAMI Open-File Report O-
10-03.
NCEDC (2017), Northern California Earthquake Data Center. UC Berkeley Seismological Laboratory. Dataset.
doi:10.7932/NCEDC.
Oregon Water Resources Department (OWRD). (2018). Well Log Records, accessed February 21, 2019, from
OWRD web site: http://apps.wrd.state.or.us/apps/gw/well_log/.
Geotechnical Engineering Report
City of Eugene
Eugene Riverfront Development
Eugene, Oregon
17
April 24, 2019
PBS Project 73368.001
OSSC. (2014). Oregon Structural Specialty Code (OSSC). Based on IBC. (2012 International Building Code).
Country Club Hills, IL International Code Council, Inc.
US Geological Survey (USGS). (2008). Earthquake hazards program: Conterminous states probabilistic maps and
data.
Wiley, T. J. (2006). Preliminary Geologic Map of the Albany Quadrangle, Linn, Marion, and Benton Counties,
Oregon. Oregon Department of Geology and Mineral Industries (DOMAGI), open -file report O-06-26.
Yeats, R. S., Graven, E. P., Werner, K. S., Goldfinger, Chris, and Popowski, T. A. (1996). Tectonics of the
Willamette Valley, Oregon, in Rogers, A. M., Walsh, T. J., Kockelman, W. J., and Priest, G. R., eds., Assessing
earthquake hazards and reducing risk in the Pacific Northwest: US Geological Survey Professional Paper
1650, v. 1, p. 183–222.

Figures
!
^
!
Salem
Eugene
Portland
1
0 2,000 4,0001,000 Feet
L:\Gis\GEOTECH\project\73368.001\fig_01_SiteLoc.mxd
1 inch = 2,000 feet
Site
Site
DATE: APR 2019 ∙ PROJECT: 73368.001
VICINITY MAPEU GENE RIVERFRONT DEVELOPMENTEU GENE, OREGON
FIGU RE
B-20
B-19
B-18
B-17
B-16
B-14
B-12
B-10
B-13 (p)
B-15 (p)
B-11 (p)
PBS-B-6
PBS-B-9
PBS-B-8
PBS-B-7
PBS-B-5
PBS-B-4
PBS-B-3
PBS-B-2
PBS-B-1
B-1B-2
B-3 B-4
B-5B-6
B-8B-7
B-9
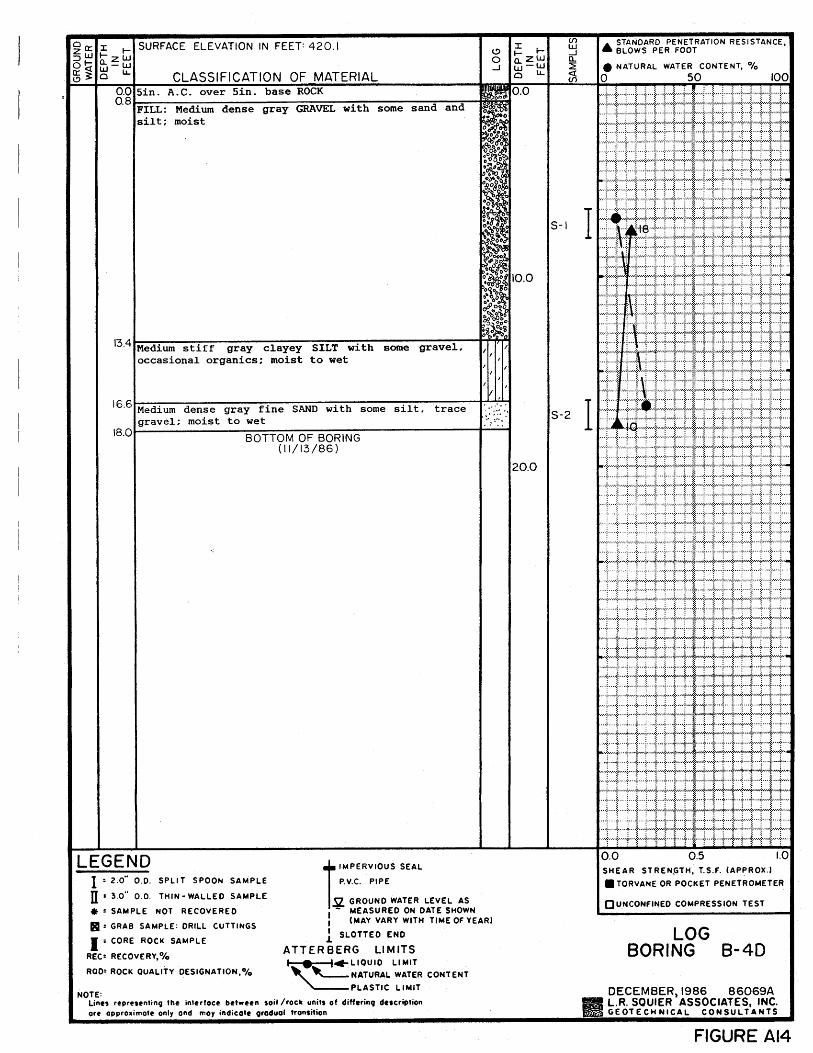
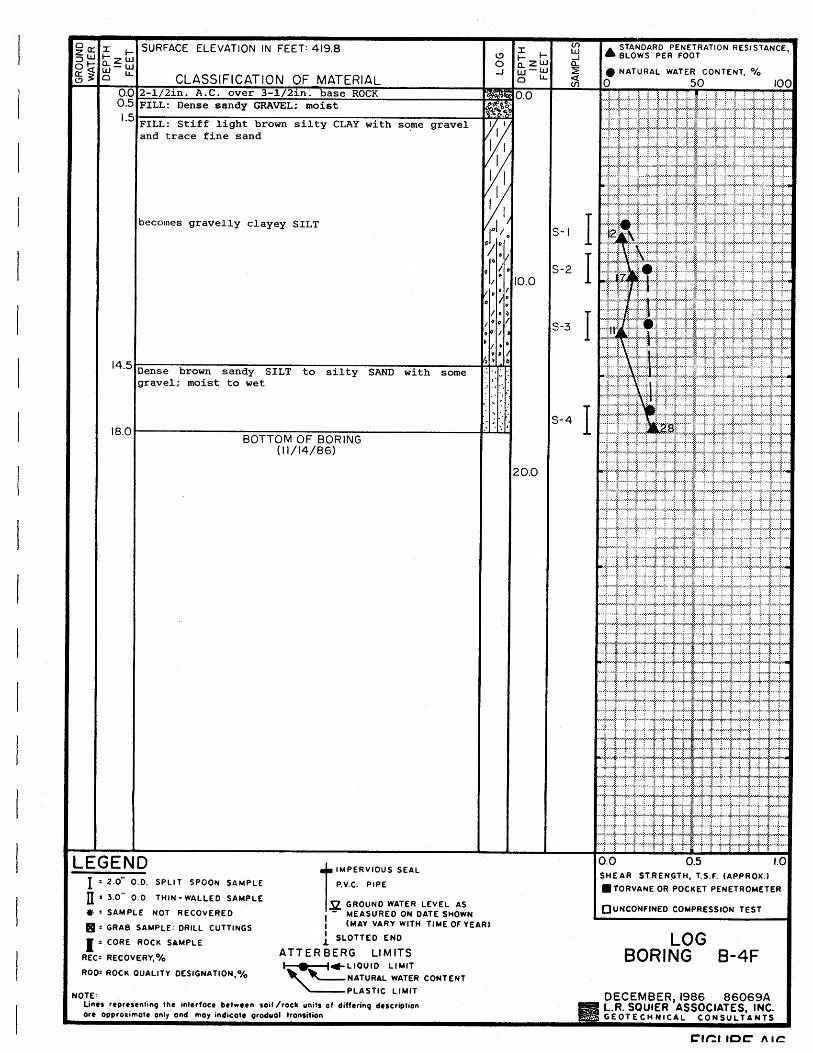
B-4FB-4D B-4C
B-4A
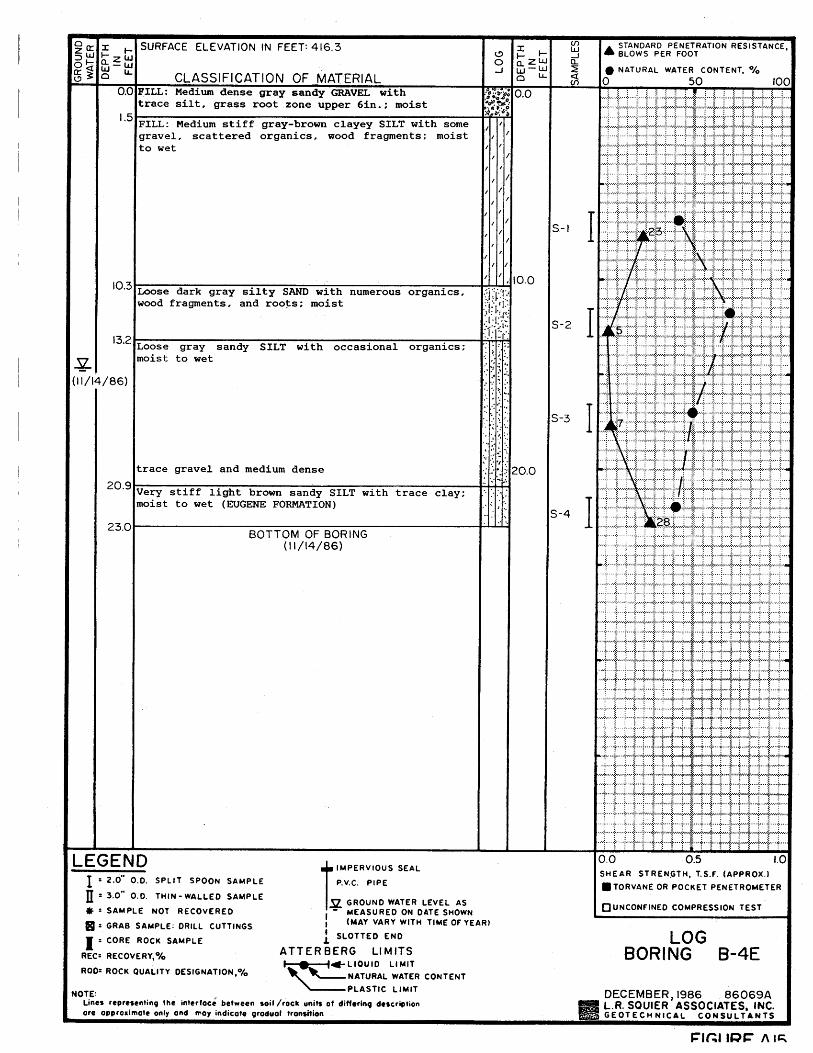
B-4E
B-10
B-1
B-9B-8
B-7
B-6B-5
B-4B-3B-2
B-13B-12
B-11
B-10
B-9EB-9DB-9C
B-9BB-9A
HB-8HB-7
HB-6
HB-5
HB-4
HB-3
HB-2
HB-1
20 150 30075 '
EXPLANATION@A
B-10 - Boring na me a nd a pproxima telocation (PBS, Fe b 2019)
@AB-1 - Boring name a nd a pproximatelocation (PBS, O ct 2018)
@AHB-1 - Boring na me a nd a pproxima telocation (PBS, Fe b 2019)
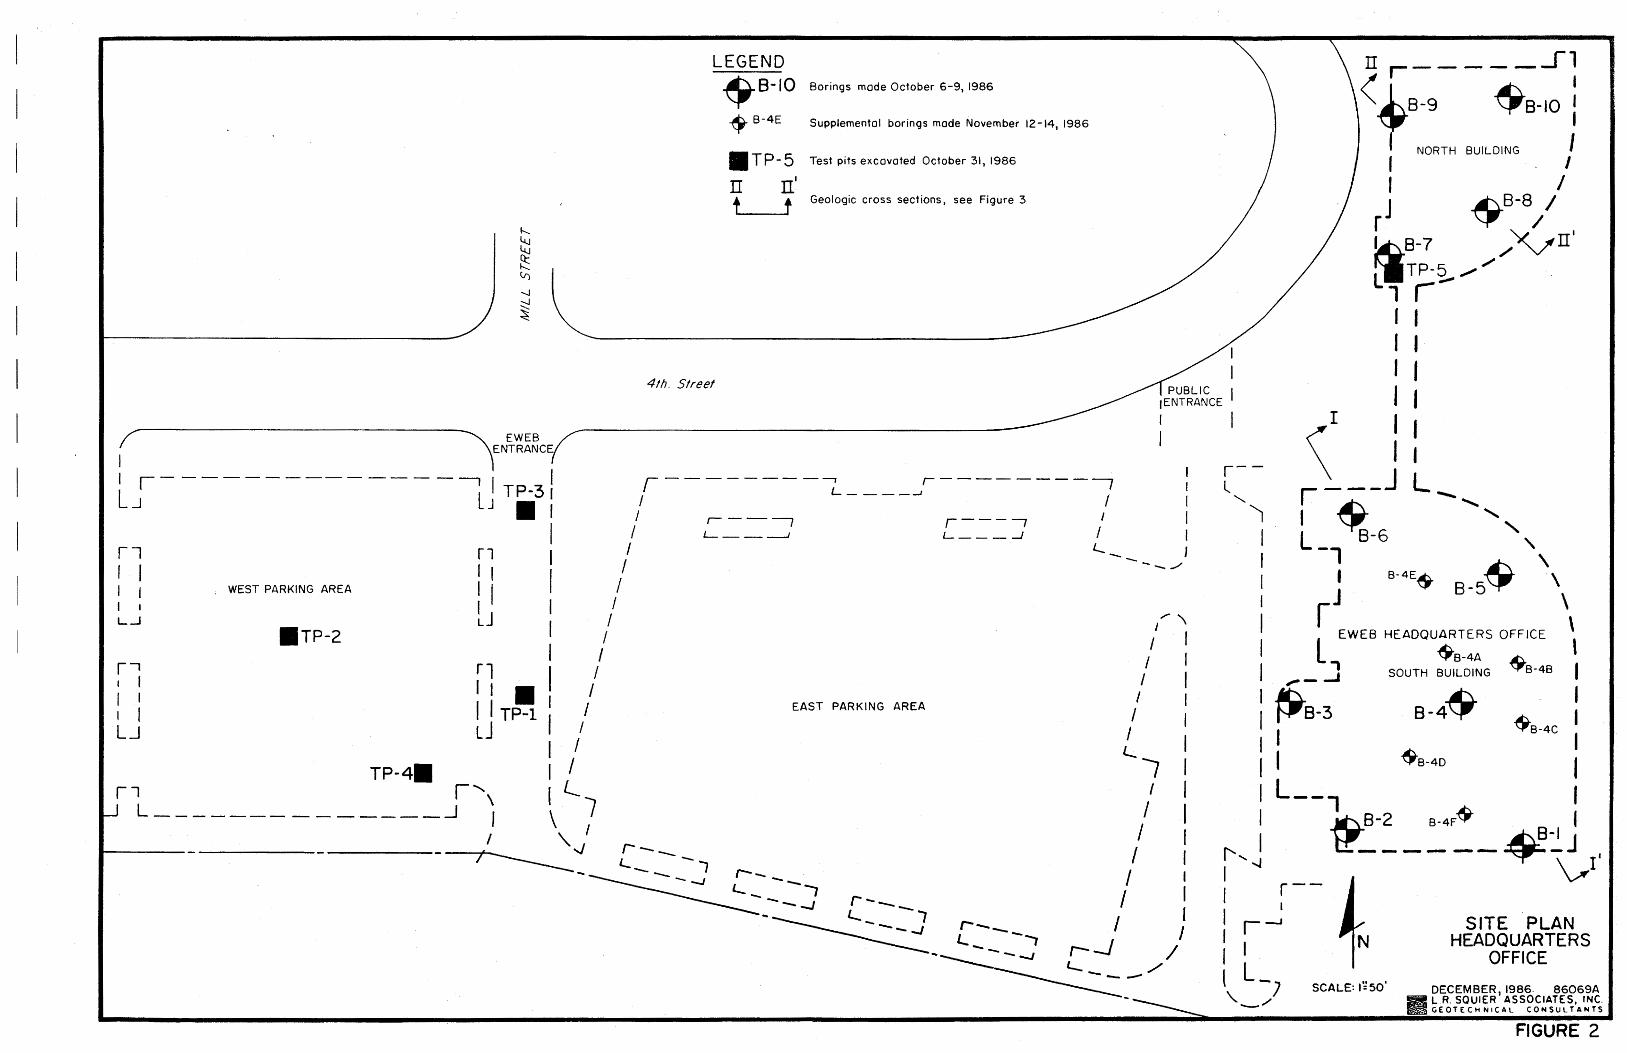
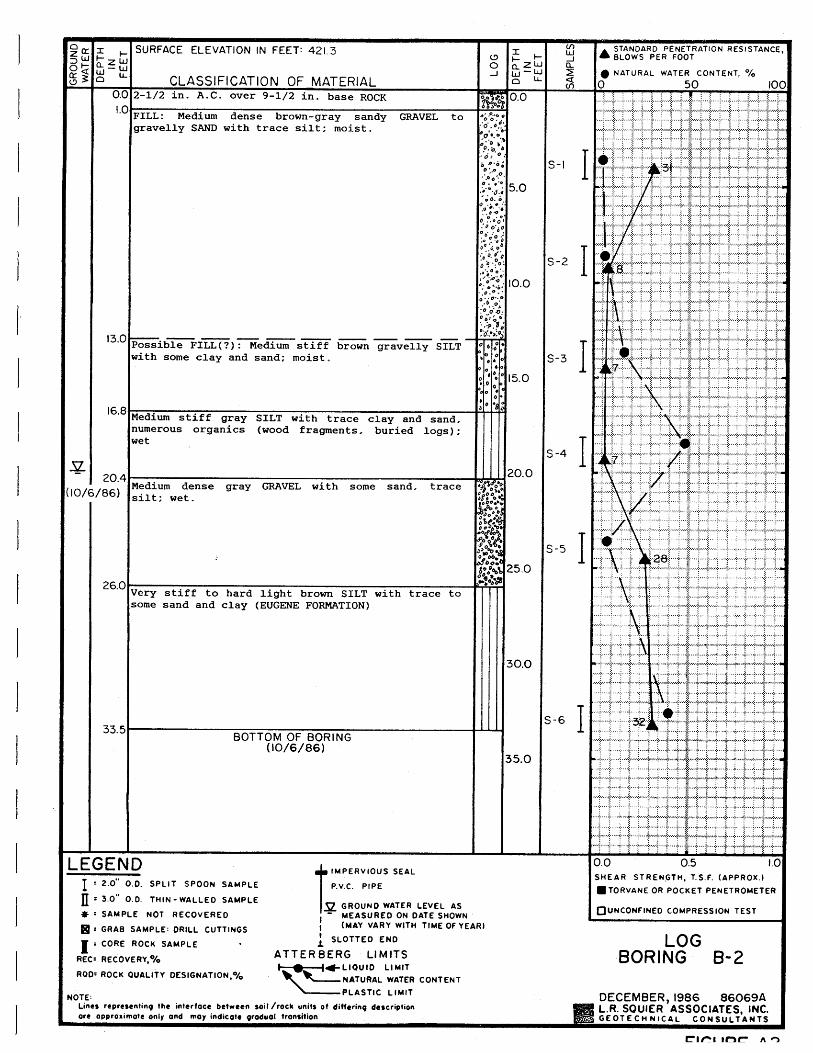
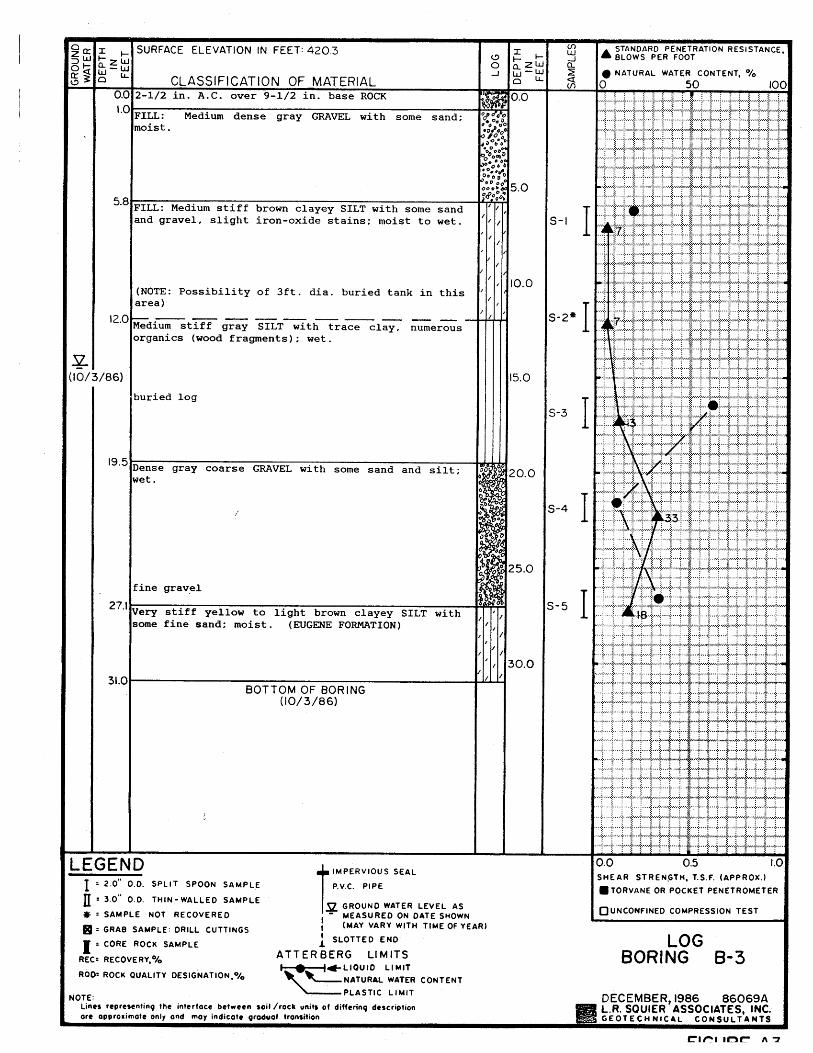
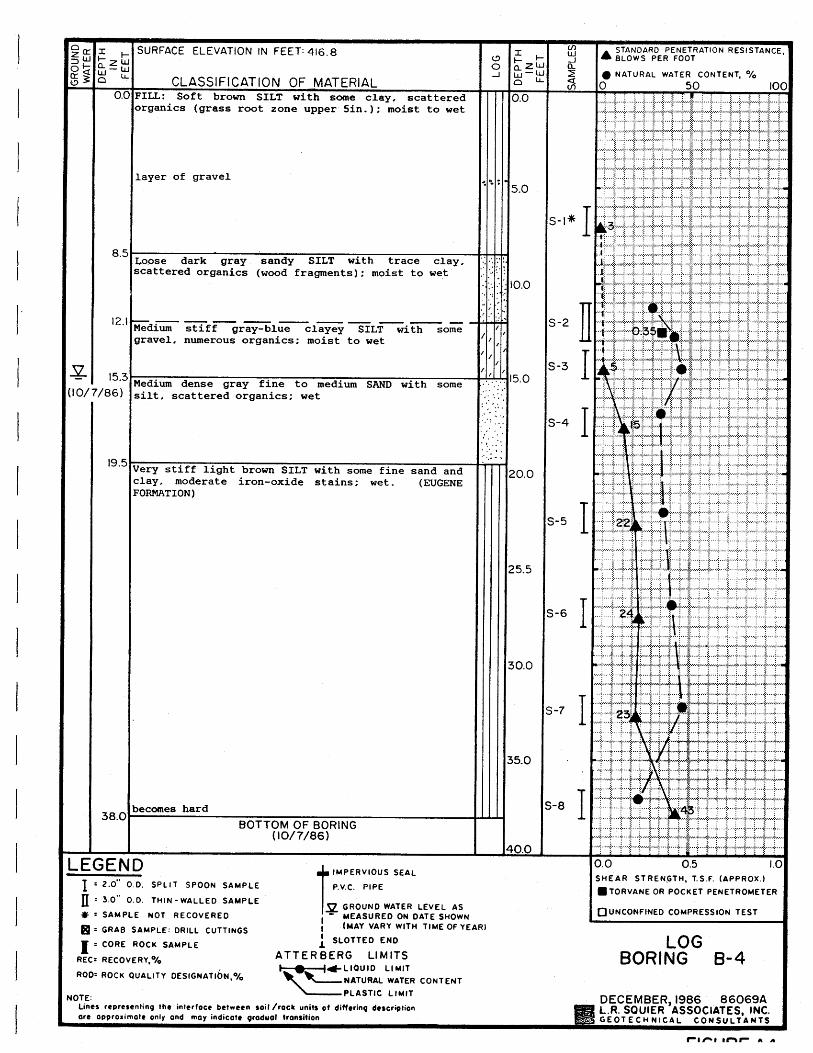
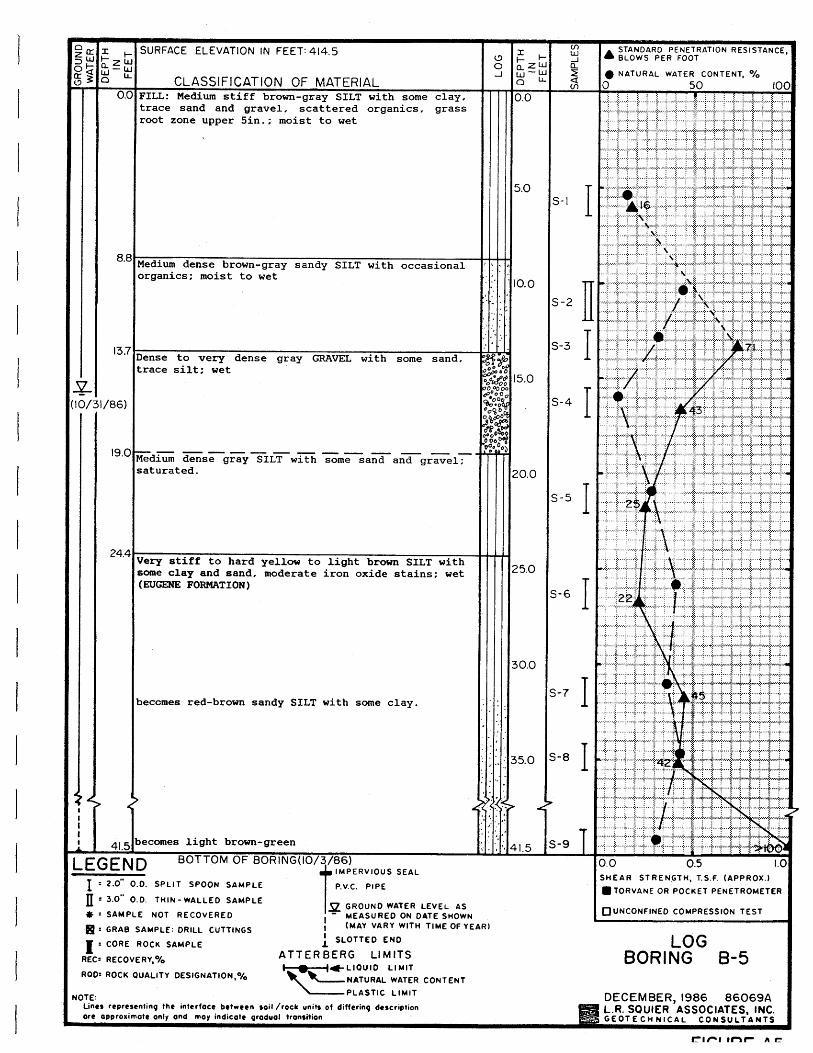
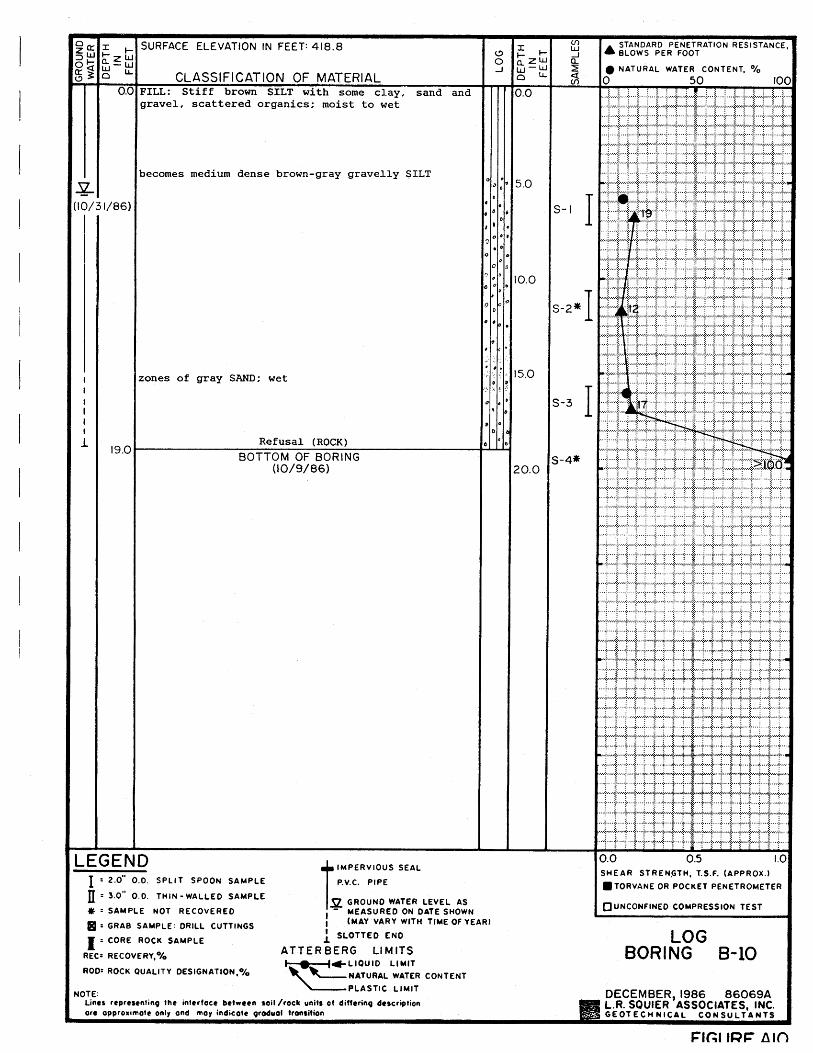
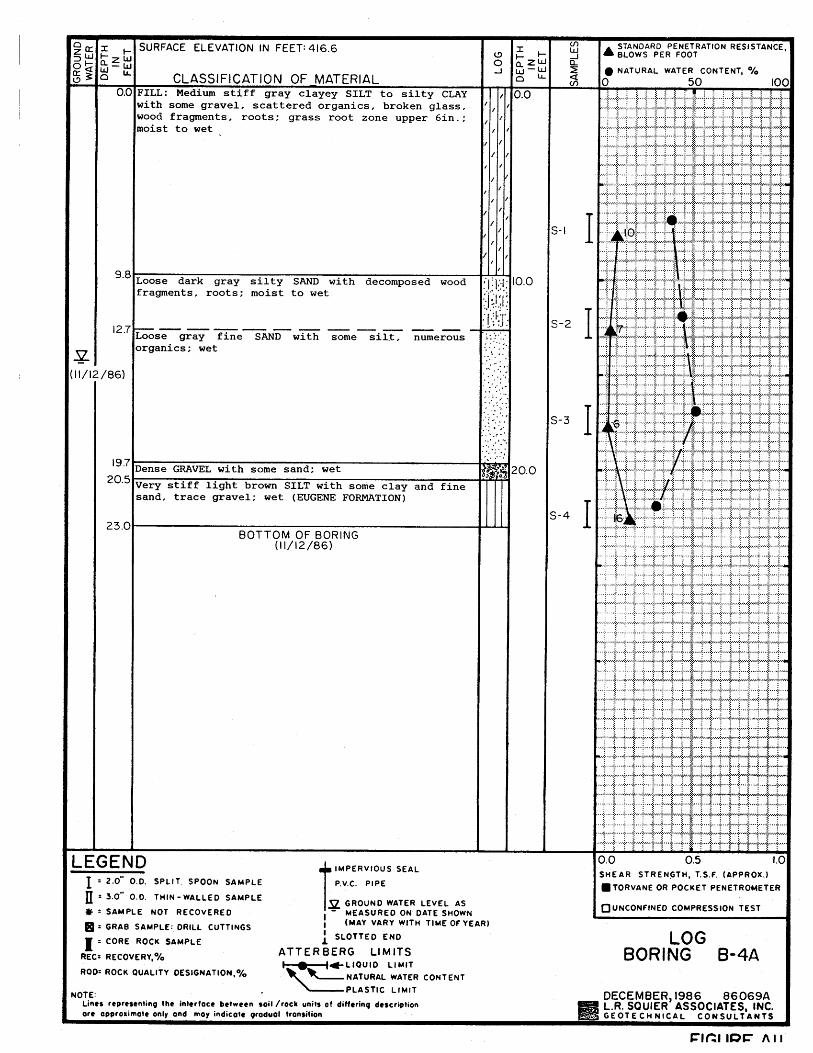
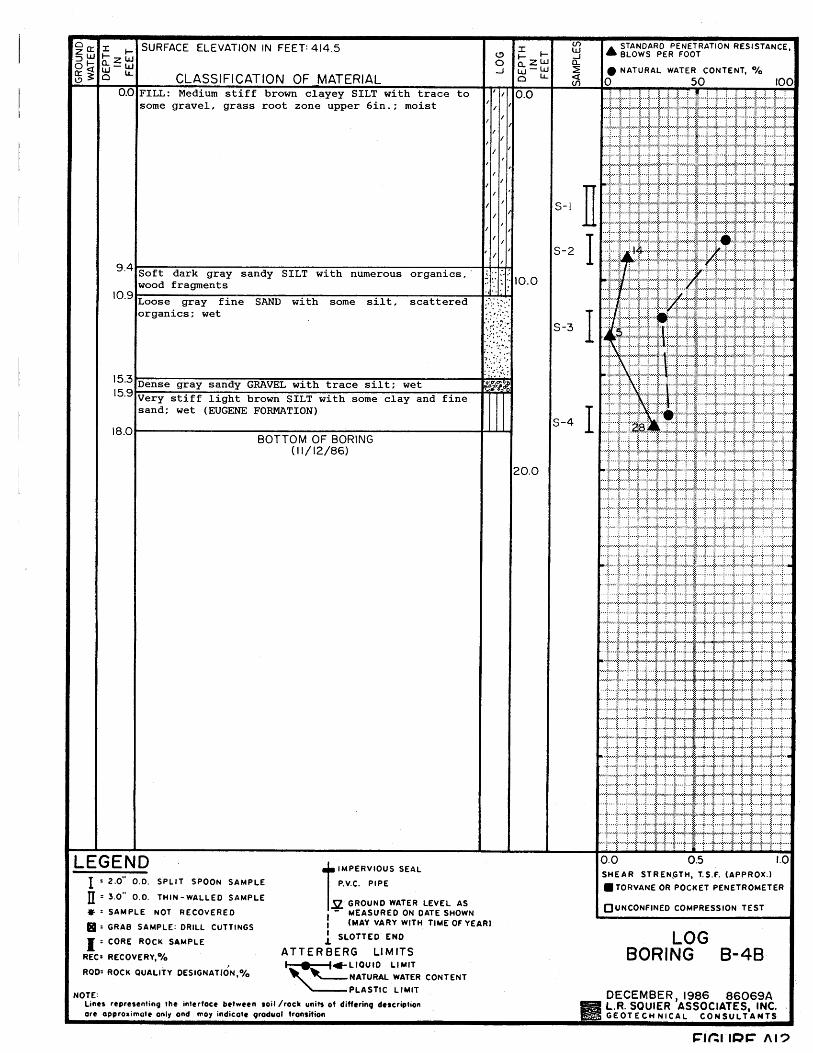
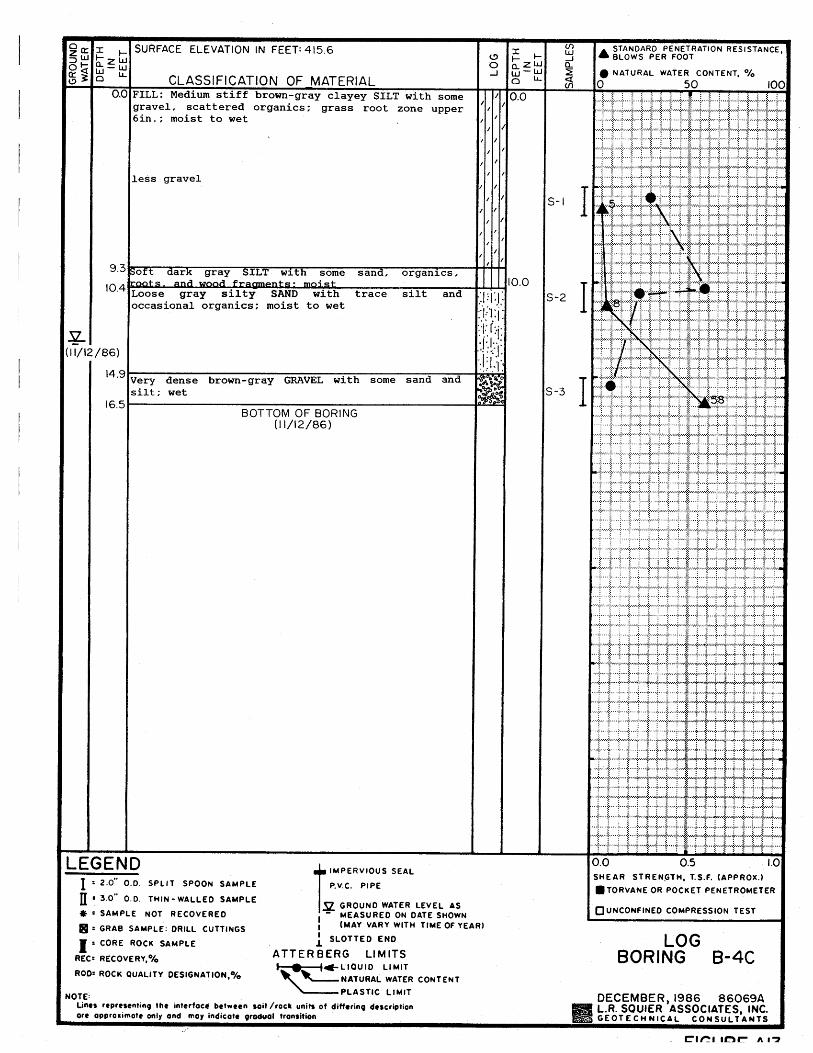
@AB-1 - Boring name a nd a pproximatelocation (Squie r, Dec 1986)
@AB-1 - Boring name a nd a pproximatelocation (Squie r, Dec 1986)Approximate s ite bound a ry
L:\Gis\GEOTECH\project\73368.001\fig_02_SitePlan.mxd
1 inch = 150 fe e tDATE: APR 2019 ∙ PRO JECT: 73368.001
SITE PLANEUGENE RIVERFRO NT DEVELO PMENTEUGENE, O REGO N
FIGURE
Cobu
rg R
d
Willamette River
E 6th Ave
Source: Google Ea rth 2017 image ry
3L:\Gis\GEOTECH\project\73368.001\fig_X_Tectonics.mxd
DATE: AP R 2019 ∙ P ROJECT: 73368.001
TECTONIC SETTING OF THEPACIFIC NORTHWESTEUGENE RIVERFRONTDEVELOP MENTEUGENE, OREGON
Industrial Way((
((
((
((
((
((((
((
((
((
((((
((((
((((
((((
((((
((
((((
!
^
!
!
^
!
#*
#*
#*
#*
#*
#*#*
#*
#*
#*
#*
#*
Salem
Eugene
Medford
Portland
Seattle
Olympia
120° W
120° W
125° W
125° W
130° W
130° W50° N
50° N
45° N
45° N
40° N
40° N
Sourc e s : 1) SRTM 30-m e te r DEM2) ESRI World Oc e ans Bas e m ap3) USGS Te c tonic P late Boundarie s
NORTH AMERICAN PLATE
PACI
FIC PL
ATE
JUAN DE FUCA PLATE
GORDA PLATE
EXPLORER PLATE
Cascadia Subduction Zone
Juan
de Fu
ca Ri
dge
Gord
a Ridg
e
Blanco Fracture Zone
San Andreas Fault
Mendocino Fault
E
E
E
E
Sovanco Fault
P A C
I F I C
O C
E A N
EXPLANATION#* Volcano
Trans form bound arySpre ad ing rid ge
(( ((Thrus t fault
FIGURE
Site
QtfQtf
Ha
Ha
Tm s
Ho a
Twcl
Ha
Ha
Tm s
Ha
Ha
Ho a
Ti
Ho a
Tm s
Tm s
Tm s
Ha
Ho a
Tm s
Qtf
Ha
Ha
Ha Twcl
Twcv
Ha
Twcm
Twcm
Ha
Twct
Ti
Qld
Qld
Twcv
Twcv
Twcv
Ti
Ti
Qld
Ho a
Qld
Ti
Qld
Tm sTwcv
Ti
QldQld
Twcv
Tm s
Twcl
Tm s
Qld
Ti
Ti
Twcv
Tm s
Ti
Ha
Qdf
Qld
Twcv
Qld
Tm s
Qld 4
L:\Gis\GEOTECH\project\73368.001\fig_X_GeoMap.mxd
FIGU REDATE: APR 2019 ∙ PROJECT: 73368.001
GEOLOGIC MAPEU GEN E RIV ERFRON T DEV ELOPMEN TEU GEN E, OREGON
§̈¦5
¬«99
¬«126
§̈¦105
¬«99
McKenzie River
Willamette River
Fa ult - so lid where kn o wn ; da shed wherequestio n a b le
Tcrb Co lum b ia River Basa lt Gro up (m iddle Mio cen e)Columbia River Basalt Group
Volcaniclastic Marine Sedimentary RocksTm m Mixed so urce m a rin e sedim en ta ry ro cks
(m iddle Eo cen e)Tm s Siliciclastic m arin e sedim en tary ro cks
(lo wer Oligo cen e to m iddle Eo cen e)Tm v V o lca n icla stic m arin e sedim en tary ro cks
(lo wer Oligo cen e to lo wer Eo cen e)
EXPLANATIONQuaternary Surficial DepositsAf Artifica l fill (An thro po cen e)Ha Alluvium (Ho lo cen e)Ho a Older Alluvium (Ho lo cen e)
Qdf Deb ris flo w (Qua tern a ry)Qf Alluvia l a n d co lluvia l fa n s (Quatern a ry)
Qtf Terra ce a n d fa n depo sits (Qua tern a ry)
Qws W illa m ette Silt (upper Pleisto cen e)
QTgs W ea thered terra ce gra vels (Pleisto cen e a n d upper Plio cen e)
Qld La n dslide a n d deb ris a va la n che depo sits (Quatern a ry)
Twct Ba sa lt o f Mt. To m (Oligo cen e)Volcanic and Sedimentary Rocks of the Early Western Cascades
Twcv Ea rly W estern Casca des vo lca n icla stic ro cks a n d tuff (lo wer Mio cen e to m iddle Eo cen e)
Twcl Ea rly W estern Casca des la va s (lo wer Mio cen e to m iddle Eo cen e)
Twcm Ro cks o f the Mo ha wk River Ca ldera (lo wer Oligo cen e)
Volcanic and Sedimentary Rocks of the Early High Cascades
Tehv Ea rly High Casca des vo lca n ic ro cks (Plio cen e a n d upper Mio cen e)
Tehs V o lca n icla stic co n glo m erate a n d sa n dsto n e (upper a n d m iddle Mio cen e)
Siletz River VolcanicsTst Siletz River vo lca n ics (lo wer Eo cen e a n d
Pa leo cen e)Intrusive RocksTi In trusive ro cks (m iddle Mio cen e to upper
Eo cen e)
Site
Eugene
So urce: Orego n Departm en t o f Geo lo gy a n d Min era l In dustries (DOMAGI), o pen -file repo rt O-10-03 0 4,000 8,0002,000 '
1 in ch = 4,000 feet
5
EXPLANATION
L:\Gis\GEOTECH\project\73368.001\fig_X_Faults.mxd
REGIONAL FAULT MAPEUGEN E RIV ERFRON T DEV ELOPMEN TEUGEN E, OREGON
FIGURE
USGS (2006) Qua terna ry fa ult tra ces; solid where well constra ined , d a shed where m od era tely c onstra ined , a nd d otted where inferred
< 1.6 m illion yea rs - und ifferentia tedQua terna ry
< 750,000 yea rs - m id d le a nd la te Qua terna ry
< 130,000 yea rs - la te Qua terna ry< 15,000 yea rs - la test Qua terna ry
DATE: APR 2019 ∙ PROJECT: 73368.001
1 inc h = 60 kilom eters0 30 6015 km
25 km75 km150 kmSite
_̂ Site loc a tion
_̂
6
L:\Gis\GEOTECH\project\73368.001\fig_X_Seismicity.mxd
FIGUREDATE: AP R 2019 ∙ P ROJECT: 73368.001
HISTORICAL SEISMICITYEUGENE RIVERFRONTDEVELOP MENTEUGENE, OREGON
25 km75 km150 km
0 30 6015 km
1 inch = 60 kilom e te rs
EXPLANATION_̂ Site locationIndependent Seismicity
(1963-2017)M 2.5 - 3.0M 3.1 - 4.0M 4.1 - 5.0M >5.1
Source : ESRI Te rrain
Depth in kilometers (km)Low : 0 km
Hig h: 100 km
FIGURE
F
ile
na
me
: L
:\P
ro
je
cts\7
30
00
\7
33
00
-7
33
99
\7
33
68
- C
ity o
f E
ug
en
e\7
33
68
-0
01
\R
ep
orts\2
01
90
22
1 G
ER
\F
ig
ure
s\_
ea
rth
p
re
ssu
re
d
ia
gra
msX
.d
wg
L
ayo
ut T
ab
: F
IG
4
U
se
r: C
ory V
an
F
osso
n C
AD
P
lo
t D
ate
/T
im
e: 4
/9
/2
01
9 4
:2
0:3
4 P
M
APRIL 2019
73368.001
8
LATERAL SURCHARGE DETAIL
EUGENE RIVERFRONT DEVELOPMENT - INFRASTRUCTURE
EUGENE, OREGON

Appendix A Field Explorations
Geotechnical Engineering Report
City of Eugene
Eugene Riverfront Development
Eugene, Oregon
A-1
April 24, 2019
PBS Project 73368.001
Appendix A: Field Explorations
A1 GENERAL
PBS explored subsurface conditions at the project site by advancing 11 borings to depths of up to
approximately 31.5 feet bgs on February 4, 2019, through February 7, 2019. The approximate locations of the
explorations are shown on Figure 2, Site Plan. The procedures used to advance the borings, collect samples,
and other field techniques are described in detail in the following paragraphs. Unless otherwise noted, all soil
sampling and classification procedures followed engineering practices in general accordance with relevant
ASTM procedures. “General accordance” means that certain local drilling and descriptive practices and
methodologies have been followed.
A2 BORINGS
A2.1 Drilling
Borings were advanced using a track-mounted Terrasonic 150 drill rig provided and operated by Holt Services,
Inc., of Vancouver, Washington. Borings B-10 through B-20 were advanced using sonic vibration drilling
techniques. The borings were observed by a member of the PBS geotechnical staff, who maintained a detailed
log of the subsurface conditions and materials encountered during the course of the work.
A2.2 Sampling
Disturbed soil samples were taken in the borings at selected depth intervals. The samples were obtained using
a standard 2-inch outside diameter split-spoon sampler following procedures prescribed for the standard
penetration test (SPT). Using the SPT, the sampler is driven 18 inches into the soil using a 140-pound hammer
dropped 30 inches. The number of blows required to drive the sampler the last 12 inches is defined as the
standard penetration resistance (N-value). The N-value provides a measure of the relative density of granular
soils such as sands and gravels, and the consistency of cohesive soils such as clays and plastic silts. The
disturbed soil samples were examined by a member of the PBS geotechnical staff and then sealed in plastic
bags for further examination and physical testing in our laboratory.
A2.3 Sonic Coring
Continuous sonic coring was used to penetrate coarse-grained units encountered during drilling. Recovered
cores from the borings were visually classified and described in the field and certain zones were selected for
laboratory analysis. The core recovery (presented graphically on the boring logs) was calculated by dividing
the length of core recovered in the barrel by the total drilled run length, expressed as a percent.
A2.4 Boring Logs
The boring logs show the various types of materials that were encountered in the borings and the depths
where the materials and/or characteristics of these materials changed, although the changes may be gradual.
Where material types and descriptions changed between samples, the contacts were interpreted. The types of
samples taken during drilling, along with their sample identification number, are shown to the right of the
classification of materials. The N-values and natural water (moisture) contents are shown farther to the right.
A3 MATERIAL DESCRIPTION
Initially, samples were classified visually in the field. Consistency, color, relative moisture, degree of plasticity,
and other distinguishing characteristics of the soil samples were noted. Afterward, the samples were
reexamined in the PBS laboratory, various standard classification tests were conducted, and the field
classifications were modified where necessary. The terminology used in the soil classifications and other
modifiers are defined in Table A-1, Terminology Used to Describe Soil.
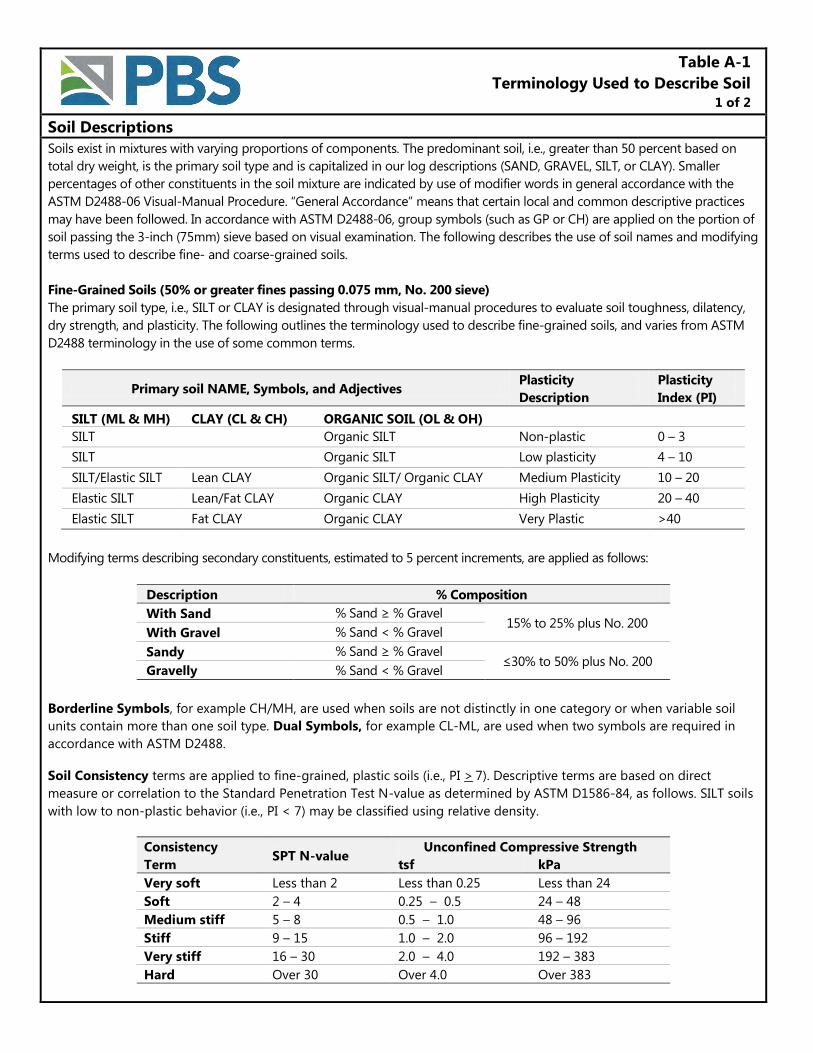
Table A-1
Terminology Used to Describe Soil 1 of 2
Soil Descriptions
Soils exist in mixtures with varying proportions of components. The predominant soil, i.e., greater than 50 percent based on
total dry weight, is the primary soil type and is capitalized in our log descriptions (SAND, GRAVEL, SILT, or CLAY). Smaller
percentages of other constituents in the soil mixture are indicated by use of modifier words in general accordance with the
ASTM D2488-06 Visual-Manual Procedure. “General Accordance” means that certain local and common descriptive practices
may have been followed. In accordance with ASTM D2488-06, group symbols (such as GP or CH) are applied on the portion of
soil passing the 3-inch (75mm) sieve based on visual examination. The following describes the use of soil names and modifying
terms used to describe fine- and coarse-grained soils.
Fine-Grained Soils (50% or greater fines passing 0.075 mm, No. 200 sieve)
The primary soil type, i.e., SILT or CLAY is designated through visual-manual procedures to evaluate soil toughness, dilatency,
dry strength, and plasticity. The following outlines the terminology used to describe fine-grained soils, and varies from ASTM
D2488 terminology in the use of some common terms.
Primary soil NAME, Symbols, and Adjectives Plasticity
Description
Plasticity
Index (PI)
SILT (ML & MH) CLAY (CL & CH) ORGANIC SOIL (OL & OH)
SILT Organic SILT Non-plastic 0 – 3
SILT Organic SILT Low plasticity 4 – 10
SILT/Elastic SILT Lean CLAY Organic SILT/ Organic CLAY Medium Plasticity 10 – 20
Elastic SILT Lean/Fat CLAY Organic CLAY High Plasticity 20 – 40
Elastic SILT Fat CLAY Organic CLAY Very Plastic >40
Modifying terms describing secondary constituents, estimated to 5 percent increments, are applied as follows:
Description % Composition
With Sand % Sand ≥ % Gravel 15% to 25% plus No. 200
With Gravel % Sand < % Gravel
Sandy % Sand ≥ % Gravel ≤30% to 50% plus No. 200
Gravelly % Sand < % Gravel
Borderline Symbols, for example CH/MH, are used when soils are not distinctly in one category or when variable soil
units contain more than one soil type. Dual Symbols, for example CL-ML, are used when two symbols are required in
accordance with ASTM D2488.
Soil Consistency terms are applied to fine-grained, plastic soils (i.e., PI > 7). Descriptive terms are based on direct
measure or correlation to the Standard Penetration Test N-value as determined by ASTM D1586-84, as follows. SILT soils
with low to non-plastic behavior (i.e., PI < 7) may be classified using relative density.
Consistency
Term SPT N-value
Unconfined Compressive Strength
tsf kPa
Very soft Less than 2 Less than 0.25 Less than 24
Soft 2 – 4 0.25 – 0.5 24 – 48
Medium stiff 5 – 8 0.5 – 1.0 48 – 96
Stiff 9 – 15 1.0 – 2.0 96 – 192
Very stiff 16 – 30 2.0 – 4.0 192 – 383
Hard Over 30 Over 4.0 Over 383
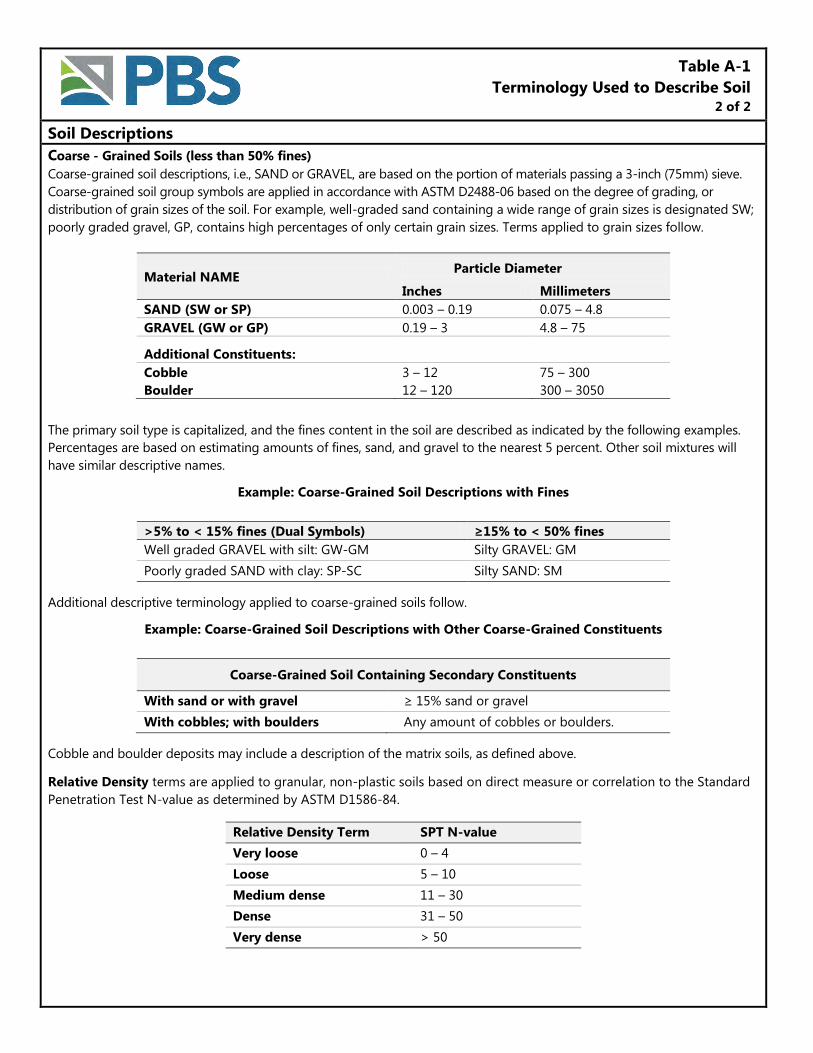
Table A-1
Terminology Used to Describe Soil 2 of 2
Soil Descriptions
Coarse - Grained Soils (less than 50% fines)
Coarse-grained soil descriptions, i.e., SAND or GRAVEL, are based on the portion of materials passing a 3-inch (75mm) sieve.
Coarse-grained soil group symbols are applied in accordance with ASTM D2488-06 based on the degree of grading, or
distribution of grain sizes of the soil. For example, well-graded sand containing a wide range of grain sizes is designated SW;
poorly graded gravel, GP, contains high percentages of only certain grain sizes. Terms applied to grain sizes follow.
Material NAME Particle Diameter
Inches Millimeters
SAND (SW or SP) 0.003 – 0.19 0.075 – 4.8
GRAVEL (GW or GP) 0.19 – 3 4.8 – 75
Additional Constituents:
Cobble 3 – 12 75 – 300
Boulder 12 – 120 300 – 3050 The primary soil type is capitalized, and the fines content in the soil are described as indicated by the following examples.
Percentages are based on estimating amounts of fines, sand, and gravel to the nearest 5 percent. Other soil mixtures will
have similar descriptive names.
Example: Coarse-Grained Soil Descriptions with Fines
>5% to < 15% fines (Dual Symbols) ≥15% to < 50% fines
Well graded GRAVEL with silt: GW-GM Silty GRAVEL: GM
Poorly graded SAND with clay: SP-SC Silty SAND: SM
Additional descriptive terminology applied to coarse-grained soils follow.
Example: Coarse-Grained Soil Descriptions with Other Coarse-Grained Constituents
Coarse-Grained Soil Containing Secondary Constituents
With sand or with gravel ≥ 15% sand or gravel
With cobbles; with boulders Any amount of cobbles or boulders.
Cobble and boulder deposits may include a description of the matrix soils, as defined above.
Relative Density terms are applied to granular, non-plastic soils based on direct measure or correlation to the Standard
Penetration Test N-value as determined by ASTM D1586-84.
Relative Density Term SPT N-value
Very loose 0 – 4
Loose 5 – 10
Medium dense 11 – 30
Dense 31 – 50
Very dense > 50
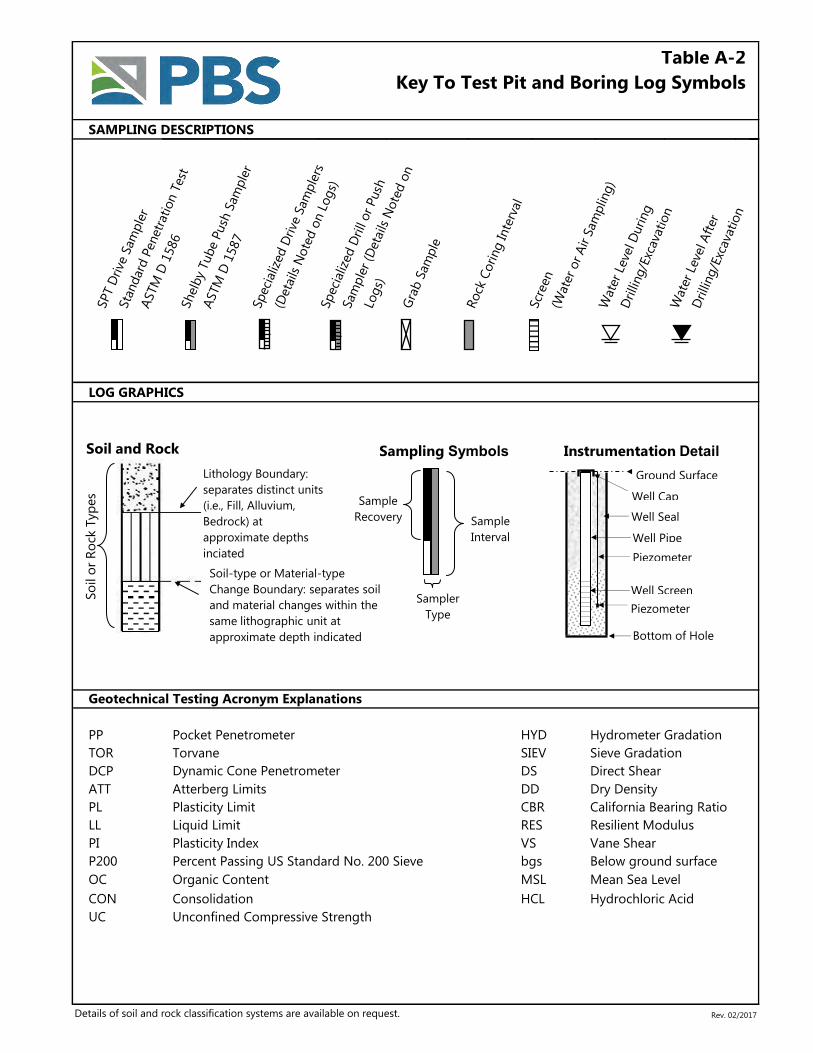
SAMPLING DESCRIPTIONS
Table A-2
Key To Test Pit and Boring Log SymbolsSPT D
rive
Sam
ple
r
Sta
ndar
d P
enetr
atio
n T
est
ASTM
D 1
586
Shelb
y Tube P
ush
Sam
ple
r
ASTM
D 1
587
Speci
aliz
ed D
rive
Sam
ple
rs
(Deta
ils N
ote
d o
n L
ogs)
Speci
aliz
ed D
rill
or
Push
Sam
ple
r (D
eta
ils N
ote
d o
n
Logs)
Gra
b S
ample
Rock
Coring Inte
rval
Scr
een
(Wat
er
or
Air S
am
plin
g)
Wat
er
Leve
l D
uring
Drilli
ng/E
xcav
atio
nW
ater
Leve
l A
fter
Drilli
ng/E
xcav
atio
n
LOG GRAPHICS
PP Pocket Penetrometer HYD Hydrometer Gradation
TOR Torvane SIEV Sieve Gradation
DCP DS Direct Shear
ATT Atterberg Limits DD Dry Density
PL Plasticity Limit CBR California Bearing Ratio
LL Liquid Limit RES Resilient Modulus
PI Plasticity Index VS Vane Shear
P200 Percent Passing US Standard No. 200 Sieve bgs Below ground surface
OC Organic Content MSL Mean Sea Level
CON Consolidation HCL Hydrochloric Acid
UC Unconfined Compressive Strength
Details of soil and rock classification systems are available on request. Rev. 02/2017
Dynamic Cone Penetrometer
Geotechnical Testing Acronym Explanations
Lithology Boundary:
separates distinct units
(i.e., Fill, Alluvium,
Bedrock) at
approximate depths
inciated
Sampler
Type
Sample
Recovery Sample
Interval
Instrumentation Detail Sampling Symbols Soil and Rock
Well Pipe
Piezometer
Piezometer
Ground Surface
Well Cap
Bottom of Hole
So
il o
r R
ock
Typ
es
Well Seal
Well Screen
Soil-type or Material-type
Change Boundary: separates soil
and material changes within the
same lithographic unit at
approximate depth indicated
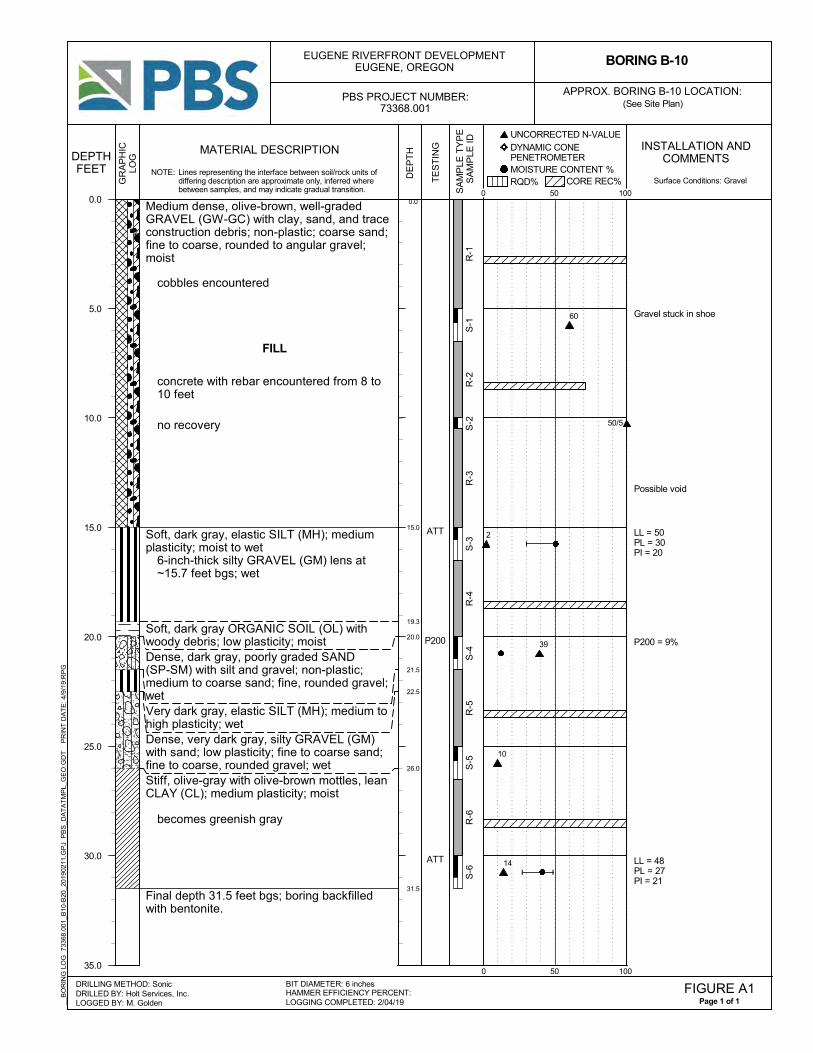
0.0
15.0
19.3
20.0
21.5
22.5
26.0
31.5
Gravel stuck in shoe
Possible void
LL = 50PL = 30PI = 20
P200 = 9%
LL = 48PL = 27PI = 21
Medium dense, olive-brown, well-gradedGRAVEL (GW-GC) with clay, sand, and traceconstruction debris; non-plastic; coarse sand;fine to coarse, rounded to angular gravel;moist
cobbles encountered
FILL
concrete with rebar encountered from 8 to10 feet
no recovery
Soft, dark gray, elastic SILT (MH); mediumplasticity; moist to wet
6-inch-thick silty GRAVEL (GM) lens at~15.7 feet bgs; wet
Soft, dark gray ORGANIC SOIL (OL) withwoody debris; low plasticity; moistDense, dark gray, poorly graded SAND(SP-SM) with silt and gravel; non-plastic;medium to coarse sand; fine, rounded gravel;wetVery dark gray, elastic SILT (MH); medium tohigh plasticity; wetDense, very dark gray, silty GRAVEL (GM)with sand; low plasticity; fine to coarse sand;fine to coarse, rounded gravel; wetStiff, olive-gray with olive-brown mottles, leanCLAY (CL); medium plasticity; moist
becomes greenish gray
Final depth 31.5 feet bgs; boring backfilledwith bentonite.
ATT
P200
ATT
DE
PT
H INSTALLATION ANDCOMMENTS
0 50 100
CORE REC%RQD% MOISTURE CONTENT %
DYNAMIC CONE PENETROMETER
UNCORRECTED N-VALUE
__B
OR
ING
LO
G
7336
8.00
1_B
10-B
20_2
0190
211.
GP
J P
BS
_DA
TA
TM
PL_
GE
O.G
DT
PR
INT
DA
TE
: 4/
9/19
:RP
G
GR
AP
HIC
LOG
DRILLED BY: Holt Services, Inc.LOGGED BY: M. Golden
DRILLING METHOD: Sonic
MATERIAL DESCRIPTION
SA
MP
LE T
YP
E
SA
MP
LE ID
BORING B-10
TE
ST
ING
DEPTHFEET
(See Site Plan)APPROX. BORING B-10 LOCATION:
Page 1 of 1FIGURE A1
LOGGING COMPLETED: 2/04/19HAMMER EFFICIENCY PERCENT:BIT DIAMETER: 6 inches
EUGENE RIVERFRONT DEVELOPMENT EUGENE, OREGON
PBS PROJECT NUMBER:73368.001
NOTE: Lines representing the interface between soil/rock units ofdiffering description are approximate only, inferred wherebetween samples, and may indicate gradual transition.
Surface Conditions: Gravel
50/5
R-1
S-1
R-2
S-2
R-3
S-3
R-4
S-4
R-5
S-5
R-6
S-6
0.0
5.0
10.0
15.0
20.0
25.0
30.0
35.0
0 50 100
60
2
39
10
14
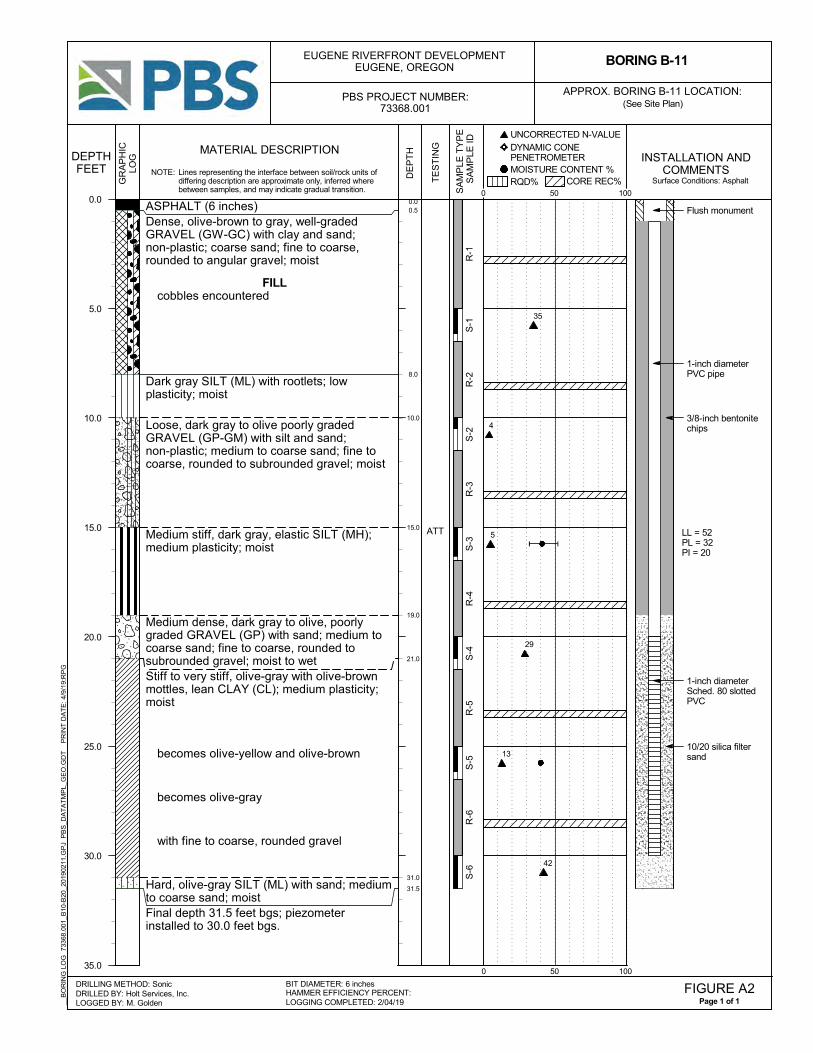
0.00.5
8.0
10.0
15.0
19.0
21.0
31.0
31.5
Flush monument
1-inch diameterPVC pipe
3/8-inch bentonitechips
1-inch diameterSched. 80 slottedPVC
10/20 silica filtersand
LL = 52PL = 32PI = 20
ASPHALT (6 inches)Dense, olive-brown to gray, well-gradedGRAVEL (GW-GC) with clay and sand;non-plastic; coarse sand; fine to coarse,rounded to angular gravel; moist
FILLcobbles encountered
Dark gray SILT (ML) with rootlets; lowplasticity; moist
Loose, dark gray to olive poorly gradedGRAVEL (GP-GM) with silt and sand;non-plastic; medium to coarse sand; fine tocoarse, rounded to subrounded gravel; moist
Medium stiff, dark gray, elastic SILT (MH);medium plasticity; moist
Medium dense, dark gray to olive, poorlygraded GRAVEL (GP) with sand; medium tocoarse sand; fine to coarse, rounded tosubrounded gravel; moist to wetStiff to very stiff, olive-gray with olive-brownmottles, lean CLAY (CL); medium plasticity;moist
becomes olive-yellow and olive-brown
becomes olive-gray
with fine to coarse, rounded gravel
Hard, olive-gray SILT (ML) with sand; mediumto coarse sand; moistFinal depth 31.5 feet bgs; piezometerinstalled to 30.0 feet bgs.
ATT
DE
PT
H
INSTALLATION ANDCOMMENTS
0 50 100
CORE REC%RQD% MOISTURE CONTENT %
DYNAMIC CONE PENETROMETER
UNCORRECTED N-VALUE
__B
OR
ING
LO
G
7336
8.00
1_B
10-B
20_2
0190
211.
GP
J P
BS
_DA
TA
TM
PL_
GE
O.G
DT
PR
INT
DA
TE
: 4/
9/19
:RP
G
GR
AP
HIC
LOG
DRILLED BY: Holt Services, Inc.LOGGED BY: M. Golden
DRILLING METHOD: Sonic
MATERIAL DESCRIPTION
SA
MP
LE T
YP
E
SA
MP
LE ID
BORING B-11
TE
ST
ING
DEPTHFEET
(See Site Plan)APPROX. BORING B-11 LOCATION:
Page 1 of 1FIGURE A2
LOGGING COMPLETED: 2/04/19HAMMER EFFICIENCY PERCENT:BIT DIAMETER: 6 inches
PBS PROJECT NUMBER:73368.001
NOTE: Lines representing the interface between soil/rock units ofdiffering description are approximate only, inferred wherebetween samples, and may indicate gradual transition.
Surface Conditions: Asphalt
R-1
S-1
R-2
S-2
R-3
S-3
R-4
S-4
R-5
S-5
R-6
S-6
0.0
5.0
10.0
15.0
20.0
25.0
30.0
35.0
0 50 100
35
4
5
29
13
42
EUGENE RIVERFRONT DEVELOPMENT EUGENE, OREGON
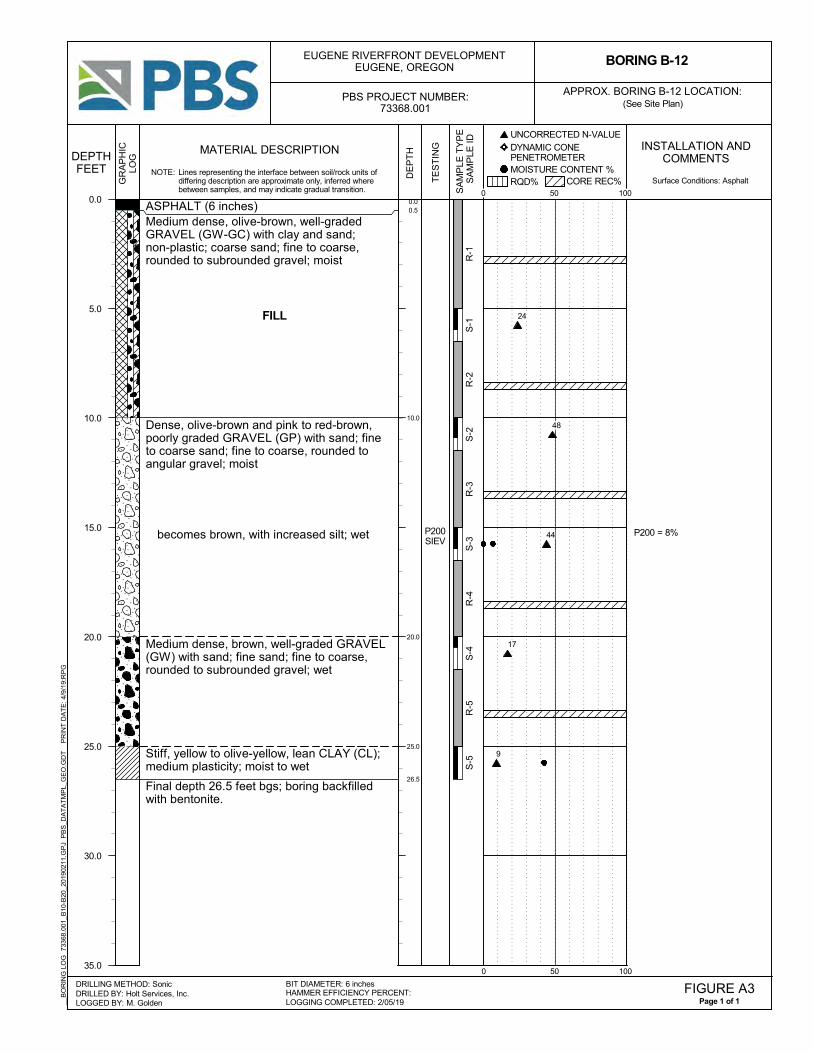
0.00.5
10.0
20.0
25.0
26.5
P200 = 8%
ASPHALT (6 inches)Medium dense, olive-brown, well-gradedGRAVEL (GW-GC) with clay and sand;non-plastic; coarse sand; fine to coarse,rounded to subrounded gravel; moist
FILL
Dense, olive-brown and pink to red-brown,poorly graded GRAVEL (GP) with sand; fineto coarse sand; fine to coarse, rounded toangular gravel; moist
becomes brown, with increased silt; wet
Medium dense, brown, well-graded GRAVEL(GW) with sand; fine sand; fine to coarse,rounded to subrounded gravel; wet
Stiff, yellow to olive-yellow, lean CLAY (CL);medium plasticity; moist to wet
Final depth 26.5 feet bgs; boring backfilledwith bentonite.
P200SIEV
DE
PT
H INSTALLATION ANDCOMMENTS
0 50 100
CORE REC%RQD% MOISTURE CONTENT %
DYNAMIC CONE PENETROMETER
UNCORRECTED N-VALUE
__B
OR
ING
LO
G
7336
8.00
1_B
10-B
20_2
0190
211.
GP
J P
BS
_DA
TA
TM
PL_
GE
O.G
DT
PR
INT
DA
TE
: 4/
9/19
:RP
G
GR
AP
HIC
LOG
DRILLED BY: Holt Services, Inc.LOGGED BY: M. Golden
DRILLING METHOD: Sonic
MATERIAL DESCRIPTION
SA
MP
LE T
YP
E
SA
MP
LE ID
BORING B-12
TE
ST
ING
DEPTHFEET
(See Site Plan)APPROX. BORING B-12 LOCATION:
Page 1 of 1FIGURE A3
LOGGING COMPLETED: 2/05/19HAMMER EFFICIENCY PERCENT:BIT DIAMETER: 6 inches
PBS PROJECT NUMBER:73368.001
NOTE: Lines representing the interface between soil/rock units ofdiffering description are approximate only, inferred wherebetween samples, and may indicate gradual transition.
Surface Conditions: Asphalt
R-1
S-1
R-2
S-2
R-3
S-3
R-4
S-4
R-5
S-5
0.0
5.0
10.0
15.0
20.0
25.0
30.0
35.0
0 50 100
24
48
44
17
9
EUGENE RIVERFRONT DEVELOPMENT EUGENE, OREGON
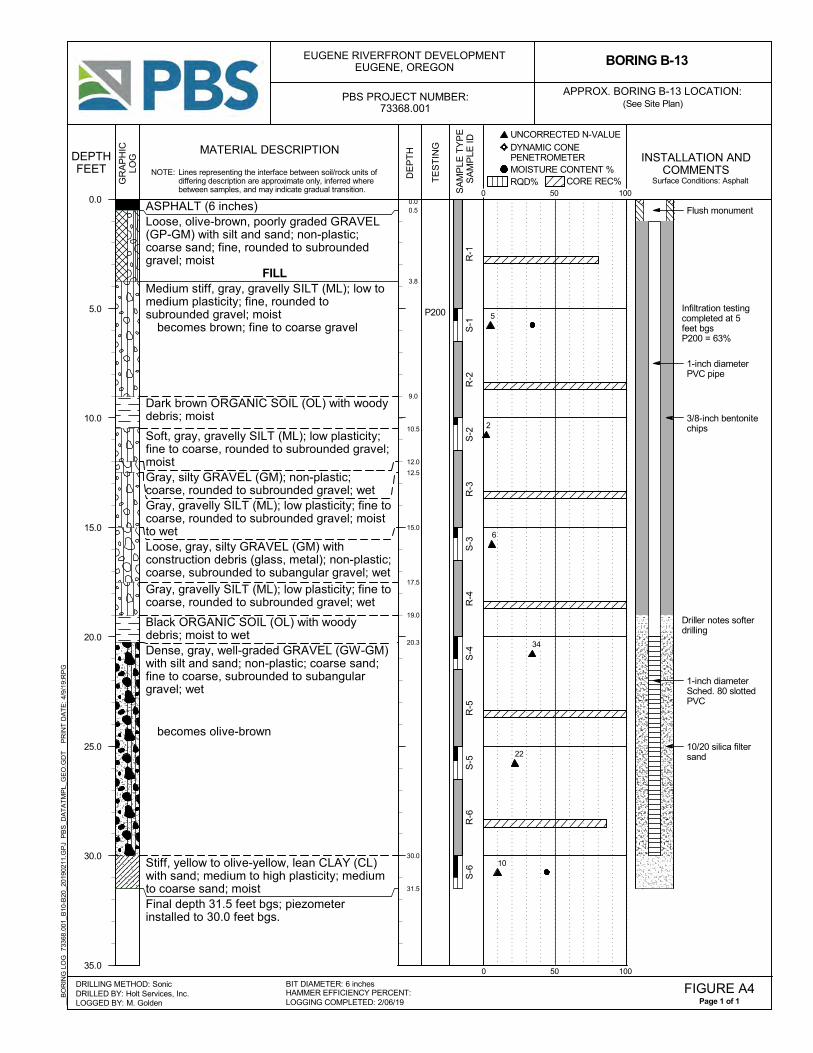
0.00.5
3.8
9.0
10.5
12.0
12.5
15.0
17.5
19.0
20.3
30.0
31.5
Flush monument
1-inch diameterPVC pipe
3/8-inch bentonitechips
1-inch diameterSched. 80 slottedPVC
10/20 silica filtersand
Infiltration testingcompleted at 5feet bgsP200 = 63%
Driller notes softerdrilling
ASPHALT (6 inches)Loose, olive-brown, poorly graded GRAVEL(GP-GM) with silt and sand; non-plastic;coarse sand; fine, rounded to subroundedgravel; moist
FILLMedium stiff, gray, gravelly SILT (ML); low tomedium plasticity; fine, rounded tosubrounded gravel; moist
becomes brown; fine to coarse gravel
Dark brown ORGANIC SOIL (OL) with woodydebris; moist
Soft, gray, gravelly SILT (ML); low plasticity;fine to coarse, rounded to subrounded gravel;moistGray, silty GRAVEL (GM); non-plastic;coarse, rounded to subrounded gravel; wetGray, gravelly SILT (ML); low plasticity; fine tocoarse, rounded to subrounded gravel; moistto wetLoose, gray, silty GRAVEL (GM) withconstruction debris (glass, metal); non-plastic;coarse, subrounded to subangular gravel; wet
Gray, gravelly SILT (ML); low plasticity; fine tocoarse, rounded to subrounded gravel; wet
Black ORGANIC SOIL (OL) with woodydebris; moist to wetDense, gray, well-graded GRAVEL (GW-GM)with silt and sand; non-plastic; coarse sand;fine to coarse, subrounded to subangulargravel; wet
becomes olive-brown
Stiff, yellow to olive-yellow, lean CLAY (CL)with sand; medium to high plasticity; mediumto coarse sand; moistFinal depth 31.5 feet bgs; piezometerinstalled to 30.0 feet bgs.
P200
DE
PT
H
INSTALLATION ANDCOMMENTS
0 50 100
CORE REC%RQD% MOISTURE CONTENT %
DYNAMIC CONE PENETROMETER
UNCORRECTED N-VALUE
__B
OR
ING
LO
G
7336
8.00
1_B
10-B
20_2
0190
211.
GP
J P
BS
_DA
TA
TM
PL_
GE
O.G
DT
PR
INT
DA
TE
: 4/
9/19
:RP
G
GR
AP
HIC
LOG
DRILLED BY: Holt Services, Inc.LOGGED BY: M. Golden
DRILLING METHOD: Sonic
MATERIAL DESCRIPTION
SA
MP
LE T
YP
E
SA
MP
LE ID
BORING B-13
TE
ST
ING
DEPTHFEET
(See Site Plan)APPROX. BORING B-13 LOCATION:
Page 1 of 1FIGURE A4
LOGGING COMPLETED: 2/06/19HAMMER EFFICIENCY PERCENT:BIT DIAMETER: 6 inches
PBS PROJECT NUMBER:73368.001
NOTE: Lines representing the interface between soil/rock units ofdiffering description are approximate only, inferred wherebetween samples, and may indicate gradual transition.
Surface Conditions: Asphalt
R-1
S-1
R-2
S-2
R-3
S-3
R-4
S-4
R-5
S-5
R-6
S-6
0.0
5.0
10.0
15.0
20.0
25.0
30.0
35.0
0 50 100
5
2
6
34
22
10
EUGENE RIVERFRONT DEVELOPMENT EUGENE, OREGON
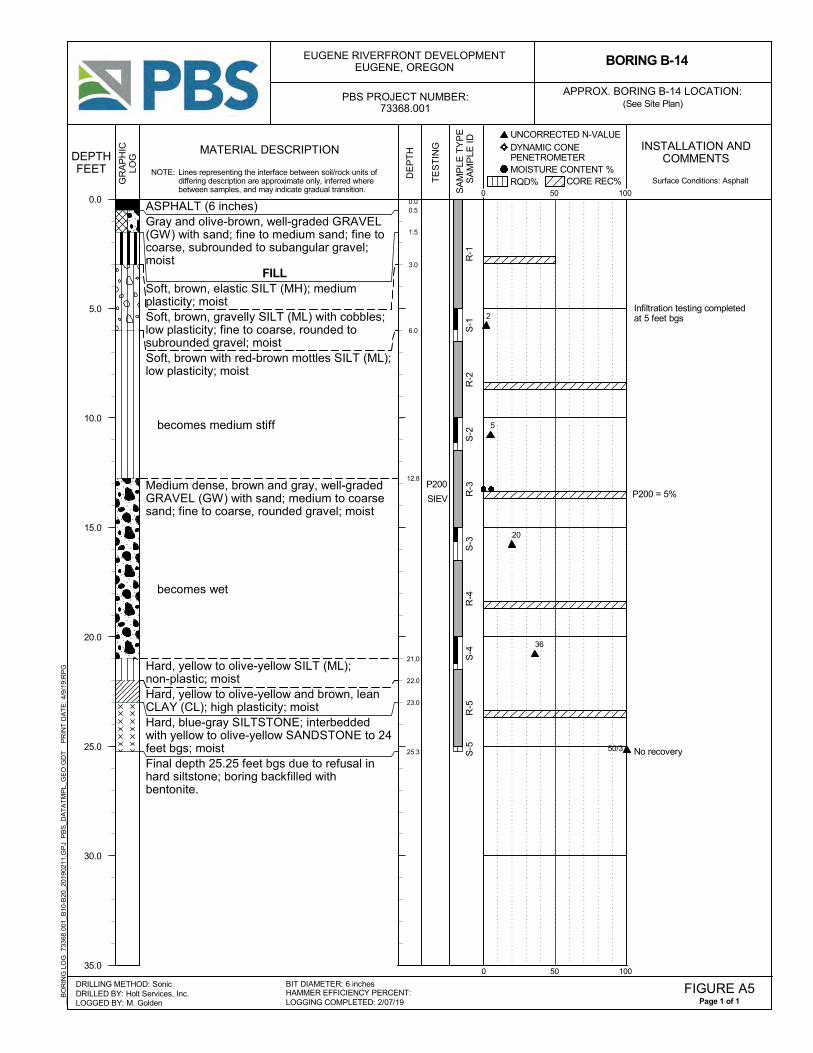
0.00.5
1.5
3.0
6.0
12.8
21.0
22.0
23.0
25.3
Infiltration testing completedat 5 feet bgs
P200 = 5%
No recovery
ASPHALT (6 inches)Gray and olive-brown, well-graded GRAVEL(GW) with sand; fine to medium sand; fine tocoarse, subrounded to subangular gravel;moist
FILLSoft, brown, elastic SILT (MH); mediumplasticity; moistSoft, brown, gravelly SILT (ML) with cobbles;low plasticity; fine to coarse, rounded tosubrounded gravel; moistSoft, brown with red-brown mottles SILT (ML);low plasticity; moist
becomes medium stiff
Medium dense, brown and gray, well-gradedGRAVEL (GW) with sand; medium to coarsesand; fine to coarse, rounded gravel; moist
becomes wet
Hard, yellow to olive-yellow SILT (ML);non-plastic; moistHard, yellow to olive-yellow and brown, leanCLAY (CL); high plasticity; moistHard, blue-gray SILTSTONE; interbeddedwith yellow to olive-yellow SANDSTONE to 24feet bgs; moistFinal depth 25.25 feet bgs due to refusal inhard siltstone; boring backfilled withbentonite.
P200
SIEV
DE
PT
H INSTALLATION ANDCOMMENTS
0 50 100
CORE REC%RQD% MOISTURE CONTENT %
DYNAMIC CONE PENETROMETER
UNCORRECTED N-VALUE
__B
OR
ING
LO
G
7336
8.00
1_B
10-B
20_2
0190
211.
GP
J P
BS
_DA
TA
TM
PL_
GE
O.G
DT
PR
INT
DA
TE
: 4/
9/19
:RP
G
GR
AP
HIC
LOG
DRILLED BY: Holt Services, Inc.LOGGED BY: M. Golden
DRILLING METHOD: Sonic
MATERIAL DESCRIPTION
SA
MP
LE T
YP
E
SA
MP
LE ID
BORING B-14
TE
ST
ING
DEPTHFEET
(See Site Plan)APPROX. BORING B-14 LOCATION:
Page 1 of 1FIGURE A5
LOGGING COMPLETED: 2/07/19HAMMER EFFICIENCY PERCENT:BIT DIAMETER: 6 inches
PBS PROJECT NUMBER:73368.001
NOTE: Lines representing the interface between soil/rock units ofdiffering description are approximate only, inferred wherebetween samples, and may indicate gradual transition.
Surface Conditions: Asphalt
50/3
R-1
S-1
R-2
S-2
R-3
S-3
R-4
S-4
R-5
S-5
0.0
5.0
10.0
15.0
20.0
25.0
30.0
35.0
0 50 100
2
5
20
36
EUGENE RIVERFRONT DEVELOPMENT EUGENE, OREGON
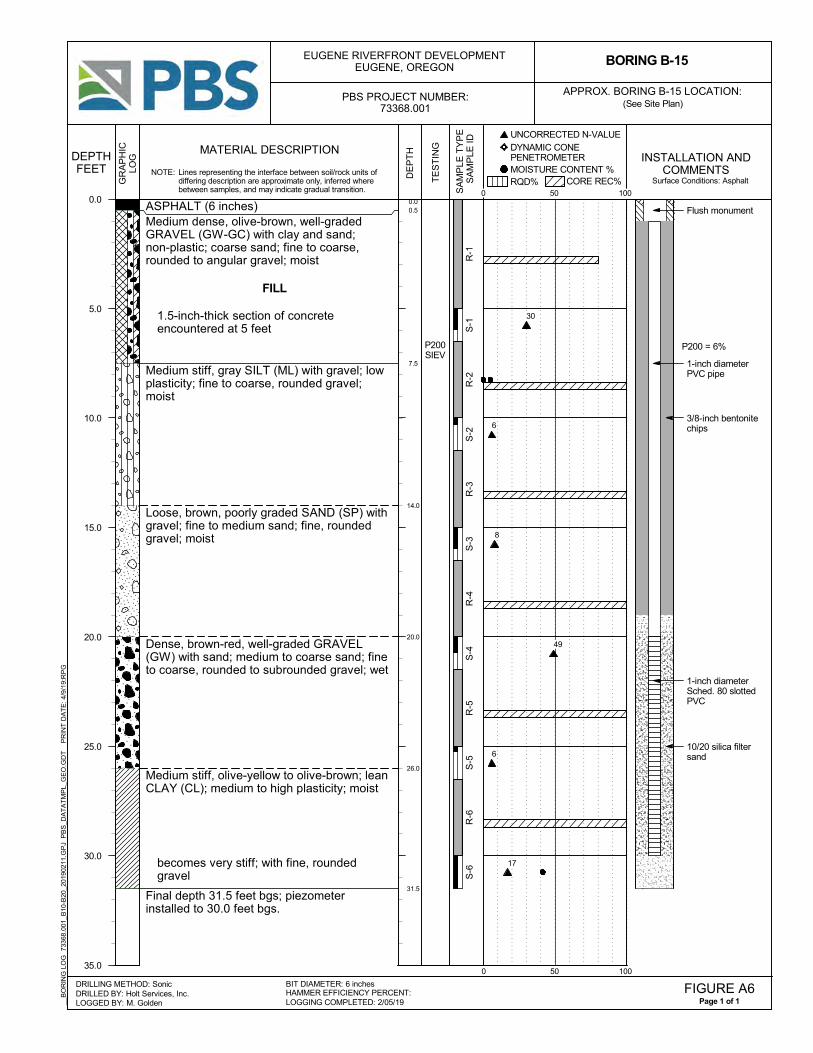
0.00.5
7.5
14.0
20.0
26.0
31.5
Flush monument
1-inch diameterPVC pipe
3/8-inch bentonitechips
1-inch diameterSched. 80 slottedPVC
10/20 silica filtersand
P200 = 6%
ASPHALT (6 inches)Medium dense, olive-brown, well-gradedGRAVEL (GW-GC) with clay and sand;non-plastic; coarse sand; fine to coarse,rounded to angular gravel; moist
FILL
1.5-inch-thick section of concreteencountered at 5 feet
Medium stiff, gray SILT (ML) with gravel; lowplasticity; fine to coarse, rounded gravel;moist
Loose, brown, poorly graded SAND (SP) withgravel; fine to medium sand; fine, roundedgravel; moist
Dense, brown-red, well-graded GRAVEL(GW) with sand; medium to coarse sand; fineto coarse, rounded to subrounded gravel; wet
Medium stiff, olive-yellow to olive-brown; leanCLAY (CL); medium to high plasticity; moist
becomes very stiff; with fine, roundedgravel
Final depth 31.5 feet bgs; piezometerinstalled to 30.0 feet bgs.
P200SIEV
DE
PT
H
INSTALLATION ANDCOMMENTS
0 50 100
CORE REC%RQD% MOISTURE CONTENT %
DYNAMIC CONE PENETROMETER
UNCORRECTED N-VALUE
__B
OR
ING
LO
G
7336
8.00
1_B
10-B
20_2
0190
211.
GP
J P
BS
_DA
TA
TM
PL_
GE
O.G
DT
PR
INT
DA
TE
: 4/
9/19
:RP
G
GR
AP
HIC
LOG
DRILLED BY: Holt Services, Inc.LOGGED BY: M. Golden
DRILLING METHOD: Sonic
MATERIAL DESCRIPTION
SA
MP
LE T
YP
E
SA
MP
LE ID
BORING B-15
TE
ST
ING
DEPTHFEET
(See Site Plan)APPROX. BORING B-15 LOCATION:
Page 1 of 1FIGURE A6
LOGGING COMPLETED: 2/05/19HAMMER EFFICIENCY PERCENT:BIT DIAMETER: 6 inches
PBS PROJECT NUMBER:73368.001
NOTE: Lines representing the interface between soil/rock units ofdiffering description are approximate only, inferred wherebetween samples, and may indicate gradual transition.
Surface Conditions: Asphalt
R-1
S-1
R-2
S-2
R-3
S-3
R-4
S-4
R-5
S-5
R-6
S-6
0.0
5.0
10.0
15.0
20.0
25.0
30.0
35.0
0 50 100
30
6
8
49
6
17
EUGENE RIVERFRONT DEVELOPMENT EUGENE, OREGON
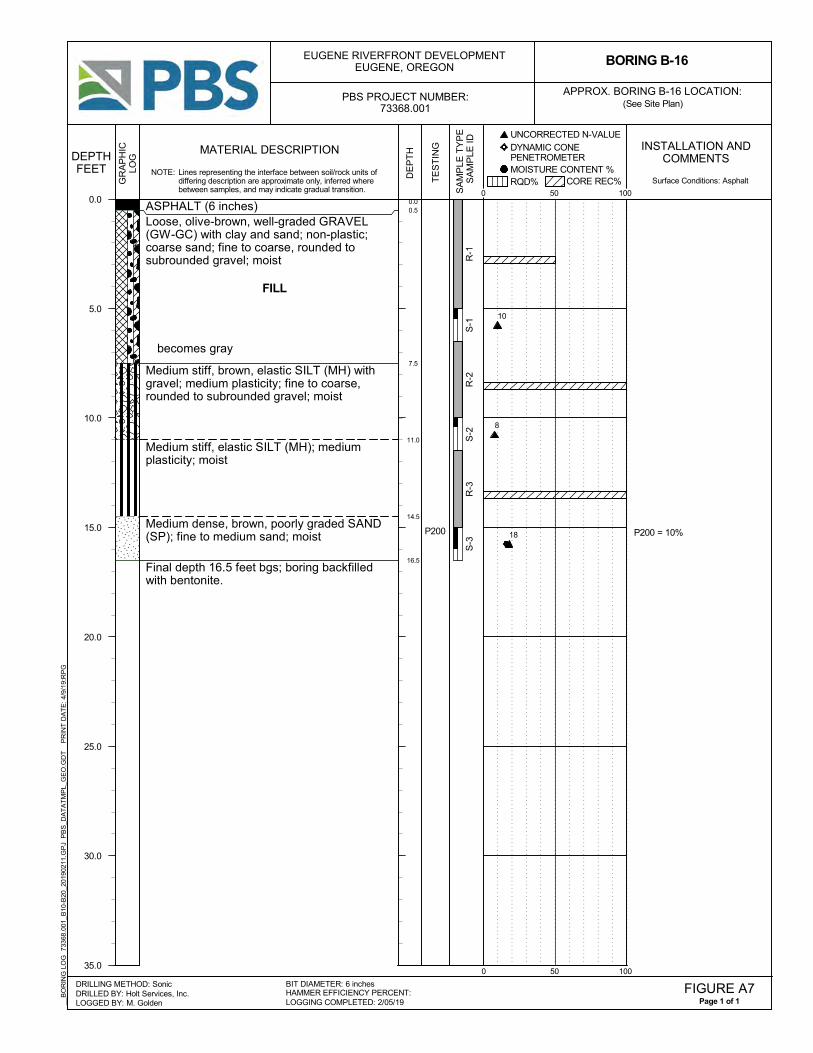
0.00.5
7.5
11.0
14.5
16.5
P200 = 10%
ASPHALT (6 inches)Loose, olive-brown, well-graded GRAVEL(GW-GC) with clay and sand; non-plastic;coarse sand; fine to coarse, rounded tosubrounded gravel; moist
FILL
becomes gray
Medium stiff, brown, elastic SILT (MH) withgravel; medium plasticity; fine to coarse,rounded to subrounded gravel; moist
Medium stiff, elastic SILT (MH); mediumplasticity; moist
Medium dense, brown, poorly graded SAND(SP); fine to medium sand; moist
Final depth 16.5 feet bgs; boring backfilledwith bentonite.
P200
DE
PT
H INSTALLATION ANDCOMMENTS
0 50 100
CORE REC%RQD% MOISTURE CONTENT %
DYNAMIC CONE PENETROMETER
UNCORRECTED N-VALUE
__B
OR
ING
LO
G
7336
8.00
1_B
10-B
20_2
0190
211.
GP
J P
BS
_DA
TA
TM
PL_
GE
O.G
DT
PR
INT
DA
TE
: 4/
9/19
:RP
G
GR
AP
HIC
LOG
DRILLED BY: Holt Services, Inc.LOGGED BY: M. Golden
DRILLING METHOD: Sonic
MATERIAL DESCRIPTION
SA
MP
LE T
YP
E
SA
MP
LE ID
BORING B-16
TE
ST
ING
DEPTHFEET
(See Site Plan)APPROX. BORING B-16 LOCATION:
Page 1 of 1FIGURE A7
LOGGING COMPLETED: 2/05/19HAMMER EFFICIENCY PERCENT:BIT DIAMETER: 6 inches
PBS PROJECT NUMBER:73368.001
NOTE: Lines representing the interface between soil/rock units ofdiffering description are approximate only, inferred wherebetween samples, and may indicate gradual transition.
Surface Conditions: Asphalt
R-1
S-1
R-2
S-2
R-3
S-3
0.0
5.0
10.0
15.0
20.0
25.0
30.0
35.0
0 50 100
10
8
18
EUGENE RIVERFRONT DEVELOPMENT EUGENE, OREGON
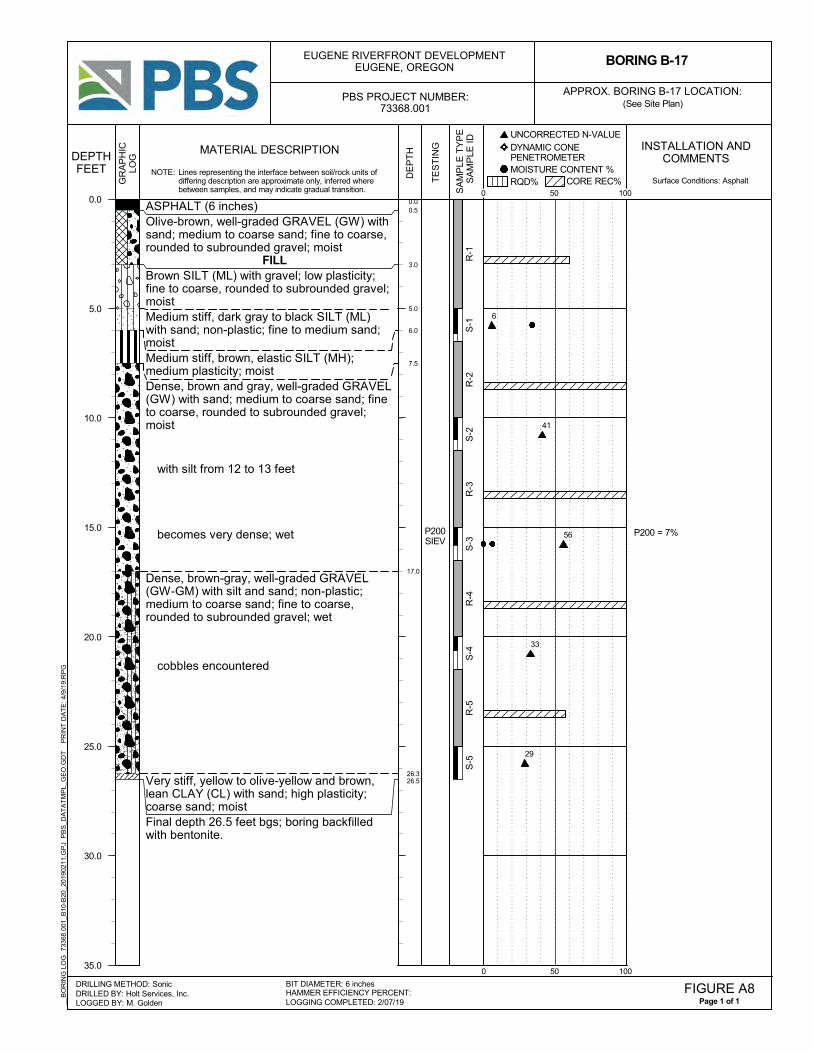
0.00.5
3.0
5.0
6.0
7.5
17.0
26.326.5
P200 = 7%
ASPHALT (6 inches)Olive-brown, well-graded GRAVEL (GW) withsand; medium to coarse sand; fine to coarse,rounded to subrounded gravel; moist
FILLBrown SILT (ML) with gravel; low plasticity;fine to coarse, rounded to subrounded gravel;moistMedium stiff, dark gray to black SILT (ML)with sand; non-plastic; fine to medium sand;moistMedium stiff, brown, elastic SILT (MH);medium plasticity; moistDense, brown and gray, well-graded GRAVEL(GW) with sand; medium to coarse sand; fineto coarse, rounded to subrounded gravel;moist
with silt from 12 to 13 feet
becomes very dense; wet
Dense, brown-gray, well-graded GRAVEL(GW-GM) with silt and sand; non-plastic;medium to coarse sand; fine to coarse,rounded to subrounded gravel; wet
cobbles encountered
Very stiff, yellow to olive-yellow and brown,lean CLAY (CL) with sand; high plasticity;coarse sand; moistFinal depth 26.5 feet bgs; boring backfilledwith bentonite.
P200SIEV
DE
PT
H INSTALLATION ANDCOMMENTS
0 50 100
CORE REC%RQD% MOISTURE CONTENT %
DYNAMIC CONE PENETROMETER
UNCORRECTED N-VALUE
__B
OR
ING
LO
G
7336
8.00
1_B
10-B
20_2
0190
211.
GP
J P
BS
_DA
TA
TM
PL_
GE
O.G
DT
PR
INT
DA
TE
: 4/
9/19
:RP
G
GR
AP
HIC
LOG
DRILLED BY: Holt Services, Inc.LOGGED BY: M. Golden
DRILLING METHOD: Sonic
MATERIAL DESCRIPTION
SA
MP
LE T
YP
E
SA
MP
LE ID
BORING B-17
TE
ST
ING
DEPTHFEET
(See Site Plan)APPROX. BORING B-17 LOCATION:
Page 1 of 1FIGURE A8
LOGGING COMPLETED: 2/07/19HAMMER EFFICIENCY PERCENT:BIT DIAMETER: 6 inches
PBS PROJECT NUMBER:73368.001
NOTE: Lines representing the interface between soil/rock units ofdiffering description are approximate only, inferred wherebetween samples, and may indicate gradual transition.
Surface Conditions: Asphalt
R-1
S-1
R-2
S-2
R-3
S-3
R-4
S-4
R-5
S-5
0.0
5.0
10.0
15.0
20.0
25.0
30.0
35.0
0 50 100
6
41
56
33
29
EUGENE RIVERFRONT DEVELOPMENT EUGENE, OREGON
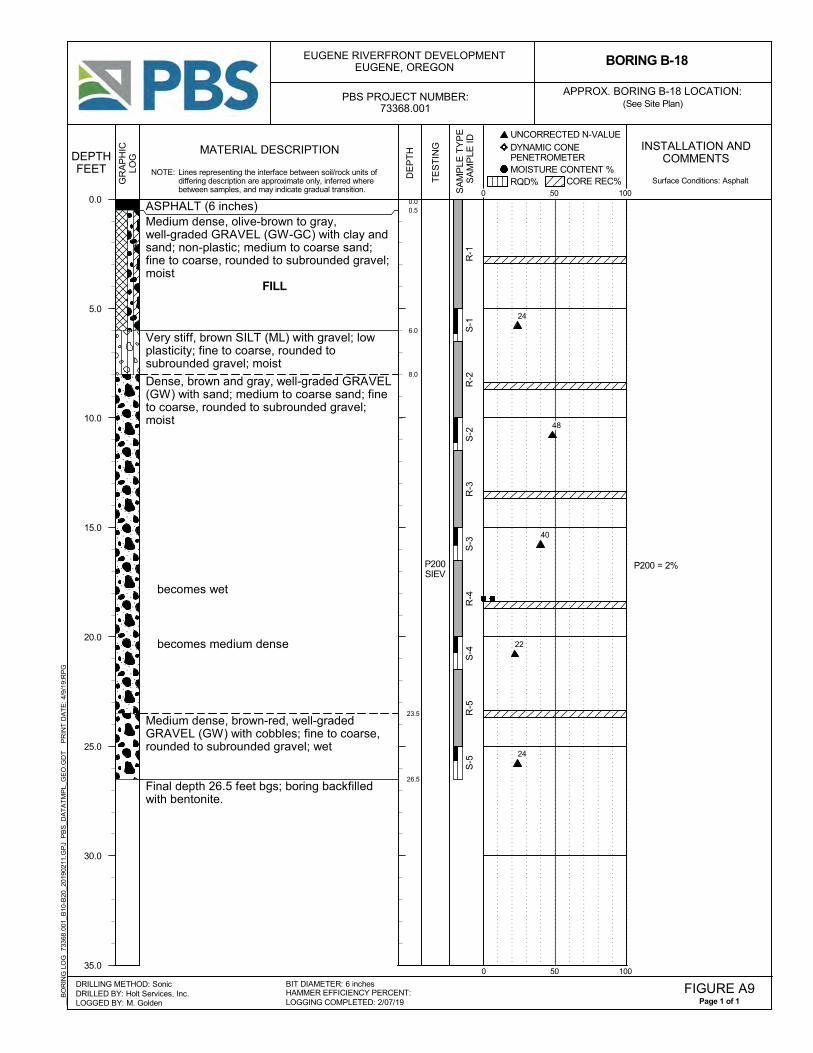
0.00.5
6.0
8.0
23.5
26.5
P200 = 2%
ASPHALT (6 inches)Medium dense, olive-brown to gray,well-graded GRAVEL (GW-GC) with clay andsand; non-plastic; medium to coarse sand;fine to coarse, rounded to subrounded gravel;moist
FILL
Very stiff, brown SILT (ML) with gravel; lowplasticity; fine to coarse, rounded tosubrounded gravel; moist
Dense, brown and gray, well-graded GRAVEL(GW) with sand; medium to coarse sand; fineto coarse, rounded to subrounded gravel;moist
becomes wet
becomes medium dense
Medium dense, brown-red, well-gradedGRAVEL (GW) with cobbles; fine to coarse,rounded to subrounded gravel; wet
Final depth 26.5 feet bgs; boring backfilledwith bentonite.
P200SIEV
DE
PT
H INSTALLATION ANDCOMMENTS
0 50 100
CORE REC%RQD% MOISTURE CONTENT %
DYNAMIC CONE PENETROMETER
UNCORRECTED N-VALUE
__B
OR
ING
LO
G
7336
8.00
1_B
10-B
20_2
0190
211.
GP
J P
BS
_DA
TA
TM
PL_
GE
O.G
DT
PR
INT
DA
TE
: 4/
9/19
:RP
G
GR
AP
HIC
LOG
DRILLED BY: Holt Services, Inc.LOGGED BY: M. Golden
DRILLING METHOD: Sonic
MATERIAL DESCRIPTION
SA
MP
LE T
YP
E
SA
MP
LE ID
BORING B-18
TE
ST
ING
DEPTHFEET
(See Site Plan)APPROX. BORING B-18 LOCATION:
Page 1 of 1FIGURE A9
LOGGING COMPLETED: 2/07/19HAMMER EFFICIENCY PERCENT:BIT DIAMETER: 6 inches
PBS PROJECT NUMBER:73368.001
NOTE: Lines representing the interface between soil/rock units ofdiffering description are approximate only, inferred wherebetween samples, and may indicate gradual transition.
Surface Conditions: Asphalt
R-1
S-1
R-2
S-2
R-3
S-3
R-4
S-4
R-5
S-5
0.0
5.0
10.0
15.0
20.0
25.0
30.0
35.0
0 50 100
24
48
40
22
24
EUGENE RIVERFRONT DEVELOPMENT EUGENE, OREGON
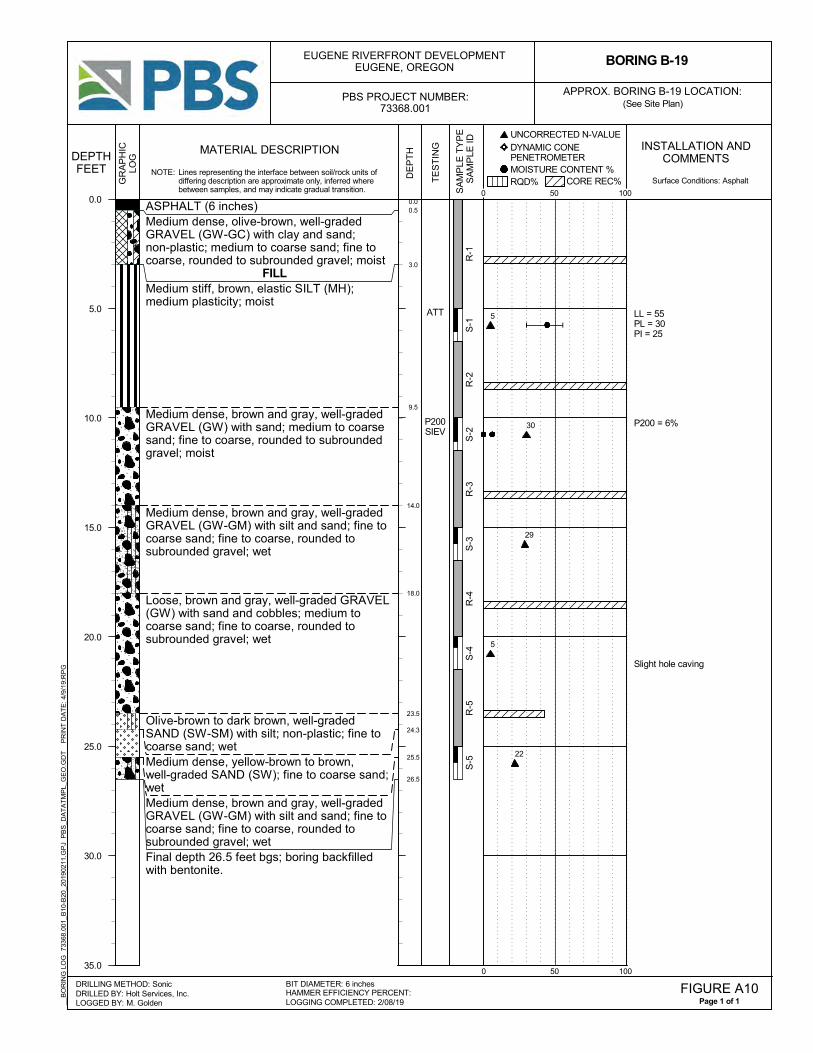
0.00.5
3.0
9.5
14.0
18.0
23.5
24.3
25.5
26.5
LL = 55PL = 30PI = 25
P200 = 6%
Slight hole caving
ASPHALT (6 inches)Medium dense, olive-brown, well-gradedGRAVEL (GW-GC) with clay and sand;non-plastic; medium to coarse sand; fine tocoarse, rounded to subrounded gravel; moist
FILLMedium stiff, brown, elastic SILT (MH);medium plasticity; moist
Medium dense, brown and gray, well-gradedGRAVEL (GW) with sand; medium to coarsesand; fine to coarse, rounded to subroundedgravel; moist
Medium dense, brown and gray, well-gradedGRAVEL (GW-GM) with silt and sand; fine tocoarse sand; fine to coarse, rounded tosubrounded gravel; wet
Loose, brown and gray, well-graded GRAVEL(GW) with sand and cobbles; medium tocoarse sand; fine to coarse, rounded tosubrounded gravel; wet
Olive-brown to dark brown, well-gradedSAND (SW-SM) with silt; non-plastic; fine tocoarse sand; wetMedium dense, yellow-brown to brown,well-graded SAND (SW); fine to coarse sand;wetMedium dense, brown and gray, well-gradedGRAVEL (GW-GM) with silt and sand; fine tocoarse sand; fine to coarse, rounded tosubrounded gravel; wetFinal depth 26.5 feet bgs; boring backfilledwith bentonite.
ATT
P200SIEV
DE
PT
H INSTALLATION ANDCOMMENTS
0 50 100
CORE REC%RQD% MOISTURE CONTENT %
DYNAMIC CONE PENETROMETER
UNCORRECTED N-VALUE
__B
OR
ING
LO
G
7336
8.00
1_B
10-B
20_2
0190
211.
GP
J P
BS
_DA
TA
TM
PL_
GE
O.G
DT
PR
INT
DA
TE
: 4/
9/19
:RP
G
GR
AP
HIC
LOG
DRILLED BY: Holt Services, Inc.LOGGED BY: M. Golden
DRILLING METHOD: Sonic
MATERIAL DESCRIPTION
SA
MP
LE T
YP
E
SA
MP
LE ID
BORING B-19
TE
ST
ING
DEPTHFEET
(See Site Plan)APPROX. BORING B-19 LOCATION:
Page 1 of 1FIGURE A10
LOGGING COMPLETED: 2/08/19HAMMER EFFICIENCY PERCENT:BIT DIAMETER: 6 inches
PBS PROJECT NUMBER:73368.001
NOTE: Lines representing the interface between soil/rock units ofdiffering description are approximate only, inferred wherebetween samples, and may indicate gradual transition.
Surface Conditions: Asphalt
R-1
S-1
R-2
S-2
R-3
S-3
R-4
S-4
R-5
S-5
0.0
5.0
10.0
15.0
20.0
25.0
30.0
35.0
0 50 100
5
30
29
5
22
EUGENE RIVERFRONT DEVELOPMENT EUGENE, OREGON
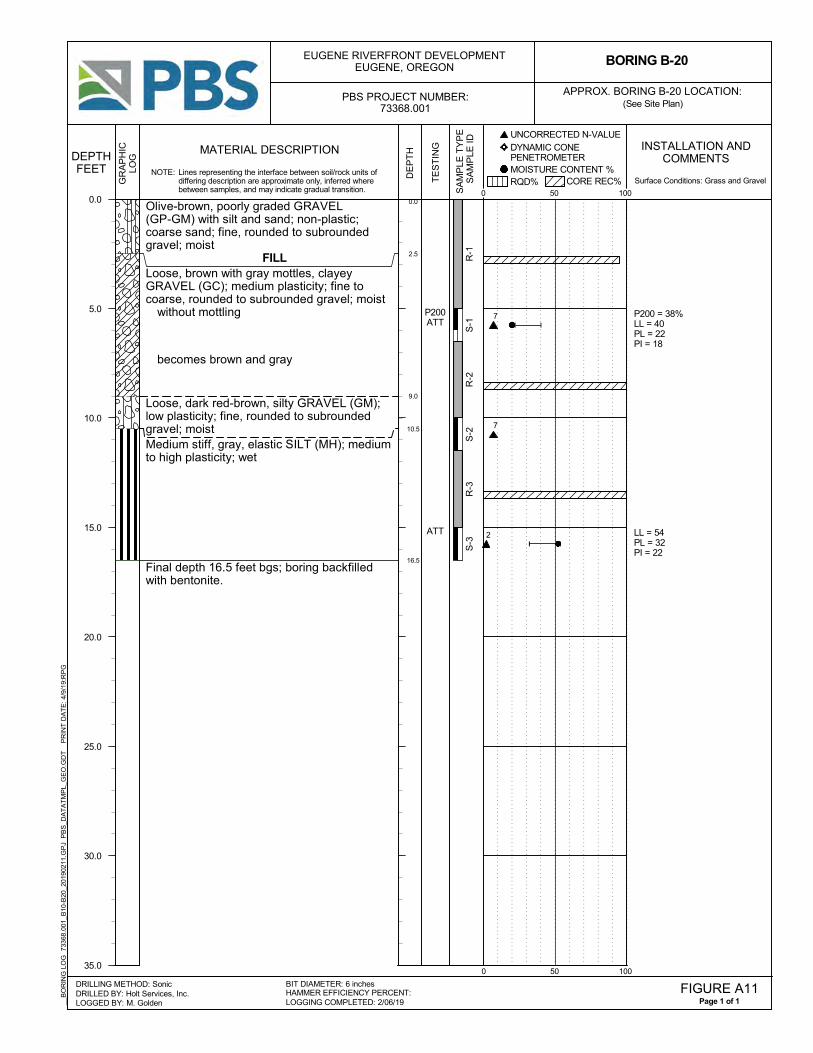
0.0
2.5
9.0
10.5
16.5
P200 = 38%LL = 40PL = 22PI = 18
LL = 54PL = 32PI = 22
Olive-brown, poorly graded GRAVEL(GP-GM) with silt and sand; non-plastic;coarse sand; fine, rounded to subroundedgravel; moist
FILLLoose, brown with gray mottles, clayeyGRAVEL (GC); medium plasticity; fine tocoarse, rounded to subrounded gravel; moist
without mottling
becomes brown and gray
Loose, dark red-brown, silty GRAVEL (GM);low plasticity; fine, rounded to subroundedgravel; moistMedium stiff, gray, elastic SILT (MH); mediumto high plasticity; wet
Final depth 16.5 feet bgs; boring backfilledwith bentonite.
P200ATT
ATT
DE
PT
H INSTALLATION ANDCOMMENTS
0 50 100
CORE REC%RQD% MOISTURE CONTENT %
DYNAMIC CONE PENETROMETER
UNCORRECTED N-VALUE
__B
OR
ING
LO
G
7336
8.00
1_B
10-B
20_2
0190
211.
GP
J P
BS
_DA
TA
TM
PL_
GE
O.G
DT
PR
INT
DA
TE
: 4/
9/19
:RP
G
GR
AP
HIC
LOG
DRILLED BY: Holt Services, Inc.LOGGED BY: M. Golden
DRILLING METHOD: Sonic
MATERIAL DESCRIPTION
SA
MP
LE T
YP
E
SA
MP
LE ID
BORING B-20
TE
ST
ING
DEPTHFEET
(See Site Plan)APPROX. BORING B-20 LOCATION:
Page 1 of 1FIGURE A11
LOGGING COMPLETED: 2/06/19HAMMER EFFICIENCY PERCENT:BIT DIAMETER: 6 inches
PBS PROJECT NUMBER:73368.001
NOTE: Lines representing the interface between soil/rock units ofdiffering description are approximate only, inferred wherebetween samples, and may indicate gradual transition.
Surface Conditions: Grass and Gravel
R-1
S-1
R-2
S-2
R-3
S-3
0.0
5.0
10.0
15.0
20.0
25.0
30.0
35.0
0 50 100
7
7
2
EUGENE RIVERFRONT DEVELOPMENT EUGENE, OREGON

Appendix B Laboratory Testing
Geotechnical Engineering Report
City of Eugene
Eugene Riverfront Development
Eugene, Oregon
B-1
April 24, 2019
PBS Project 73368.001
Appendix B: Laboratory Testing
B1 GENERAL
Samples obtained during the field explorations were examined in the PBS laboratory. The physical
characteristics of the samples were noted and field classifications were modified where necessary. During the
course of examination, representative samples were selected for further testing. The testing program for the
soil samples included standard classification tests, which yield certain index properties of the soils important
to an evaluation of soil behavior. The testing procedures are described in the following paragraphs. Unless
noted otherwise, all test procedures are in general accordance with applicable ASTM standards. “General
accordance” means that certain local and common descriptive practices and methodologies have been
followed.
B2 CLASSIFICATION TESTS
B2.1 Visual Classification
The soils were classified in accordance with the Unified Soil Classification System with certain other
terminology, such as the relative density or consistency of the soil deposits, in general accordance with
engineering practice. In determining the soil type (that is, gravel, sand, silt, or clay) the term that best
described the major portion of the sample is used. Modifying terminology to further describe the samples is
defined in Table A-1, Terminology Used to Describe Soil, in Appendix A.
B2.2 Moisture (Water) Contents
Natural moisture content determinations were made on samples of the fine-grained soils (that is, silts, clays,
and silty sands). The natural moisture content is defined as the ratio of the weight of water to dry weight of
soil, expressed as a percentage. The results of the moisture content determinations are presented on the logs
of the borings in Appendix A and on Figure B3, Summary of Laboratory Data, in Appendix B.
B2.3 Atterberg Limits
Atterberg limits were determined on select samples for the purpose of classifying soils into various groups for
correlation. The results of the Atterberg limits test, which included liquid and plastic limits, are plotted on
Figure B1, Atterberg Limits Test Results, and on the explorations logs in Appendix A where applicable.
B2.4 Grain-Size Analyses
Mechanical grain-size analysis was performed on selected samples to determine the grain size distribution.
Washed sieve analyses (P200) were completed on samples to determine the portion of soil samples passing
the No. 200 Sieve (i.e., silt and clay). Results of mechanical grain-size analyses are presented on Figure B2 in
Appendix B. The results of the P200 test results are presented on the exploration logs in Appendix A and on
Figure B3, Summary of Laboratory Data, in Appendix B.
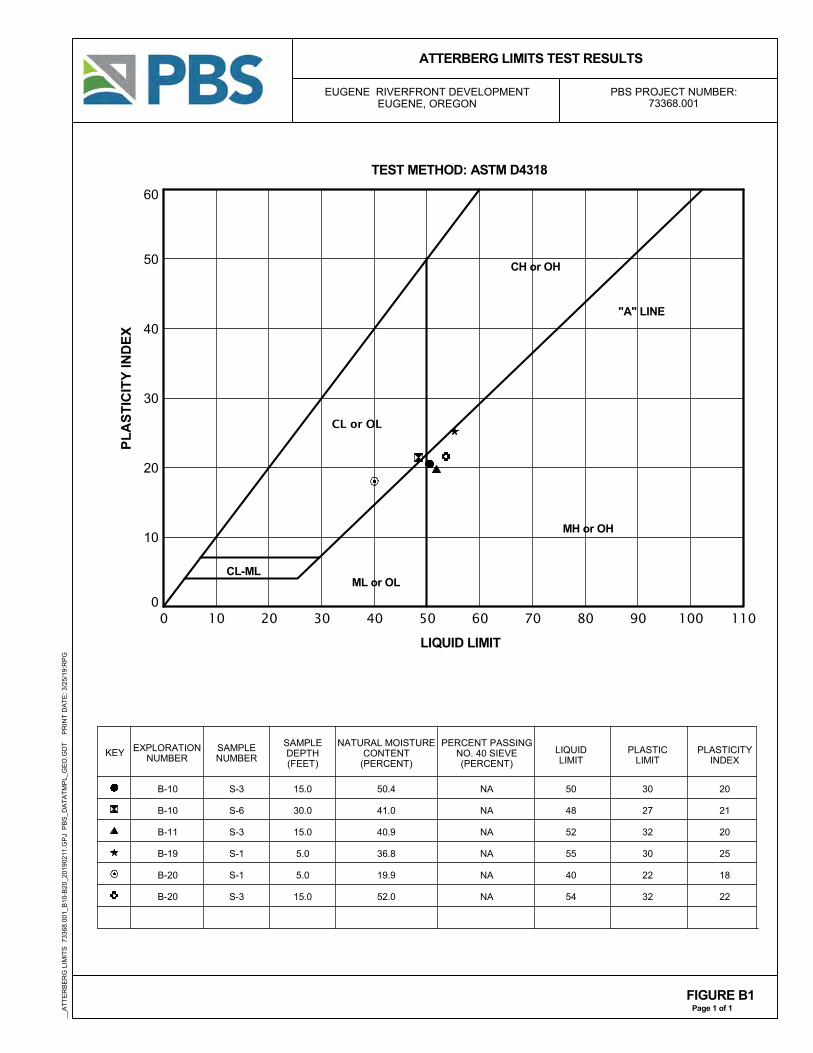
0
10
20
30
40
50
60
0 10 20 30 40 50 60 70 80 90 100 110
CL or OL
ATTERBERG LIMITS TEST RESULTS
CH or OH
CL-ML
MH or OH
TEST METHOD: ASTM D4318
"A" LINE
FIGURE B1
ML or OL
Page 1 of 1
PLA
STIC
ITY
IND
EX
LIQUID LIMIT
PBS PROJECT NUMBER:73368.001
EUGENE RIVERFRONT DEVELOPMENT EUGENE, OREGON
KEYSAMPLEDEPTH(FEET)
EXPLORATIONNUMBER
NATURAL MOISTURECONTENT
(PERCENT)
PERCENT PASSINGNO. 40 SIEVE(PERCENT)
SAMPLENUMBER
S-3
S-6
S-3
S-1
S-1
S-3
B-10
B-10
B-11
B-19
B-20
B-20
15.0
30.0
15.0
5.0
5.0
15.0
50
48
52
55
40
54
20
21
20
25
18
22
NA
NA
NA
NA
NA
NA
LIQUIDLIMIT
30
27
32
30
22
32
PLASTICLIMIT
PLASTICITYINDEX
50.4
41.0
40.9
36.8
19.9
52.0
__A
TT
ER
BE
RG
LIM
ITS
73
368.
001_
B10
-B20
_201
9021
1.G
PJ
PB
S_D
AT
AT
MP
L_G
EO
.GD
T
P
RIN
T D
AT
E:
3/25
/19:
RP
G
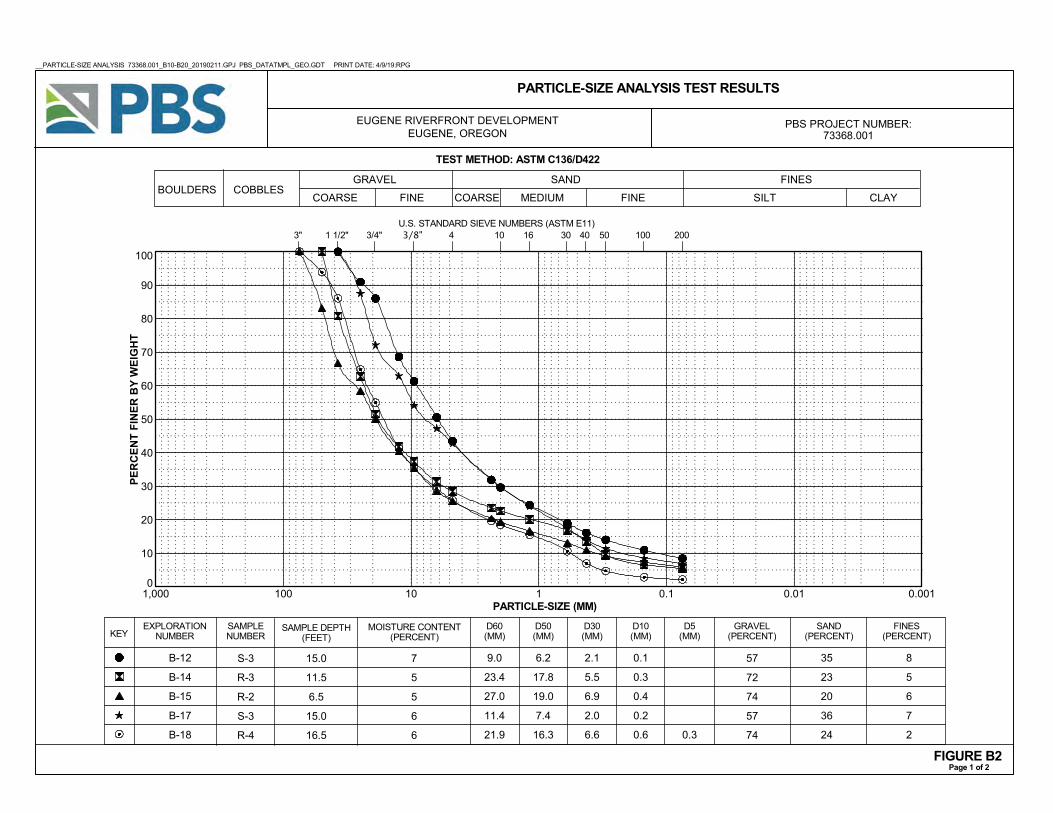
0
10
20
30
40
50
60
70
80
90
100
0.0010.010.11101001,000
CLAYBOULDERS
MOISTURE CONTENT(PERCENT)
B-12
B-14
B-15
B-17
B-18
KEYSAMPLENUMBER
SAMPLE DEPTH(FEET)
15.0
11.5
6.5
15.0
16.5
SAND(PERCENT)
U.S. STANDARD SIEVE NUMBERS (ASTM E11)3/4" 10 2003" 1 1/2" 100
COARSE
35
23
20
36
24
PARTICLE-SIZE ANALYSIS TEST RESULTS
MEDIUM SILTCOBBLES
FINECOARSE
9.0
23.4
27.0
11.4
21.9
D50(MM)
D30(MM)
D10(MM)
D5(MM)
GRAVEL(PERCENT)
FINES(PERCENT)
8
5
6
7
2
6.2
17.8
19.0
7.4
16.3
2.1
5.5
6.9
2.0
6.6 0.3
PARTICLE-SIZE (MM)
57
72
74
57
74
FINE
GRAVEL SAND FINES
EXPLORATIONNUMBER
D60(MM)
3/8" 404 16 30 50
Page 1 of 2FIGURE B2
7
5
5
6
6
S-3
R-3
R-2
S-3
R-4
0.1
0.3
0.4
0.2
0.6
TEST METHOD: ASTM C136/D422
PER
CEN
T FI
NER
BY
WEI
GH
TPBS PROJECT NUMBER:
73368.001
EUGENE RIVERFRONT DEVELOPMENT EUGENE, OREGON
__PARTICLE-SIZE ANALYSIS 73368.001_B10-B20_20190211.GPJ PBS_DATATMPL_GEO.GDT PRINT DATE: 4/9/19:RPG
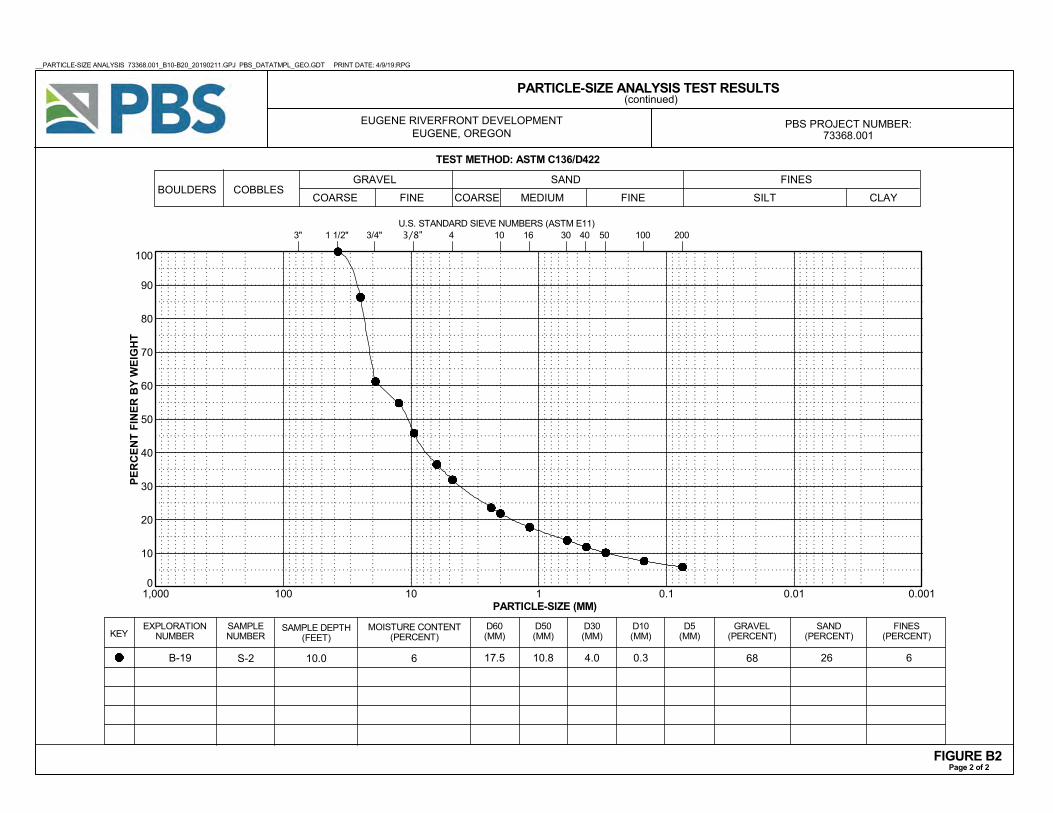
0
10
20
30
40
50
60
70
80
90
100
0.0010.010.11101001,000
CLAYBOULDERS
MOISTURE CONTENT(PERCENT)
B-19
KEYSAMPLENUMBER
SAMPLE DEPTH(FEET)
10.0
SAND(PERCENT)
U.S. STANDARD SIEVE NUMBERS (ASTM E11)3/4" 10 2003" 1 1/2" 100
COARSE
26
PARTICLE-SIZE ANALYSIS TEST RESULTS
MEDIUM SILTCOBBLES
FINECOARSE
17.5
D50(MM)
D30(MM)
D10(MM)
D5(MM)
GRAVEL(PERCENT)
FINES(PERCENT)
610.8 4.0
PARTICLE-SIZE (MM)
68
FINE
GRAVEL SAND FINES
EXPLORATIONNUMBER
D60(MM)
3/8" 404 16 30 50
Page 2 of 2FIGURE B2
6S-2 0.3
TEST METHOD: ASTM C136/D422
PER
CEN
T FI
NER
BY
WEI
GH
T
(continued)
PBS PROJECT NUMBER:73368.001
EUGENE RIVERFRONT DEVELOPMENTEUGENE, OREGON
__PARTICLE-SIZE ANALYSIS 73368.001_B10-B20_20190211.GPJ PBS_DATATMPL_GEO.GDT PRINT DATE: 4/9/19:RPG
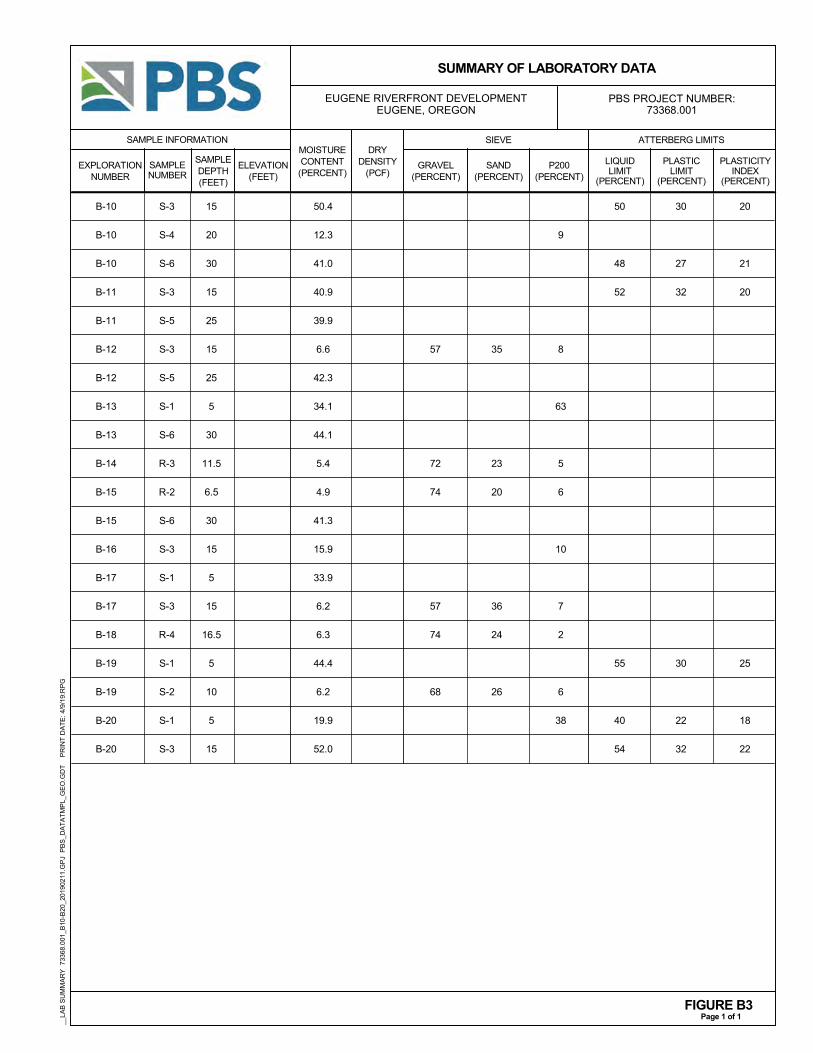
B-10 S-3 15 50.4 50 30 20
B-10 S-4 20 12.3 9
B-10 S-6 30 41.0 48 27 21
B-11 S-3 15 40.9 52 32 20
B-11 S-5 25 39.9
B-12 S-3 15 6.6 57 35 8
B-12 S-5 25 42.3
B-13 S-1 5 34.1 63
B-13 S-6 30 44.1
B-14 R-3 11.5 5.4 72 23 5
B-15 R-2 6.5 4.9 74 20 6
B-15 S-6 30 41.3
B-16 S-3 15 15.9 10
B-17 S-1 5 33.9
B-17 S-3 15 6.2 57 36 7
B-18 R-4 16.5 6.3 74 24 2
B-19 S-1 5 44.4 55 30 25
B-19 S-2 10 6.2 68 26 6
B-20 S-1 5 19.9 38 40 22 18
B-20 S-3 15 52.0 54 32 22
SUMMARY OF LABORATORY DATA
Page 1 of 1FIGURE B3
LIQUIDLIMIT
(PERCENT)
GRAVEL(PERCENT)
DRYDENSITY
(PCF)PLASTIC
LIMIT(PERCENT)
PLASTICITYINDEX
(PERCENT)
SAND(PERCENT)
P200(PERCENT)
SIEVE ATTERBERG LIMITSSAMPLE INFORMATION
SAMPLEDEPTH(FEET)
SAMPLENUMBER
EXPLORATIONNUMBER
ELEVATION(FEET)
MOISTURECONTENT
(PERCENT)
PBS PROJECT NUMBER:73368.001
EUGENE RIVERFRONT DEVELOPMENT EUGENE, OREGON
__LA
B S
UM
MA
RY
73
368.
001_
B10
-B20
_201
9021
1.G
PJ
PB
S_D
AT
AT
MP
L_G
EO
.GD
T
P
RIN
T D
AT
E:
4/9/
19:R
PG

Appendix CField Explorations by PBS and Others

PBS: HOG FUEL BORINGS
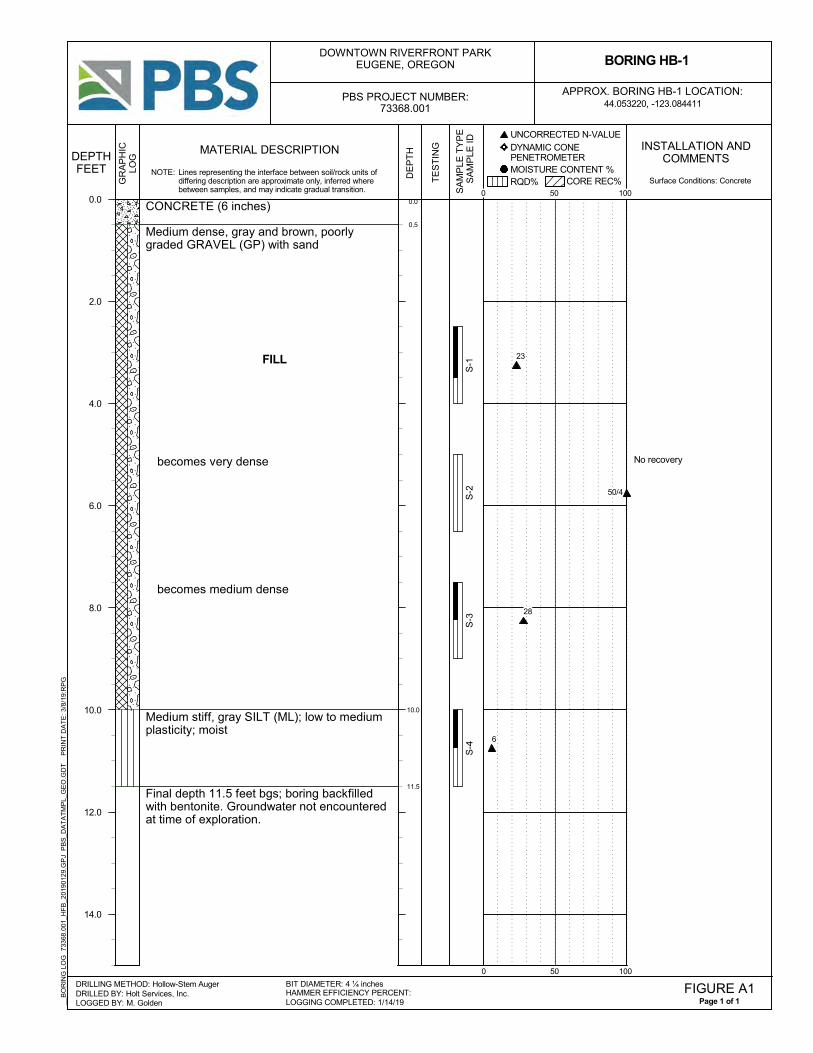
0.0
0.5
10.0
11.5
No recovery
CONCRETE (6 inches)
Medium dense, gray and brown, poorlygraded GRAVEL (GP) with sand
FILL
becomes very dense
becomes medium dense
Medium stiff, gray SILT (ML); low to mediumplasticity; moist
Final depth 11.5 feet bgs; boring backfilledwith bentonite. Groundwater not encounteredat time of exploration.
DE
PT
H INSTALLATION ANDCOMMENTS
0 50 100
CORE REC%RQD% MOISTURE CONTENT %
DYNAMIC CONE PENETROMETER
UNCORRECTED N-VALUE
__B
OR
ING
LO
G
7336
8.00
1_H
FB
_201
9012
9.G
PJ
PB
S_D
AT
AT
MP
L_G
EO
.GD
T
P
RIN
T D
AT
E:
3/8/
19:R
PG
GR
AP
HIC
LOG
DRILLED BY: Holt Services, Inc.LOGGED BY: M. Golden
DRILLING METHOD: Hollow-Stem Auger
MATERIAL DESCRIPTION
SA
MP
LE T
YP
E
SA
MP
LE ID
BORING HB-1
TE
ST
ING
DEPTHFEET
44.053220, -123.084411APPROX. BORING HB-1 LOCATION:
Page 1 of 1FIGURE A1
LOGGING COMPLETED: 1/14/19HAMMER EFFICIENCY PERCENT:BIT DIAMETER: 4 ¼ inches
DOWNTOWN RIVERFRONT PARKEUGENE, OREGON
PBS PROJECT NUMBER:73368.001
NOTE: Lines representing the interface between soil/rock units ofdiffering description are approximate only, inferred wherebetween samples, and may indicate gradual transition.
Surface Conditions: Concrete
50/4
S-1
S-2
S-3
S-4
0.0
2.0
4.0
6.0
8.0
10.0
12.0
14.0
0 50 100
23
28
6
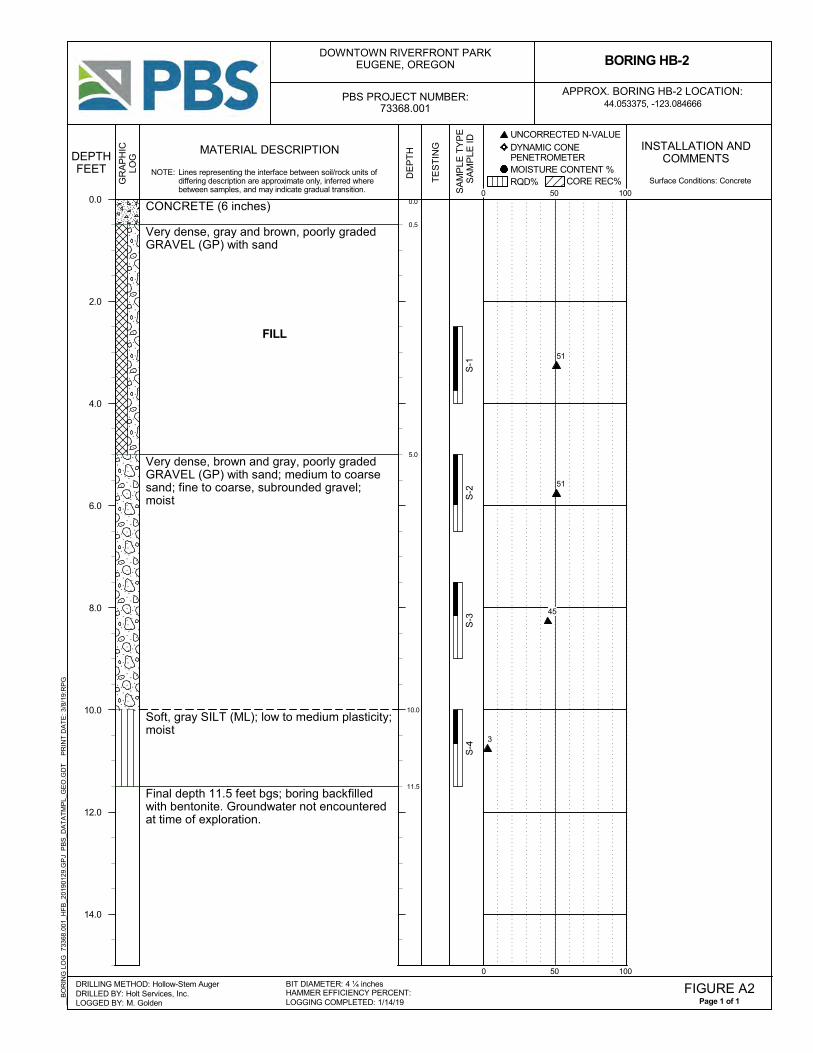
0.0
0.5
5.0
10.0
11.5
CONCRETE (6 inches)
Very dense, gray and brown, poorly gradedGRAVEL (GP) with sand
FILL
Very dense, brown and gray, poorly gradedGRAVEL (GP) with sand; medium to coarsesand; fine to coarse, subrounded gravel;moist
Soft, gray SILT (ML); low to medium plasticity;moist
Final depth 11.5 feet bgs; boring backfilledwith bentonite. Groundwater not encounteredat time of exploration.
DE
PT
H INSTALLATION ANDCOMMENTS
0 50 100
CORE REC%RQD% MOISTURE CONTENT %
DYNAMIC CONE PENETROMETER
UNCORRECTED N-VALUE
__B
OR
ING
LO
G
7336
8.00
1_H
FB
_201
9012
9.G
PJ
PB
S_D
AT
AT
MP
L_G
EO
.GD
T
P
RIN
T D
AT
E:
3/8/
19:R
PG
GR
AP
HIC
LOG
DRILLED BY: Holt Services, Inc.LOGGED BY: M. Golden
DRILLING METHOD: Hollow-Stem Auger
MATERIAL DESCRIPTION
SA
MP
LE T
YP
E
SA
MP
LE ID
BORING HB-2
TE
ST
ING
DEPTHFEET
44.053375, -123.084666APPROX. BORING HB-2 LOCATION:
Page 1 of 1FIGURE A2
LOGGING COMPLETED: 1/14/19HAMMER EFFICIENCY PERCENT:BIT DIAMETER: 4 ¼ inches
DOWNTOWN RIVERFRONT PARKEUGENE, OREGON
PBS PROJECT NUMBER:73368.001
NOTE: Lines representing the interface between soil/rock units ofdiffering description are approximate only, inferred wherebetween samples, and may indicate gradual transition.
Surface Conditions: Concrete
S-1
S-2
S-3
S-4
0.0
2.0
4.0
6.0
8.0
10.0
12.0
14.0
0 50 100
51
51
45
3
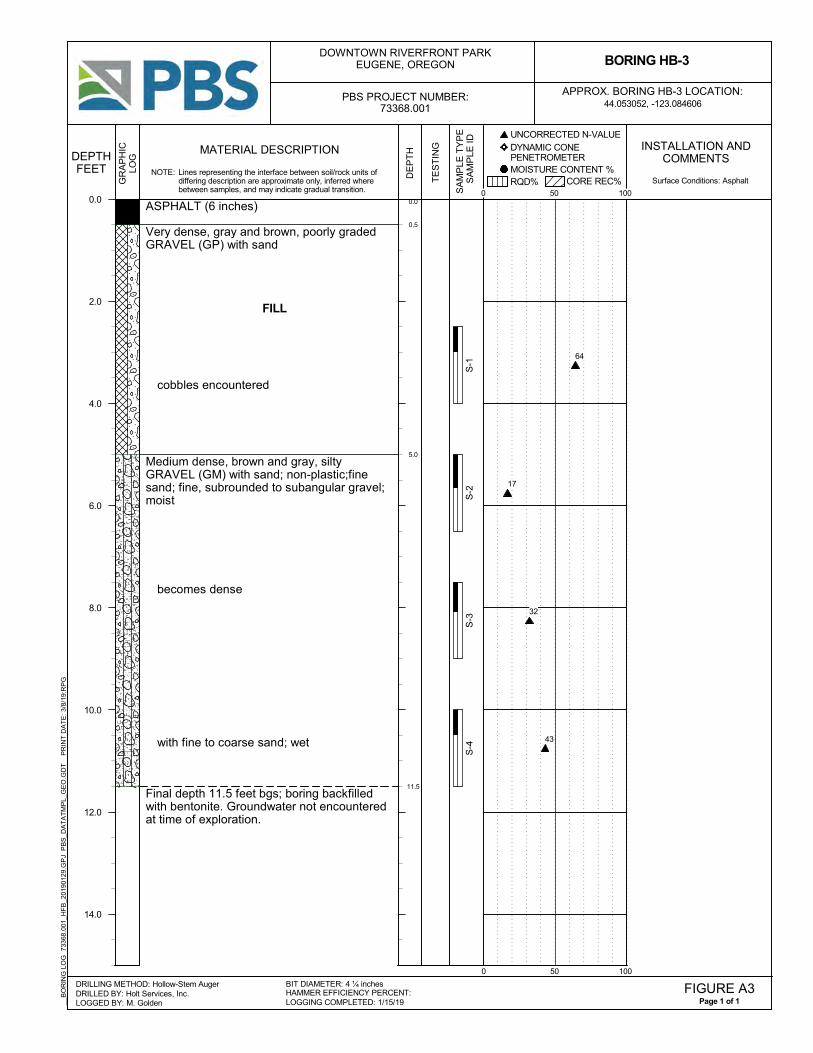
0.0
0.5
5.0
11.5
ASPHALT (6 inches)
Very dense, gray and brown, poorly gradedGRAVEL (GP) with sand
FILL
cobbles encountered
Medium dense, brown and gray, siltyGRAVEL (GM) with sand; non-plastic;finesand; fine, subrounded to subangular gravel;moist
becomes dense
with fine to coarse sand; wet
Final depth 11.5 feet bgs; boring backfilledwith bentonite. Groundwater not encounteredat time of exploration.
DE
PT
H INSTALLATION ANDCOMMENTS
0 50 100
CORE REC%RQD% MOISTURE CONTENT %
DYNAMIC CONE PENETROMETER
UNCORRECTED N-VALUE
__B
OR
ING
LO
G
7336
8.00
1_H
FB
_201
9012
9.G
PJ
PB
S_D
AT
AT
MP
L_G
EO
.GD
T
P
RIN
T D
AT
E:
3/8/
19:R
PG
GR
AP
HIC
LOG
DRILLED BY: Holt Services, Inc.LOGGED BY: M. Golden
DRILLING METHOD: Hollow-Stem Auger
MATERIAL DESCRIPTION
SA
MP
LE T
YP
E
SA
MP
LE ID
BORING HB-3
TE
ST
ING
DEPTHFEET
44.053052, -123.084606APPROX. BORING HB-3 LOCATION:
Page 1 of 1FIGURE A3
LOGGING COMPLETED: 1/15/19HAMMER EFFICIENCY PERCENT:BIT DIAMETER: 4 ¼ inches
DOWNTOWN RIVERFRONT PARKEUGENE, OREGON
PBS PROJECT NUMBER:73368.001
NOTE: Lines representing the interface between soil/rock units ofdiffering description are approximate only, inferred wherebetween samples, and may indicate gradual transition.
Surface Conditions: Asphalt
S-1
S-2
S-3
S-4
0.0
2.0
4.0
6.0
8.0
10.0
12.0
14.0
0 50 100
64
17
32
43
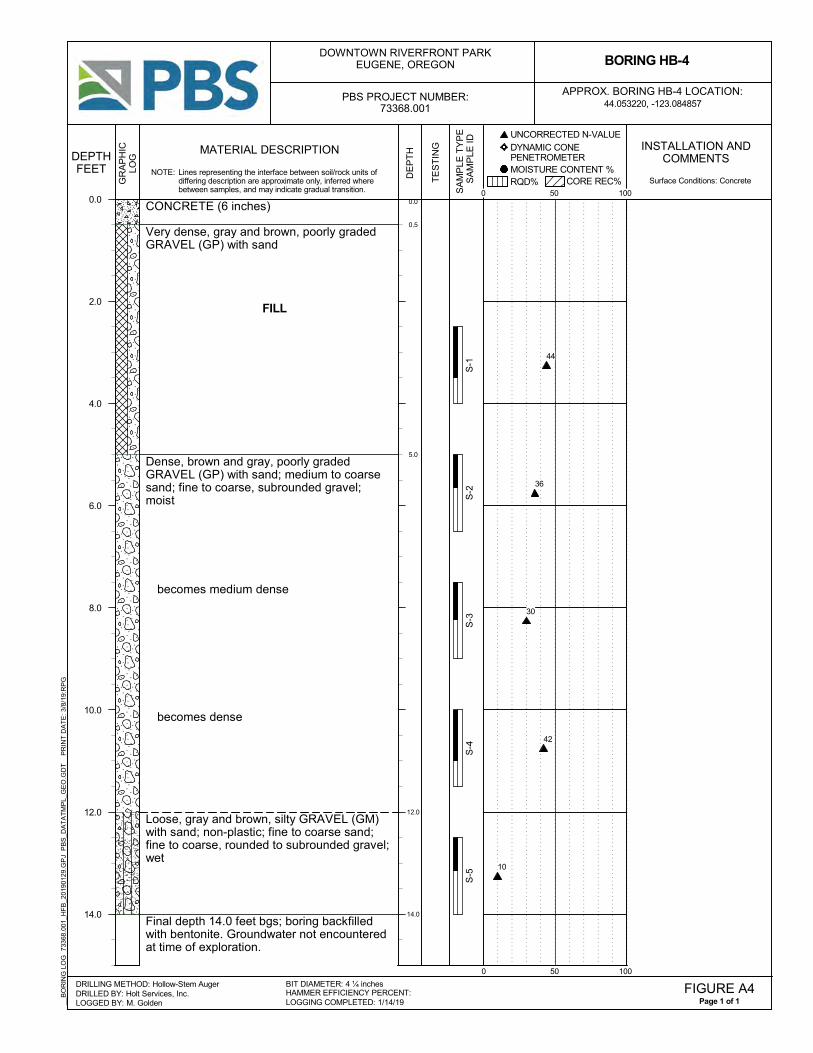
0.0
0.5
5.0
12.0
14.0
CONCRETE (6 inches)
Very dense, gray and brown, poorly gradedGRAVEL (GP) with sand
FILL
Dense, brown and gray, poorly gradedGRAVEL (GP) with sand; medium to coarsesand; fine to coarse, subrounded gravel;moist
becomes medium dense
becomes dense
Loose, gray and brown, silty GRAVEL (GM)with sand; non-plastic; fine to coarse sand;fine to coarse, rounded to subrounded gravel;wet
Final depth 14.0 feet bgs; boring backfilledwith bentonite. Groundwater not encounteredat time of exploration.
DE
PT
H INSTALLATION ANDCOMMENTS
0 50 100
CORE REC%RQD% MOISTURE CONTENT %
DYNAMIC CONE PENETROMETER
UNCORRECTED N-VALUE
__B
OR
ING
LO
G
7336
8.00
1_H
FB
_201
9012
9.G
PJ
PB
S_D
AT
AT
MP
L_G
EO
.GD
T
P
RIN
T D
AT
E:
3/8/
19:R
PG
GR
AP
HIC
LOG
DRILLED BY: Holt Services, Inc.LOGGED BY: M. Golden
DRILLING METHOD: Hollow-Stem Auger
MATERIAL DESCRIPTION
SA
MP
LE T
YP
E
SA
MP
LE ID
BORING HB-4
TE
ST
ING
DEPTHFEET
44.053220, -123.084857APPROX. BORING HB-4 LOCATION:
Page 1 of 1FIGURE A4
LOGGING COMPLETED: 1/14/19HAMMER EFFICIENCY PERCENT:BIT DIAMETER: 4 ¼ inches
DOWNTOWN RIVERFRONT PARKEUGENE, OREGON
PBS PROJECT NUMBER:73368.001
NOTE: Lines representing the interface between soil/rock units ofdiffering description are approximate only, inferred wherebetween samples, and may indicate gradual transition.
Surface Conditions: Concrete
S-1
S-2
S-3
S-4
S-5
0.0
2.0
4.0
6.0
8.0
10.0
12.0
14.0
0 50 100
44
36
30
42
10
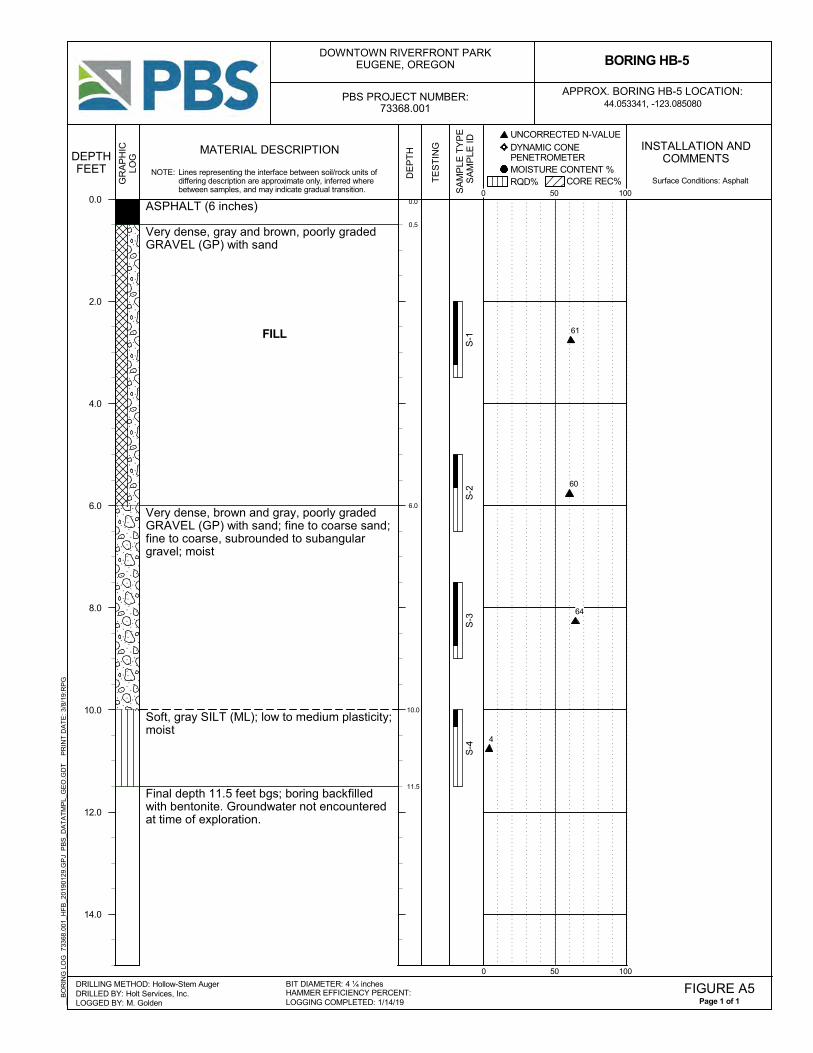
0.0
0.5
6.0
10.0
11.5
ASPHALT (6 inches)
Very dense, gray and brown, poorly gradedGRAVEL (GP) with sand
FILL
Very dense, brown and gray, poorly gradedGRAVEL (GP) with sand; fine to coarse sand;fine to coarse, subrounded to subangulargravel; moist
Soft, gray SILT (ML); low to medium plasticity;moist
Final depth 11.5 feet bgs; boring backfilledwith bentonite. Groundwater not encounteredat time of exploration.
DE
PT
H INSTALLATION ANDCOMMENTS
0 50 100
CORE REC%RQD% MOISTURE CONTENT %
DYNAMIC CONE PENETROMETER
UNCORRECTED N-VALUE
__B
OR
ING
LO
G
7336
8.00
1_H
FB
_201
9012
9.G
PJ
PB
S_D
AT
AT
MP
L_G
EO
.GD
T
P
RIN
T D
AT
E:
3/8/
19:R
PG
GR
AP
HIC
LOG
DRILLED BY: Holt Services, Inc.LOGGED BY: M. Golden
DRILLING METHOD: Hollow-Stem Auger
MATERIAL DESCRIPTION
SA
MP
LE T
YP
E
SA
MP
LE ID
BORING HB-5
TE
ST
ING
DEPTHFEET
44.053341, -123.085080APPROX. BORING HB-5 LOCATION:
Page 1 of 1FIGURE A5
LOGGING COMPLETED: 1/14/19HAMMER EFFICIENCY PERCENT:BIT DIAMETER: 4 ¼ inches
DOWNTOWN RIVERFRONT PARKEUGENE, OREGON
PBS PROJECT NUMBER:73368.001
NOTE: Lines representing the interface between soil/rock units ofdiffering description are approximate only, inferred wherebetween samples, and may indicate gradual transition.
Surface Conditions: Asphalt
S-1
S-2
S-3
S-4
0.0
2.0
4.0
6.0
8.0
10.0
12.0
14.0
0 50 100
61
60
64
4
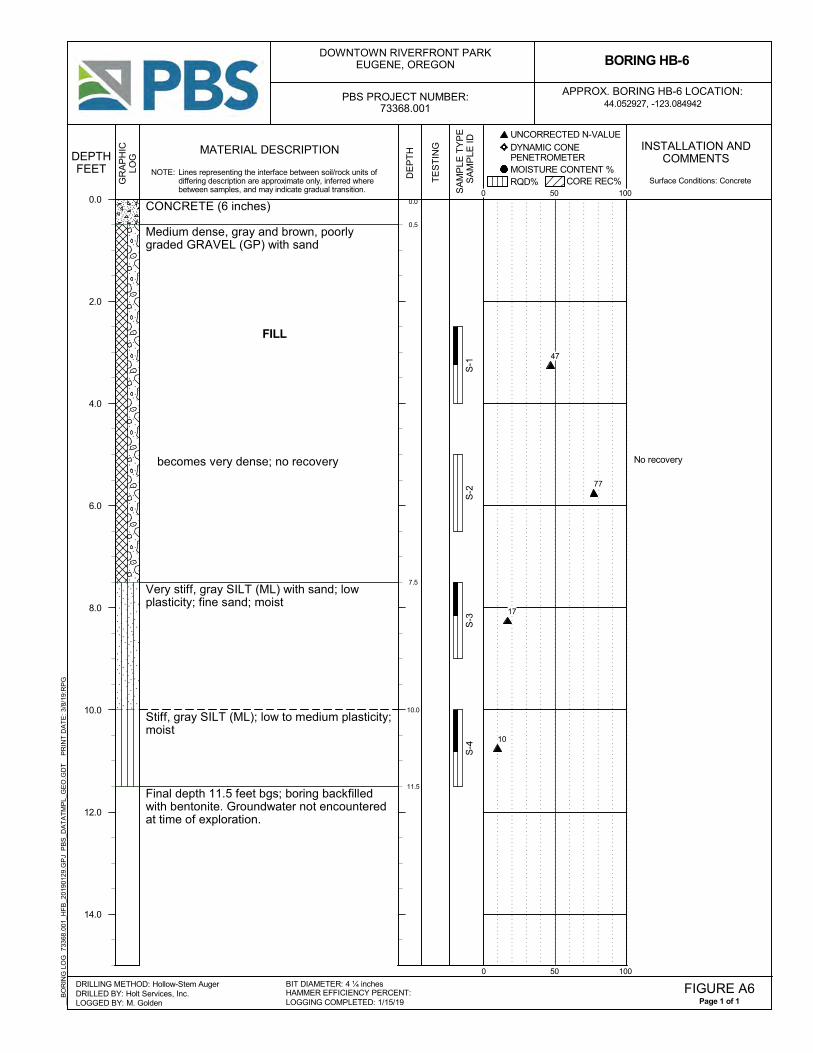
0.0
0.5
7.5
10.0
11.5
No recovery
CONCRETE (6 inches)
Medium dense, gray and brown, poorlygraded GRAVEL (GP) with sand
FILL
becomes very dense; no recovery
Very stiff, gray SILT (ML) with sand; lowplasticity; fine sand; moist
Stiff, gray SILT (ML); low to medium plasticity;moist
Final depth 11.5 feet bgs; boring backfilledwith bentonite. Groundwater not encounteredat time of exploration.
DE
PT
H INSTALLATION ANDCOMMENTS
0 50 100
CORE REC%RQD% MOISTURE CONTENT %
DYNAMIC CONE PENETROMETER
UNCORRECTED N-VALUE
__B
OR
ING
LO
G
7336
8.00
1_H
FB
_201
9012
9.G
PJ
PB
S_D
AT
AT
MP
L_G
EO
.GD
T
P
RIN
T D
AT
E:
3/8/
19:R
PG
GR
AP
HIC
LOG
DRILLED BY: Holt Services, Inc.LOGGED BY: M. Golden
DRILLING METHOD: Hollow-Stem Auger
MATERIAL DESCRIPTION
SA
MP
LE T
YP
E
SA
MP
LE ID
BORING HB-6
TE
ST
ING
DEPTHFEET
44.052927, -123.084942APPROX. BORING HB-6 LOCATION:
Page 1 of 1FIGURE A6
LOGGING COMPLETED: 1/15/19HAMMER EFFICIENCY PERCENT:BIT DIAMETER: 4 ¼ inches
DOWNTOWN RIVERFRONT PARKEUGENE, OREGON
PBS PROJECT NUMBER:73368.001
NOTE: Lines representing the interface between soil/rock units ofdiffering description are approximate only, inferred wherebetween samples, and may indicate gradual transition.
Surface Conditions: Concrete
S-1
S-2
S-3
S-4
0.0
2.0
4.0
6.0
8.0
10.0
12.0
14.0
0 50 100
47
77
17
10
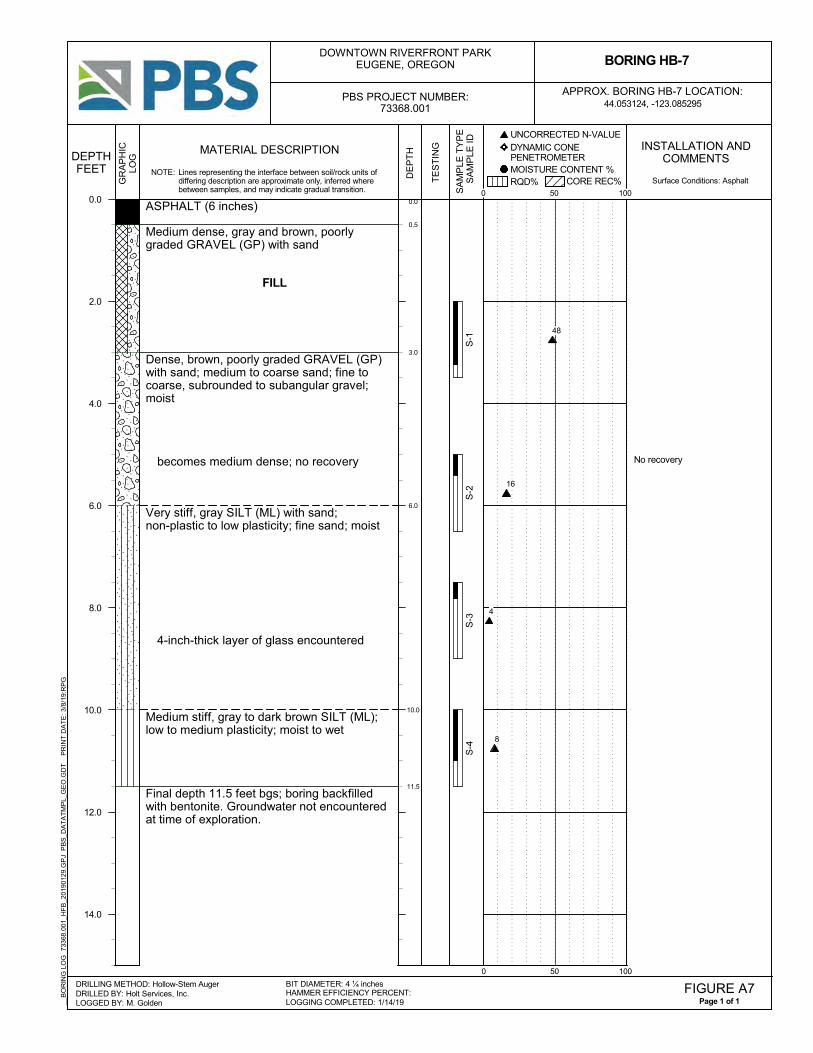
0.0
0.5
3.0
6.0
10.0
11.5
No recovery
ASPHALT (6 inches)
Medium dense, gray and brown, poorlygraded GRAVEL (GP) with sand
FILL
Dense, brown, poorly graded GRAVEL (GP)with sand; medium to coarse sand; fine tocoarse, subrounded to subangular gravel;moist
becomes medium dense; no recovery
Very stiff, gray SILT (ML) with sand;non-plastic to low plasticity; fine sand; moist
4-inch-thick layer of glass encountered
Medium stiff, gray to dark brown SILT (ML);low to medium plasticity; moist to wet
Final depth 11.5 feet bgs; boring backfilledwith bentonite. Groundwater not encounteredat time of exploration.
DE
PT
H INSTALLATION ANDCOMMENTS
0 50 100
CORE REC%RQD% MOISTURE CONTENT %
DYNAMIC CONE PENETROMETER
UNCORRECTED N-VALUE
__B
OR
ING
LO
G
7336
8.00
1_H
FB
_201
9012
9.G
PJ
PB
S_D
AT
AT
MP
L_G
EO
.GD
T
P
RIN
T D
AT
E:
3/8/
19:R
PG
GR
AP
HIC
LOG
DRILLED BY: Holt Services, Inc.LOGGED BY: M. Golden
DRILLING METHOD: Hollow-Stem Auger
MATERIAL DESCRIPTION
SA
MP
LE T
YP
E
SA
MP
LE ID
BORING HB-7
TE
ST
ING
DEPTHFEET
44.053124, -123.085295APPROX. BORING HB-7 LOCATION:
Page 1 of 1FIGURE A7
LOGGING COMPLETED: 1/14/19HAMMER EFFICIENCY PERCENT:BIT DIAMETER: 4 ¼ inches
DOWNTOWN RIVERFRONT PARKEUGENE, OREGON
PBS PROJECT NUMBER:73368.001
NOTE: Lines representing the interface between soil/rock units ofdiffering description are approximate only, inferred wherebetween samples, and may indicate gradual transition.
Surface Conditions: Asphalt
S-1
S-2
S-3
S-4
0.0
2.0
4.0
6.0
8.0
10.0
12.0
14.0
0 50 100
48
16
4
8
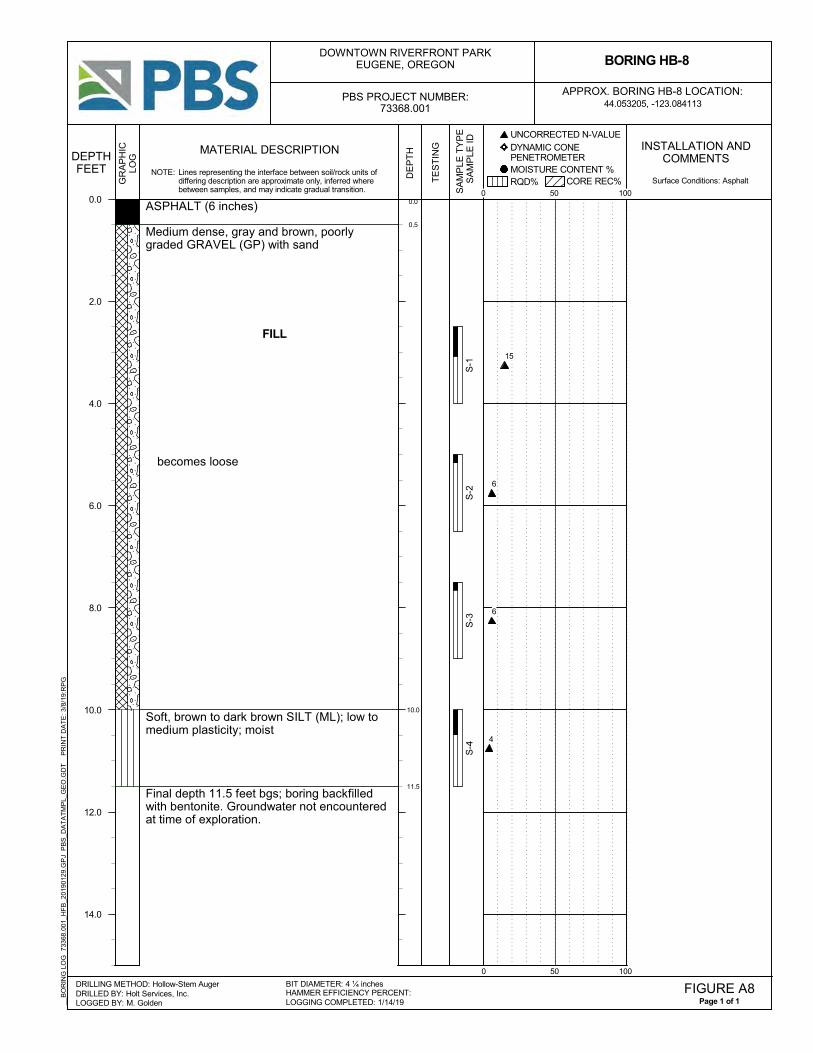
0.0
0.5
10.0
11.5
ASPHALT (6 inches)
Medium dense, gray and brown, poorlygraded GRAVEL (GP) with sand
FILL
becomes loose
Soft, brown to dark brown SILT (ML); low tomedium plasticity; moist
Final depth 11.5 feet bgs; boring backfilledwith bentonite. Groundwater not encounteredat time of exploration.
DE
PT
H INSTALLATION ANDCOMMENTS
0 50 100
CORE REC%RQD% MOISTURE CONTENT %
DYNAMIC CONE PENETROMETER
UNCORRECTED N-VALUE
__B
OR
ING
LO
G
7336
8.00
1_H
FB
_201
9012
9.G
PJ
PB
S_D
AT
AT
MP
L_G
EO
.GD
T
P
RIN
T D
AT
E:
3/8/
19:R
PG
GR
AP
HIC
LOG
DRILLED BY: Holt Services, Inc.LOGGED BY: M. Golden
DRILLING METHOD: Hollow-Stem Auger
MATERIAL DESCRIPTION
SA
MP
LE T
YP
E
SA
MP
LE ID
BORING HB-8
TE
ST
ING
DEPTHFEET
44.053205, -123.084113APPROX. BORING HB-8 LOCATION:
Page 1 of 1FIGURE A8
LOGGING COMPLETED: 1/14/19HAMMER EFFICIENCY PERCENT:BIT DIAMETER: 4 ¼ inches
DOWNTOWN RIVERFRONT PARKEUGENE, OREGON
PBS PROJECT NUMBER:73368.001
NOTE: Lines representing the interface between soil/rock units ofdiffering description are approximate only, inferred wherebetween samples, and may indicate gradual transition.
Surface Conditions: Asphalt
S-1
S-2
S-3
S-4
0.0
2.0
4.0
6.0
8.0
10.0
12.0
14.0
0 50 100
15
6
6
4

PBS: EUGENE RIVERFRONT PARK BORINGS
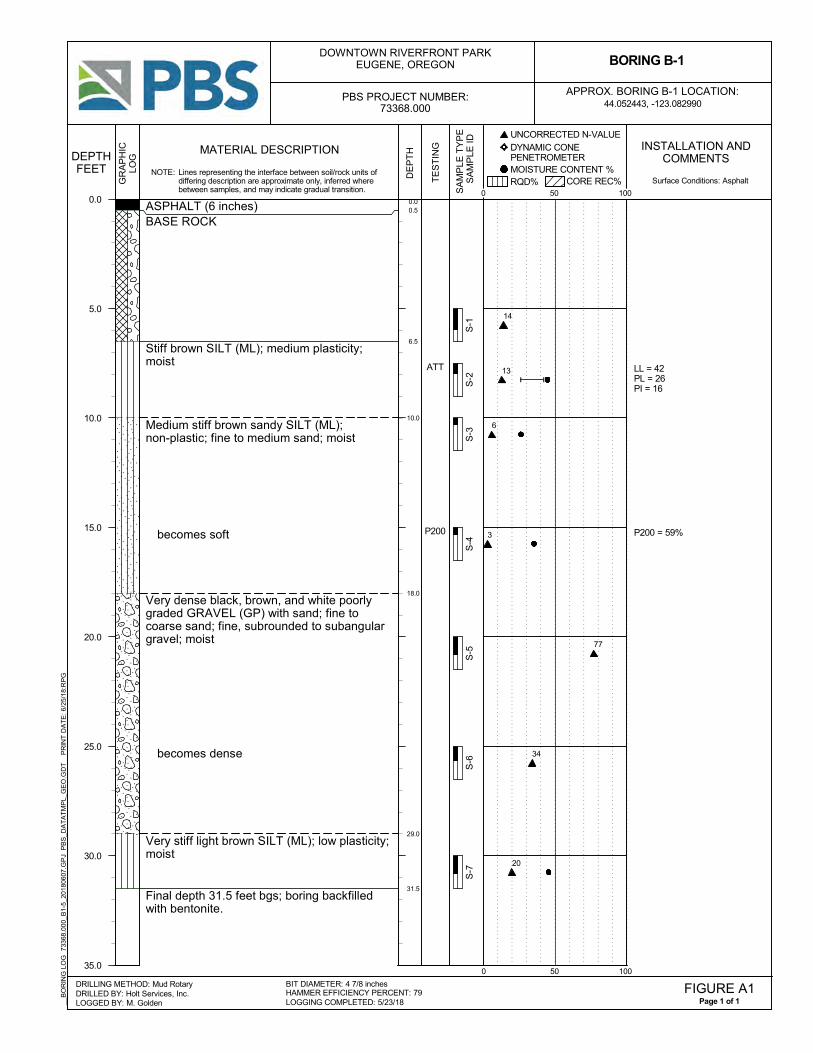
0.00.5
6.5
10.0
18.0
29.0
31.5
LL = 42PL = 26PI = 16
P200 = 59%
ASPHALT (6 inches)BASE ROCK
Stiff brown SILT (ML); medium plasticity;moist
Medium stiff brown sandy SILT (ML);non-plastic; fine to medium sand; moist
becomes soft
Very dense black, brown, and white poorlygraded GRAVEL (GP) with sand; fine tocoarse sand; fine, subrounded to subangulargravel; moist
becomes dense
Very stiff light brown SILT (ML); low plasticity;moist
Final depth 31.5 feet bgs; boring backfilledwith bentonite.
ATT
P200
DE
PT
H INSTALLATION ANDCOMMENTS
0 50 100
CORE REC%RQD% MOISTURE CONTENT %
DYNAMIC CONE PENETROMETER
UNCORRECTED N-VALUE
__B
OR
ING
LO
G
7336
8.00
0_B
1-5_
2018
0607
.GP
J P
BS
_DA
TA
TM
PL_
GE
O.G
DT
PR
INT
DA
TE
: 6/
25/1
8:R
PG
GR
AP
HIC
LOG
DRILLED BY: Holt Services, Inc.LOGGED BY: M. Golden
DRILLING METHOD: Mud Rotary
MATERIAL DESCRIPTION
SA
MP
LE T
YP
E
SA
MP
LE ID
BORING B-1
TE
ST
ING
DEPTHFEET
44.052443, -123.082990APPROX. BORING B-1 LOCATION:
Page 1 of 1FIGURE A1
LOGGING COMPLETED: 5/23/18HAMMER EFFICIENCY PERCENT: 79BIT DIAMETER: 4 7/8 inches
DOWNTOWN RIVERFRONT PARKEUGENE, OREGON
PBS PROJECT NUMBER:73368.000
NOTE: Lines representing the interface between soil/rock units ofdiffering description are approximate only, inferred wherebetween samples, and may indicate gradual transition.
Surface Conditions: Asphalt
S-1
S-2
S-3
S-4
S-5
S-6
S-7
0.0
5.0
10.0
15.0
20.0
25.0
30.0
35.0
0 50 100
14
13
6
3
77
34
20

0.00.5
3.5
10.0
19.0
28.0
31.5
Possible groundwaterencountered at 7.9 feet bgs(observed 5/24/2018)
Switched to 3-inch sampler forbetter recovery
ASPHALT (6 inches)BASE ROCK
Soft brown SILT (ML); medium plasticity;moist
becomes stiff
Medium stiff brown lean CLAY (CL) withgravel; medium plasticity; fine, rounded tosubrounded gravel; moist
Very dense gray, black, brown, and whitepoorly graded GRAVEL (GP) with sand; fineto coarse sand; fine to coarse, rounded tosubrounded gravel; moist
Very stiff green-gray SILT (ML) with sand;non-plastic; fine to medium sand; moist
Final depth 31.5 feet bgs; boring backfilledwith bentonite.
DE
PT
H INSTALLATION ANDCOMMENTS
0 50 100
CORE REC%RQD% MOISTURE CONTENT %
DYNAMIC CONE PENETROMETER
UNCORRECTED N-VALUE
__B
OR
ING
LO
G
7336
8.00
0_B
1-5_
2018
0607
.GP
J P
BS
_DA
TA
TM
PL_
GE
O.G
DT
PR
INT
DA
TE
: 6/
25/1
8:R
PG
GR
AP
HIC
LOG
DRILLED BY: Holt Services, Inc.LOGGED BY: M. Golden
DRILLING METHOD: Mud Rotary
MATERIAL DESCRIPTION
SA
MP
LE T
YP
E
SA
MP
LE ID
BORING B-2
TE
ST
ING
DEPTHFEET
44.052847, -123.083430APPROX. BORING B-2 LOCATION:
Page 1 of 1FIGURE A2
LOGGING COMPLETED: 5/23/18HAMMER EFFICIENCY PERCENT: 79BIT DIAMETER: 4 7/8 inches
DOWNTOWN RIVERFRONT PARKEUGENE, OREGON
PBS PROJECT NUMBER:73368.000
NOTE: Lines representing the interface between soil/rock units ofdiffering description are approximate only, inferred wherebetween samples, and may indicate gradual transition.
Surface Conditions: Asphalt
S-1
S-2
S-3
S-4
S-5
S-6
0.0
5.0
10.0
15.0
20.0
25.0
30.0
35.0
0 50 100
4
13
8
20
94
21

0.00.5
3.5
7.5
18.0
25.0
30.0
P200 = 41%
Driller notes lost all drillingmud at 14.5 feet bgs
Driller notes lost 40 gallons ofdrilling mud at 22.5 feet and at24.5 feet bgs
ASPHALT (6 inches)BASE ROCK
Very stiff dark brown lean CLAY (CL) withsand; medium plasticity; fine to medium sand;moist
Loose dark brown silty SAND (SM); lowplasticity; fine to medium sand; moist
becomes dense; non-plastic; wet
Very dense dark gray-black poorly gradedGRAVEL (GP) with sand; medium to coarsesand; fine to coarse, subangular to angulargravel; possible cobbles; moist to wet
Medium dense black, gray, and red-brownpoorly graded GRAVEL (GP); fine to coarse,subangular to angular gravel; possiblecobbles; moist to wet
Final depth 30.0 feet bgs due to caving;boring backfilled with bentonite
P200D
EP
TH INSTALLATION AND
COMMENTS
0 50 100
CORE REC%RQD% MOISTURE CONTENT %
DYNAMIC CONE PENETROMETER
UNCORRECTED N-VALUE
__B
OR
ING
LO
G
7336
8.00
0_B
1-5_
2018
0607
.GP
J P
BS
_DA
TA
TM
PL_
GE
O.G
DT
PR
INT
DA
TE
: 6/
25/1
8:R
PG
GR
AP
HIC
LOG
DRILLED BY: Holt Services, Inc.LOGGED BY: M. Golden
DRILLING METHOD: Mud Rotary
MATERIAL DESCRIPTION
SA
MP
LE T
YP
E
SA
MP
LE ID
BORING B-3
TE
ST
ING
DEPTHFEET
44.053667, -123.083922APPROX. BORING B-3 LOCATION:
Page 1 of 1FIGURE A3
LOGGING COMPLETED: 5/24/18HAMMER EFFICIENCY PERCENT: 79BIT DIAMETER: 4 7/8 inches
DOWNTOWN RIVERFRONT PARKEUGENE, OREGON
PBS PROJECT NUMBER:73368.000
NOTE: Lines representing the interface between soil/rock units ofdiffering description are approximate only, inferred wherebetween samples, and may indicate gradual transition.
Surface Conditions: Asphalt
S-1
S-2
S-3
S-4
S-5
S-6
0.0
5.0
10.0
15.0
20.0
25.0
30.0
35.0
0 50 100
18
7
6
33
56
21
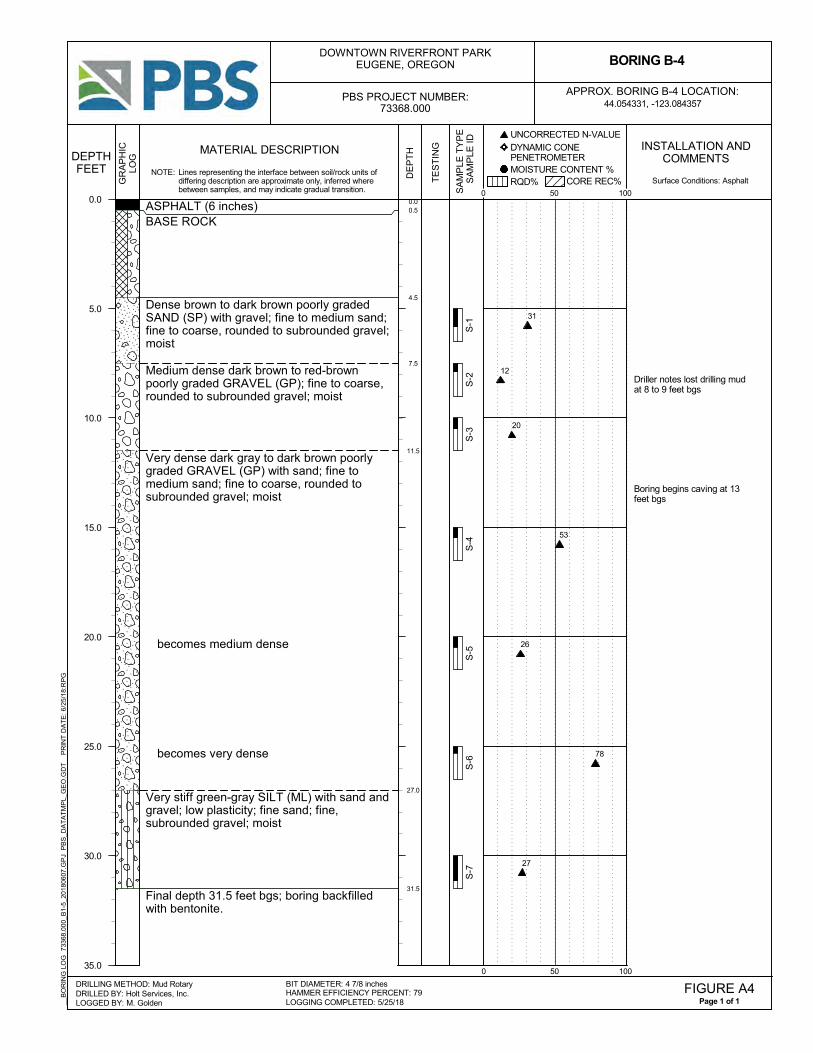
0.00.5
4.5
7.5
11.5
27.0
31.5
Driller notes lost drilling mudat 8 to 9 feet bgs
Boring begins caving at 13feet bgs
ASPHALT (6 inches)BASE ROCK
Dense brown to dark brown poorly gradedSAND (SP) with gravel; fine to medium sand;fine to coarse, rounded to subrounded gravel;moist
Medium dense dark brown to red-brownpoorly graded GRAVEL (GP); fine to coarse,rounded to subrounded gravel; moist
Very dense dark gray to dark brown poorlygraded GRAVEL (GP) with sand; fine tomedium sand; fine to coarse, rounded tosubrounded gravel; moist
becomes medium dense
becomes very dense
Very stiff green-gray SILT (ML) with sand andgravel; low plasticity; fine sand; fine,subrounded gravel; moist
Final depth 31.5 feet bgs; boring backfilledwith bentonite.
DE
PT
H INSTALLATION ANDCOMMENTS
0 50 100
CORE REC%RQD% MOISTURE CONTENT %
DYNAMIC CONE PENETROMETER
UNCORRECTED N-VALUE
__B
OR
ING
LO
G
7336
8.00
0_B
1-5_
2018
0607
.GP
J P
BS
_DA
TA
TM
PL_
GE
O.G
DT
PR
INT
DA
TE
: 6/
25/1
8:R
PG
GR
AP
HIC
LOG
DRILLED BY: Holt Services, Inc.LOGGED BY: M. Golden
DRILLING METHOD: Mud Rotary
MATERIAL DESCRIPTION
SA
MP
LE T
YP
E
SA
MP
LE ID
BORING B-4
TE
ST
ING
DEPTHFEET
44.054331, -123.084357APPROX. BORING B-4 LOCATION:
Page 1 of 1FIGURE A4
LOGGING COMPLETED: 5/25/18HAMMER EFFICIENCY PERCENT: 79BIT DIAMETER: 4 7/8 inches
DOWNTOWN RIVERFRONT PARKEUGENE, OREGON
PBS PROJECT NUMBER:73368.000
NOTE: Lines representing the interface between soil/rock units ofdiffering description are approximate only, inferred wherebetween samples, and may indicate gradual transition.
Surface Conditions: Asphalt
S-1
S-2
S-3
S-4
S-5
S-6
S-7
0.0
5.0
10.0
15.0
20.0
25.0
30.0
35.0
0 50 100
31
12
20
53
26
78
27

0.00.5
2.5
5.0
7.5
9.0
15.0
20.0
36.5
Driller notes lost drilling mudfrom 15 feet bgs to bottom ofboring
No sample recovery
No sample recovery
No sample recovery
TOPSOIL (6 inches)BASE ROCK
Very stiff dark red-brown lean CLAY (CL);medium plasticity; moist
Medium stiff dark brown SILT (ML); mediumplasticity; moist
Very stiff dark brown SILT (ML) with sand andgravel; low plasticity; moist
dark brown-black weathered basalt at 8.5feet bgs
Medium dense light brown to dark gray poorlygraded GRAVEL (GP) with sand; medium tocoarse sand; fine to coarse, subrounded tosubangular gravel; moist
Loose light brown to dark gray poorly gradedGRAVEL (GP); fine to coarse subrounded tosubangular gravel; moist
Very dense black and gray poorly gradedGRAVEL (GP) with sand and possiblecobbles; medium to coarse sand; fine tocoarse, subangular to angular gravel; moist
Final depth 36.5 feet bgs; boring backfilledwith bentonite.
DE
PT
H INSTALLATION ANDCOMMENTS
0 50 100
CORE REC%RQD% MOISTURE CONTENT %
DYNAMIC CONE PENETROMETER
UNCORRECTED N-VALUE
__B
OR
ING
LO
G
7336
8.00
0_B
1-5_
2018
0607
.GP
J P
BS
_DA
TA
TM
PL_
GE
O.G
DT
PR
INT
DA
TE
: 6/
25/1
8:R
PG
GR
AP
HIC
LOG
DRILLED BY: Holt Services, Inc.LOGGED BY: M. Golden
DRILLING METHOD: Mud Rotary
MATERIAL DESCRIPTION
SA
MP
LE T
YP
E
SA
MP
LE ID
BORING B-5
TE
ST
ING
DEPTHFEET
44.056232, -123.084441APPROX. BORING B-5 LOCATION:
Page 1 of 1FIGURE A5
LOGGING COMPLETED: 5/25/18HAMMER EFFICIENCY PERCENT: 79BIT DIAMETER: 4 7/8 inches
DOWNTOWN RIVERFRONT PARKEUGENE, OREGON
PBS PROJECT NUMBER:73368.000
NOTE: Lines representing the interface between soil/rock units ofdiffering description are approximate only, inferred wherebetween samples, and may indicate gradual transition.
Surface Conditions: Grass
22-50/5
50/1
50/1
50/1
S-1
S-2
S-3
S-4
S-5
S-6
S-7
S-8
S-9
0.0
5.0
10.0
15.0
20.0
25.0
30.0
35.0
0 50 100
16
8
29
30
10

0.00.5
6.5
10.0
18.0
29.0
31.5
LL = 42PL = 26PI = 16
P200 = 59%
ASPHALT (6 inches)BASE ROCK
Stiff brown SILT (ML); medium plasticity;moist
Medium stiff brown sandy SILT (ML);non-plastic; fine to medium sand; moist
becomes soft
Very dense black, brown, and white poorlygraded GRAVEL (GP) with sand; fine tocoarse sand; fine, subrounded to subangulargravel; moist
becomes dense
Very stiff light brown SILT (ML); low plasticity;moist
Final depth 31.5 feet bgs; boring backfilledwith bentonite.
ATT
P200
DE
PT
H INSTALLATION ANDCOMMENTS
0 50 100
CORE REC%RQD% MOISTURE CONTENT %
DYNAMIC CONE PENETROMETER
UNCORRECTED N-VALUE
__B
OR
ING
LO
G
7336
8.00
0_B
1-B
9_20
1808
09.G
PJ
PB
S_D
AT
AT
MP
L_G
EO
.GD
T
P
RIN
T D
AT
E:
8/9/
18:R
PG
GR
AP
HIC
LOG
DRILLED BY: Holt Services, Inc.LOGGED BY: M. Golden
DRILLING METHOD: Mud Rotary
MATERIAL DESCRIPTION
SA
MP
LE T
YP
E
SA
MP
LE ID
BORING B-1
TE
ST
ING
DEPTHFEET
44.052443, -123.082990APPROX. BORING B-1 LOCATION:
Page 1 of 1FIGURE A1
LOGGING COMPLETED: 5/23/18HAMMER EFFICIENCY PERCENT: 79BIT DIAMETER: 4 7/8 inches
DOWNTOWN RIVERFRONT PARKEUGENE, OREGON
PBS PROJECT NUMBER:73368.000
NOTE: Lines representing the interface between soil/rock units ofdiffering description are approximate only, inferred wherebetween samples, and may indicate gradual transition.
Surface Conditions: Asphalt
S-1
S-2
S-3
S-4
S-5
S-6
S-7
0.0
5.0
10.0
15.0
20.0
25.0
30.0
35.0
0 50 100
14
13
6
3
77
34
20
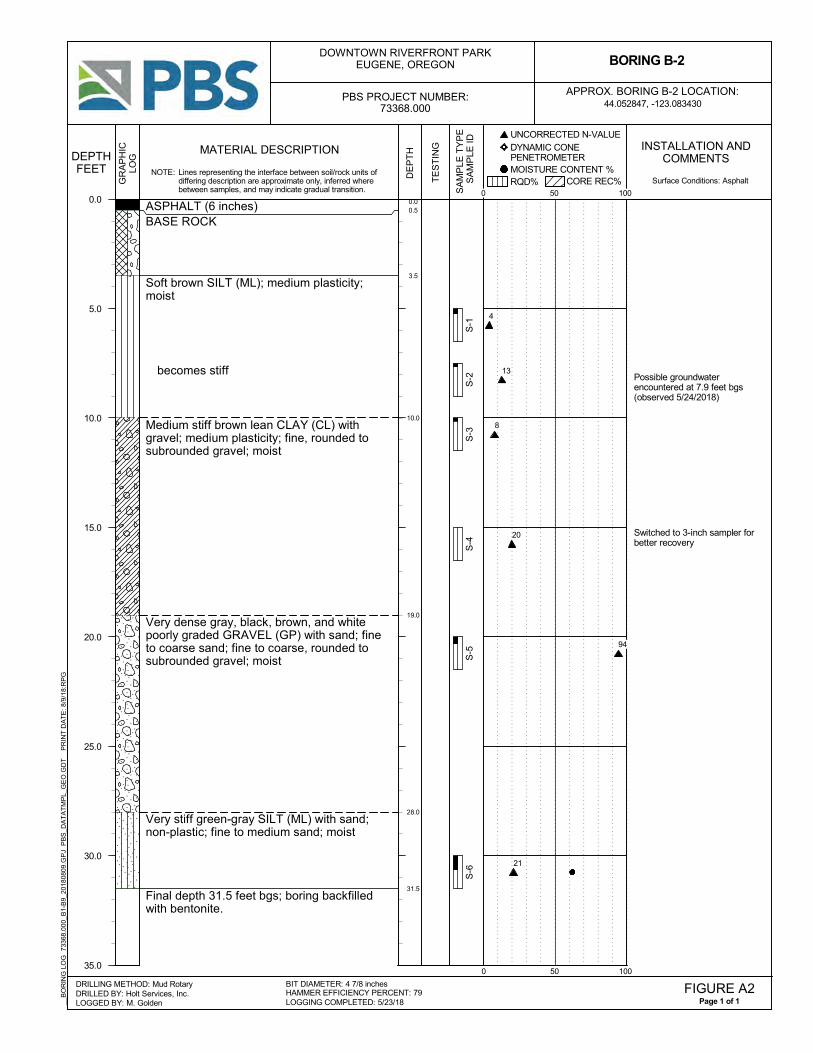
0.00.5
3.5
10.0
19.0
28.0
31.5
Possible groundwaterencountered at 7.9 feet bgs(observed 5/24/2018)
Switched to 3-inch sampler forbetter recovery
ASPHALT (6 inches)BASE ROCK
Soft brown SILT (ML); medium plasticity;moist
becomes stiff
Medium stiff brown lean CLAY (CL) withgravel; medium plasticity; fine, rounded tosubrounded gravel; moist
Very dense gray, black, brown, and whitepoorly graded GRAVEL (GP) with sand; fineto coarse sand; fine to coarse, rounded tosubrounded gravel; moist
Very stiff green-gray SILT (ML) with sand;non-plastic; fine to medium sand; moist
Final depth 31.5 feet bgs; boring backfilledwith bentonite.
DE
PT
H INSTALLATION ANDCOMMENTS
0 50 100
CORE REC%RQD% MOISTURE CONTENT %
DYNAMIC CONE PENETROMETER
UNCORRECTED N-VALUE
__B
OR
ING
LO
G
7336
8.00
0_B
1-B
9_20
1808
09.G
PJ
PB
S_D
AT
AT
MP
L_G
EO
.GD
T
P
RIN
T D
AT
E:
8/9/
18:R
PG
GR
AP
HIC
LOG
DRILLED BY: Holt Services, Inc.LOGGED BY: M. Golden
DRILLING METHOD: Mud Rotary
MATERIAL DESCRIPTION
SA
MP
LE T
YP
E
SA
MP
LE ID
BORING B-2
TE
ST
ING
DEPTHFEET
44.052847, -123.083430APPROX. BORING B-2 LOCATION:
Page 1 of 1FIGURE A2
LOGGING COMPLETED: 5/23/18HAMMER EFFICIENCY PERCENT: 79BIT DIAMETER: 4 7/8 inches
DOWNTOWN RIVERFRONT PARKEUGENE, OREGON
PBS PROJECT NUMBER:73368.000
NOTE: Lines representing the interface between soil/rock units ofdiffering description are approximate only, inferred wherebetween samples, and may indicate gradual transition.
Surface Conditions: Asphalt
S-1
S-2
S-3
S-4
S-5
S-6
0.0
5.0
10.0
15.0
20.0
25.0
30.0
35.0
0 50 100
4
13
8
20
94
21
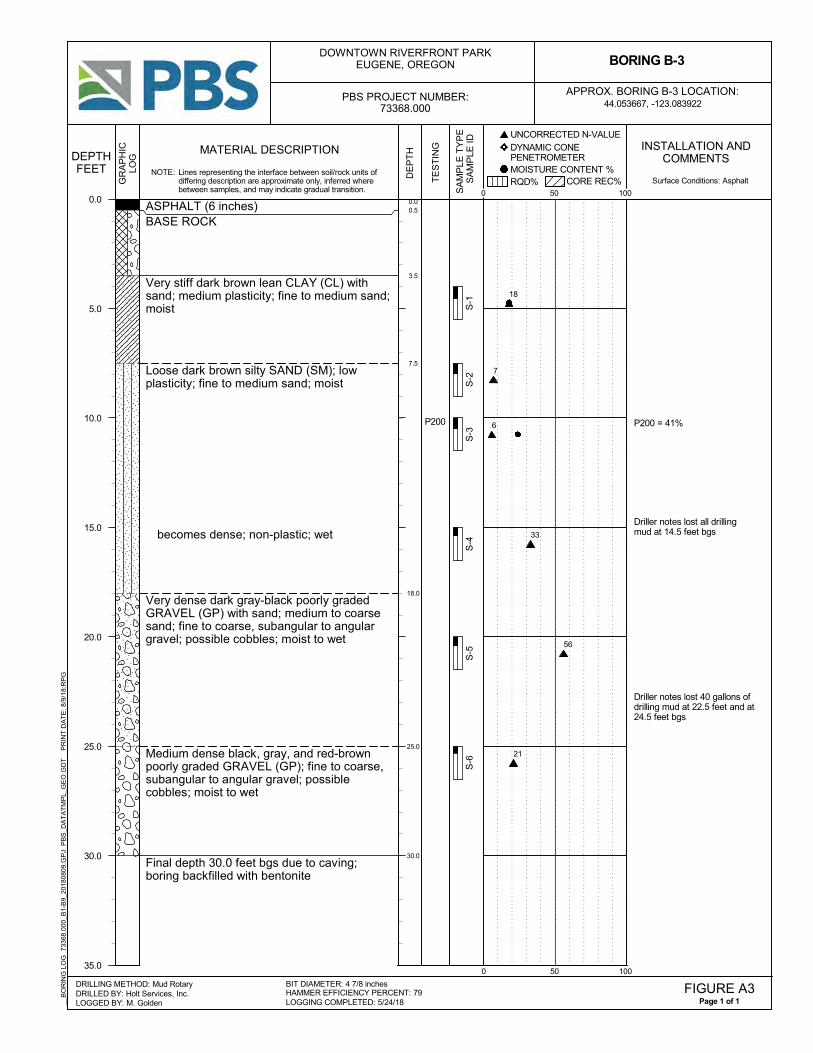
0.00.5
3.5
7.5
18.0
25.0
30.0
P200 = 41%
Driller notes lost all drillingmud at 14.5 feet bgs
Driller notes lost 40 gallons ofdrilling mud at 22.5 feet and at24.5 feet bgs
ASPHALT (6 inches)BASE ROCK
Very stiff dark brown lean CLAY (CL) withsand; medium plasticity; fine to medium sand;moist
Loose dark brown silty SAND (SM); lowplasticity; fine to medium sand; moist
becomes dense; non-plastic; wet
Very dense dark gray-black poorly gradedGRAVEL (GP) with sand; medium to coarsesand; fine to coarse, subangular to angulargravel; possible cobbles; moist to wet
Medium dense black, gray, and red-brownpoorly graded GRAVEL (GP); fine to coarse,subangular to angular gravel; possiblecobbles; moist to wet
Final depth 30.0 feet bgs due to caving;boring backfilled with bentonite
P200D
EP
TH INSTALLATION AND
COMMENTS
0 50 100
CORE REC%RQD% MOISTURE CONTENT %
DYNAMIC CONE PENETROMETER
UNCORRECTED N-VALUE
__B
OR
ING
LO
G
7336
8.00
0_B
1-B
9_20
1808
09.G
PJ
PB
S_D
AT
AT
MP
L_G
EO
.GD
T
P
RIN
T D
AT
E:
8/9/
18:R
PG
GR
AP
HIC
LOG
DRILLED BY: Holt Services, Inc.LOGGED BY: M. Golden
DRILLING METHOD: Mud Rotary
MATERIAL DESCRIPTION
SA
MP
LE T
YP
E
SA
MP
LE ID
BORING B-3
TE
ST
ING
DEPTHFEET
44.053667, -123.083922APPROX. BORING B-3 LOCATION:
Page 1 of 1FIGURE A3
LOGGING COMPLETED: 5/24/18HAMMER EFFICIENCY PERCENT: 79BIT DIAMETER: 4 7/8 inches
DOWNTOWN RIVERFRONT PARKEUGENE, OREGON
PBS PROJECT NUMBER:73368.000
NOTE: Lines representing the interface between soil/rock units ofdiffering description are approximate only, inferred wherebetween samples, and may indicate gradual transition.
Surface Conditions: Asphalt
S-1
S-2
S-3
S-4
S-5
S-6
0.0
5.0
10.0
15.0
20.0
25.0
30.0
35.0
0 50 100
18
7
6
33
56
21

0.00.5
4.5
7.5
11.5
27.0
31.5
Driller notes lost drilling mudat 8 to 9 feet bgs
Boring begins caving at 13feet bgs
ASPHALT (6 inches)BASE ROCK
Dense brown to dark brown poorly gradedSAND (SP) with gravel; fine to medium sand;fine to coarse, rounded to subrounded gravel;moist
Medium dense dark brown to red-brownpoorly graded GRAVEL (GP); fine to coarse,rounded to subrounded gravel; moist
Very dense dark gray to dark brown poorlygraded GRAVEL (GP) with sand; fine tomedium sand; fine to coarse, rounded tosubrounded gravel; moist
becomes medium dense
becomes very dense
Very stiff green-gray SILT (ML) with sand andgravel; low plasticity; fine sand; fine,subrounded gravel; moist
Final depth 31.5 feet bgs; boring backfilledwith bentonite.
DE
PT
H INSTALLATION ANDCOMMENTS
0 50 100
CORE REC%RQD% MOISTURE CONTENT %
DYNAMIC CONE PENETROMETER
UNCORRECTED N-VALUE
__B
OR
ING
LO
G
7336
8.00
0_B
1-B
9_20
1808
09.G
PJ
PB
S_D
AT
AT
MP
L_G
EO
.GD
T
P
RIN
T D
AT
E:
8/9/
18:R
PG
GR
AP
HIC
LOG
DRILLED BY: Holt Services, Inc.LOGGED BY: M. Golden
DRILLING METHOD: Mud Rotary
MATERIAL DESCRIPTION
SA
MP
LE T
YP
E
SA
MP
LE ID
BORING B-4
TE
ST
ING
DEPTHFEET
44.054331, -123.084357APPROX. BORING B-4 LOCATION:
Page 1 of 1FIGURE A4
LOGGING COMPLETED: 5/25/18HAMMER EFFICIENCY PERCENT: 79BIT DIAMETER: 4 7/8 inches
DOWNTOWN RIVERFRONT PARKEUGENE, OREGON
PBS PROJECT NUMBER:73368.000
NOTE: Lines representing the interface between soil/rock units ofdiffering description are approximate only, inferred wherebetween samples, and may indicate gradual transition.
Surface Conditions: Asphalt
S-1
S-2
S-3
S-4
S-5
S-6
S-7
0.0
5.0
10.0
15.0
20.0
25.0
30.0
35.0
0 50 100
31
12
20
53
26
78
27
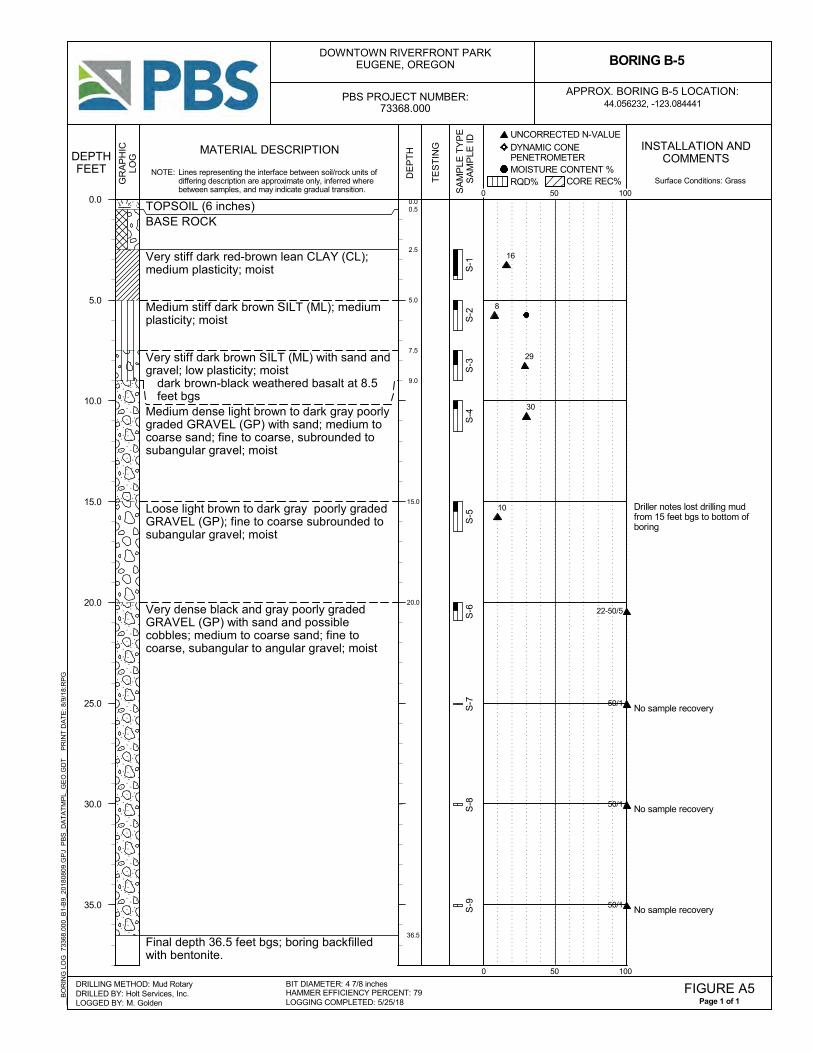
0.00.5
2.5
5.0
7.5
9.0
15.0
20.0
36.5
Driller notes lost drilling mudfrom 15 feet bgs to bottom ofboring
No sample recovery
No sample recovery
No sample recovery
TOPSOIL (6 inches)BASE ROCK
Very stiff dark red-brown lean CLAY (CL);medium plasticity; moist
Medium stiff dark brown SILT (ML); mediumplasticity; moist
Very stiff dark brown SILT (ML) with sand andgravel; low plasticity; moist
dark brown-black weathered basalt at 8.5feet bgs
Medium dense light brown to dark gray poorlygraded GRAVEL (GP) with sand; medium tocoarse sand; fine to coarse, subrounded tosubangular gravel; moist
Loose light brown to dark gray poorly gradedGRAVEL (GP); fine to coarse subrounded tosubangular gravel; moist
Very dense black and gray poorly gradedGRAVEL (GP) with sand and possiblecobbles; medium to coarse sand; fine tocoarse, subangular to angular gravel; moist
Final depth 36.5 feet bgs; boring backfilledwith bentonite.
DE
PT
H INSTALLATION ANDCOMMENTS
0 50 100
CORE REC%RQD% MOISTURE CONTENT %
DYNAMIC CONE PENETROMETER
UNCORRECTED N-VALUE
__B
OR
ING
LO
G
7336
8.00
0_B
1-B
9_20
1808
09.G
PJ
PB
S_D
AT
AT
MP
L_G
EO
.GD
T
P
RIN
T D
AT
E:
8/9/
18:R
PG
GR
AP
HIC
LOG
DRILLED BY: Holt Services, Inc.LOGGED BY: M. Golden
DRILLING METHOD: Mud Rotary
MATERIAL DESCRIPTION
SA
MP
LE T
YP
E
SA
MP
LE ID
BORING B-5
TE
ST
ING
DEPTHFEET
44.056232, -123.084441APPROX. BORING B-5 LOCATION:
Page 1 of 1FIGURE A5
LOGGING COMPLETED: 5/25/18HAMMER EFFICIENCY PERCENT: 79BIT DIAMETER: 4 7/8 inches
DOWNTOWN RIVERFRONT PARKEUGENE, OREGON
PBS PROJECT NUMBER:73368.000
NOTE: Lines representing the interface between soil/rock units ofdiffering description are approximate only, inferred wherebetween samples, and may indicate gradual transition.
Surface Conditions: Grass
22-50/5
50/1
50/1
50/1
S-1
S-2
S-3
S-4
S-5
S-6
S-7
S-8
S-9
0.0
5.0
10.0
15.0
20.0
25.0
30.0
35.0
0 50 100
16
8
29
30
10
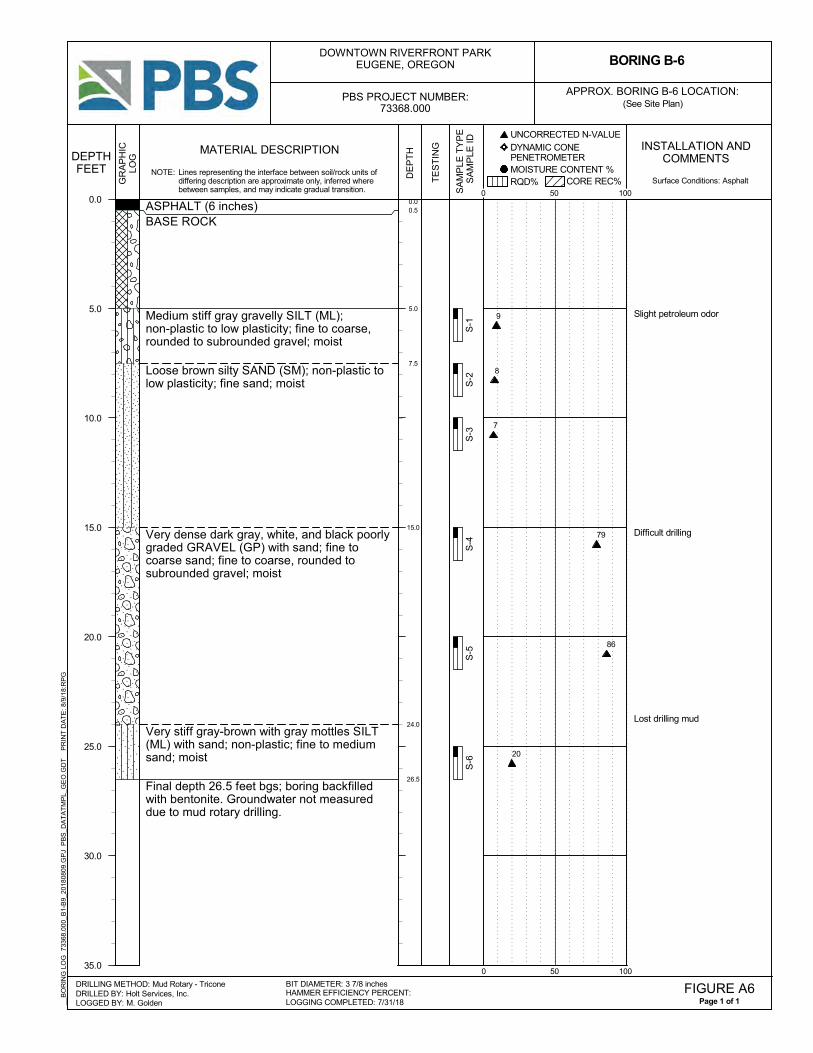
0.00.5
5.0
7.5
15.0
24.0
26.5
Slight petroleum odor
Difficult drilling
Lost drilling mud
ASPHALT (6 inches)BASE ROCK
Medium stiff gray gravelly SILT (ML);non-plastic to low plasticity; fine to coarse,rounded to subrounded gravel; moist
Loose brown silty SAND (SM); non-plastic tolow plasticity; fine sand; moist
Very dense dark gray, white, and black poorlygraded GRAVEL (GP) with sand; fine tocoarse sand; fine to coarse, rounded tosubrounded gravel; moist
Very stiff gray-brown with gray mottles SILT(ML) with sand; non-plastic; fine to mediumsand; moist
Final depth 26.5 feet bgs; boring backfilledwith bentonite. Groundwater not measureddue to mud rotary drilling.
DE
PT
H INSTALLATION ANDCOMMENTS
0 50 100
CORE REC%RQD% MOISTURE CONTENT %
DYNAMIC CONE PENETROMETER
UNCORRECTED N-VALUE
__B
OR
ING
LO
G
7336
8.00
0_B
1-B
9_20
1808
09.G
PJ
PB
S_D
AT
AT
MP
L_G
EO
.GD
T
P
RIN
T D
AT
E:
8/9/
18:R
PG
GR
AP
HIC
LOG
DRILLED BY: Holt Services, Inc.LOGGED BY: M. Golden
DRILLING METHOD: Mud Rotary - Tricone
MATERIAL DESCRIPTION
SA
MP
LE T
YP
E
SA
MP
LE ID
BORING B-6
TE
ST
ING
DEPTHFEET
(See Site Plan)APPROX. BORING B-6 LOCATION:
Page 1 of 1FIGURE A6
LOGGING COMPLETED: 7/31/18HAMMER EFFICIENCY PERCENT:BIT DIAMETER: 3 7/8 inches
DOWNTOWN RIVERFRONT PARKEUGENE, OREGON
PBS PROJECT NUMBER:73368.000
NOTE: Lines representing the interface between soil/rock units ofdiffering description are approximate only, inferred wherebetween samples, and may indicate gradual transition.
Surface Conditions: Asphalt
S-1
S-2
S-3
S-4
S-5
S-6
0.0
5.0
10.0
15.0
20.0
25.0
30.0
35.0
0 50 100
9
8
7
79
86
20
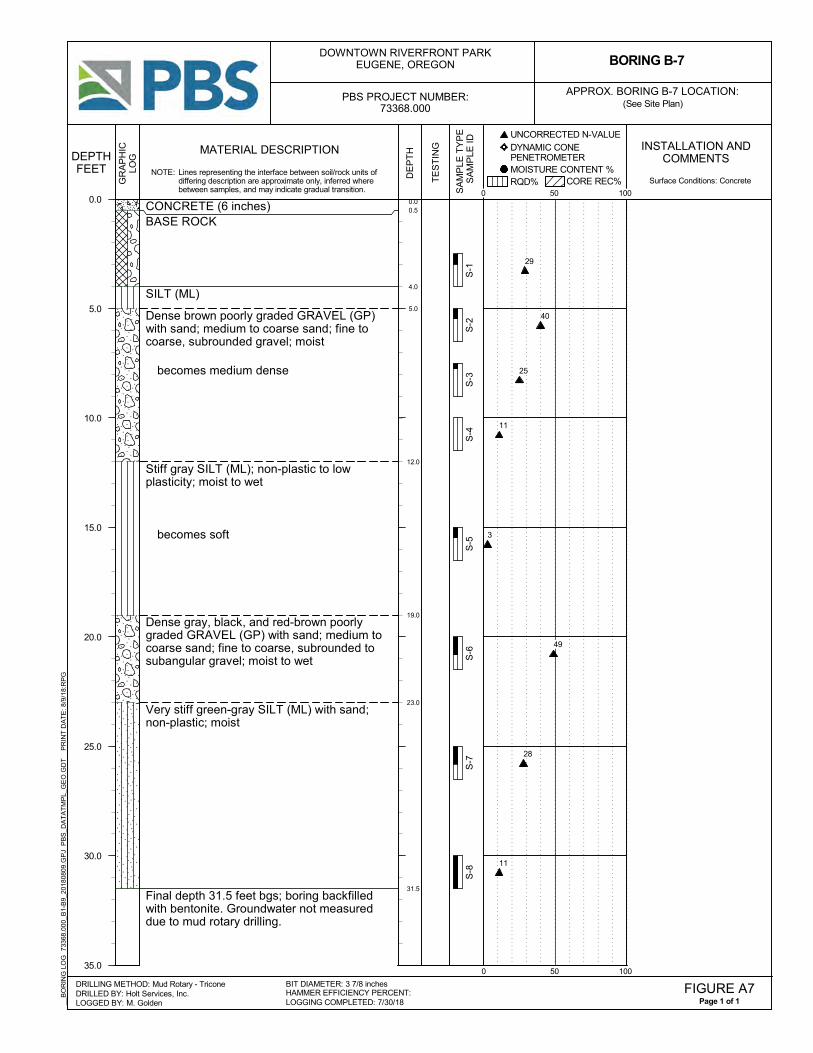
0.00.5
4.0
5.0
12.0
19.0
23.0
31.5
CONCRETE (6 inches)BASE ROCK
SILT (ML)
Dense brown poorly graded GRAVEL (GP)with sand; medium to coarse sand; fine tocoarse, subrounded gravel; moist
becomes medium dense
Stiff gray SILT (ML); non-plastic to lowplasticity; moist to wet
becomes soft
Dense gray, black, and red-brown poorlygraded GRAVEL (GP) with sand; medium tocoarse sand; fine to coarse, subrounded tosubangular gravel; moist to wet
Very stiff green-gray SILT (ML) with sand;non-plastic; moist
Final depth 31.5 feet bgs; boring backfilledwith bentonite. Groundwater not measureddue to mud rotary drilling.
DE
PT
H INSTALLATION ANDCOMMENTS
0 50 100
CORE REC%RQD% MOISTURE CONTENT %
DYNAMIC CONE PENETROMETER
UNCORRECTED N-VALUE
__B
OR
ING
LO
G
7336
8.00
0_B
1-B
9_20
1808
09.G
PJ
PB
S_D
AT
AT
MP
L_G
EO
.GD
T
P
RIN
T D
AT
E:
8/9/
18:R
PG
GR
AP
HIC
LOG
DRILLED BY: Holt Services, Inc.LOGGED BY: M. Golden
DRILLING METHOD: Mud Rotary - Tricone
MATERIAL DESCRIPTION
SA
MP
LE T
YP
E
SA
MP
LE ID
BORING B-7
TE
ST
ING
DEPTHFEET
(See Site Plan)APPROX. BORING B-7 LOCATION:
Page 1 of 1FIGURE A7
LOGGING COMPLETED: 7/30/18HAMMER EFFICIENCY PERCENT:BIT DIAMETER: 3 7/8 inches
DOWNTOWN RIVERFRONT PARKEUGENE, OREGON
PBS PROJECT NUMBER:73368.000
NOTE: Lines representing the interface between soil/rock units ofdiffering description are approximate only, inferred wherebetween samples, and may indicate gradual transition.
Surface Conditions: Concrete
S-1
S-2
S-3
S-4
S-5
S-6
S-7
S-8
0.0
5.0
10.0
15.0
20.0
25.0
30.0
35.0
0 50 100
29
40
25
11
3
49
28
11
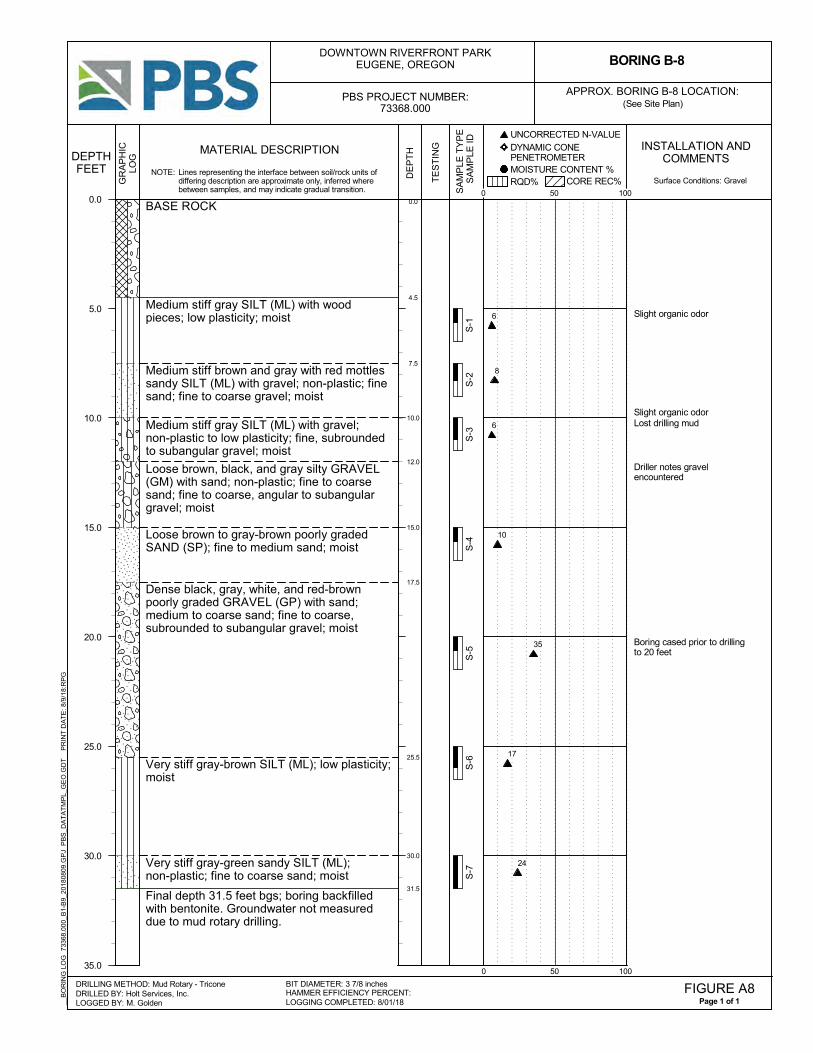
0.0
4.5
7.5
10.0
12.0
15.0
17.5
25.5
30.0
31.5
Slight organic odor
Slight organic odorLost drilling mud
Driller notes gravelencountered
Boring cased prior to drillingto 20 feet
BASE ROCK
Medium stiff gray SILT (ML) with woodpieces; low plasticity; moist
Medium stiff brown and gray with red mottlessandy SILT (ML) with gravel; non-plastic; finesand; fine to coarse gravel; moist
Medium stiff gray SILT (ML) with gravel;non-plastic to low plasticity; fine, subroundedto subangular gravel; moist
Loose brown, black, and gray silty GRAVEL(GM) with sand; non-plastic; fine to coarsesand; fine to coarse, angular to subangulargravel; moist
Loose brown to gray-brown poorly gradedSAND (SP); fine to medium sand; moist
Dense black, gray, white, and red-brownpoorly graded GRAVEL (GP) with sand;medium to coarse sand; fine to coarse,subrounded to subangular gravel; moist
Very stiff gray-brown SILT (ML); low plasticity;moist
Very stiff gray-green sandy SILT (ML);non-plastic; fine to coarse sand; moist
Final depth 31.5 feet bgs; boring backfilledwith bentonite. Groundwater not measureddue to mud rotary drilling.
DE
PT
H INSTALLATION ANDCOMMENTS
0 50 100
CORE REC%RQD% MOISTURE CONTENT %
DYNAMIC CONE PENETROMETER
UNCORRECTED N-VALUE
__B
OR
ING
LO
G
7336
8.00
0_B
1-B
9_20
1808
09.G
PJ
PB
S_D
AT
AT
MP
L_G
EO
.GD
T
P
RIN
T D
AT
E:
8/9/
18:R
PG
GR
AP
HIC
LOG
DRILLED BY: Holt Services, Inc.LOGGED BY: M. Golden
DRILLING METHOD: Mud Rotary - Tricone
MATERIAL DESCRIPTION
SA
MP
LE T
YP
E
SA
MP
LE ID
BORING B-8
TE
ST
ING
DEPTHFEET
(See Site Plan)APPROX. BORING B-8 LOCATION:
Page 1 of 1FIGURE A8
LOGGING COMPLETED: 8/01/18HAMMER EFFICIENCY PERCENT:BIT DIAMETER: 3 7/8 inches
DOWNTOWN RIVERFRONT PARKEUGENE, OREGON
PBS PROJECT NUMBER:73368.000
NOTE: Lines representing the interface between soil/rock units ofdiffering description are approximate only, inferred wherebetween samples, and may indicate gradual transition.
Surface Conditions: Gravel
S-1
S-2
S-3
S-4
S-5
S-6
S-7
0.0
5.0
10.0
15.0
20.0
25.0
30.0
35.0
0 50 100
6
8
6
10
35
17
24
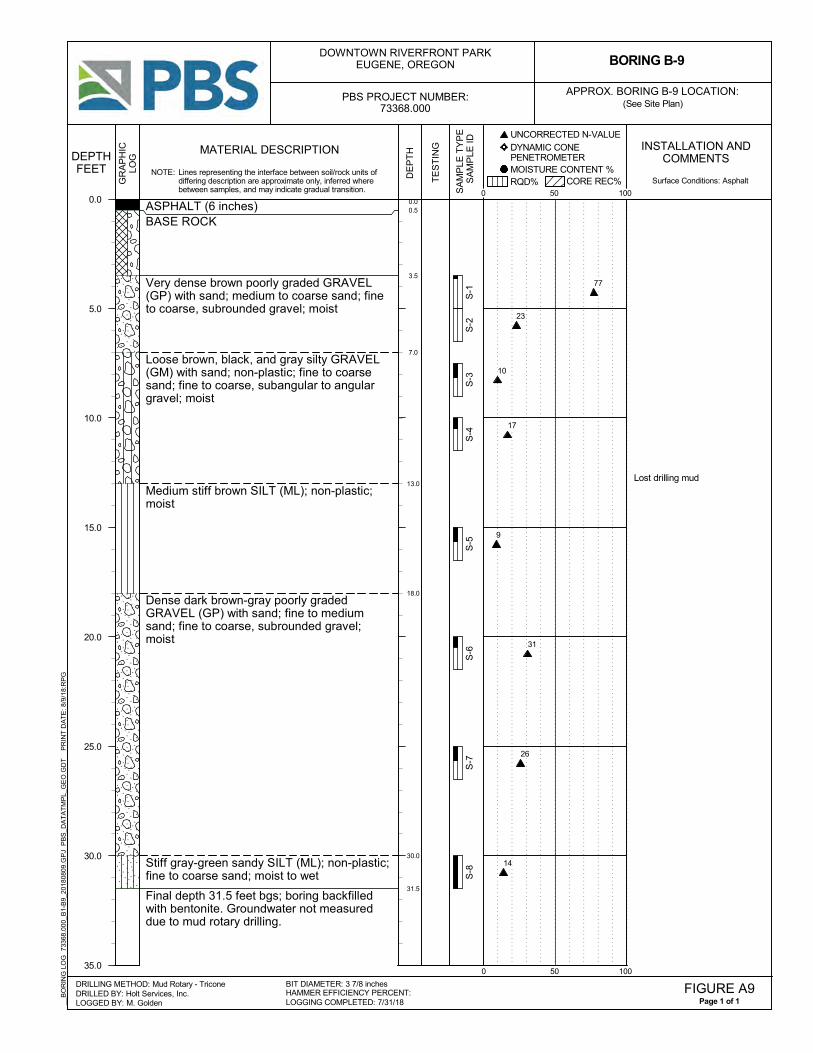
0.00.5
3.5
7.0
13.0
18.0
30.0
31.5
Lost drilling mud
ASPHALT (6 inches)BASE ROCK
Very dense brown poorly graded GRAVEL(GP) with sand; medium to coarse sand; fineto coarse, subrounded gravel; moist
Loose brown, black, and gray silty GRAVEL(GM) with sand; non-plastic; fine to coarsesand; fine to coarse, subangular to angulargravel; moist
Medium stiff brown SILT (ML); non-plastic;moist
Dense dark brown-gray poorly gradedGRAVEL (GP) with sand; fine to mediumsand; fine to coarse, subrounded gravel;moist
Stiff gray-green sandy SILT (ML); non-plastic;fine to coarse sand; moist to wet
Final depth 31.5 feet bgs; boring backfilledwith bentonite. Groundwater not measureddue to mud rotary drilling.
DE
PT
H INSTALLATION ANDCOMMENTS
0 50 100
CORE REC%RQD% MOISTURE CONTENT %
DYNAMIC CONE PENETROMETER
UNCORRECTED N-VALUE
__B
OR
ING
LO
G
7336
8.00
0_B
1-B
9_20
1808
09.G
PJ
PB
S_D
AT
AT
MP
L_G
EO
.GD
T
P
RIN
T D
AT
E:
8/9/
18:R
PG
GR
AP
HIC
LOG
DRILLED BY: Holt Services, Inc.LOGGED BY: M. Golden
DRILLING METHOD: Mud Rotary - Tricone
MATERIAL DESCRIPTION
SA
MP
LE T
YP
E
SA
MP
LE ID
BORING B-9
TE
ST
ING
DEPTHFEET
(See Site Plan)APPROX. BORING B-9 LOCATION:
Page 1 of 1FIGURE A9
LOGGING COMPLETED: 7/31/18HAMMER EFFICIENCY PERCENT:BIT DIAMETER: 3 7/8 inches
DOWNTOWN RIVERFRONT PARKEUGENE, OREGON
PBS PROJECT NUMBER:73368.000
NOTE: Lines representing the interface between soil/rock units ofdiffering description are approximate only, inferred wherebetween samples, and may indicate gradual transition.
Surface Conditions: Asphalt
S-1
S-2
S-3
S-4
S-5
S-6
S-7
S-8
0.0
5.0
10.0
15.0
20.0
25.0
30.0
35.0
0 50 100
77
23
10
17
9
31
26
14

SQUIER: EWEB OPERATIONS FACILITY BORINGS
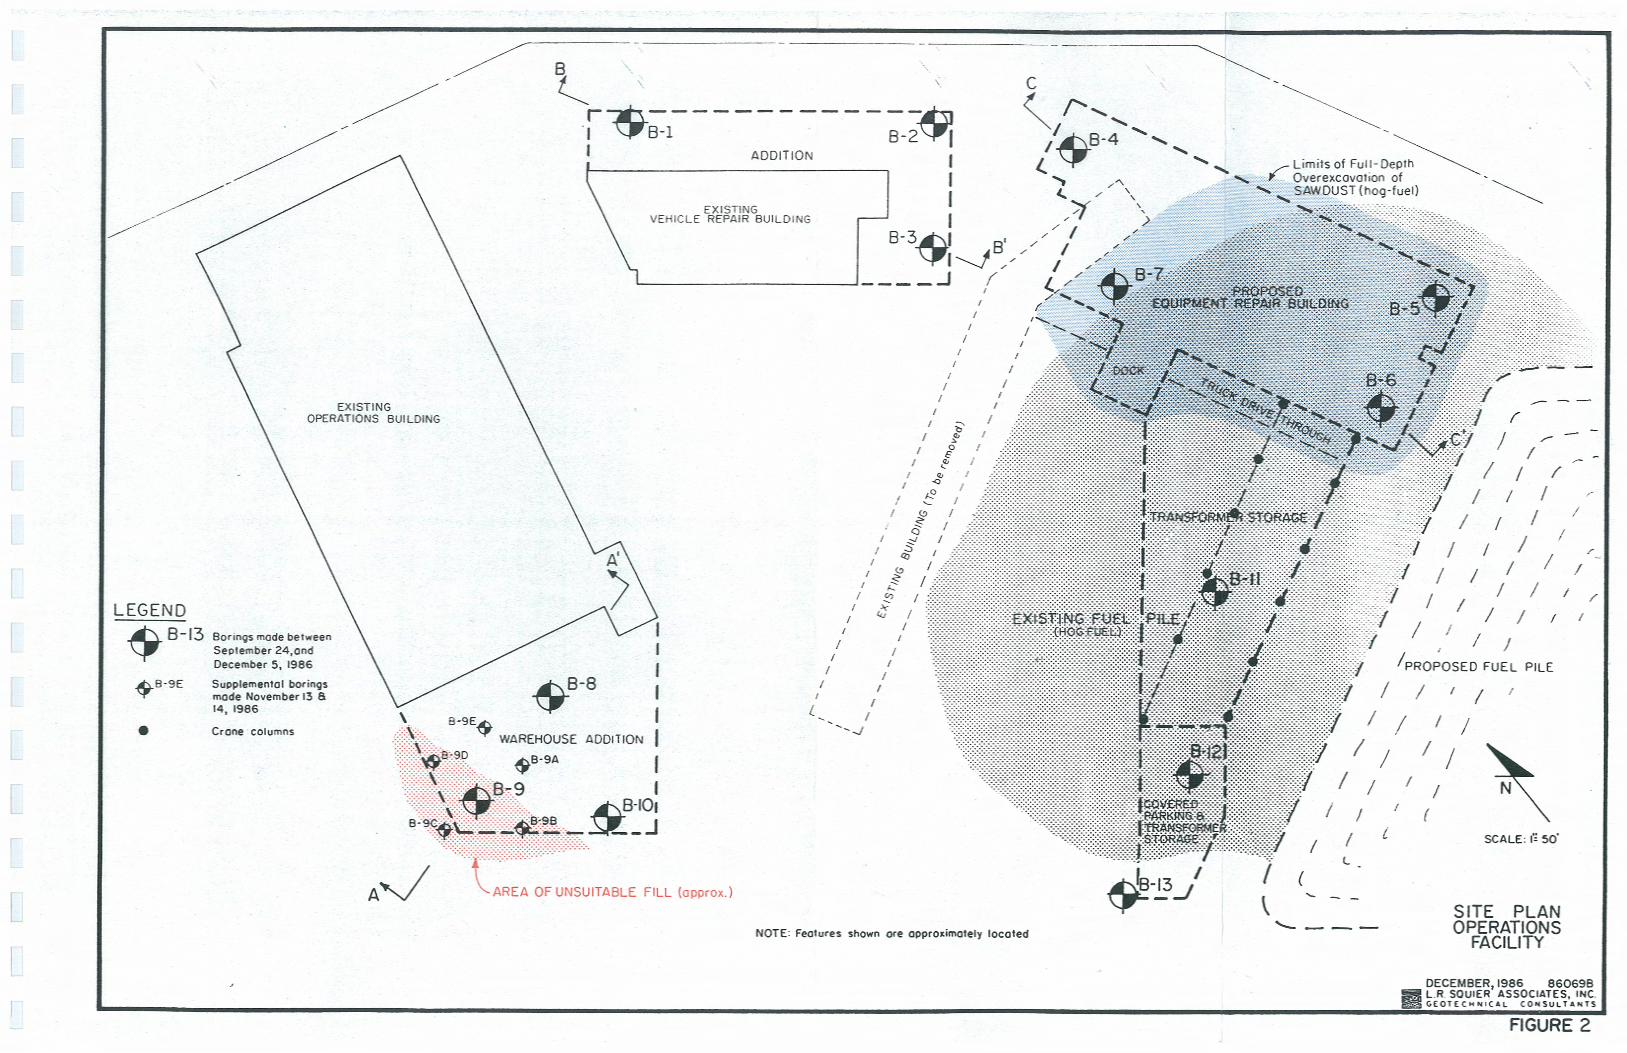
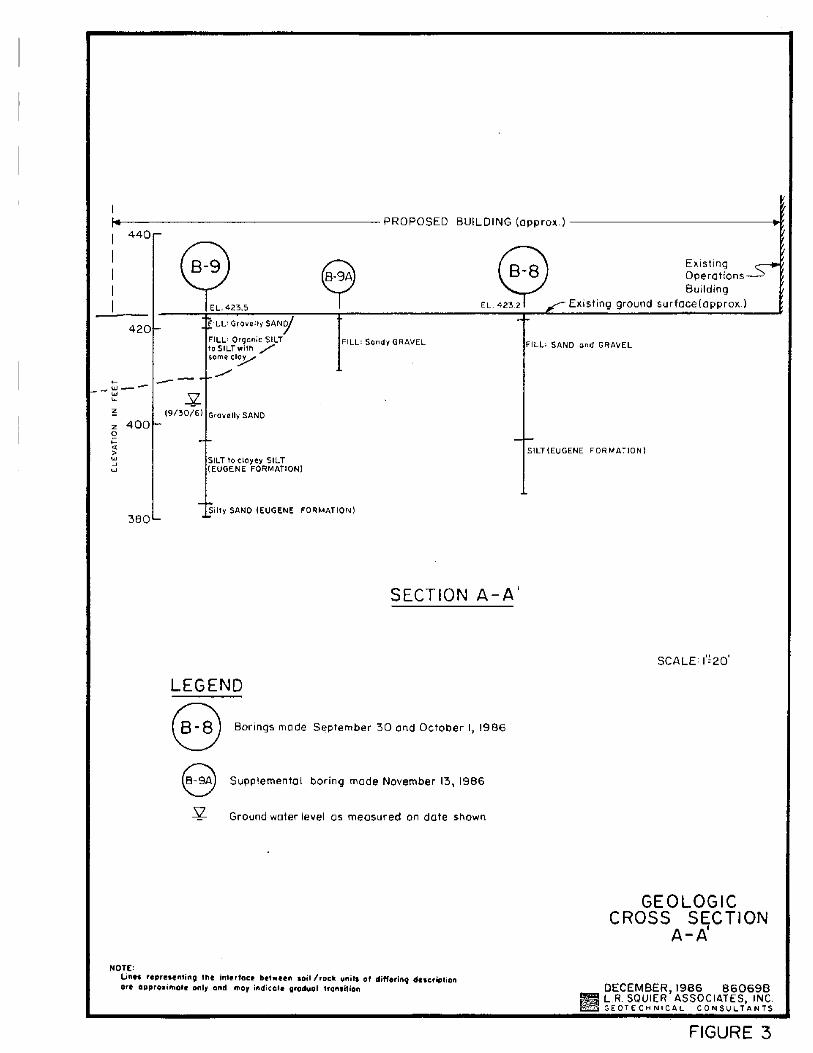
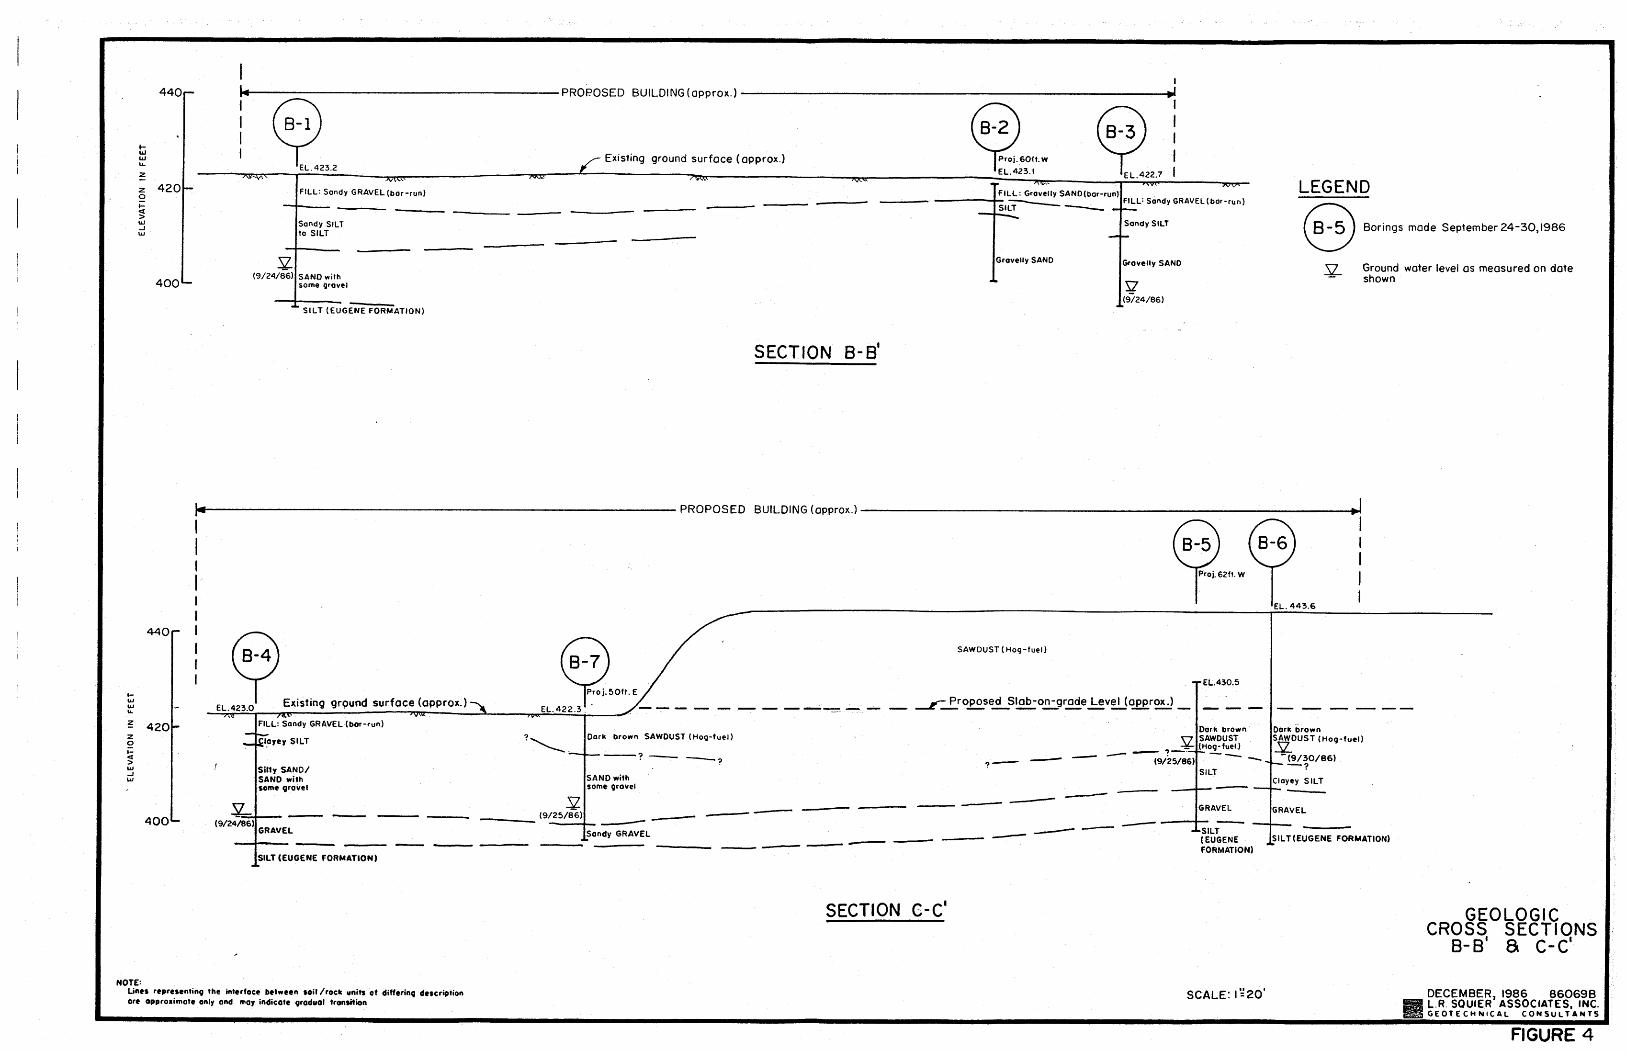
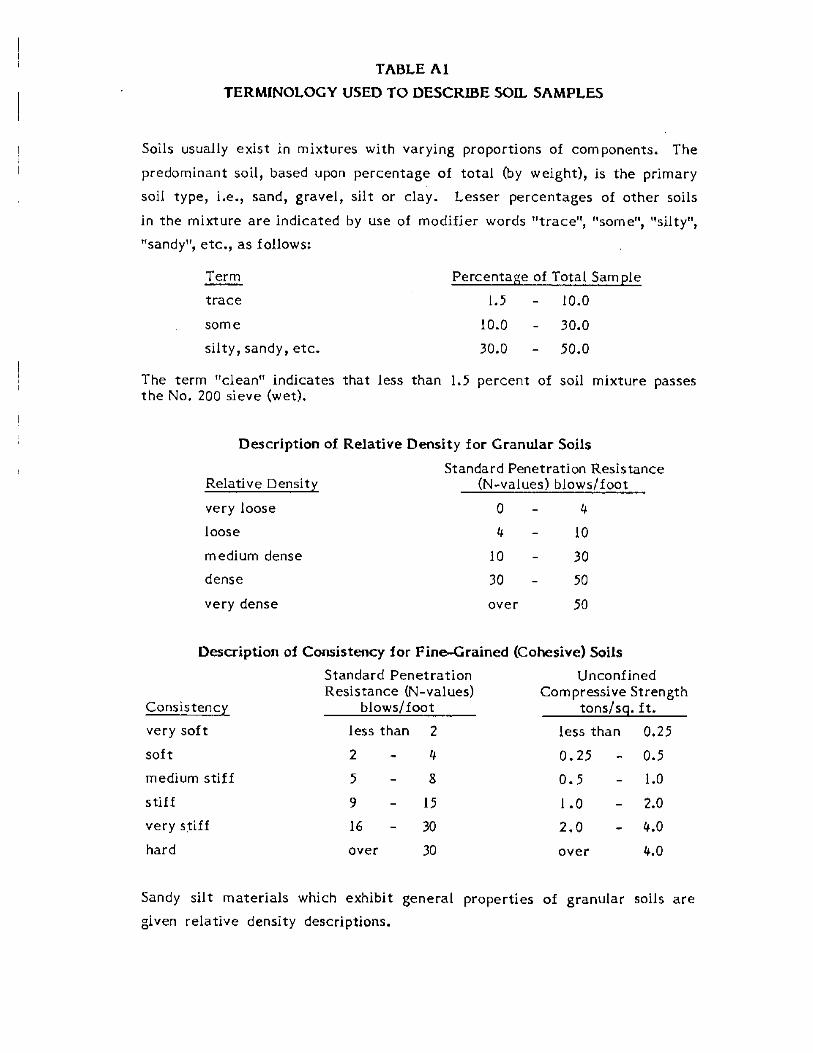
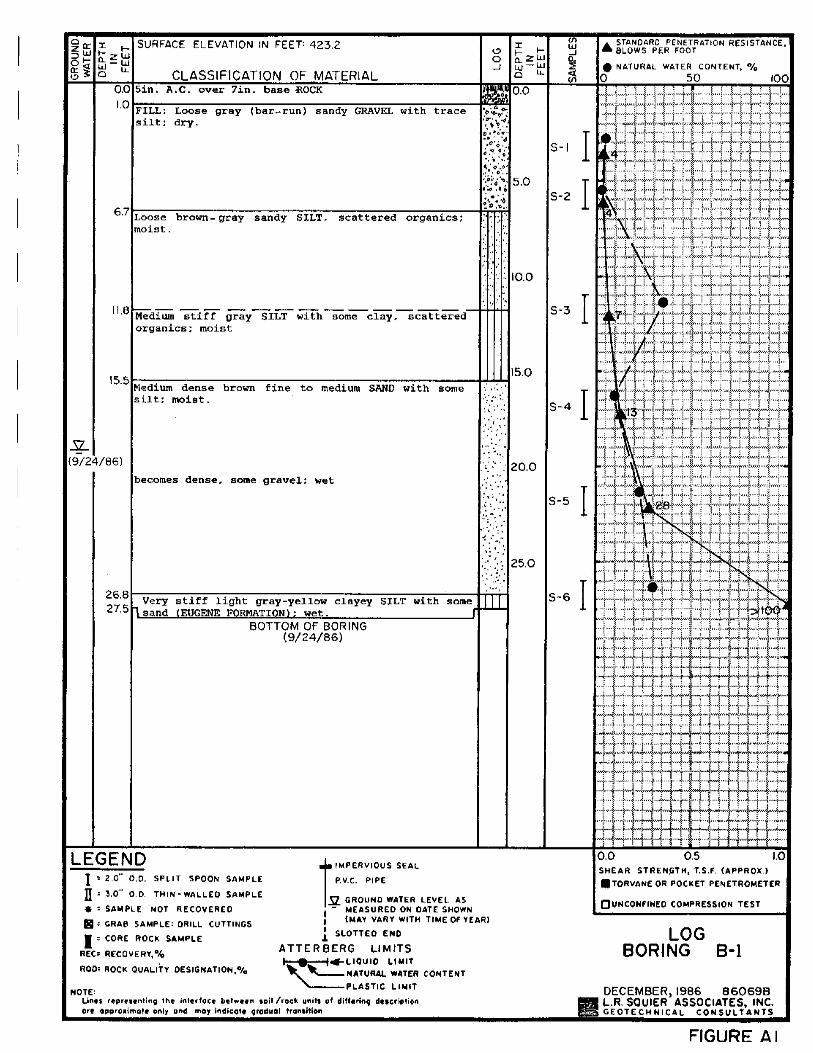
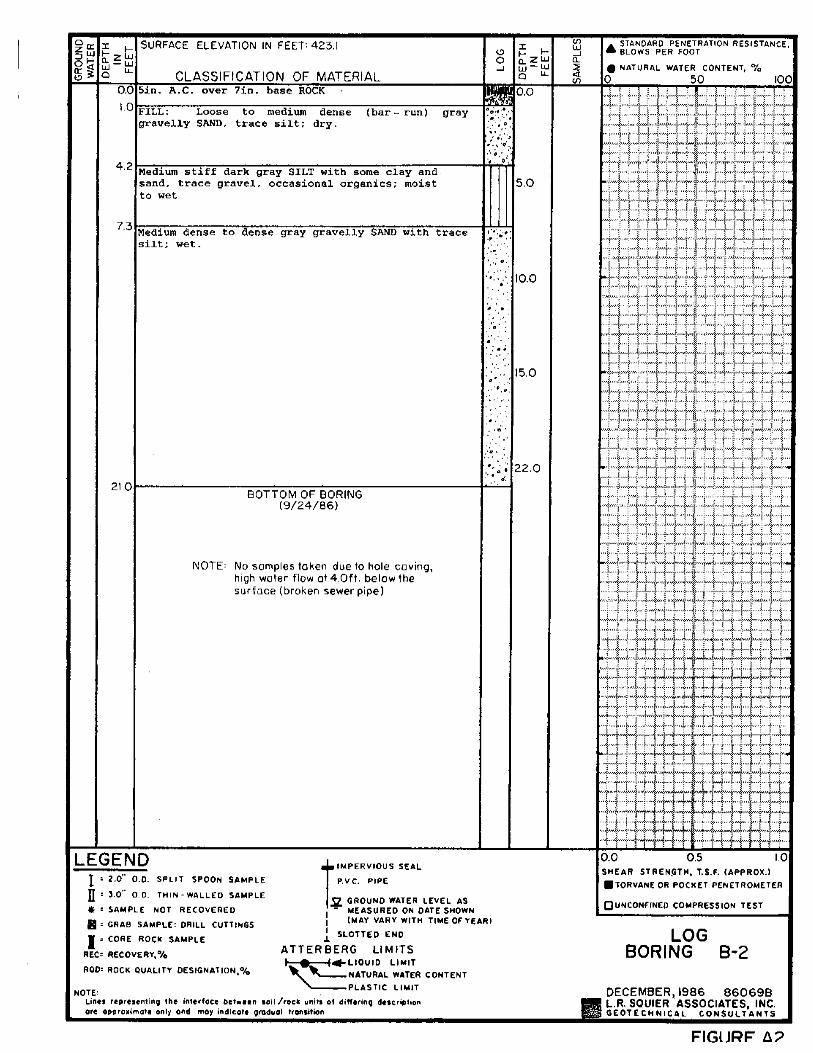
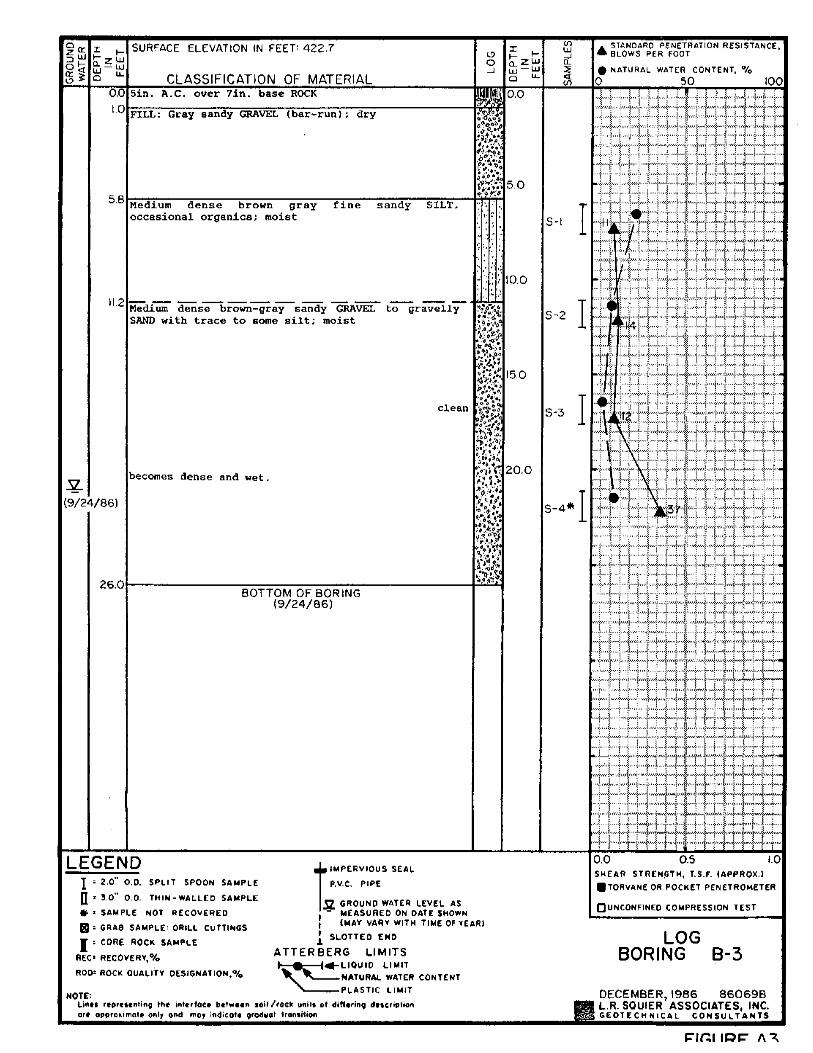
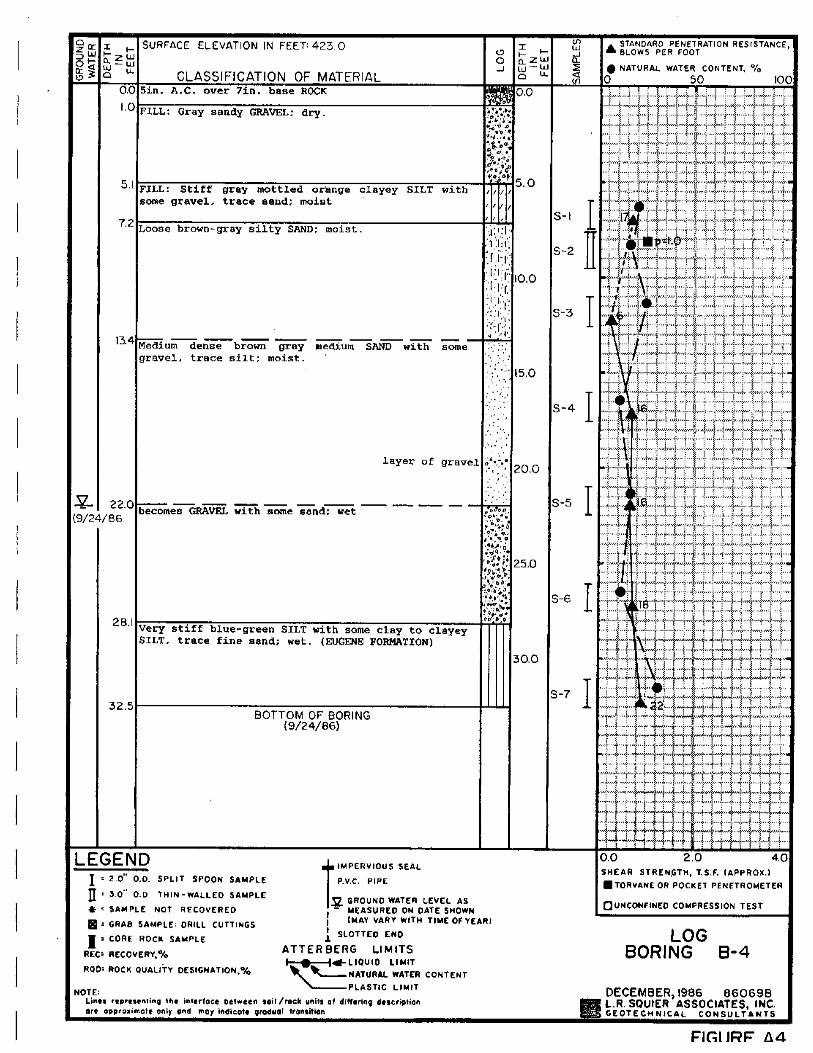
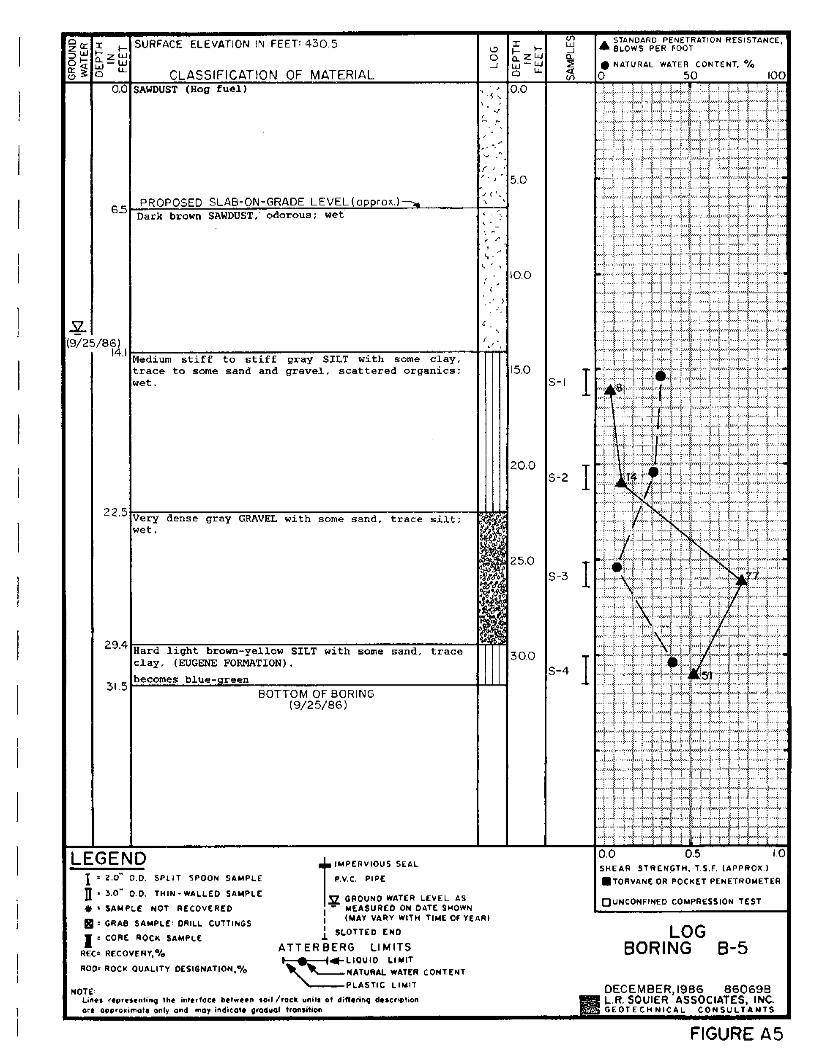
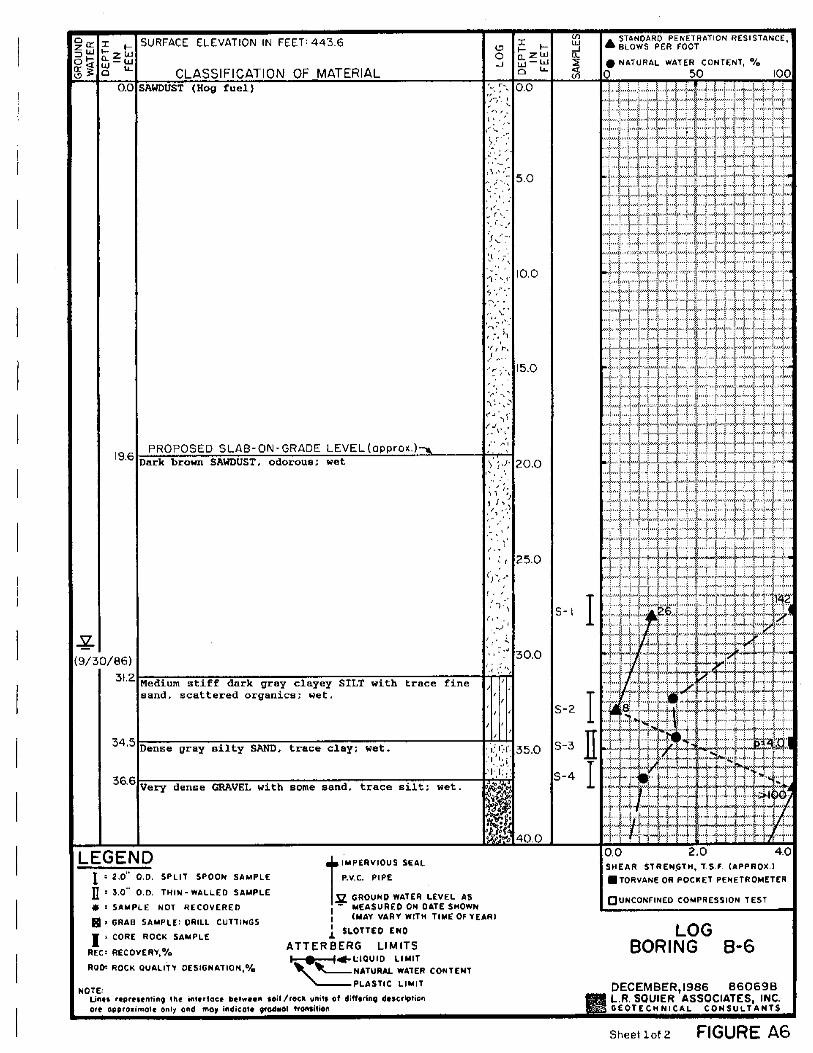
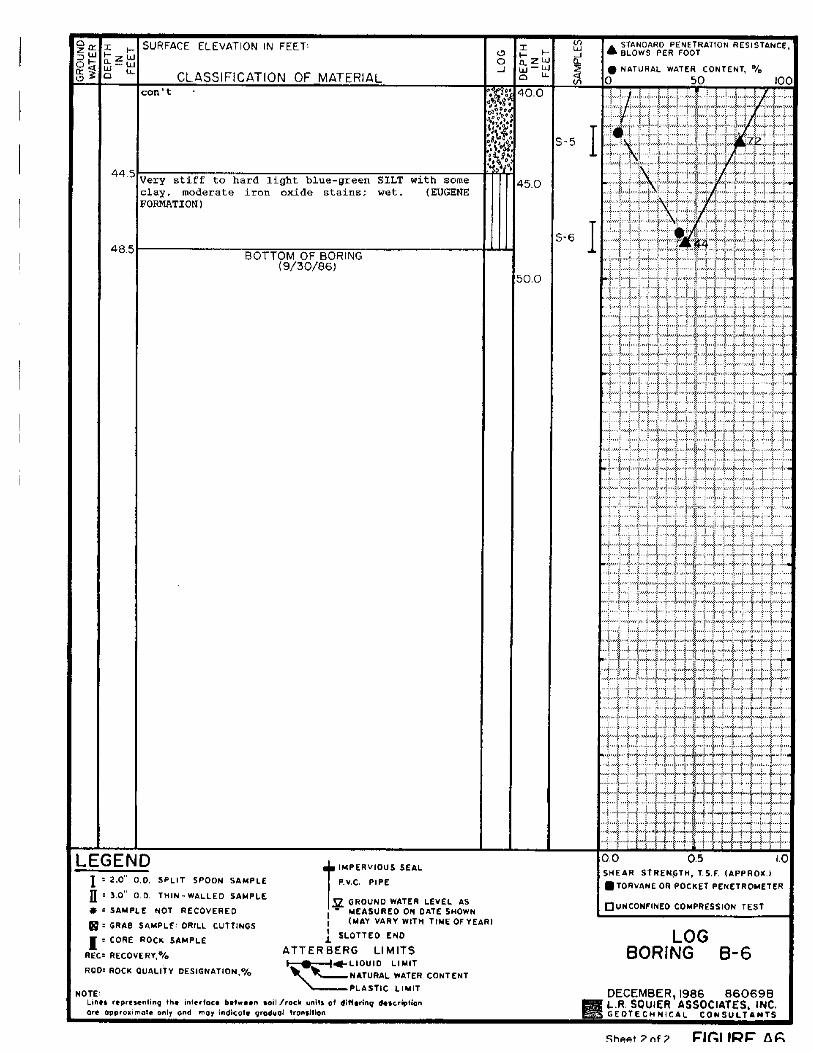
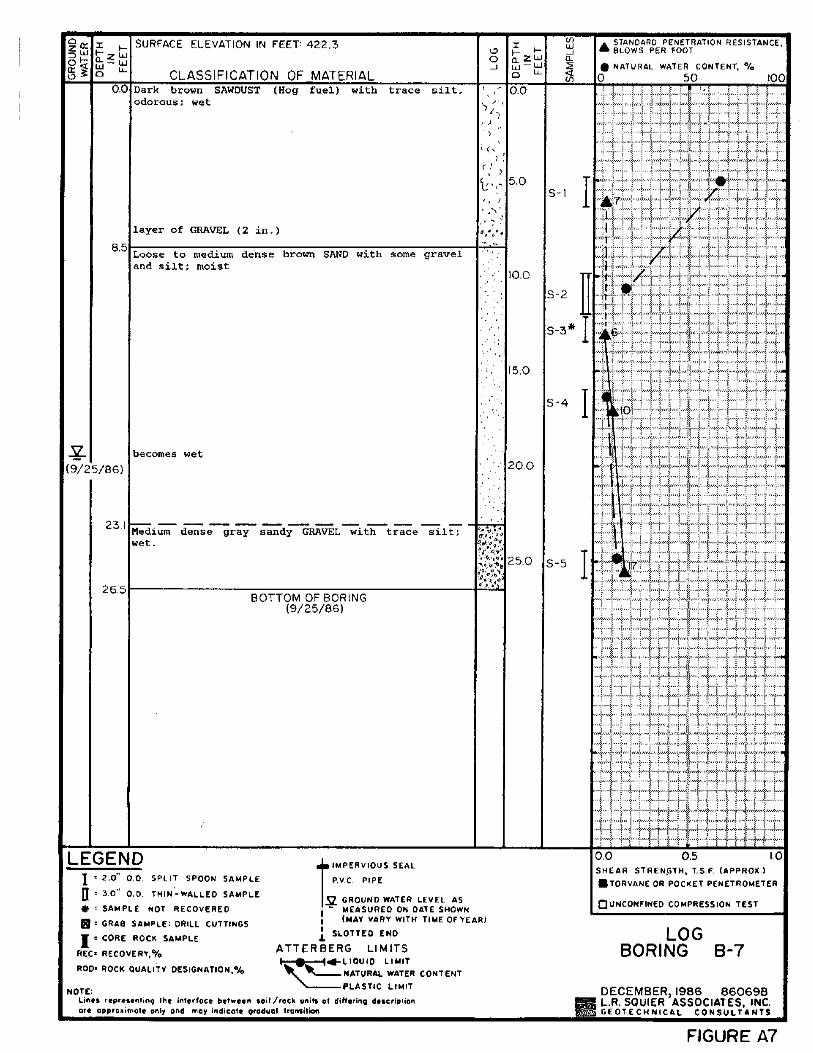
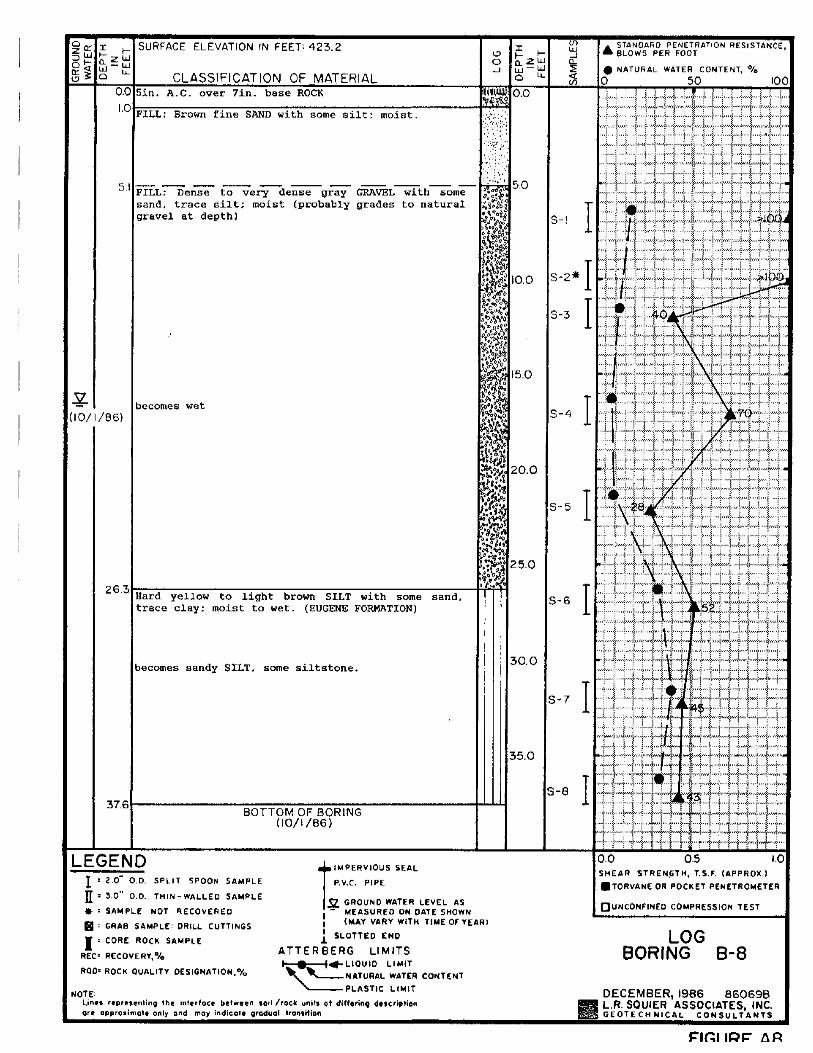
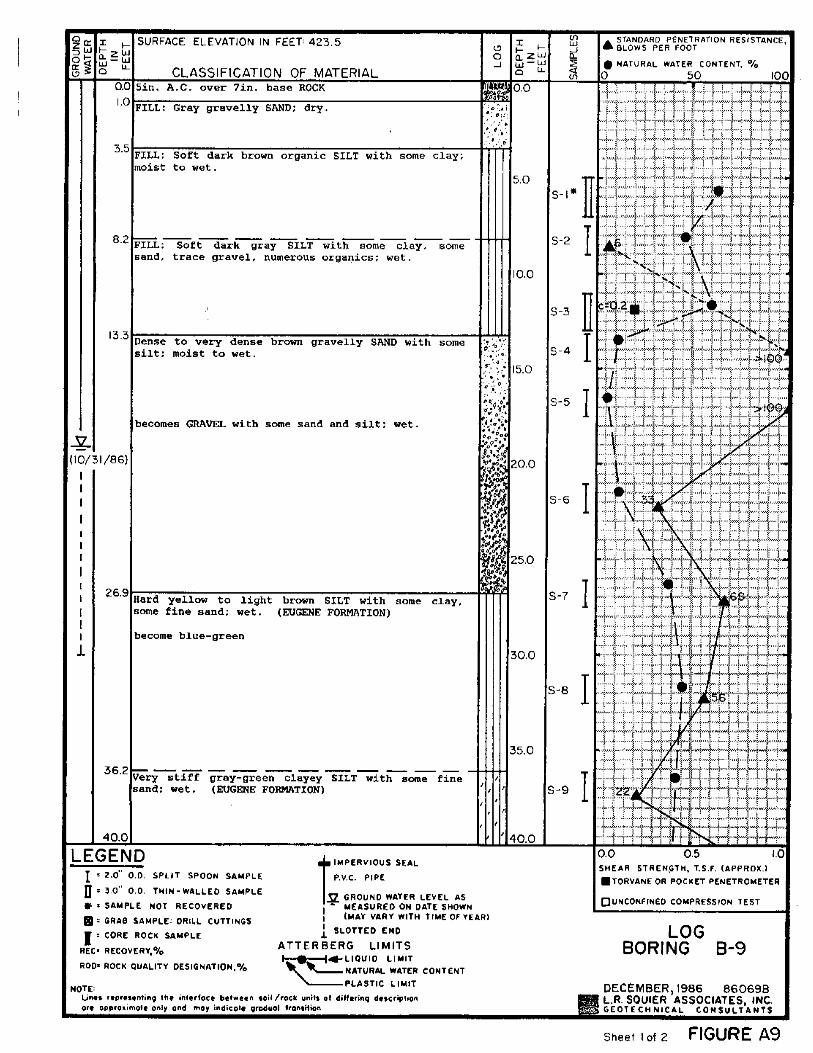
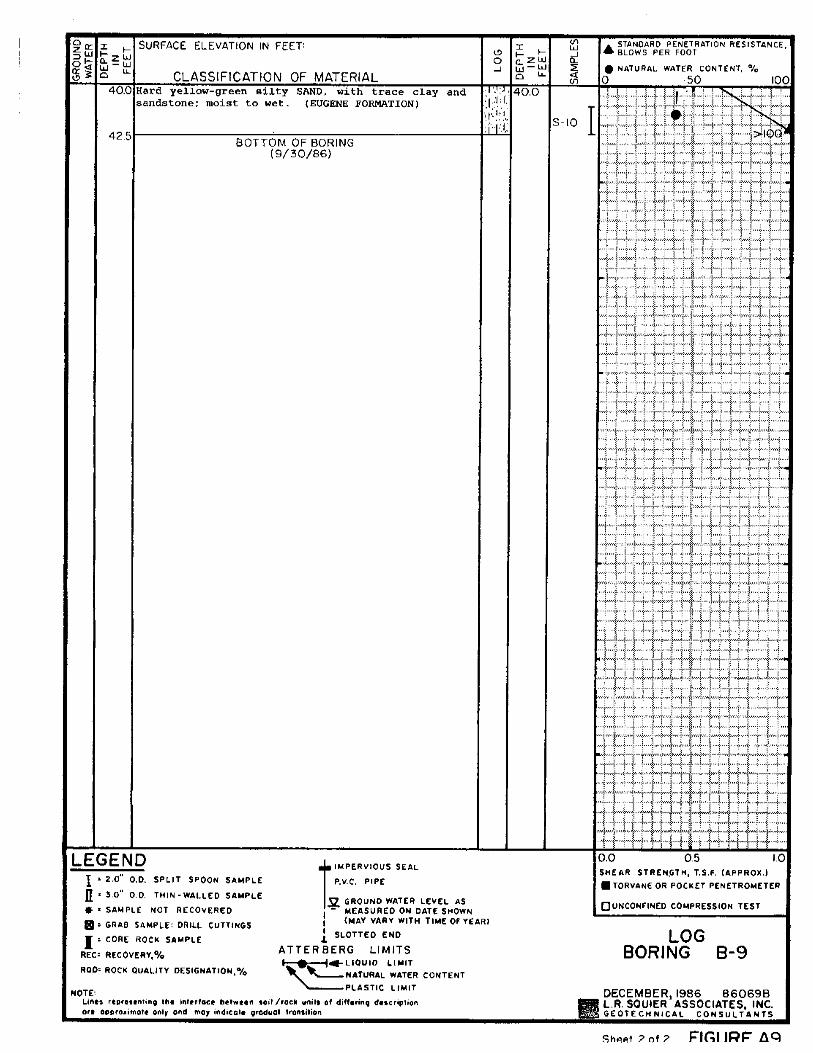
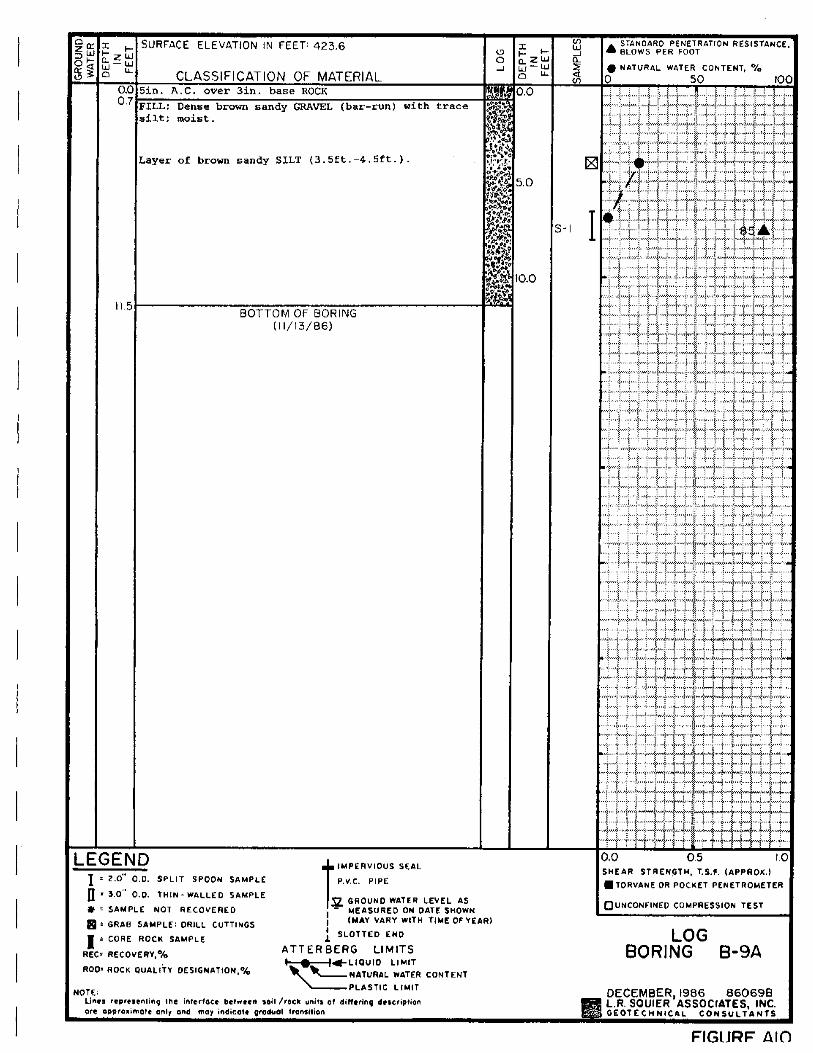
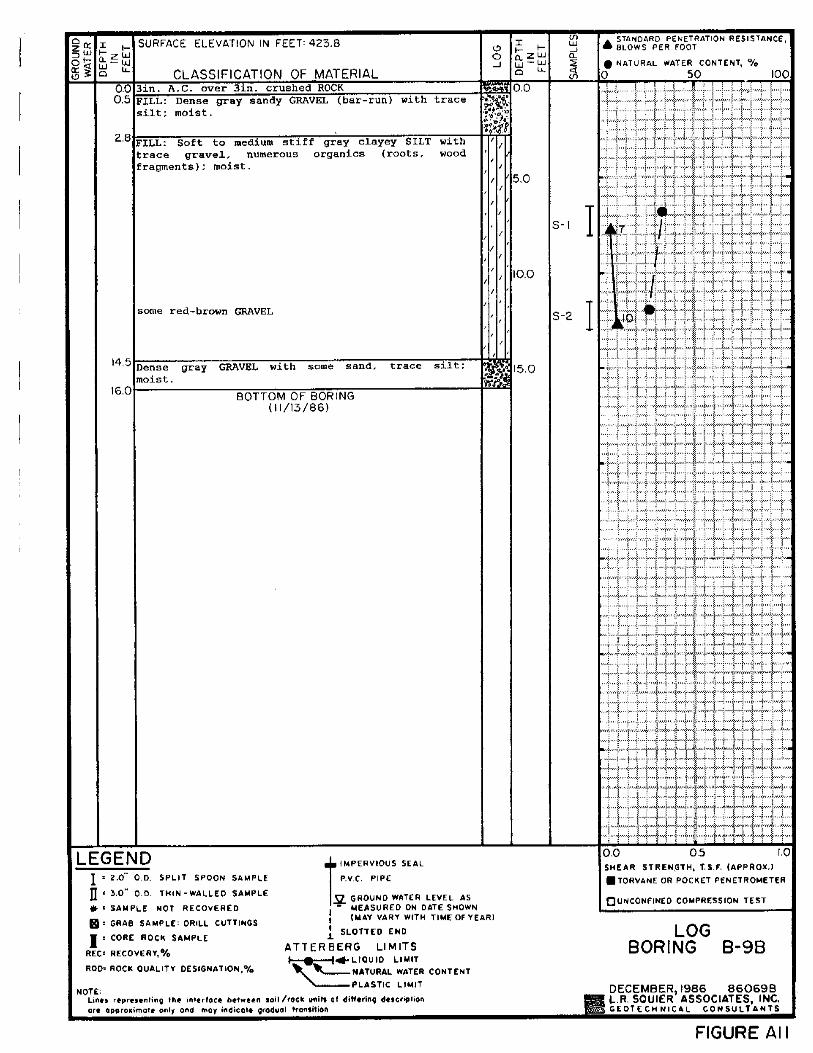
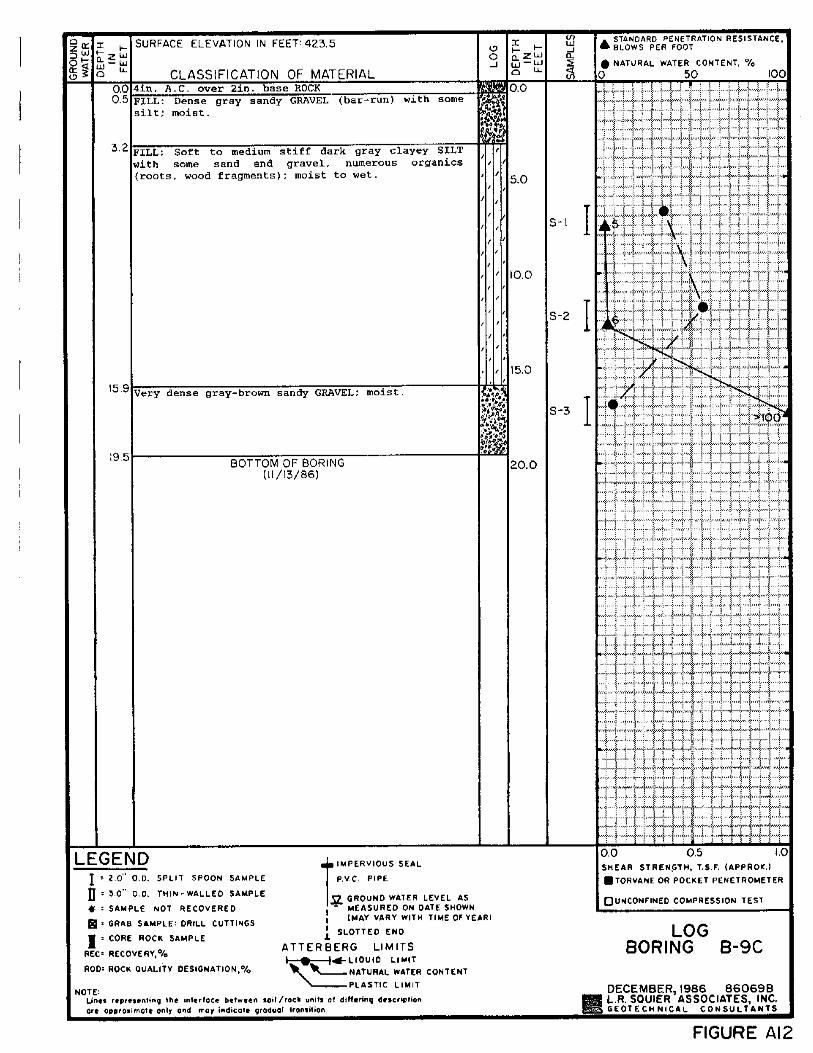
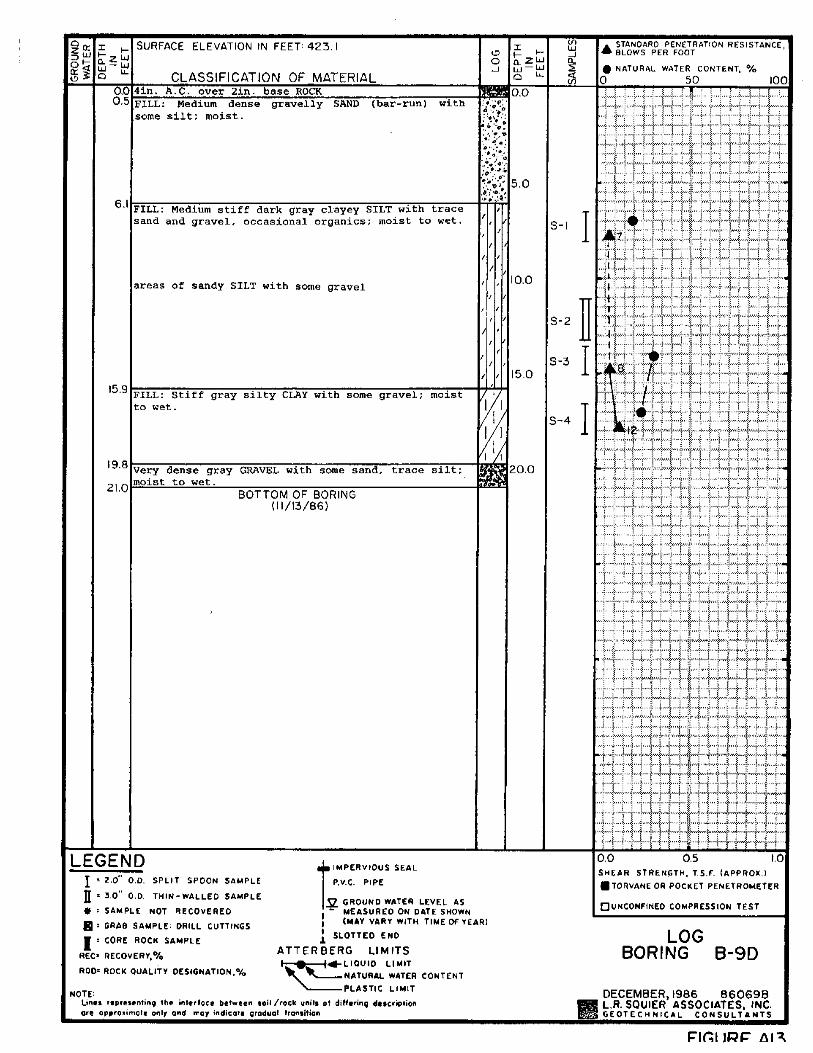
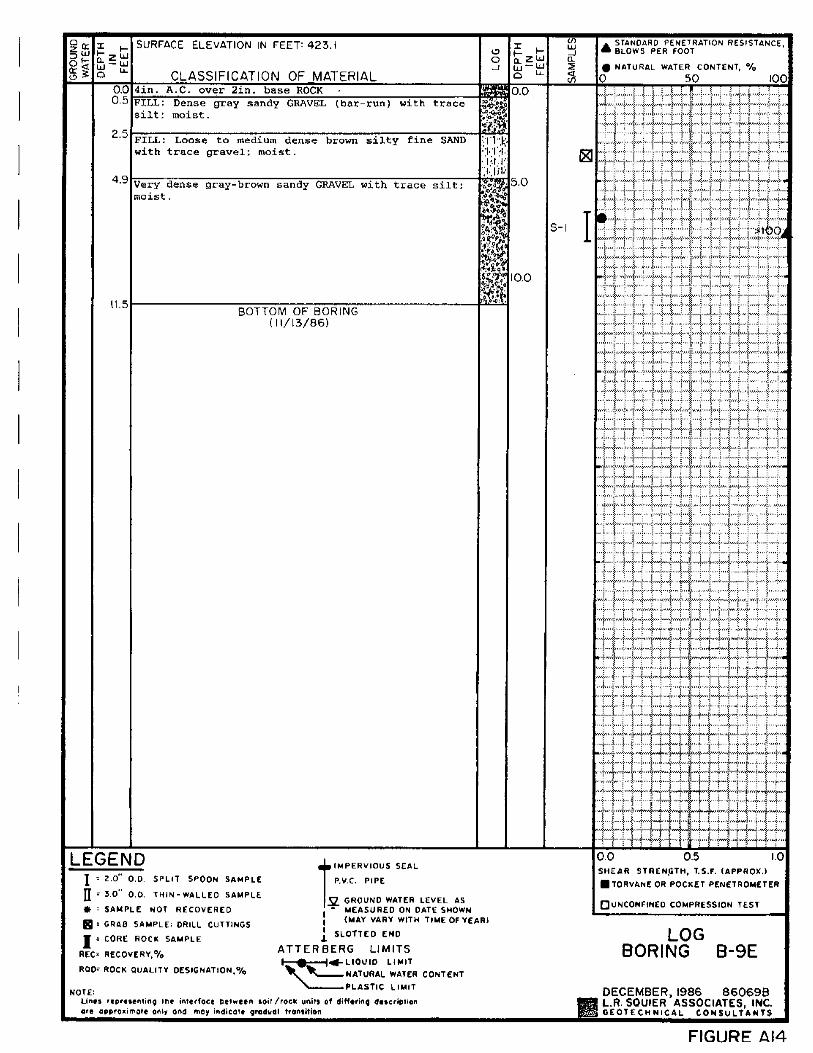
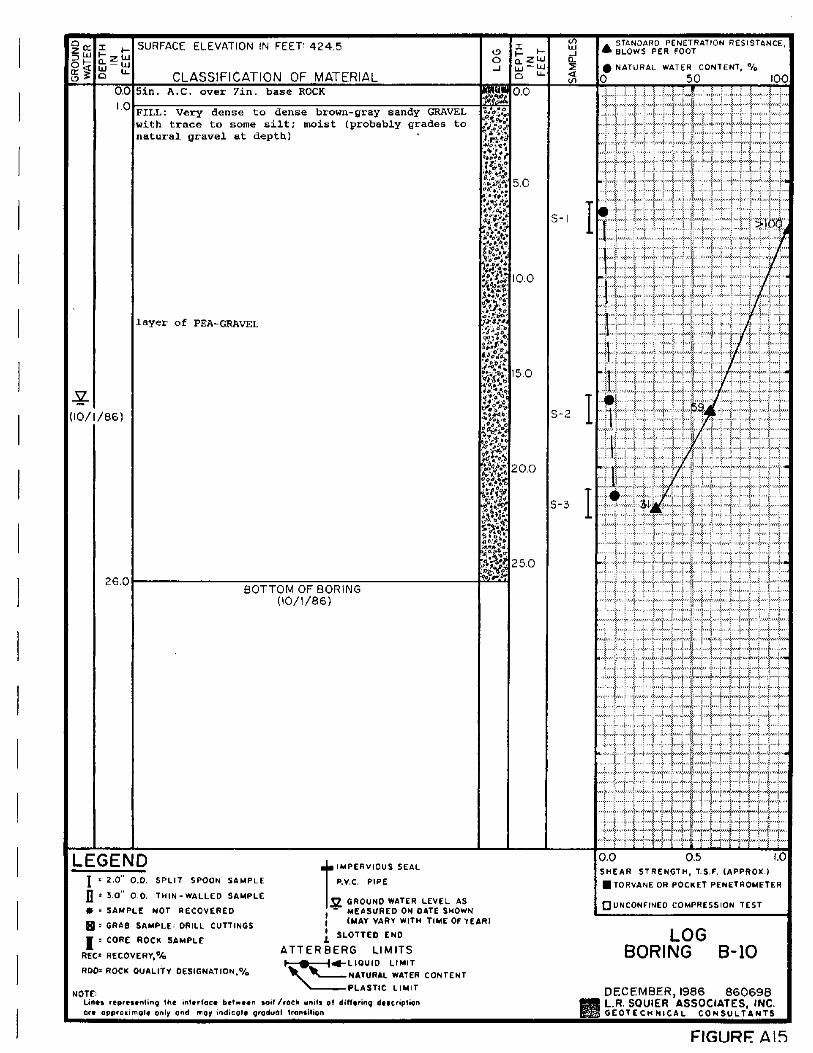
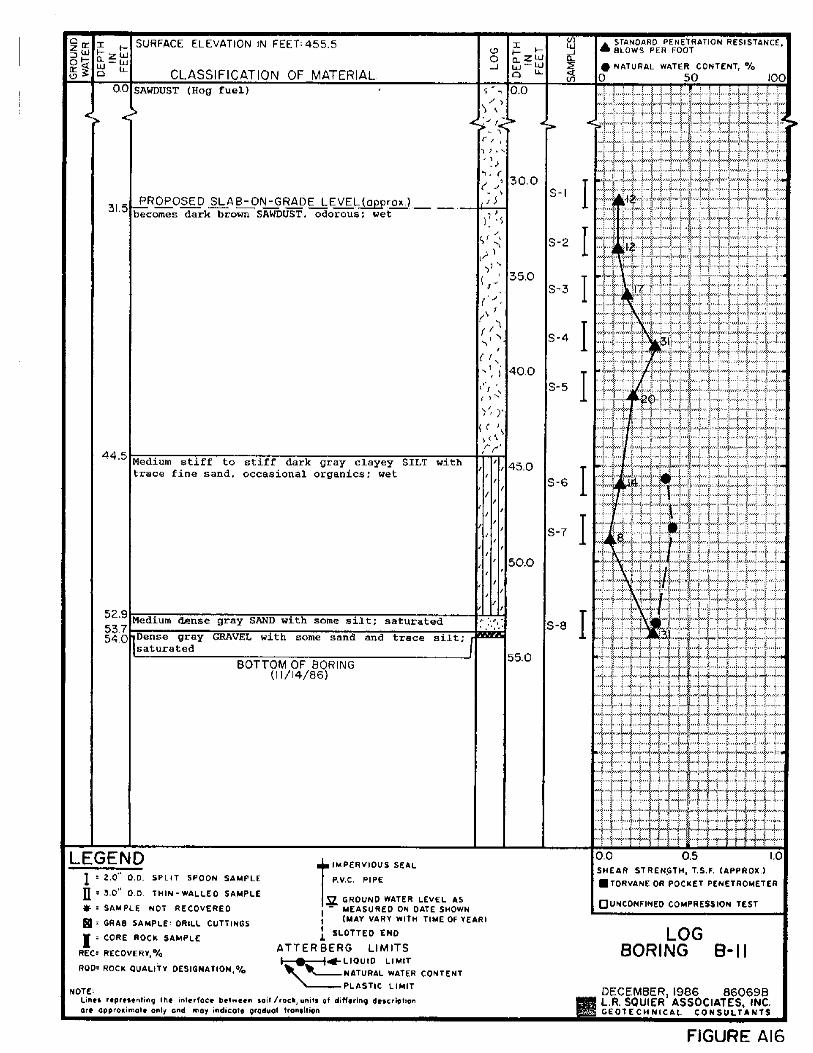
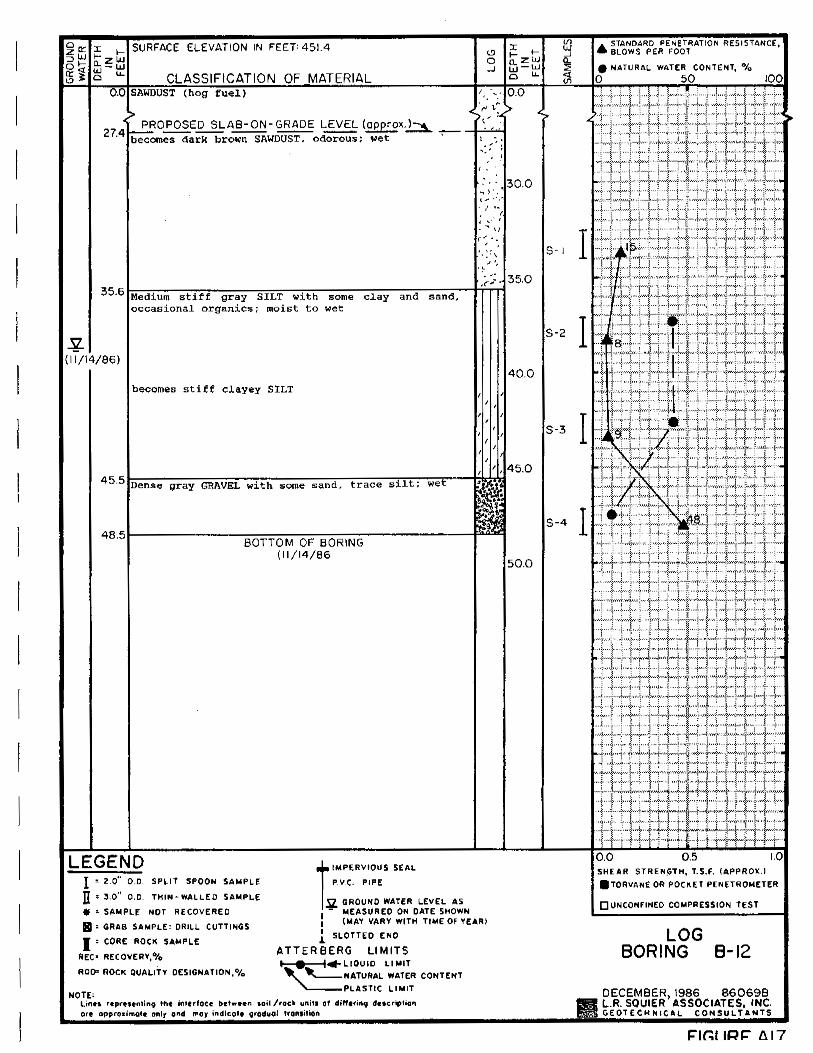
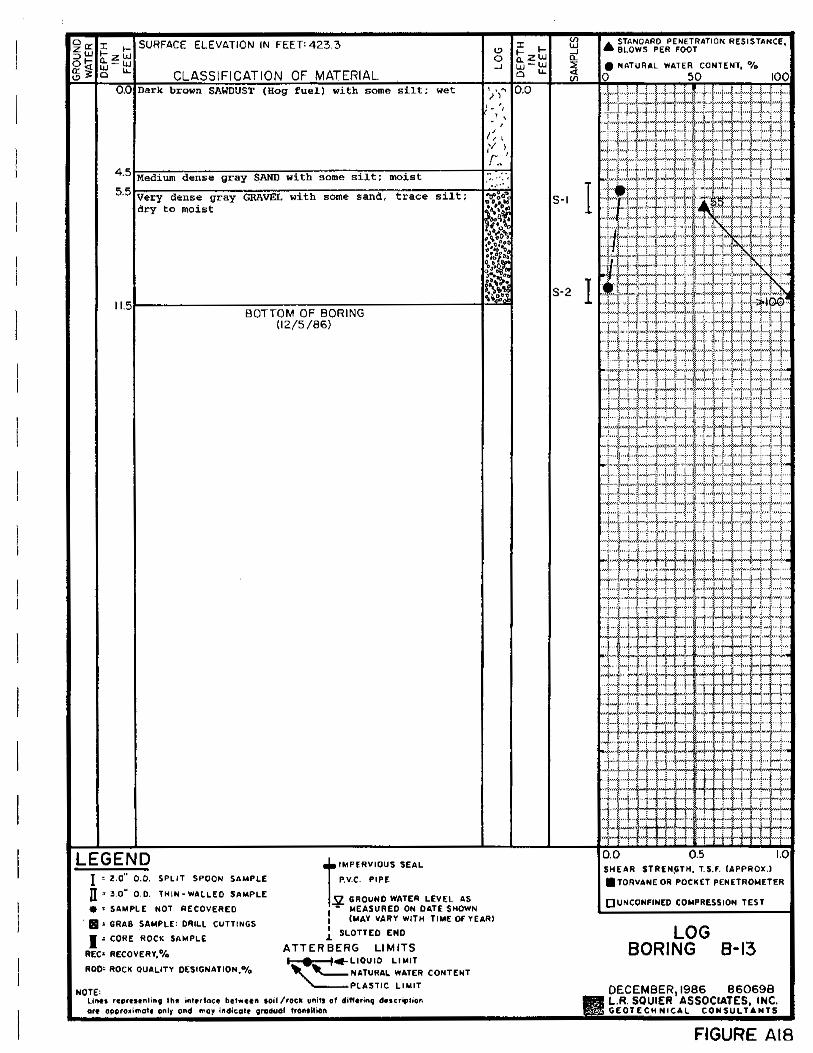

SQUIER: EWEB HEADQUARTERS BORINGS