Embed Size (px)
Citation preview

75
International Journal of
Science and Engineering Investigations vol. 8, issue 84, January 2019
ISSN: 2251-8843 Received on January 21, 2019
Geotechnical Study/Correlation between the CBR Index and the
Young's Modulus of Tatching 1 and Meyomakote Lateritic
Soils-Use in Road Embankment
Manefouet Bertille Ialie 1, Kengne Djatche Stephane
2, Katte Valentine Yato
3
1,2Department of Earth sciences, Faculty of science, University of Dschang, P.O. Box 67 Dschang, West Region, Cameroon
3Department of Civil Engineering and Architecture, NAHPI, The University of Bamenda, P.O. Box 39, Bambili, North West
Region, Cameroon ([email protected], [email protected], [email protected])
Abstract- The present work concerns the geotechnical study and correlation between the California Bearing Ratio (CBR) and the Young's Modulus of the borrow pit lateritic soils of Tatching 1 and Meyomakote, for use in road embankment. From the field eight samples collected, four were from Tatching1 and four from Meyomakote, which were taken to the laboratory for identification tests and characterization tests. The results obtained show that the lateritic gravels of these two zones have similar characteristics. Tatching1 samples show average values of 64.08 % for the LL, 28.25 % for PI, 32.2 % for CBR and a maximum dry density of 2.080 g/cm³; while Meyomakote presents 69.9 % for the LL, 32.8 % for PI, 39.75 % for CBR and a maximum average dry density of 2.083 g/cm³. The lateritic soils of these two zones belong to the class A-2-7 according to the HRB classification, the highly plastic loams according to the LCPC classification and to subclass B6 (sand and gravel clay to very clayey) according to the classification system GTR. These materials can be used in all the pavement layers for all types of traffic (T1 to T5). As a sub-base layer, it can be utilized for traffic class T1 to T3 and base layer, soil cab be improved upon with hydraulic binders (cement, lime). The stress-strain curves were plotted giving an average Young's modulus values of 5208.3 kN/m² and 120.5 kN/m² respectively by punching and by simple compression on the Tatching1 samples; 4062.5 kN/m² and 154.3 kN/m² on the Meyomakote samples. The results show a better correlation between the elastic deformation obtained by punching and the CBR value, compared with simple compression. The resulting regression equation is E (kPa) = 143.46 CBR (%) - 523.72 with a very good coefficient of correlation of R
2= 0.91.
Keywords- Lateritic Gravels, Correlation, Young's Modulus,
CBR, Tatching 1, Meyomakote.
I. INTRODUCTION
Cameroon, like all other tropical countries has a huge reserve of lateritic gravel. These represent about 70 % of the country's surface area (Sikali and Djalal, 1987; Anonymous, 1987). A lateritic gravel is a residual soil of tropical weathering consisting of a mixture of particles (pisolites, concretion or more or less hard nodules and or kidneys of quartz and lateritic
clay of mostly reddish or ocher sometimes gray color), generally dimension between 2 and 20 mm (Bohi, 2008). Lateritic gravel is the most widely used material in road construction in tropical Africa (Nkoumou et al., 2004) and in Cameroon (Sikali and Djalal, 1987). Many African researchers in general (Meissa, 2013; Massamba, 1993; Millogo, 2008; Bohi, 2008) and in particular Cameroonian researchers (Manefouet, 2016; Manefouet and al, 2015; Ekodeck, 1984; Sikali 1986; Sikali et Djalal, 1987; Komtchou, 2009; Mba Nsoe, 2009; Ndzié, 2011; Eyenga, 2011) worked on the geotechnical characterization of laterites used in road construction. These studies so far are generally limited to the identification, more rarely on the study of the deformation. This is truer since most of the road specifications are based on considerations from identification tests, but rarely on purely rheological parameters.
Due to the premature deterioration of pavements with lateritic subbases, a much more rigorous approach must be considered in design with emphasis now on lateritic soil rheological behavior (modulus of electricity) than on identification and characterization. The Young’s modulus and Poisson’s ratio are therefore essential in the dimensioning of pavement structures and these must be evaluated in each lateritic deposit. The purpose of this study therefore is to furnish reliable information on the deformation of pavement materials with emphasis on the determination of the Young’s modulus of Tatching1 and Meyomakote. To achieve this goal, it is necessary to describe the soil profiles of materials and to perform a physico-mechanical characterization of these materials.
II. GENERALITIES
A. Location of the study area
The administrative study area is located in the department of Dja and Lobo, district of Meyomessala, South Cameroon region; and in geographical terms it extends between 2°50' and 3°20' North latitude and between 12°0' and 12°30' East longitude (Figure 1). This district has several villages among which Tatching 1 and Meyomakote where the lateritic borrow pits are located.
International Journal of Science and Engineering Investigations, Volume 8, Issue 84, January 2019 76
www.IJSEI.com Paper ID: 88419-12 ISSN: 2251-8843
Figure 1. Location Map of the Study Area, Administrative Boundaries of Cameroon
B. Methodology of study in the field
As in situ reconnaissance survey was carried out whereby two lateritic burrow pits were identified at Tatching1 and Meyomakote villages. Consequently, eight soil samples were taken from the burrow pits (BW) at mean depths of 1.25 m for Tatching1 and 2.16 m for Meyomakote. These burrow pits were made in the above-mentioned localities, in order to collect the materials that will be characterized and used as for purposes of constructing road works in that locality.Burrow pits have made possible to establish the soil profiles, necessary to describe the soils observed and to collect the disturbed samples. Firstly disturbed samples were collected to the tune of 75 kg per pit and then packed in polyethylene bags per physical and mechanical characterization tests namely – particle size distribution, Atterberg limits, Proctor test, CBR and elastic constant. Secondly, undisturbed soil samples were collected and hermetically sealed in plastic bags for the determination of the natural water content. Table 1 presents the description of soils.
TABLE I. IN-SITU SOIL DESCRIPTION
Trial pits
GPS Coordinates
Depth of investigation (m) Nature Location
BW1-T N32°39’54’’
E19°87’71’’ 0.20-1.50 GLAR Tatching1
BW2-T N32°39’72’’
E19°88’20’’ 0.30-1.60 GLAR Tatching1
BW3-T N32°40’34’’
E19°87’77’’ 0.30-1.50 GLAR Tatching1
BW4-T N32°40’16’’
E19°87’55’’ 0.30-1.50 GLAR Tatching1
BW1-M N33°48’87’’ E19°72’68’’
0.25-2.10 GLAR Méyomakote
BW2-M N33°48’43’’ E19°73’47’’
0.10-2.00 GLAR Méyomakote
BW3-M N33°48’58’’
E19°74’22’’ 0.20-2.30 GLAR Méyomakote
BW4-M N33°49’08’’
E19°73’38’’ 0.15-2.00 GLAR Méyomakote
MeYomakote
Tatching 1
Legend key Sampling points
Type
National roads
Provincial roads
Divisional roads
Access way
Study zone
Meyomessala
Projection system: UTM WGS 84 zone 33N Source: Administrative Boundaries of Cameroon
International Journal of Science and Engineering Investigations, Volume 8, Issue 84, January 2019 77
www.IJSEI.com Paper ID: 88419-12 ISSN: 2251-8843
C. Methodology of study in the laboratory
In the laboratory these samples were subjected to full identification testing and simple compression testing. The purpose of the simple compression test is to trace the stress-strain curve. As a matter of fact, a concrete press was used to determine the deformation as a function of the applied load. This test was carried out on specimens made under the same conditions as that of the 25 shocks CBR test. This in order to bring us as close as possible to the field conditions and to have pairs of points elasticity modulus-CBR, to establish a correlation between Young's modulus (E) and bearing ratio (CBR). The cylindrical test pieces manufactured are based on a removable mold with a diameter of 154 mm and a height of 115 mm.
D. Establishing a Correlation between the Elasticity Modulus
and CBR
Here, the goal is the determination of a correlation of the form E = f (CBR). Two mechanical parameters will be correlated, the CBR lift and the modulus of elasticity E. These two parameters belong to the same class (characterizing all the resistance of the soil). This will make it possible to determine a characteristic when a parameter is known from a reliable relationship established between the two parameters on an experimental basis. The correlation coefficient must be between -1 and 1. For there to be a functional relationship between the two parameters, it is necessary to have a non-zero correlation coefficient. A zero correlation coefficient indicates a lack of correlation. On the other hand, a correlation coefficient between -1 and 1, accounts for the existence of a linear functional relation. However, the determination of the Young's modulus of materials being more complex than that of CBR, a correlation between these two parameters would be of great importance in the design of pavement structures.
III. RESULTS
A. Identitification and caracterisation of materials from
Tatching 1
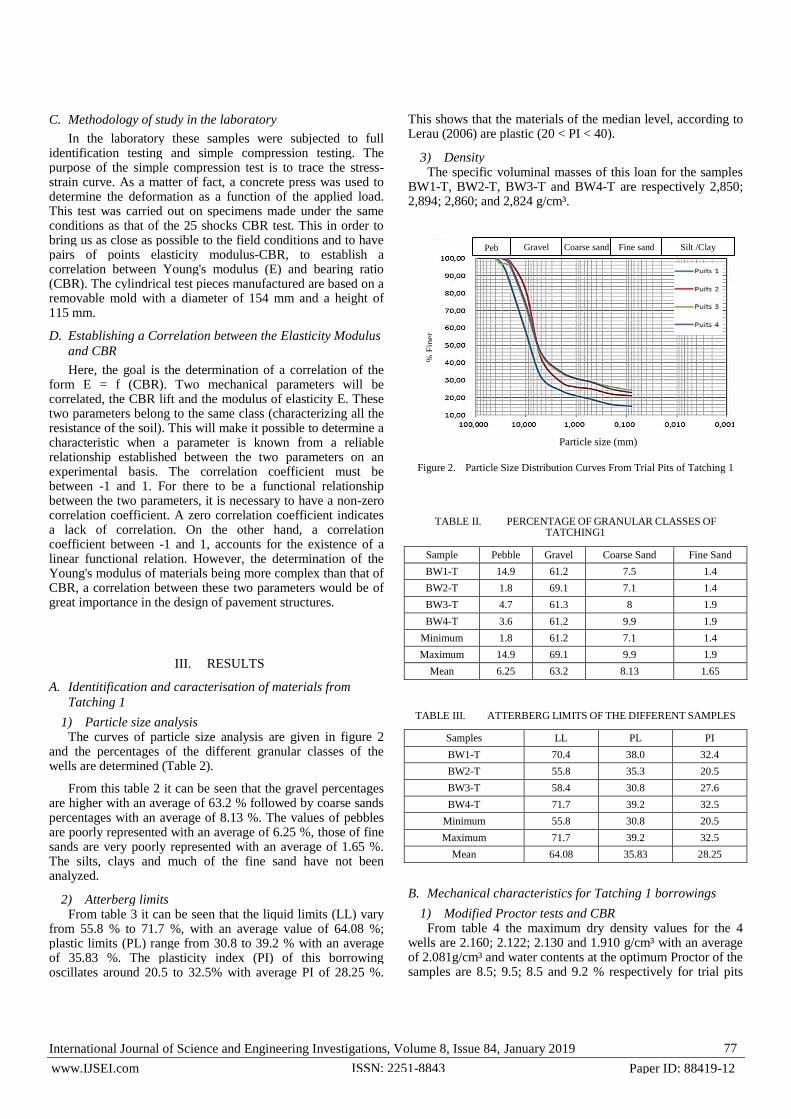
1) Particle size analysis The curves of particle size analysis are given in figure 2
and the percentages of the different granular classes of the wells are determined (Table 2).
From this table 2 it can be seen that the gravel percentages are higher with an average of 63.2 % followed by coarse sands percentages with an average of 8.13 %. The values of pebbles are poorly represented with an average of 6.25 %, those of fine sands are very poorly represented with an average of 1.65 %. The silts, clays and much of the fine sand have not been analyzed.
2) Atterberg limits From table 3 it can be seen that the liquid limits (LL) vary
from 55.8 % to 71.7 %, with an average value of 64.08 %; plastic limits (PL) range from 30.8 to 39.2 % with an average of 35.83 %. The plasticity index (PI) of this borrowing oscillates around 20.5 to 32.5% with average PI of 28.25 %.
This shows that the materials of the median level, according to Lerau (2006) are plastic (20 < PI < 40).
3) Density The specific voluminal masses of this loan for the samples
BW1-T, BW2-T, BW3-T and BW4-T are respectively 2,850; 2,894; 2,860; and 2,824 g/cm³.
Figure 2. Particle Size Distribution Curves From Trial Pits of Tatching 1
TABLE II. PERCENTAGE OF GRANULAR CLASSES OF
TATCHING1
Sample Pebble Gravel Coarse Sand Fine Sand
BW1-T 14.9 61.2 7.5 1.4
BW2-T 1.8 69.1 7.1 1.4
BW3-T 4.7 61.3 8 1.9
BW4-T 3.6 61.2 9.9 1.9
Minimum 1.8 61.2 7.1 1.4
Maximum 14.9 69.1 9.9 1.9
Mean 6.25 63.2 8.13 1.65
TABLE III. ATTERBERG LIMITS OF THE DIFFERENT SAMPLES
Samples LL PL PI
BW1-T 70.4 38.0 32.4
BW2-T 55.8 35.3 20.5
BW3-T 58.4 30.8 27.6
BW4-T 71.7 39.2 32.5
Minimum 55.8 30.8 20.5
Maximum 71.7 39.2 32.5
Mean 64.08 35.83 28.25
B. Mechanical characteristics for Tatching 1 borrowings
1) Modified Proctor tests and CBR From table 4 the maximum dry density values for the 4
wells are 2.160; 2.122; 2.130 and 1.910 g/cm³ with an average of 2.081g/cm³ and water contents at the optimum Proctor of the samples are 8.5; 9.5; 8.5 and 9.2 % respectively for trial pits
Peb
bles
% F
iner
Coarse sand Fine sand Silt /Clay
Particle size (mm)
Gravel

International Journal of Science and Engineering Investigations, Volume 8, Issue 84, January 2019 78
www.IJSEI.com Paper ID: 88419-12 ISSN: 2251-8843
BW1-T, BW2-T, BW3-T and BW4-T with an average of 8.93 %. The CBR value of samples compacted at 95 % are 24.1, 49.8; 22.9 and 31.9 % respectively for samples BW1-T, BW2-T, BW3-T and BW4-T with an average of 32.18 %
TABLE IV. SUMMARY OF TATCHING1 MODIFIED PROCTOR
AND CBR TEST RESULTS
Samples (g/cmᶟ) (%) CBR at 95%
BW1-T 2.160 8.5 24.1
BW2-T 2.122 9.5 49.8
BW3-T 2.130 8.5 22.9
BW4-T 1.910 9.2 31.9
Minimum 1.910 8.5 22.9
Maximum 2.160 9.5 49.8
Average mean 2.081 8.93 32.18
2) Punching test The results of the punching test made it possible to draw
the stress-strain curves (Figure 3).
Figure 3. By Punching to Obtain the Young’s Modulus at Tatching 1
Figure 4. By Compression to Obtain the Young’s Modulus E at Tatching 1
3) Compression test on a concrete press From the series of curves like this (Figures 4 and 5), the
different values of the Young's modulus were calculated and are presented in Table 5.
Table 5 shows the Young's Modulus obtained from punching and compression tests at Tatching 1. From this table, it is noted that the elasticity modulus obtained by punching are much higher than the modulus obtained by compression. Punching Emax is 6250 kN/m² and Emin is 2000 kN/m² for the samples BW1-T and BW2-T respectively, with a mean of 4062.5 kN/m² whereas compression Emax amounts to 300 kN/m² and Emin is equal to 75 kN/m² for samples BW3-T and BW2-T, with an average of 154.3 kN/m².
TABLE V. PRESENTATION OF YOUNG’S MODULE RESULTS OBTAIN
FROM PUNCHING AND COMPRESSION AT TATCHING 1
Test Punching Test (compacted
material at 95 % of MPO)
Compression Test (compacted
material at 95 % of MPO)
Samples Young’s Modulus (kN/m²) Young’s Modulus (kN/m²)
BW1-T 2000 75
BW2-T 6250 116.66
BW3-T 3000 300
BW4-T 5000 125
Maximum 6250 300
Minimum 2000 75
Mean 4062.5 154.3
TABLE VI. SUMMARY OF YOUNG'S MODULUS OBTAINED BY
PUNCHING AND COMPRESSION (TATCHING1)
Samples BW1-T BW2-T BW3-T BW4-T
Young Modulus
(kN/m²)
Punching 2000 6250 3000 5000
Compression 75 116.6 300 125
CBR (%) 24.1 49.8 22.9 31.9
4) Correlation between the Young's modulus obtained
from punching test and compression test on lateritic burrow
pits of Tatching1 To establish correlations between the different parameters,
the linear regression method was used. With the results of the various tests, a cloud of points representing pairs of CBR values and Young's modulus (E) were obtained (CBR-E).
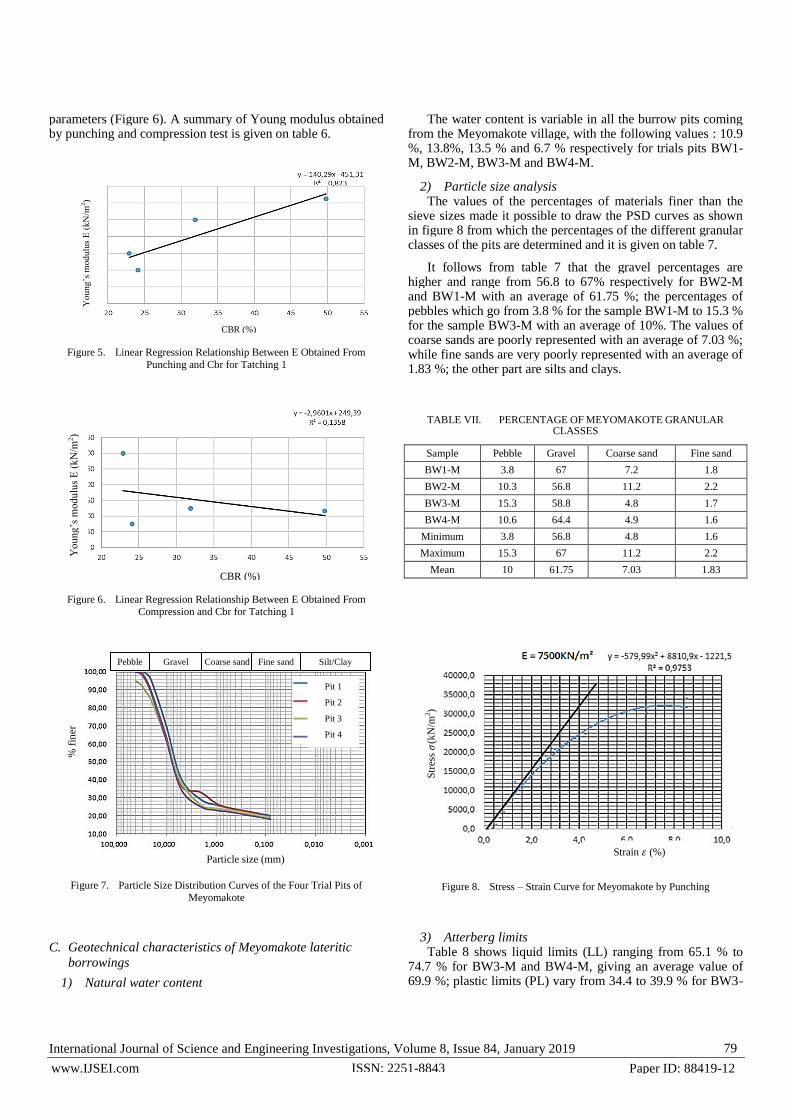
The correlation between the punching Young's modulus and the CBR ratio gives a correlation coefficient of 0.823. This value is close to 1 and consequently admits a satisfactory correlation between these two parameters. The regression equation of the one of the line (figure 6) obtained is given by the expression E = 140.29CBR - 322.09 and is shown in figure 5.
The correlation between the Young's modulus obtained after compression in a press concrete and CBR index gives a correlation coefficient of 0.1358. This is much less than 1. Hence there is no satisfactory relationship between these two
Str
ain
𝜎 (𝑘𝑁/𝑚
2
Strain 𝜀 (%)
International Journal of Science and Engineering Investigations, Volume 8, Issue 84, January 2019 79
www.IJSEI.com Paper ID: 88419-12 ISSN: 2251-8843
parameters (Figure 6). A summary of Young modulus obtained by punching and compression test is given on table 6.
Figure 5. Linear Regression Relationship Between E Obtained From
Punching and Cbr for Tatching 1
Figure 6. Linear Regression Relationship Between E Obtained From
Compression and Cbr for Tatching 1
Figure 7. Particle Size Distribution Curves of the Four Trial Pits of
Meyomakote
C. Geotechnical characteristics of Meyomakote lateritic
borrowings
1) Natural water content
The water content is variable in all the burrow pits coming from the Meyomakote village, with the following values : 10.9 %, 13.8%, 13.5 % and 6.7 % respectively for trials pits BW1-M, BW2-M, BW3-M and BW4-M.
2) Particle size analysis The values of the percentages of materials finer than the
sieve sizes made it possible to draw the PSD curves as shown in figure 8 from which the percentages of the different granular classes of the pits are determined and it is given on table 7.
It follows from table 7 that the gravel percentages are higher and range from 56.8 to 67% respectively for BW2-M and BW1-M with an average of 61.75 %; the percentages of pebbles which go from 3.8 % for the sample BW1-M to 15.3 % for the sample BW3-M with an average of 10%. The values of coarse sands are poorly represented with an average of 7.03 %; while fine sands are very poorly represented with an average of 1.83 %; the other part are silts and clays.
TABLE VII. PERCENTAGE OF MEYOMAKOTE GRANULAR
CLASSES
Sample Pebble Gravel Coarse sand Fine sand
BW1-M 3.8 67 7.2 1.8
BW2-M 10.3 56.8 11.2 2.2
BW3-M 15.3 58.8 4.8 1.7
BW4-M 10.6 64.4 4.9 1.6
Minimum 3.8 56.8 4.8 1.6
Maximum 15.3 67 11.2 2.2
Mean 10 61.75 7.03 1.83
Figure 8. Stress – Strain Curve for Meyomakote by Punching
3) Atterberg limits Table 8 shows liquid limits (LL) ranging from 65.1 % to
74.7 % for BW3-M and BW4-M, giving an average value of 69.9 %; plastic limits (PL) vary from 34.4 to 39.9 % for BW3-
CBR (%)
Young’s
modu
lus
E (
kN
/m2)
Yo
ung
’s m
odu
lus
E (
kN
/m2)
CBR (%)
% f
iner
Particle size (mm)
Pebble Gravel Coarse sand Fine sand Silt/Clay
Pit 1
Pit 2
Pit 3
Pit 4
Str
ess 𝜎
(kN
/m2)
Strain 𝜀 (%)

International Journal of Science and Engineering Investigations, Volume 8, Issue 84, January 2019 80
www.IJSEI.com Paper ID: 88419-12 ISSN: 2251-8843
M and BW4-M with an average of 36.98 %. This borrowing has an index of plasticity (PI) which varies from 29.9 to 34.8 % for BW2-M and BW4-M giving an average PI of 32.85 %.
TABLE VIII. ATTERBERG LIMITS OF THE DIFFERENT
MEYOMAKOTE SAMPLES.
Samples LL PL PI
BW1-M 72.0 38.6 33.4
BW2-M 65.1 35.0 29.9
BW3-M 67.7 34.4 33.3
BW4-M 74.7 39.9 34.8
Minimum 65.1 34.4 29.9
Maximum 74.7 39.9 34.8
Mean 69.9 36.98 32.85
4) Density The density of the burrow pit materials for samples BW1-
M, BW2-M, BW3-M and BW4-M are respectively 2.913, 2.826, 2.878 and 2.755 g/cm³ thus giving an average value of density of 2,843 g/cm³.
D. Mechanical characteristics for Meyomakote borrow pits
1) Modified Proctor tests and CBR Samples from Meyomakote were subjected to modified
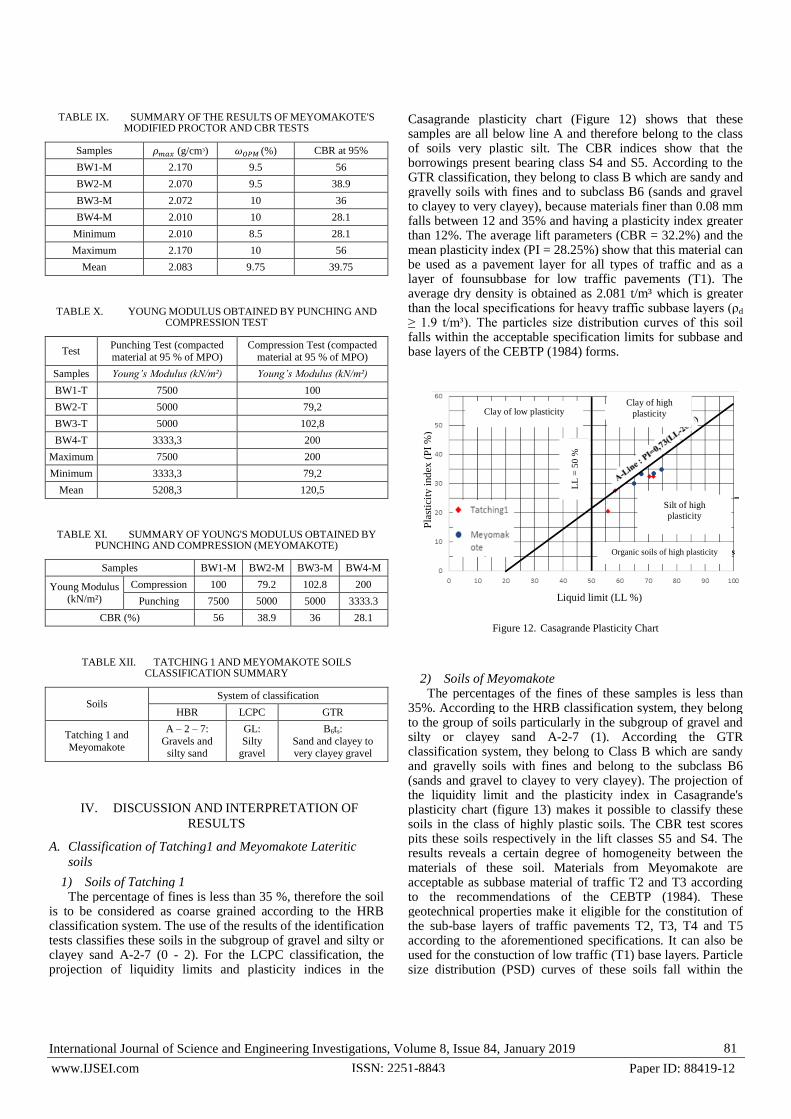
Proctor tests gave densities of 2.170, 2.070; 2,072 and 2.010 g/cm³ and the optimum water contents at the modified Proctor compaction gavde 9.5, 9.5, 10.0 and 10.0 % respectively for samples BW1-M, BW2-M, BW3-M and BW4-M (table 9). The CBR value of samples compacted at 95 % are 56, 38.9, 36 and 28.1% for samples BW1-M, BW2-M, BW3-M and BW4-M.
2) By punching on a CBR press The results of the punching test made it possible to draw
the stress-strain curves (Figure 8).
3) By compression From the series of curves like this (Figures 9 and 10), the
different values of the Young's modulus were calculated and are presented in Table 10.
4) Correlation between Young's modulus obtained by
punching test and compression test The correlation between the Young's modulus E obtained
after compression and the CBR gives the value of the correlation coefficient of 0.3692. This is much less than 1. Implying a poor correlation between E and CBR as shown in Figure 10.
The correlation between the Young's modulus obtained after punching and the CBR gives the correlation coefficient R² of 0.9821 substantially equal to 1. It therefore predicts a satisfactory relationship between these two parameters, namely the Young's modulus E and the CBR. The regression equation obtained is given by the expression E = 144,83CBR- 548,66 and is shown in figure 11.
Figure 9. Stress – Strain Curve for Meyomakote by Compression
Figure 10. Linear Regression Relationship Between E and Cbr Obtained by
Compression (Meyomakote)
Figure 11. Linear Regression Relationship Between E and Cbr Obtained by Punching (Meyomakote)
As summary of the results of Young’s modulus and CBR obtained by both punching and compression testing of Meyomakote lateritic gravels is given on table 11.
Strain 𝜀 (%)
Str
ess 𝜎
(kN
/m2)
Yo
ung
’s m
odu
lus
E (
kN
/m2)
CBR (%)
CBR (%)
Yo
ung
’s m
odu
lus
E (
kN
/m2)
International Journal of Science and Engineering Investigations, Volume 8, Issue 84, January 2019 81
www.IJSEI.com Paper ID: 88419-12 ISSN: 2251-8843
TABLE IX. SUMMARY OF THE RESULTS OF MEYOMAKOTE'S
MODIFIED PROCTOR AND CBR TESTS
Samples (g/cmᶟ) (%) CBR at 95%
BW1-M 2.170 9.5 56
BW2-M 2.070 9.5 38.9
BW3-M 2.072 10 36
BW4-M 2.010 10 28.1
Minimum 2.010 8.5 28.1
Maximum 2.170 10 56
Mean 2.083 9.75 39.75
TABLE X. YOUNG MODULUS OBTAINED BY PUNCHING AND
COMPRESSION TEST
Test Punching Test (compacted material at 95 % of MPO)
Compression Test (compacted material at 95 % of MPO)
Samples Young’s Modulus (kN/m²) Young’s Modulus (kN/m²)
BW1-T 7500 100
BW2-T 5000 79,2
BW3-T 5000 102,8
BW4-T 3333,3 200
Maximum 7500 200
Minimum 3333,3 79,2
Mean 5208,3 120,5
TABLE XI. SUMMARY OF YOUNG'S MODULUS OBTAINED BY
PUNCHING AND COMPRESSION (MEYOMAKOTE)
Samples BW1-M BW2-M BW3-M BW4-M
Young Modulus (kN/m²)
Compression 100 79.2 102.8 200
Punching 7500 5000 5000 3333.3
CBR (%) 56 38.9 36 28.1
TABLE XII. TATCHING 1 AND MEYOMAKOTE SOILS
CLASSIFICATION SUMMARY
Soils System of classification
HBR LCPC GTR
Tatching 1 and
Meyomakote
A – 2 – 7:
Gravels and silty sand
GL:
Silty gravel
B6ts:
Sand and clayey to very clayey gravel
IV. DISCUSSION AND INTERPRETATION OF
RESULTS
A. Classification of Tatching1 and Meyomakote Lateritic
soils
1) Soils of Tatching 1 The percentage of fines is less than 35 %, therefore the soil
is to be considered as coarse grained according to the HRB classification system. The use of the results of the identification tests classifies these soils in the subgroup of gravel and silty or clayey sand A-2-7 (0 - 2). For the LCPC classification, the projection of liquidity limits and plasticity indices in the
Casagrande plasticity chart (Figure 12) shows that these samples are all below line A and therefore belong to the class of soils very plastic silt. The CBR indices show that the borrowings present bearing class S4 and S5. According to the GTR classification, they belong to class B which are sandy and gravelly soils with fines and to subclass B6 (sands and gravel to clayey to very clayey), because materials finer than 0.08 mm falls between 12 and 35% and having a plasticity index greater than 12%. The average lift parameters (CBR = 32.2%) and the mean plasticity index (PI = 28.25%) show that this material can be used as a pavement layer for all types of traffic and as a layer of founsubbase for low traffic pavements (T1). The average dry density is obtained as 2.081 t/m³ which is greater than the local specifications for heavy traffic subbase layers (ρd ≥ 1.9 t/m³). The particles size distribution curves of this soil falls within the acceptable specification limits for subbase and base layers of the CEBTP (1984) forms.
Figure 12. Casagrande Plasticity Chart
2) Soils of Meyomakote The percentages of the fines of these samples is less than
35%. According to the HRB classification system, they belong to the group of soils particularly in the subgroup of gravel and silty or clayey sand A-2-7 (1). According the GTR classification system, they belong to Class B which are sandy and gravelly soils with fines and belong to the subclass B6 (sands and gravel to clayey to very clayey). The projection of the liquidity limit and the plasticity index in Casagrande's plasticity chart (figure 13) makes it possible to classify these soils in the class of highly plastic soils. The CBR test scores pits these soils respectively in the lift classes S5 and S4. The results reveals a certain degree of homogeneity between the materials of these soil. Materials from Meyomakote are acceptable as subbase material of traffic T2 and T3 according to the recommendations of the CEBTP (1984). These geotechnical properties make it eligible for the constitution of the sub-base layers of traffic pavements T2, T3, T4 and T5 according to the aforementioned specifications. It can also be used for the constuction of low traffic (T1) base layers. Particle size distribution (PSD) curves of these soils fall within the
Pla
stic
ity
ind
ex (
PI
%)
Liquid limit (LL %)
LL
= 5
0 %
Clay of low plasticity Clay of high
plasticity
Silt of high
plasticity
Organic soils of high plasticity

International Journal of Science and Engineering Investigations, Volume 8, Issue 84, January 2019 82
www.IJSEI.com Paper ID: 88419-12 ISSN: 2251-8843
acceptable specification limits per subbase and base layer of the CEBTP (1984) norms.
In general terms, the Tatching1 and Meyomakote borrowings belong to Class B which are sandy and gravelly soils with fines and to subclass B6 (sands and gravel to clay to very clay). The statement by Bagarre (1990) that almost all lateritic gravels are in class B6 (D < 50 mm, percentage of fines between 12 and 35%, PI > 10) is verified.
B. Proposal for an optimal use of these soils in road
construction : Use for paved roads
1) Use as subgrade The soils from these two localities have mean CBR indices
between 32.2 and 39.75 %. The proportion of fines averages between 20.78 and 19.4 % for Tatching1 and Meyomakote respectively shows their ability to withstand water (GTR, 1992). The soils of these localities can all be used as a subgrade layer because their average lift is much higher than the values retained, which are respectively 10 % and 15 % in Cameroon, Côte d'Ivoire and Senegal (Jikolum, 2011). Also these soils can be used for medium to high lift embankments.
2) Use as a sub-base layer In Cameroon, the condition to be fulfilled by a soil to be
eligible for a subbase is that of having a lift greater than or equal to 30 % (Sikali et al., 1986). Thus the soils of Tatching 1 and Meyomakote studied can be used in road construction as a sub-base, because their average CBR is greater than 30 %. However, apart from the lift criterion, the CEBTP (1984) requirements for the conditions for use as a subbase are also based on the parameters influencing the behavior of the structure (Table 13). In view of these recommendations, the soils studied have average values of CBR and maximum dry density and percentage of fines that meet CEBTP recommendations. The PI values are higher than the CEBTP recommendations. But considering their lift they are usable, as a foundation sub-base layer. In addition, the particle size distribution curves of these materials (figure 14 and figure 15) are nearly well within the particle size limits of the CEBTP (1984) norms. Therefore, the lateritic gravel from the Tatching1 and Meyomakote localities can be used as a sub-base layer for traffic loadings T1 to T3.
3) Use as a base layer For use as a base layer, the soil must, according to the
specifications of the CEBTP (1984), have a dry density at the optimum greater than or equal to 2 g/cm
3, a liquidity limit of
less than or equal to 25 %, a minimum plasticity index less than or equal to 15 % and linear swelling less than or equal to 0.3%. Also grain size curves must be within the limits as prescribed by the CEBTP (1984) (table 14).
Given the CEBTP (1984) specifications in the table above, the value of the CBR lift index and the plasticity index does not meet these specifications; the values of the maximum dry densities are higher than the recommended one. Also, the particle size distribution curves of the studied samples (figures 16 and 17) falls within the CEBTP (1984) limits of particle size distribution. These materials can be used as a base layer if the above parameters are improved with compounds such as hydraulic binders (cement, lime, volcanic ash).
Figure 13. Comparison Between the Sub-Base Layer Specification Zone and
TATCHING1 Particle Size Analysis Curves
Figure 14. Comparison Between the Sub-Base Layer Specification Zone and
Meyomakote Particle Size Analysis Curves
Figure 15. Comparison Between the Sub-Base Layer Specification Zone and
Meyomakote Particle Size Analysis Curves
Figure 16. Comparison Between the Base Layer Specification Zone and
Meyomakote Particle Size Analysis Curves
Particle size (mm)
% F
iner
Pit 1
Pit 2
Pit 3
Pit 4
Particle size (mm)
% F
iner
Pit 1
Pit 2
Pit 3
Pit 4
% F
iner
Particle size (mm)
Pit 1
Pit 2
Pit 3
Pit 4
Particle size (mm)
% F
iner
Pit 1
Pit 2
Pit 3
Pit 4

International Journal of Science and Engineering Investigations, Volume 8, Issue 84, January 2019 83
www.IJSEI.com Paper ID: 88419-12 ISSN: 2251-8843
Figure 17. General Correlation of the Young’s Modulus Obtained by Punching on the Materials of TATCHING1 and Meyomakote
Figure 18. General Correlation of the Young’s Modulus Obtained by
Compression on the Materials of TATCHING1 and Meyomakote
TABLE XIII. COMPARISON OF THE CHARACTERISTICS OF THE
SOIL FROM TATCHING 1 AND MEYOMAKOTE TO THE
SPECIFICATIONS OF THE CEBTP (1984) FOR SUB-BASE LAYER
Mean Characteristics
of the Soils of:
CBR at
95%
ρd (g/cm³)
at OMC PI (%)
Percent Finer than
0,08mm (%)
Tatching1 32,2 2,081 28,3 20,77
Meyomakote 39,75 2,083 32,87 19,4
Specifications of
CEBTP (1984) ≥ 30 ≥ 1,80 ≤ 25 ≤ 35
TABLE XIV. COMPARISON OF THE CHARACTERISTICS OF THE
SOIL FROM TATCHING1 AND MEYOMAKOTE TO THE
SPECIFICATIONS OF THE CEBTP (1984) FOR THE BASE LAYER.
Mean Characteristics of
the Soils of:
CBR at
95%
ρd (g/cm³) of
OPM PI (%)
Passer-by 0,08
mm (%)
Tatching1 32,2 2 ,081 28,25 20,77
Meyomakote 39,75 2,083 32,87 19,4
Specification of CEBTP
(1984) ≥ 80 ≥ 2 ≤ 15 ≤ 20
C. General correlation of the Young modulus - CBR on soils
of Tatching 1 and Meyomakote
1) Correlation between Punched Young's Modulus and
CBRs The parameter values of the lift index (CBR) and the
Young's modulus (E) obtained by the punching test on the materials of Tatching 1 and Meyomakote will make it possible to establish a general correlation (Figure 17).
2) Correlation between Compression Young Modulus and
CBR The correlation of the soils of these two localities gives a
correlation coefficient (R²) of 0.9056 by Punching. This value is very close to 1, which is indicative of a satisfactory relationship between these two parameters. The equation of the line obtained (figure 17) makes it possible to write the relation E = 143.46CBR - 523.72
The correlation between the set of Young modulus obtained by compression and the set of CBR indices of Tatching 1 and Meyomakote gives a correlation coefficient (R²) of 0.227 (Figure 18). This is much less than 1, which is therefore indicative of a poor correlation relationship between these two parameters.
Punching correlation is of greater advantage because punching enters the principle of the CBR test. And the relationship obtained is satisfying and encouraging.
Thus, the confrontation of the geotechnical properties with the specifications of use of materials in road geotechnics in the tropical countries made it possible to evaluate the conditions of valorization of the various soils studied in road construction. Considering the specifications for the use of lateritic gravel in Cameroon in road construction, the soils from Tatching1 and Meyomakote are recommended for pavements layers of paved and unpaved roads with improvements (hydraulic binders) according to the type of traffic.
V. V. CONCLUSION
Having come to the end of this work, it was necessary to make available reliable information on the deformation of pavement materials, with emphasis on the Young's elasticity moduli of Tatching1 and Meyomakote lateritic borrowings. The results obtained in the laboratory show that the lateritic gravels of these two localities are very plastic loamy soils of classes A-2-7. The average liquid limits for these soils are 64.08 % and 69.9 % with plasticity indices of 28.25 and 32.87 % respectively for materials from Tatching1 and Meyomakote. The water contents at the modified Proctor optimum are 8.93 and 9.75 % for the dry densities of 2.080 and 2.083 g/cm³. The average values of CBR are 32.2 % and 39.75 %. They can therefore be used as a sub-base layers for traffic from T1 to T3. The grain size curves do not fit into the particle size range required for the foundation layers, but are integrated in the particle size zone indicated for the base layers. However, because of their CBR less than 80 %, the optimization of their use as base layer material requires an improvement of this
Yo
ung
’s m
odu
lus
E (
kN
/m2)
CBR (%)
Yo
ung
’s m
odu
lus
E (
kN
/m2)
CBR (%)

International Journal of Science and Engineering Investigations, Volume 8, Issue 84, January 2019 84
www.IJSEI.com Paper ID: 88419-12 ISSN: 2251-8843
parameter by using hydraulic binders (cement, lime and volcanic ash).
The determination of the Young's moduli on the materials of these localities made it possible to establish a relation between the CBR indices and the moduli of elasticities. Upon careful observation, it evident that the relations between the Young's moduli (E) obtained on the materials after punching gives a satisfactory relation with the CBR E = 143.46CBR – 523.72 because correlation coefficient is close to 1 (R² = 0.9056), whereas those of the Young’s modulus E obtained after compression a poor correlation because the correlation coefficients are much lower than 1.
Having come to the end of this work and given the importance of the results obtained which is the correlation of CBR - E relationship, we propose that similar studies be carried in other localities so as to have a significant database.
ACKNOWLEDGMENT
The laboratory tests procedures were carried at INFRA-SOL Yaounde.
REFERENCES
Anonyme, 1987. Recommandation pour l’utilisation en corps de [1]chaussée des graveleux latéritiques naturels. Bulletin du Ministère de l’équipement. Direction des études générales et de la normalisation. Cameroun, 44p.
Bohi Z. P., 2008. Caractérisation des sols latéritiques utilisés en [2]construction routière : cas de la région de l’Agnéby (Côte d’Ivoire). PhD thesis, Ecole Nationale des Ponts et Chaussées. France, 124 pages + Annex.
CEBTP (Centre Expérimental de Recherche et d’Etude du Bâtiment et [3]des Travaux Publics), 1984. Guide pratique pour le dimensionnement des chaussées pour les pays tropicaux, Ministère Français de la coopération, France 157p.
Ekodeck G. E., 1984. L’altération des roches métamorphiques du Sud [4]Cameroun et ses aspects géotechniques. State Doctorate Thesis, University of Grenoble, France, 368 p.
Eyenga P., 2011. Caractérisation géotechnique des produits d’altération [5]sur quartzites micacés de Sa’a (Centre Cameroun). Master’s Degree thesis, Faculté of Science. University of. Yaounde I, 81 p
Komtchou K.S., 2009. Estimation de la perte de graveleux latéritiques [6]utilisés en couche de roulement. Application au tronçon routier Etoudi-Nkolbong dans la zone Nord-Est de yaoundé. D.E.A. Thesis, University of Yaounde I, 83p.
Manefouet B.I., 2016. Caractérisation altérologique et géotechniques des [7]argiles et graveleux latéritiques de la zone basse du versant Sud des
Monts Bambouto (Ouest Cameroun) – Traitement aux liants hydrauliques. Thèse de doctorat. Université de Yaoundé 1.
Manefouet B. I., Kamgang V. and Mvondo O. J., 2015. Geotechnical [8]application of the alterology of an effusif rock and a foundation rocks in the lower area of the southern side of bambouto mountains (west cameroon). International Journal of Geology, Earth & Environmental Sciences, Vol. 5 (1) January-April, pp. 29-39.
Massamba M., 1993. Contributions à l’étude des sols latéritiques du [9]Sénégal et du Brésil. PhD Thesis, University of Paris-East, 163p.
Mba Nsoe C., 2009. Caractérisation géotechnique des produits [10]d’altération sur les schistes d’Ayos. D.I.P.E.S II Thesis, Higher Teacher Training College, University of Yaounde I, 59p.
Meïssa Fall., 1993. Identification et caractérisation mécanique de [11]graveleux latéritiques du Sénégal : application au domaine routier. PhD Thesis, National Higher Collage of Géology of Nancy, France 240p.
Millogo Y., 2008. Etude géotechnique, chimique et minéralogique de [12]matières premières argileuse et latéritique du Burkina Faso améliorées aux liants hydrauliques : application au génie civil (bâtiment et route). PhD Thesis, University of Ouagadougou. 144p.
Ndzié M.A., 2011. Caractérisation pétrologique et géotechnique des [13]roches et des graveleux latéritiques de la région de Batchenga (Centre Cameroun) en vue de leur utilisation en construction routière. Master Degree Thesis, University of Yaoundé I, 80p.
Nkoumou A. J., Mouhamadou B. D., Fary D., Parisot J. C. and Ndiane [14]D., 2004. Étude corrélative entre les propriétés géochimiques et les caractéristiques géomécaniques des latérites. Journal des Sciences et Technologies, Vol. 3, N° 1 et 2, 1- 4p.
Sikali and Djala., 1987. Utilisation des latérites en technique routière au [15]Cameroun. Journal of Labogénie, N° 16 february 1988, pp.277-288.
Sikali F., 1979. Caractéristiques et comportement élasto-plastique d’une [16]latérite pour son utilisation en couche de chaussée. Doctorate Thesis, 3rd cycle, University of Yaounde I, Cameroon, 214p.
Dr. Manefouet Bertille Ilalie; She still an Lecturer –
Researcher, Department of Earth Science at Dschang
University in Cameroon. Her field of study:
Geological Engineering and Alterology. Her major
areas of interests are: Geotechnic, Hydrotechnic, Soil
mechanic, Projects management.
How to Cite this Article:
Ialie, M. B., Stephane, K. D., & Yato, K. V. (2019).
Geotechnical Study / Correlation between the CBR Index and the Young's Modulus of Tatching 1 and Meyomakote
Lateritic Soils - Use in Road Embankment. International
Journal of Science and Engineering Investigations (IJSEI), 8(84), 75-84. http://www.ijsei.com/papers/ijsei-88419-12.pdf