Embed Size (px)
Citation preview
Benchmark for Performance: GeothermalApplications in Lincoln PublicSchools
John A. ShonderMember ASHRAE
Michaela A. Martin, P.E.Member ASHRAE
Terry R. Sharp, P.E.Member ASHRAE
David J. Durfee Patrick J. Hughes, P.E.Member ASHRAE
ABSTRACT
Vertical-bore, geothermal heat pumps (GHPs) havebeen providing heating and cooling to four new elementaryschools located in Lincoln, Nebraska since 1995. Accordingto representatives of the local utility and school district, thesystems are providing a comfortable, complaint-free environ-ment with utility costs that are nearly half of that of otherschools in the district. Performance data collected fromon-site energy management systems and district billing andutility records for all fifty schools in the Lincoln district indi-cate that only five consume less energy than the bestperforming GHP school; however, these five cool less than10% of their total floor area, while the GHP schools cool100% of their floor area. When compared to other newschools (with similar ventilation loads), the GHP schoolsused approximately 26% less source energy per square footof floor area. Variations in annual energy performance areevident amongst the four GHP schools, however, togetherthey still consume less source energy than 70% of all schoolsin the district. These variations are most likely due to opera-tional differences rather than installed equipment, buildingorientation, or environmental (bore field) conditions.
INTRODUCTION
Currently, there are over 400 installations of geothermalheat pump~GHPs! systems located at public school facilities
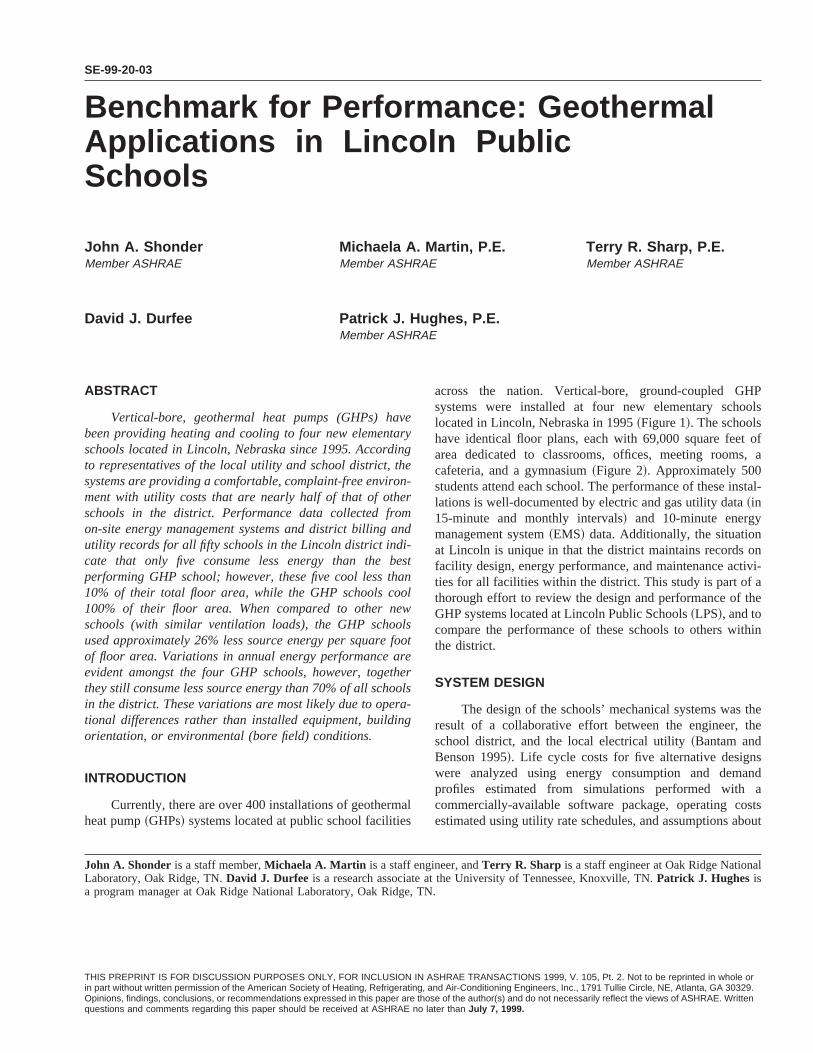
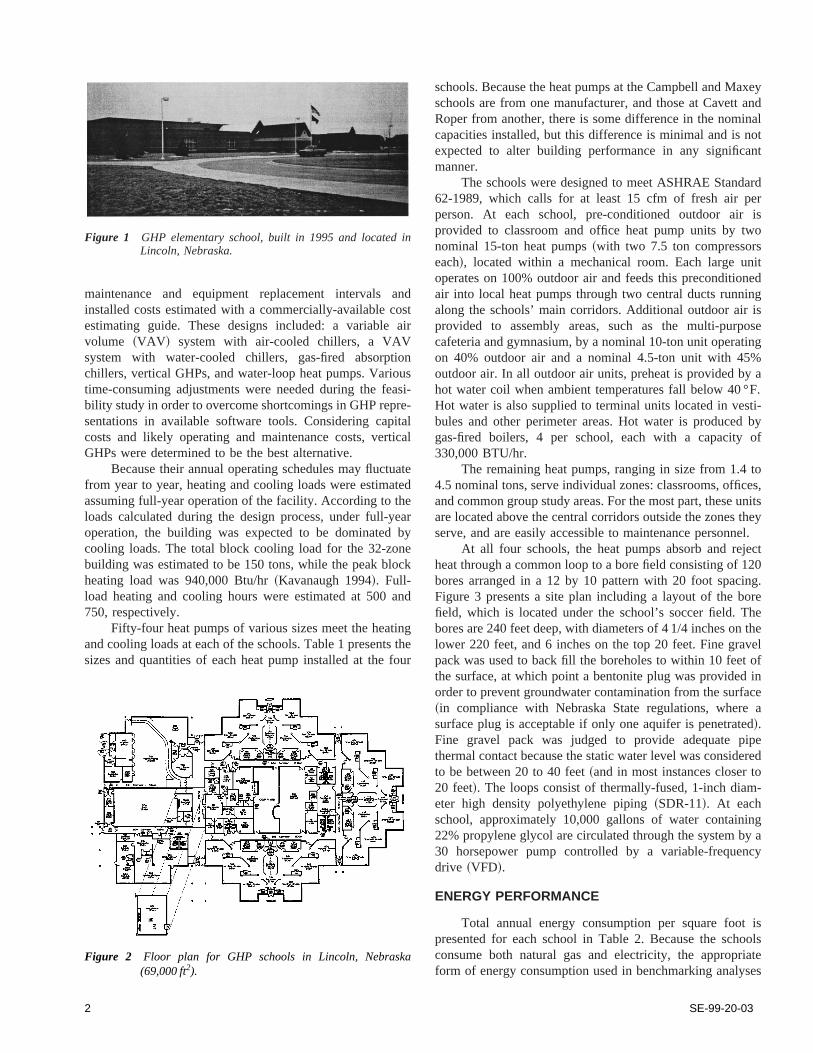
across the nation. Vertical-bore, ground-coupled GHPsystems were installed at four new elementary schoolslocated in Lincoln, Nebraska in 1995~Figure 1!. The schoolshave identical floor plans, each with 69,000 square feet ofarea dedicated to classrooms, offices, meeting rooms, acafeteria, and a gymnasium~Figure 2!. Approximately 500students attend each school. The performance of these instal-lations is well-documented by electric and gas utility data~in15-minute and monthly intervals! and 10-minute energymanagement system~EMS! data. Additionally, the situationat Lincoln is unique in that the district maintains records onfacility design, energy performance, and maintenance activi-ties for all facilities within the district. This study is part of athorough effort to review the design and performance of theGHP systems located at Lincoln Public Schools~LPS!, and tocompare the performance of these schools to others withinthe district.
SYSTEM DESIGN
The design of the schools’ mechanical systems was theresult of a collaborative effort between the engineer, theschool district, and the local electrical utility~Bantam andBenson 1995!. Life cycle costs for five alternative designswere analyzed using energy consumption and demandprofiles estimated from simulations performed with acommercially-available software package, operating costsestimated using utility rate schedules, and assumptions about
John A. Shonder is a staff member,Michaela A. Martin is a staff engineer, andTerry R. Sharp is a staff engineer at Oak Ridge NationalLaboratory, Oak Ridge, TN.David J. Durfee is a research associate at the University of Tennessee, Knoxville, TN.Patrick J. Hughes isa program manager at Oak Ridge National Laboratory, Oak Ridge, TN.
SE-99-20-03
THIS PREPRINT IS FOR DISCUSSION PURPOSES ONLY, FOR INCLUSION IN ASHRAE TRANSACTIONS 1999, V. 105, Pt. 2. Not to be reprinted in whole orin part without written permission of the American Society of Heating, Refrigerating, and Air-Conditioning Engineers, Inc., 1791 Tullie Circle, NE, Atlanta, GA 30329.Opinions, findings, conclusions, or recommendations expressed in this paper are those of the author(s) and do not necessarily reflect the views of ASHRAE. Writtenquestions and comments regarding this paper should be received at ASHRAE no later than July 7, 1999.
maintenance and equipment replacement intervals andinstalled costs estimated with a commercially-available costestimating guide. These designs included: a variable airvolume ~VAV ! system with air-cooled chillers, a VAVsystem with water-cooled chillers, gas-fired absorptionchillers, vertical GHPs, and water-loop heat pumps. Varioustime-consuming adjustments were needed during the feasi-bility study in order to overcome shortcomings in GHP repre-sentations in available software tools. Considering capitalcosts and likely operating and maintenance costs, verticalGHPs were determined to be the best alternative.
Because their annual operating schedules may fluctuatefrom year to year, heating and cooling loads were estimatedassuming full-year operation of the facility. According to theloads calculated during the design process, under full-yearoperation, the building was expected to be dominated bycooling loads. The total block cooling load for the 32-zonebuilding was estimated to be 150 tons, while the peak blockheating load was 940,000 Btu/hr~Kavanaugh 1994!. Full-load heating and cooling hours were estimated at 500 and750, respectively.
Fifty-four heat pumps of various sizes meet the heatingand cooling loads at each of the schools. Table 1 presents thesizes and quantities of each heat pump installed at the four
schools. Because the heat pumps at the Campbell and Maxeyschools are from one manufacturer, and those at Cavett andRoper from another, there is some difference in the nominalcapacities installed, but this difference is minimal and is notexpected to alter building performance in any significantmanner.
The schools were designed to meet ASHRAE Standard62-1989, which calls for at least 15 cfm of fresh air perperson. At each school, pre-conditioned outdoor air isprovided to classroom and office heat pump units by twonominal 15-ton heat pumps~with two 7.5 ton compressorseach!, located within a mechanical room. Each large unitoperates on 100% outdoor air and feeds this preconditionedair into local heat pumps through two central ducts runningalong the schools’ main corridors. Additional outdoor air isprovided to assembly areas, such as the multi-purposecafeteria and gymnasium, by a nominal 10-ton unit operatingon 40% outdoor air and a nominal 4.5-ton unit with 45%outdoor air. In all outdoor air units, preheat is provided by ahot water coil when ambient temperatures fall below 40 °F.Hot water is also supplied to terminal units located in vesti-bules and other perimeter areas. Hot water is produced bygas-fired boilers, 4 per school, each with a capacity of330,000 BTU/hr.
The remaining heat pumps, ranging in size from 1.4 to4.5 nominal tons, serve individual zones: classrooms, offices,and common group study areas. For the most part, these unitsare located above the central corridors outside the zones theyserve, and are easily accessible to maintenance personnel.
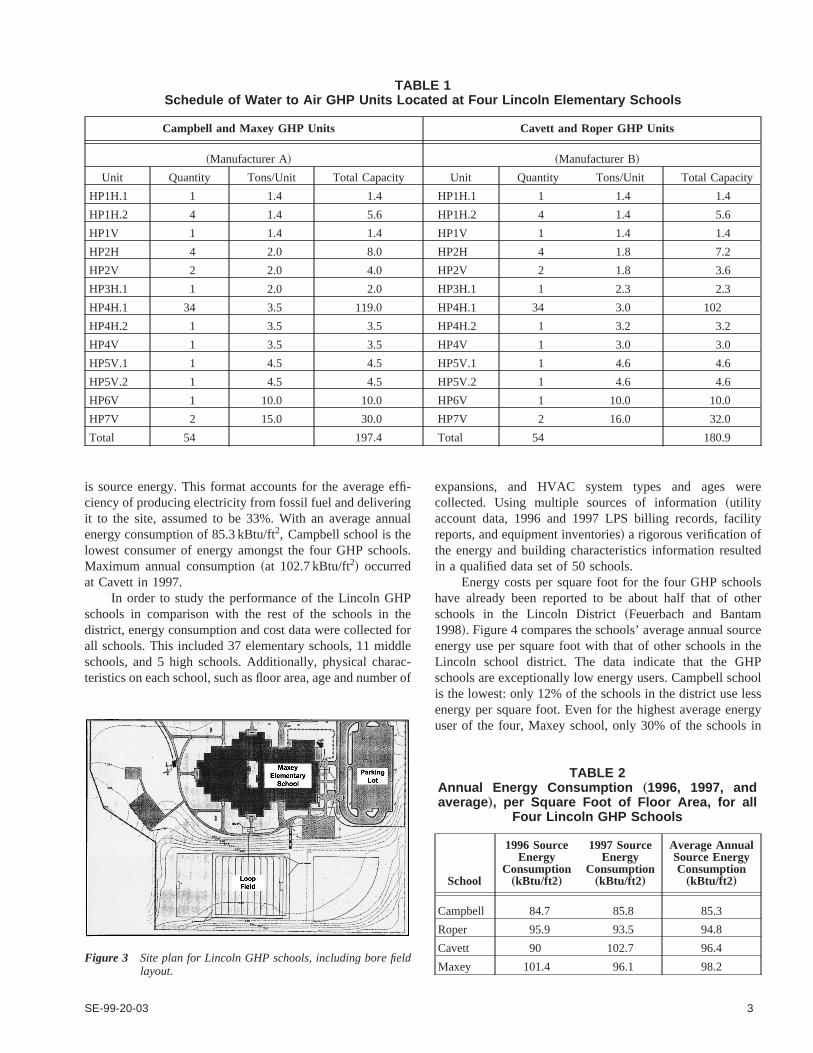
At all four schools, the heat pumps absorb and rejectheat through a common loop to a bore field consisting of 120bores arranged in a 12 by 10 pattern with 20 foot spacing.Figure 3 presents a site plan including a layout of the borefield, which is located under the school’s soccer field. Thebores are 240 feet deep, with diameters of 4 1/4 inches on thelower 220 feet, and 6 inches on the top 20 feet. Fine gravelpack was used to back fill the boreholes to within 10 feet ofthe surface, at which point a bentonite plug was provided inorder to prevent groundwater contamination from the surface~in compliance with Nebraska State regulations, where asurface plug is acceptable if only one aquifer is penetrated!.Fine gravel pack was judged to provide adequate pipethermal contact because the static water level was consideredto be between 20 to 40 feet~and in most instances closer to20 feet!. The loops consist of thermally-fused, 1-inch diam-eter high density polyethylene piping~SDR-11!. At eachschool, approximately 10,000 gallons of water containing22% propylene glycol are circulated through the system by a30 horsepower pump controlled by a variable-frequencydrive ~VFD!.
ENERGY PERFORMANCE
Total annual energy consumption per square foot ispresented for each school in Table 2. Because the schoolsconsume both natural gas and electricity, the appropriateform of energy consumption used in benchmarking analyses
Figure 1 GHP elementary school, built in 1995 and located inLincoln, Nebraska.
Figure 2 Floor plan for GHP schools in Lincoln, Nebraska(69,000 ft2).
2 SE-99-20-03
is source energy. This format accounts for the average effi-ciency of producing electricity from fossil fuel and deliveringit to the site, assumed to be 33%. With an average annualenergy consumption of 85.3 kBtu/ft2, Campbell school is thelowest consumer of energy amongst the four GHP schools.Maximum annual consumption~at 102.7 kBtu/ft2! occurredat Cavett in 1997.
In order to study the performance of the Lincoln GHPschools in comparison with the rest of the schools in thedistrict, energy consumption and cost data were collected forall schools. This included 37 elementary schools, 11 middleschools, and 5 high schools. Additionally, physical charac-teristics on each school, such as floor area, age and number of
expansions, and HVAC system types and ages werecollected. Using multiple sources of information~utilityaccount data, 1996 and 1997 LPS billing records, facilityreports, and equipment inventories! a rigorous verification ofthe energy and building characteristics information resultedin a qualified data set of 50 schools.
Energy costs per square foot for the four GHP schoolshave already been reported to be about half that of otherschools in the Lincoln District~Feuerbach and Bantam1998!. Figure 4 compares the schools’ average annual sourceenergy use per square foot with that of other schools in theLincoln school district. The data indicate that the GHPschools are exceptionally low energy users. Campbell schoolis the lowest: only 12% of the schools in the district use lessenergy per square foot. Even for the highest average energyuser of the four, Maxey school, only 30% of the schools in
Figure 3 Site plan for Lincoln GHP schools, including bore fieldlayout.
TABLE 1Schedule of Water to Air GHP Units Located at Four Lincoln Elementary Schools
Campbell and Maxey GHP Units Cavett and Roper GHP Units
~Manufacturer A! ~Manufacturer B!
Unit Quantity Tons/Unit Total Capacity Unit Quantity Tons/Unit Total Capacity
HP1H.1 1 1.4 1.4 HP1H.1 1 1.4 1.4
HP1H.2 4 1.4 5.6 HP1H.2 4 1.4 5.6
HP1V 1 1.4 1.4 HP1V 1 1.4 1.4
HP2H 4 2.0 8.0 HP2H 4 1.8 7.2
HP2V 2 2.0 4.0 HP2V 2 1.8 3.6
HP3H.1 1 2.0 2.0 HP3H.1 1 2.3 2.3
HP4H.1 34 3.5 119.0 HP4H.1 34 3.0 102
HP4H.2 1 3.5 3.5 HP4H.2 1 3.2 3.2
HP4V 1 3.5 3.5 HP4V 1 3.0 3.0
HP5V.1 1 4.5 4.5 HP5V.1 1 4.6 4.6
HP5V.2 1 4.5 4.5 HP5V.2 1 4.6 4.6
HP6V 1 10.0 10.0 HP6V 1 10.0 10.0
HP7V 2 15.0 30.0 HP7V 2 16.0 32.0
Total 54 197.4 Total 54 180.9
TABLE 2Annual Energy Consumption „1996, 1997, andaverage …, per Square Foot of Floor Area, for all
Four Lincoln GHP Schools
School
1996 SourceEnergy
Consumption„kBtu/ft2 …
1997 SourceEnergy
Consumption„kBtu/ft2 …
Average AnnualSource EnergyConsumption„kBtu/ft2 …
Campbell 84.7 85.8 85.3
Roper 95.9 93.5 94.8
Cavett 90 102.7 96.4
Maxey 101.4 96.1 98.2
SE-99-20-03 3
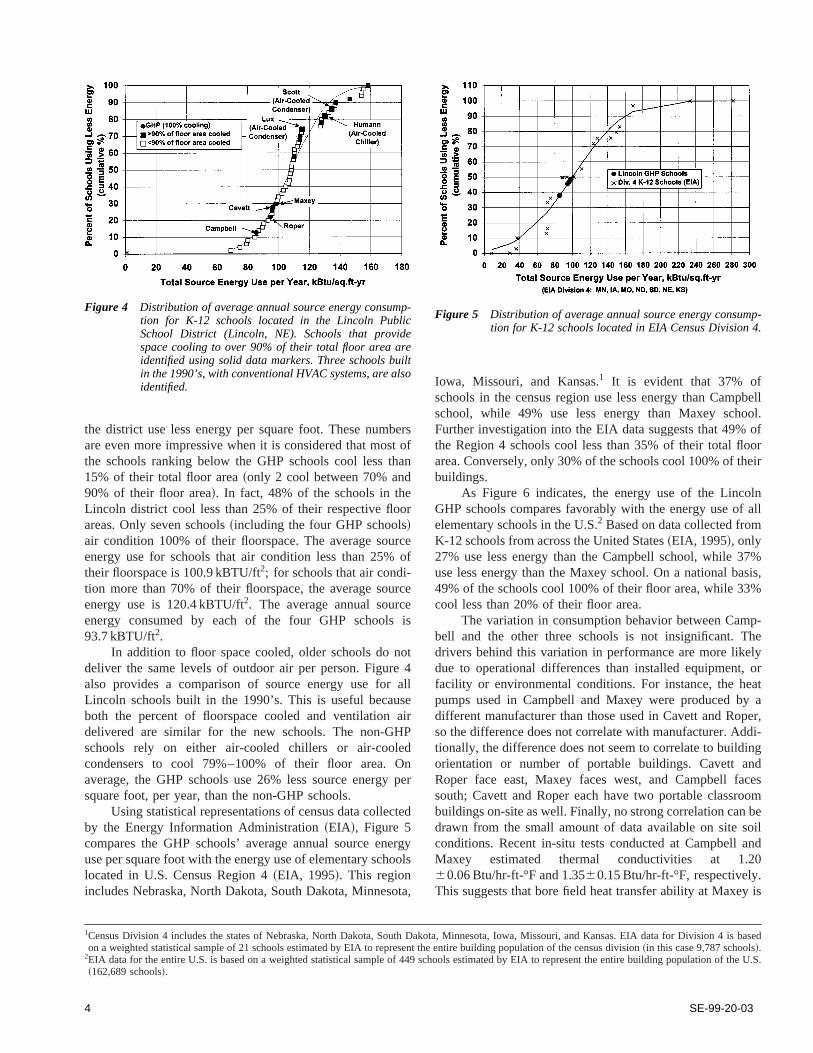
the district use less energy per square foot. These numbersare even more impressive when it is considered that most ofthe schools ranking below the GHP schools cool less than15% of their total floor area~only 2 cool between 70% and90% of their floor area!. In fact, 48% of the schools in theLincoln district cool less than 25% of their respective floorareas. Only seven schools~including the four GHP schools!air condition 100% of their floorspace. The average sourceenergy use for schools that air condition less than 25% oftheir floorspace is 100.9 kBTU/ft2; for schools that air condi-tion more than 70% of their floorspace, the average sourceenergy use is 120.4 kBTU/ft2. The average annual sourceenergy consumed by each of the four GHP schools is93.7 kBTU/ft2.
In addition to floor space cooled, older schools do notdeliver the same levels of outdoor air per person. Figure 4also provides a comparison of source energy use for allLincoln schools built in the 1990’s. This is useful becauseboth the percent of floorspace cooled and ventilation airdelivered are similar for the new schools. The non-GHPschools rely on either air-cooled chillers or air-cooledcondensers to cool 79%–100% of their floor area. Onaverage, the GHP schools use 26% less source energy persquare foot, per year, than the non-GHP schools.
Using statistical representations of census data collectedby the Energy Information Administration~EIA!, Figure 5compares the GHP schools’ average annual source energyuse per square foot with the energy use of elementary schoolslocated in U.S. Census Region 4~EIA, 1995!. This regionincludes Nebraska, North Dakota, South Dakota, Minnesota,
Iowa, Missouri, and Kansas.1 It is evident that 37% ofschools in the census region use less energy than Campbellschool, while 49% use less energy than Maxey school.Further investigation into the EIA data suggests that 49% ofthe Region 4 schools cool less than 35% of their total floorarea. Conversely, only 30% of the schools cool 100% of theirbuildings.
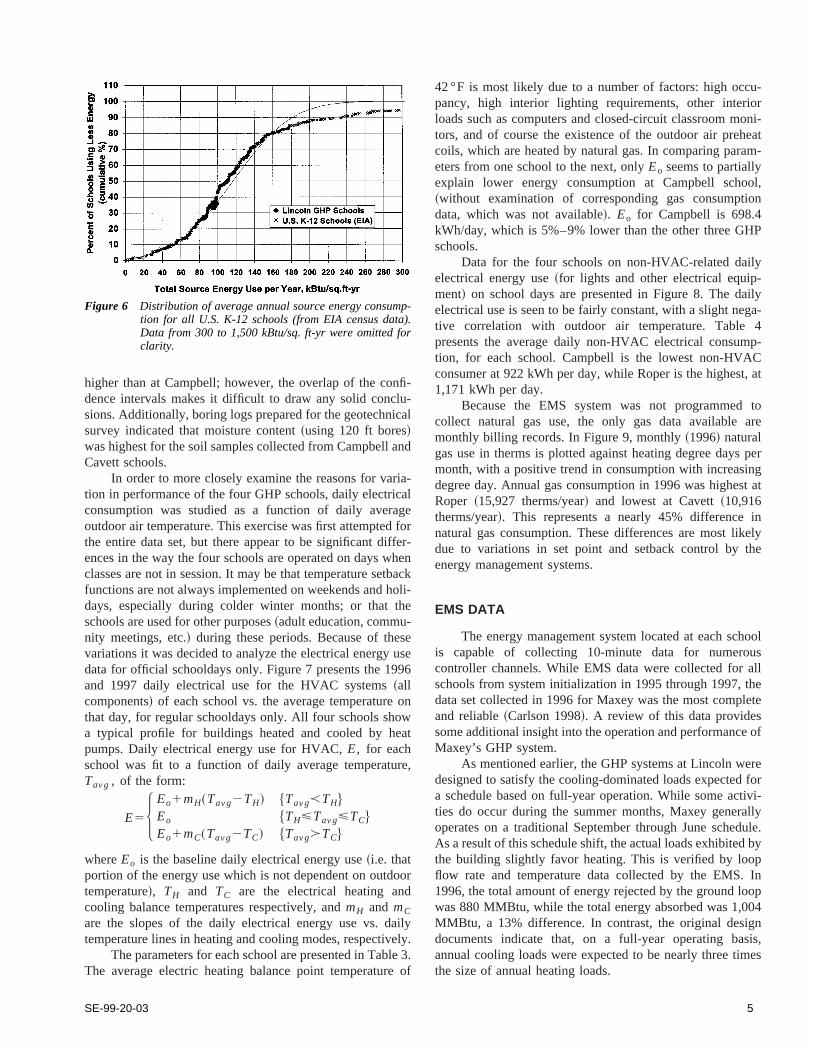
As Figure 6 indicates, the energy use of the LincolnGHP schools compares favorably with the energy use of allelementary schools in the U.S.2 Based on data collected fromK-12 schools from across the United States~EIA, 1995!, only27% use less energy than the Campbell school, while 37%use less energy than the Maxey school. On a national basis,49% of the schools cool 100% of their floor area, while 33%cool less than 20% of their floor area.
The variation in consumption behavior between Camp-bell and the other three schools is not insignificant. Thedrivers behind this variation in performance are more likelydue to operational differences than installed equipment, orfacility or environmental conditions. For instance, the heatpumps used in Campbell and Maxey were produced by adifferent manufacturer than those used in Cavett and Roper,so the difference does not correlate with manufacturer. Addi-tionally, the difference does not seem to correlate to buildingorientation or number of portable buildings. Cavett andRoper face east, Maxey faces west, and Campbell facessouth; Cavett and Roper each have two portable classroombuildings on-site as well. Finally, no strong correlation can bedrawn from the small amount of data available on site soilconditions. Recent in-situ tests conducted at Campbell andMaxey estimated thermal conductivities at 1.2060.06 Btu/hr-ft-°F and 1.3560.15 Btu/hr-ft-°F, respectively.This suggests that bore field heat transfer ability at Maxey is
1Census Division 4 includes the states of Nebraska, North Dakota, South Dakota, Minnesota, Iowa, Missouri, and Kansas. EIA data for Division 4 is basedon a weighted statistical sample of 21 schools estimated by EIA to represent the entire building population of the census division~in this case 9,787 schools!.
2EIA data for the entire U.S. is based on a weighted statistical sample of 449 schools estimated by EIA to represent the entire building population of theU.S.~162,689 schools!.
Figure 4 Distribution of average annual source energy consump-tion for K-12 schools located in the Lincoln PublicSchool District (Lincoln, NE). Schools that providespace cooling to over 90% of their total floor area areidentified using solid data markers. Three schools builtin the 1990’s, with conventional HVAC systems, are alsoidentified.
Figure 5 Distribution of average annual source energy consump-tion for K-12 schools located in EIA Census Division 4.
4 SE-99-20-03
higher than at Campbell; however, the overlap of the confi-dence intervals makes it difficult to draw any solid conclu-sions. Additionally, boring logs prepared for the geotechnicalsurvey indicated that moisture content~using 120 ft bores!was highest for the soil samples collected from Campbell andCavett schools.
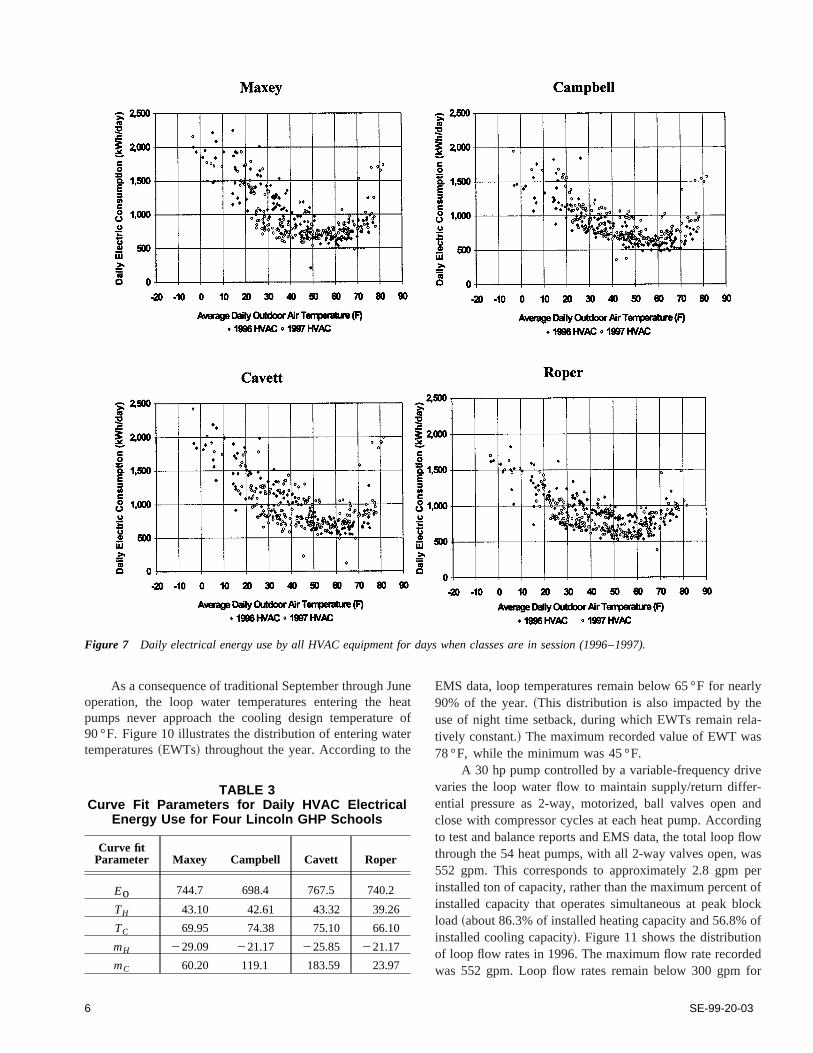
In order to more closely examine the reasons for varia-tion in performance of the four GHP schools, daily electricalconsumption was studied as a function of daily averageoutdoor air temperature. This exercise was first attempted forthe entire data set, but there appear to be significant differ-ences in the way the four schools are operated on days whenclasses are not in session. It may be that temperature setbackfunctions are not always implemented on weekends and holi-days, especially during colder winter months; or that theschools are used for other purposes~adult education, commu-nity meetings, etc.! during these periods. Because of thesevariations it was decided to analyze the electrical energy usedata for official schooldays only. Figure 7 presents the 1996and 1997 daily electrical use for the HVAC systems~allcomponents! of each school vs. the average temperature onthat day, for regular schooldays only. All four schools showa typical profile for buildings heated and cooled by heatpumps. Daily electrical energy use for HVAC,E, for eachschool was fit to a function of daily average temperature,Tavg , of the form:
E5H Eo1mH~Tavg2TH!
Eo
Eo1mC~Tavg2TC!
$TavgaTH%$TH<Tavg<TC%$TavgsTC%
whereEo is the baseline daily electrical energy use~i.e. thatportion of the energy use which is not dependent on outdoortemperature!, TH and TC are the electrical heating andcooling balance temperatures respectively, andmH and mC
are the slopes of the daily electrical energy use vs. dailytemperature lines in heating and cooling modes, respectively.
The parameters for each school are presented in Table 3.The average electric heating balance point temperature of
42 °F is most likely due to a number of factors: high occu-pancy, high interior lighting requirements, other interiorloads such as computers and closed-circuit classroom moni-tors, and of course the existence of the outdoor air preheatcoils, which are heated by natural gas. In comparing param-eters from one school to the next, onlyEo seems to partiallyexplain lower energy consumption at Campbell school,~without examination of corresponding gas consumptiondata, which was not available!. Eo for Campbell is 698.4kWh/day, which is 5%–9% lower than the other three GHPschools.
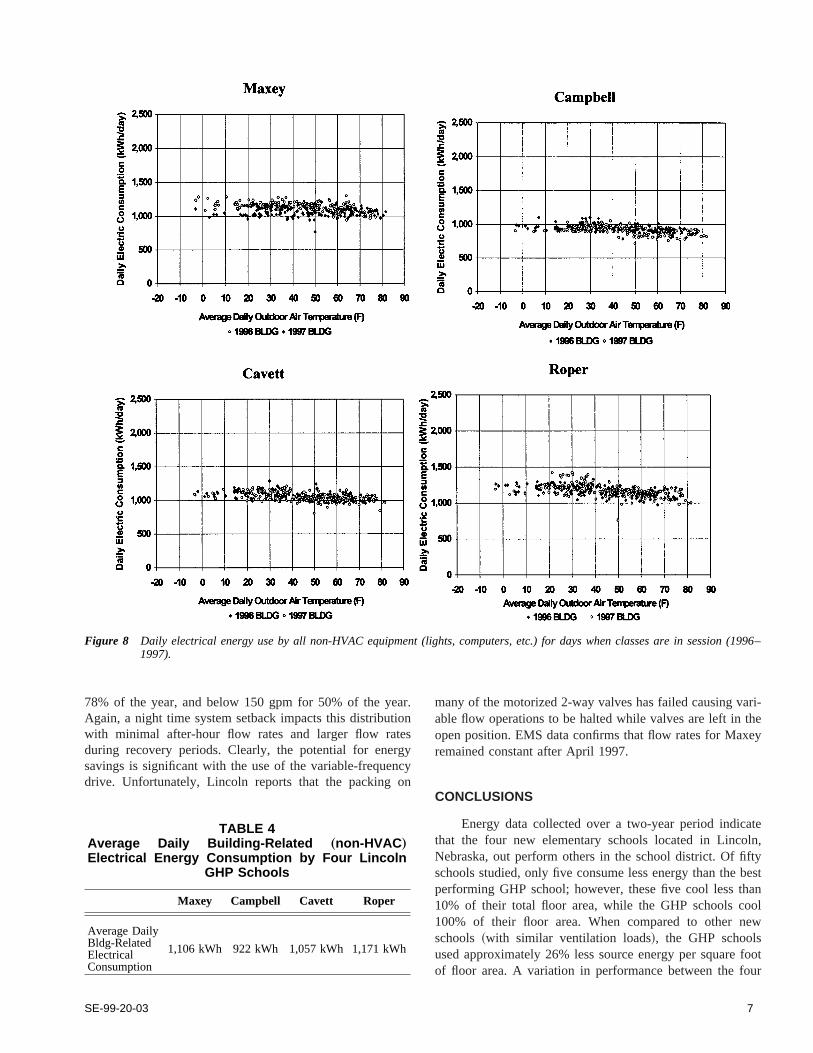
Data for the four schools on non-HVAC-related dailyelectrical energy use~for lights and other electrical equip-ment! on school days are presented in Figure 8. The dailyelectrical use is seen to be fairly constant, with a slight nega-tive correlation with outdoor air temperature. Table 4presents the average daily non-HVAC electrical consump-tion, for each school. Campbell is the lowest non-HVACconsumer at 922 kWh per day, while Roper is the highest, at1,171 kWh per day.
Because the EMS system was not programmed tocollect natural gas use, the only gas data available aremonthly billing records. In Figure 9, monthly~1996! naturalgas use in therms is plotted against heating degree days permonth, with a positive trend in consumption with increasingdegree day. Annual gas consumption in 1996 was highest atRoper ~15,927 therms/year! and lowest at Cavett~10,916therms/year!. This represents a nearly 45% difference innatural gas consumption. These differences are most likelydue to variations in set point and setback control by theenergy management systems.
EMS DATA
The energy management system located at each schoolis capable of collecting 10-minute data for numerouscontroller channels. While EMS data were collected for allschools from system initialization in 1995 through 1997, thedata set collected in 1996 for Maxey was the most completeand reliable~Carlson 1998!. A review of this data providessome additional insight into the operation and performance ofMaxey’s GHP system.
As mentioned earlier, the GHP systems at Lincoln weredesigned to satisfy the cooling-dominated loads expected fora schedule based on full-year operation. While some activi-ties do occur during the summer months, Maxey generallyoperates on a traditional September through June schedule.As a result of this schedule shift, the actual loads exhibited bythe building slightly favor heating. This is verified by loopflow rate and temperature data collected by the EMS. In1996, the total amount of energy rejected by the ground loopwas 880 MMBtu, while the total energy absorbed was 1,004MMBtu, a 13% difference. In contrast, the original designdocuments indicate that, on a full-year operating basis,annual cooling loads were expected to be nearly three timesthe size of annual heating loads.
Figure 6 Distribution of average annual source energy consump-tion for all U.S. K-12 schools (from EIA census data).Data from 300 to 1,500 kBtu/sq. ft-yr were omitted forclarity.
SE-99-20-03 5
As a consequence of traditional September through Juneoperation, the loop water temperatures entering the heatpumps never approach the cooling design temperature of90 °F. Figure 10 illustrates the distribution of entering watertemperatures~EWTs! throughout the year. According to the
EMS data, loop temperatures remain below 65 °F for nearly90% of the year.~This distribution is also impacted by theuse of night time setback, during which EWTs remain rela-tively constant.! The maximum recorded value of EWT was78 °F, while the minimum was 45 °F.
A 30 hp pump controlled by a variable-frequency drivevaries the loop water flow to maintain supply/return differ-ential pressure as 2-way, motorized, ball valves open andclose with compressor cycles at each heat pump. Accordingto test and balance reports and EMS data, the total loop flowthrough the 54 heat pumps, with all 2-way valves open, was552 gpm. This corresponds to approximately 2.8 gpm perinstalled ton of capacity, rather than the maximum percent ofinstalled capacity that operates simultaneous at peak blockload~about 86.3% of installed heating capacity and 56.8% ofinstalled cooling capacity!. Figure 11 shows the distributionof loop flow rates in 1996. The maximum flow rate recordedwas 552 gpm. Loop flow rates remain below 300 gpm for
Figure 7 Daily electrical energy use by all HVAC equipment for days when classes are in session (1996–1997).
TABLE 3Curve Fit Parameters for Daily HVAC Electrical
Energy Use for Four Lincoln GHP Schools
Curve fitParameter Maxey Campbell Cavett Roper
Eo 744.7 698.4 767.5 740.2
TH 43.10 42.61 43.32 39.26
TC 69.95 74.38 75.10 66.10
mH 229.09 221.17 225.85 221.17
mC 60.20 119.1 183.59 23.97
6 SE-99-20-03
78% of the year, and below 150 gpm for 50% of the year.Again, a night time system setback impacts this distributionwith minimal after-hour flow rates and larger flow ratesduring recovery periods. Clearly, the potential for energysavings is significant with the use of the variable-frequencydrive. Unfortunately, Lincoln reports that the packing on
many of the motorized 2-way valves has failed causing vari-able flow operations to be halted while valves are left in theopen position. EMS data confirms that flow rates for Maxeyremained constant after April 1997.
CONCLUSIONS
Energy data collected over a two-year period indicatethat the four new elementary schools located in Lincoln,Nebraska, out perform others in the school district. Of fiftyschools studied, only five consume less energy than the bestperforming GHP school; however, these five cool less than10% of their total floor area, while the GHP schools cool100% of their floor area. When compared to other newschools ~with similar ventilation loads!, the GHP schoolsused approximately 26% less source energy per square footof floor area. A variation in performance between the four
Figure 8 Daily electrical energy use by all non-HVAC equipment (lights, computers, etc.) for days when classes are in session (1996–1997).
TABLE 4Average Daily Building-Related „non-HVAC …
Electrical Energy Consumption by Four LincolnGHP Schools
Maxey Campbell Cavett Roper
Average DailyBldg-RelatedElectricalConsumption
1,106 kWh 922 kWh 1,057 kWh 1,171 kWh
SE-99-20-03 7
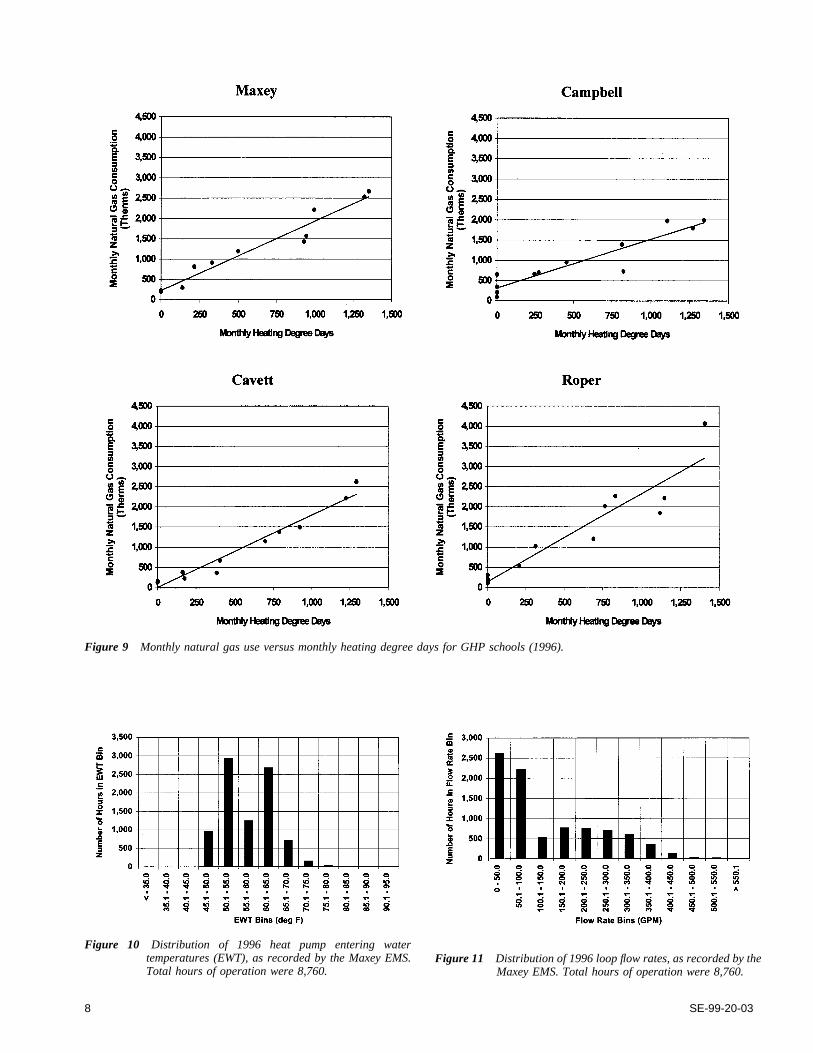
Figure 9 Monthly natural gas use versus monthly heating degree days for GHP schools (1996).
Figure 10 Distribution of 1996 heat pump entering watertemperatures (EWT), as recorded by the Maxey EMS.Total hours of operation were 8,760.
Figure 11 Distribution of 1996 loop flow rates, as recorded by theMaxey EMS. Total hours of operation were 8,760.
8 SE-99-20-03

GHP schools is evident, and is most likely due to differencesin occupancy and equipment loading and scheduling.
The data collected from the GHP schools is presentlybeing used to study the ability of simulation tools~DOE-2,TRNSYS! to model GHP systems with vertical borehole heatexchangers. Following a validation of these models, a side-by-side comparison of vertical-bore GHPs with conventionalheating and cooling systems will be performed using cali-brated loads taken from the Lincoln GHP schools.
ACKNOWLEDGMENTS
The authors wish to recognize the following representa-tives of the local utilities, school district, and engineeringfirm who were directly involved with the project and whohave generously shared their time, data, and experience:Byron Bakenhus, Doug Bantam, Scott Benson, PatrickDecker, Ron Feuerbach, Alfred Hopp, Larry Hennings, TimPratt, and Bill Lucke.
REFERENCES
Bantam, D.D. and Benson, S.J. 1995. A public utility strategyfor implementing and monitoring a ground-coupled heatpump system in a public school. APPA Energy/Customer Services and Communications Workshop,Kansas City, MO.
Carlson, S. 1998.Lincoln GHP EMS analysis and data notes.Cazenovia, NY: CDH Energy.
Energy Information Administration~EIA!. 1995. Commer-cial buildings energy consumption and expenditures1992. DOE/EIA-0318~92!. Washington, D.C.: Depart-ment of Energy.
Feuerbach, R.S. and D. Bantam. 1998. Going underground.Engineered Systems.
Kavanaugh, S. 1994. Ground-coupled heat pump system for150 ton school in Lincoln, Nebraska. Professional Corre-spondence to Lincoln Electric System.
SE-99-20-03 9