Embed Size (px)
Citation preview
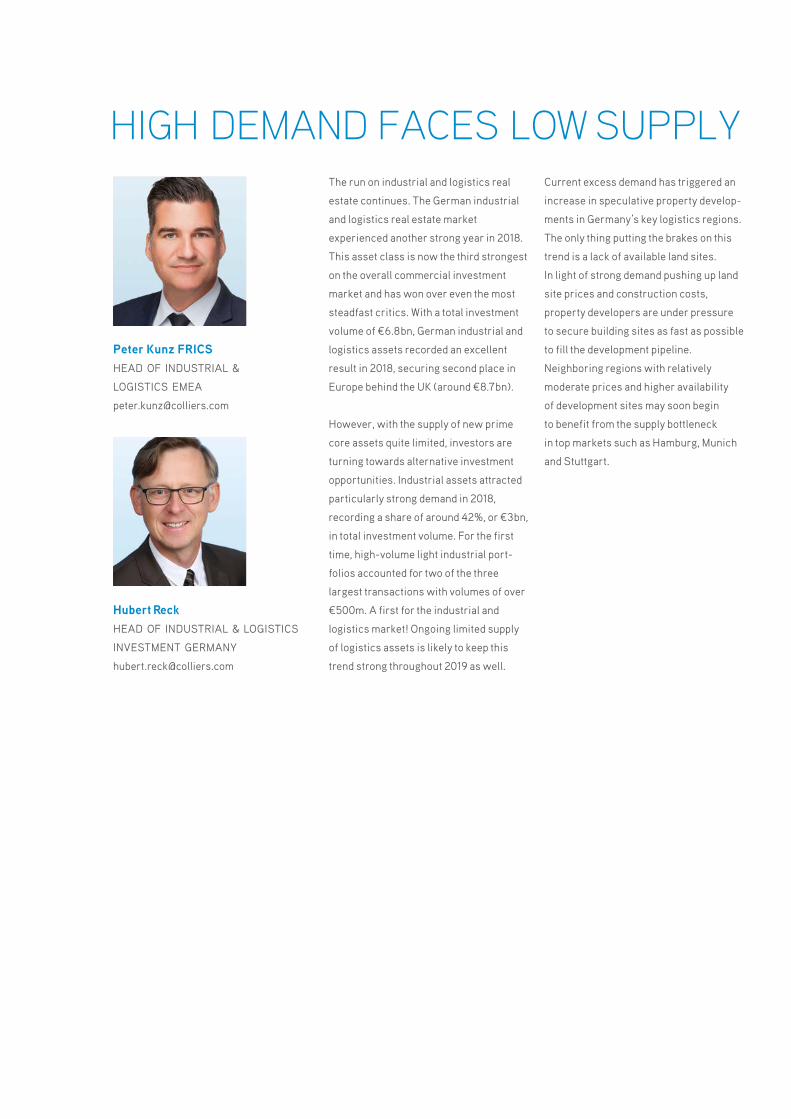
The run on industrial and logistics real
estate continues. The German industrial
and logistics real estate market
ex perienced another strong year in 2018.
This asset class is now the third strongest
on the overall commercial investment
market and has won over even the most
steadfast critics. With a total investment
volume of €6.8 bn, German industrial and
logistics assets recorded an excellent
result in 2018, securing second place in
Europe behind the UK (around €8.7 bn).
However, with the supply of new prime
core assets quite limited, investors are
turning towards alternative investment
opportunities. Industrial assets attracted
particularly strong demand in 2018,
recording a share of around 42%, or €3 bn,
in total investment volume. For the first
time, high-volume light industrial port-
folios accounted for two of the three
largest transactions with volumes of over
€500m. A first for the industrial and
logistics market! Ongoing limited supply
of logistics assets is likely to keep this
trend strong throughout 2019 as well.
Current excess demand has triggered an
increase in speculative property develop-
ments in Germany’s key logistics regions.
The only thing putting the brakes on this
trend is a lack of available land sites.
In light of strong demand pushing up land
site prices and construction costs,
property developers are under pressure
to secure building sites as fast as possible
to fill the development pipeline.
Neighboring regions with relatively
moderate prices and higher availability
of development sites may soon begin
to benefit from the supply bottleneck
in top markets such as Hamburg, Munich
and Stuttgart.
Peter Kunz FRICSHEAD OF INDUSTRIAL &
LOGISTICS EMEA
Hubert ReckHEAD OF INDUSTRIAL & LOGISTICS
INVESTMENT GERMANY
HIGH DEMAND FACES LOW SUPPLY
3CONTENTS
| 2018 / 2019 Industrial and Logistics M
arkets Overview
| Colliers International
Logistics in Germany 4
Logistics Regions in Germany 5
Market Data 6
Leasing Market
Germany 8
Berlin / Brandenburg 11
Düsseldorf 14
Frankfurt/Rhine-Main 17
Hamburg 20
Cologne 23
Leipzig 26
Munich 29
Stuttgart 32
Investment 35
Glossary 38
Contacts /Locations 39
CONTENTS
4LO
giST
iCS
iN g
Erm
aNy
| 20
18 / 2
019
Indu
stri
al a
nd L
ogis
tics
Mar
kets
Ove
rvie
w |
Col
liers
Inte
rnat
iona
l
Germany is one of the most attractive
logistics markets worldwide thanks to
its central location in Europe, excellent
infrastructure, high technological
standards and excellent building quality.
The logistics sector is one of Germany’s
key economic engines with a turnover
of around €274 bn. The sector, however,
is also facing significant challenges.
Limited supply of space and a shortage
of workers are the greatest threats to
growth. Companies on the lookout for
space are increasingly taking the
avail ability of labor and local business
tax policies into consideration in their
decisions. Although space is in short
supply in densely populated areas,
secondary locations still have relatively
high space potential. These locations,
however, are often not competitive due
to a lack of available human resources.
What’s more, the logistics sector also
has to compete for available space with
other asset classes like residential and
office. And, despite numerous image
campaigns, the sector is still often asso-
ciated with traffic, noise and low wages.
The lack of space and development sites
can be felt in almost all of Germany’s top 8
logistics markets. However, trends and
drivers such as the thriving e-commerce
sector will continue to ensure high
demand for logistics properties. Ongoing
economic growth accompanied by current
demographic trends will further limit the
supply of labor.
LOGISTICS IN GERMANY
5LOgiSTiCS rEgiONS iN gErm
aNy | 2018 / 2019
Industrial and Logistics Markets O
verview | C
olliers International LOGISTICS REGIONS IN GERMANY
71
7366
45
485
33
38
4
9
70
3 93
48
67
63
395
14
230
1
31
43
27
3924
2019
23 21
28
11
17
72
6
7
92
94
9596
81
5
8
6562
13
15
52
49
60
Nuremberg
5.00
4.50
200Stuttgart
6.50
5.20
300
Karlsruhe
5.50
4.60
175
Saarbrücken
4.30
3.30
85
Mönchen- gladbach
4.50
3.60
80
Düsseldorf
5.75
4.75
220
Leipzig
4.60
3.70
70
Hamburg
6.00
4.85
260
Erfurt
4.30
3.10
60
Hannover
4.70
3.80
80
Bremen
4.60
3.60
60
Gießen
4.00
3.50
70
Kassel / Bad Hersfeld
4.50
3.70
75
Cologne
5.50
4.50
180
5.25
4.20
110
Duisburg
5.30
4.30
140
Mannheim
Berlin
5.70
5.00
200
Rostock
Dresden
Zwickau
Regensburg
Augsburg
Trier
MünsterOsnabrück
BraunschweigWolfsburg
Bremerhaven
Ingolstadt
Frankfurt
Magdeburg
WürzburgAschaffenburg
6.50
5.20
300
4.50
4.00
100
Dortmund
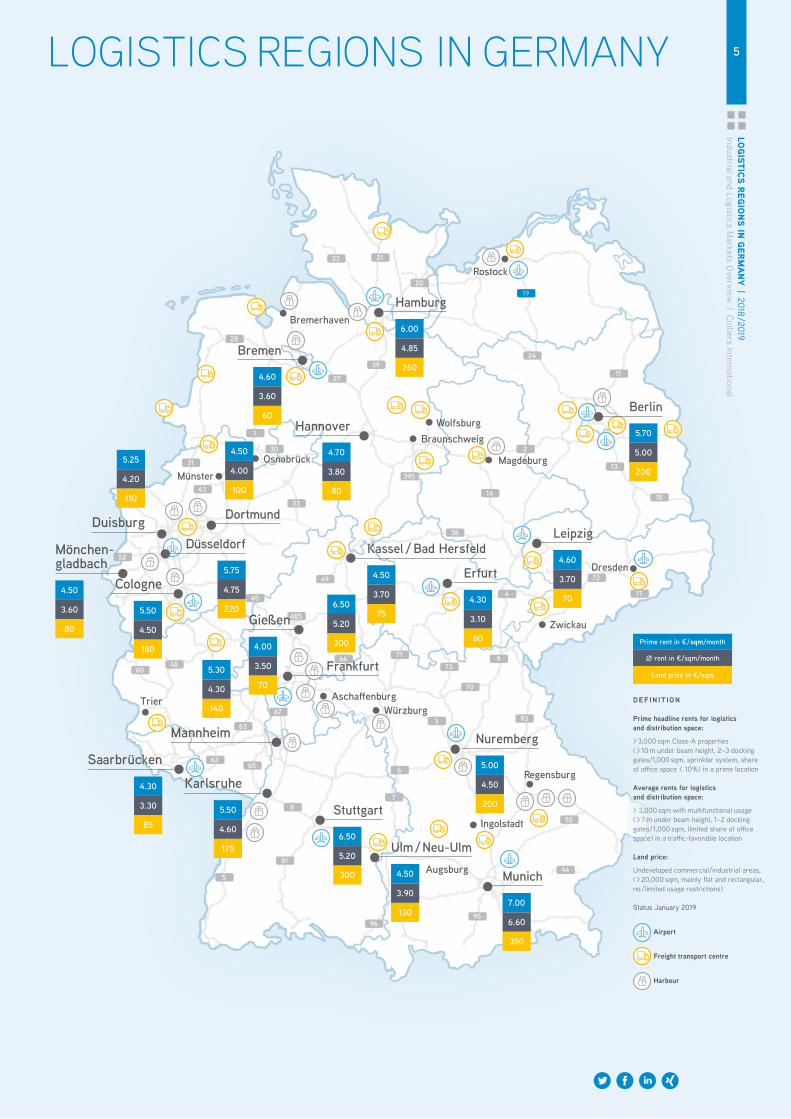
Prime rent in € / sqm/month
∅ rent in €/sqm/month
Land price in €/sqm
DEF IN IT ION
Prime headline rents for logistics and distribution space:
> 3,000 sqm Class-A properties ( > 10 m under beam height, 2–3 docking gates/1,000 sqm, sprinkler system, share of office space < 10 %) in a prime location
Average rents for logistics and distribution space:
> 3,000 sqm with multifunctional usage ( > 7 m under beam height, 1–2 docking gates / 1,000 sqm, limited share of office space) in a traffic-favorable location
Land price:
Undeveloped commercial/industrial areas, ( > 20,000 sqm, mainly flat and rectangular, no / limited usage restrictions)
Status January 2019
Airport
Freight transport centre
Harbour
Munich
7.00
6.60
350
Ulm / Neu-Ulm
4.50
3.90
130
6m
arkE
T Da
Ta |
201
8 / 2
019
Indu
stri
al a
nd L
ogis
tics
Mar
kets
Ove
rvie
w |
Col
liers
Inte
rnat
iona
l MARKET DATA
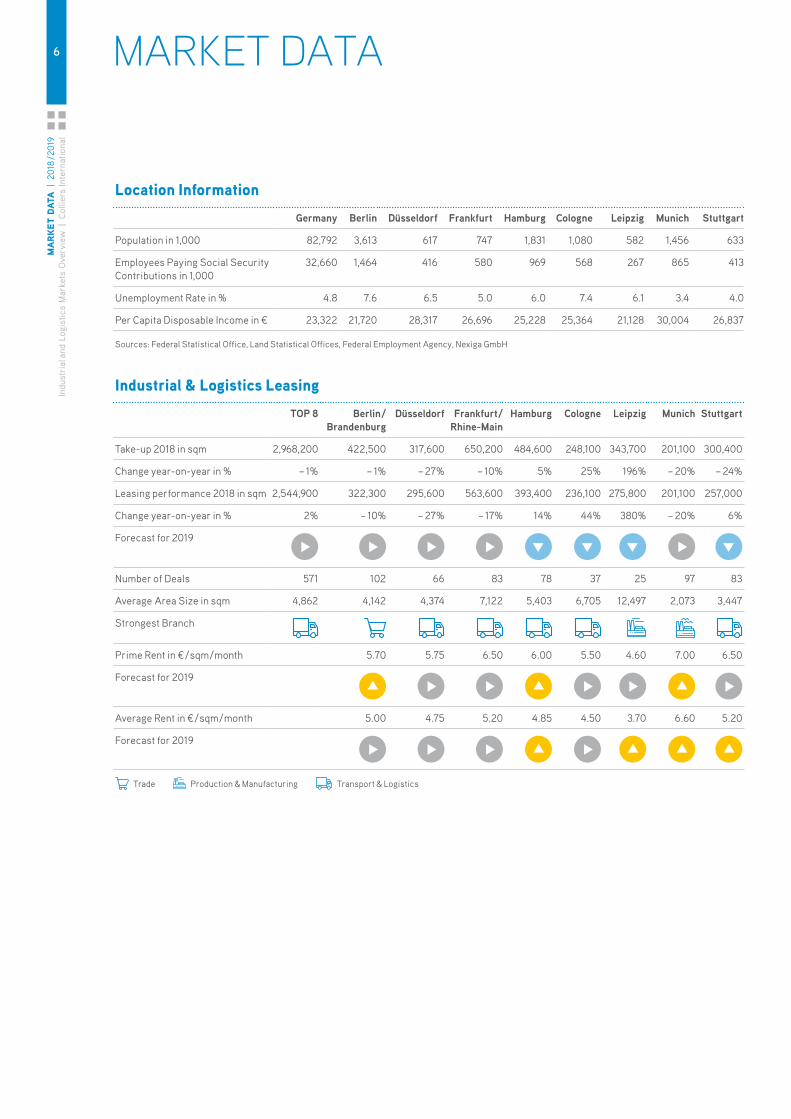
Location informationGermany Berlin Düsseldorf Frankfurt Hamburg Cologne Leipzig Munich Stuttgart
Population in 1,000 82,792 3,613 617 747 1,831 1,080 582 1,456 633
Employees Paying Social Security Contributions in 1,000
32,660 1,464 416 580 969 568 267 865 413
Unemployment Rate in % 4.8 7.6 6.5 5.0 6.0 7.4 6.1 3.4 4.0
Per Capita Disposable Income in € 23,322 21,720 28,317 26,696 25,228 25,364 21,128 30,004 26,837
Sources: Federal Statistical Office, Land Statistical Offices, Federal Employment Agency, Nexiga GmbH
industrial & Logistics Leasing TOP 8 Berlin /
BrandenburgDüsseldorf Frankfurt /
Rhine-MainHamburg Cologne Leipzig Munich Stuttgart
Take-up 2018 in sqm 2,968,200 422,500 317,600 650,200 484,600 248,100 343,700 201,100 300,400
Change year-on-year in % – 1% – 1% – 27% – 10% 5% 25% 196% – 20% – 24%
Leasing performance 2018 in sqm 2,544,900 322,300 295,600 563,600 393,400 236,100 275,800 201,100 257,000
Change year-on-year in % 2% – 10% – 27% – 17% 14% 44% 380% – 20% 6%
Forecast for 2019
Number of Deals 571 102 66 83 78 37 25 97 83
Average Area Size in sqm 4,862 4,142 4,374 7,122 5,403 6,705 12,497 2,073 3,447
Strongest Branch
Prime Rent in € / sqm / month 5.70 5.75 6.50 6.00 5.50 4.60 7.00 6.50
Forecast for 2019
Average Rent in € / sqm / month 5.00 4.75 5.20 4.85 4.50 3.70 6.60 5.20
Forecast for 2019
Trade Production & Manufacturing Transport & Logistics
7m
arkET DaTa | 2018 / 2019
Industrial and Logistics Markets O
verview | C
olliers International
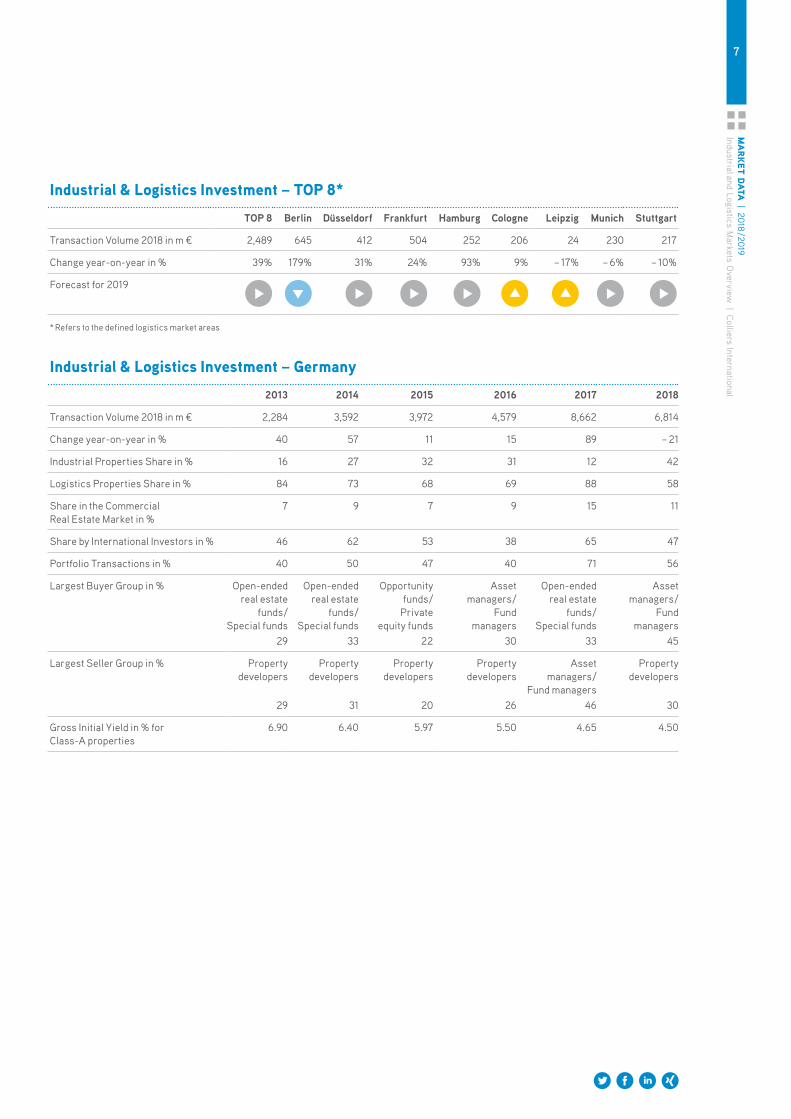
industrial & Logistics investment – TOP 8*TOP 8 Berlin Düsseldorf Frankfurt Hamburg Cologne Leipzig Munich Stuttgart
Transaction Volume 2018 in m € 2,489 645 412 504 252 206 24 230 217
Change year-on-year in % 39% 179% 31% 24% 93% 9% – 17% – 6% – 10%
Forecast for 2019
* Refers to the defined logistics market areas
industrial & Logistics investment – germany2013 2014 2015 2016 2017 2018
Transaction Volume 2018 in m € 2,284 3,592 3,972 4,579 8,662 6,814
Change year-on-year in % 40 57 11 15 89 – 21
Industrial Properties Share in % 16 27 32 31 12 42
Logistics Properties Share in % 84 73 68 69 88 58
Share in the Commercial Real Estate Market in %
7 9 7 9 15 11
Share by International Investors in % 46 62 53 38 65 47
Portfolio Transactions in % 40 50 47 40 71 56
Largest Buyer Group in % Open-ended real estate
funds / Special funds
Open-ended real estate
funds / Special funds
Opportunity funds / Private
equity funds
Asset managers /
Fund managers
Open-ended real estate
funds / Special funds
Asset managers /
Fund managers
29 33 22 30 33 45
Largest Seller Group in % Property developers
Property developers
Property developers
Property developers
Asset managers /
Fund managers
Property developers
29 31 20 26 46 30
Gross Initial Yield in % for Class-A properties
6.90 6.40 5.97 5.50 4.65 4.50
8LE
aSiN
g m
arkE
T gE
rmaN
y |
2018
/ 201
9In
dust
rial
and
Log
istic
s M
arke
ts O
verv
iew
| C
ollie
rs In
tern
atio
nal
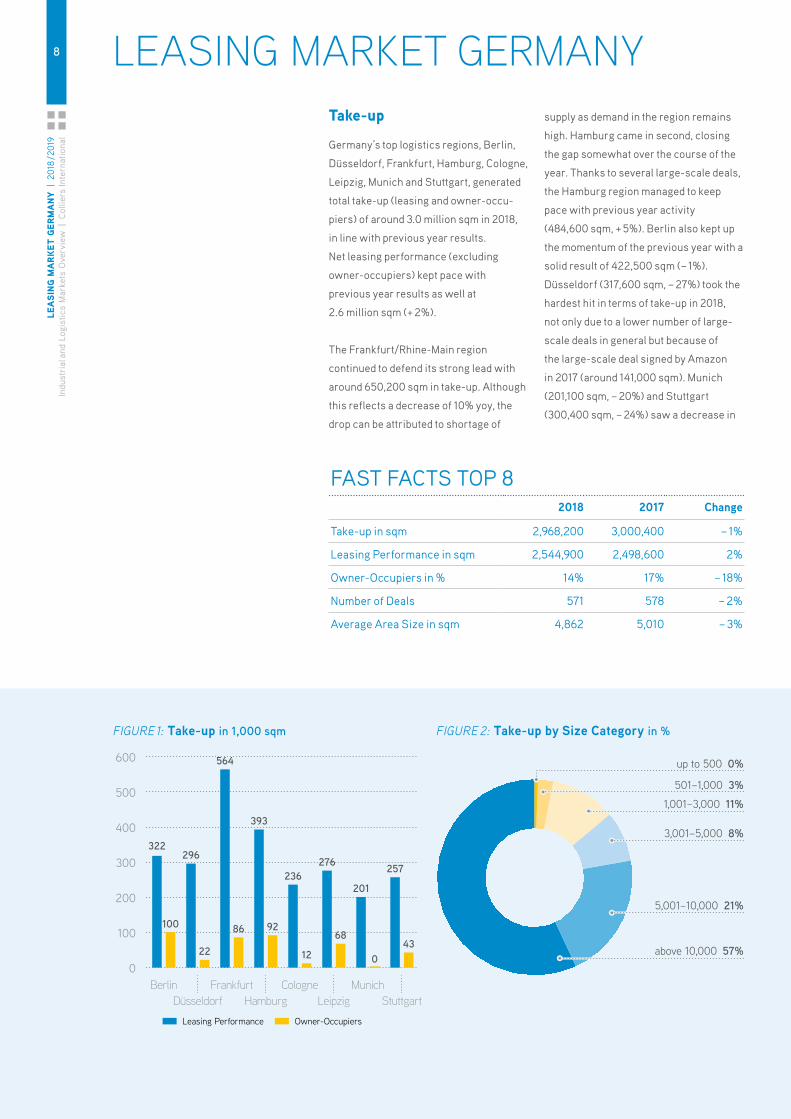
Take-up
Germany’s top logistics regions, Berlin,
Düsseldorf, Frankfurt, Hamburg, Cologne,
Leipzig, Munich and Stuttgart, generated
total take-up (leasing and owner- occu-
piers) of around 3.0 million sqm in 2018,
in line with previous year results.
Net leasing performance (excluding
owner-occupiers) kept pace with
pre vious year results as well at
2.6 million sqm (+ 2%).
The Frankfurt/Rhine-Main region
continued to defend its strong lead with
around 650,200 sqm in take-up. Although
this reflects a decrease of 10% yoy, the
drop can be attributed to shortage of
supply as demand in the region remains
high. Hamburg came in second, closing
the gap somewhat over the course of the
year. Thanks to several large-scale deals,
the Hamburg region managed to keep
pace with previous year activity
(484,600 sqm, + 5%). Berlin also kept up
the momentum of the previous year with a
solid result of 422,500 sqm (– 1%).
Düsseldorf (317,600 sqm, – 27%) took the
hardest hit in terms of take-up in 2018,
not only due to a lower number of large-
scale deals in general but because of
the large-scale deal signed by Amazon
in 2017 (around 141,000 sqm). Munich
(201,100 sqm, – 20%) and Stuttgart
(300,400 sqm, – 24%) saw a decrease in
LEASING MARKET GERMANY
FAST FACTS TOP 82018 2017 Change
Take-up in sqm 2,968,200 3,000,400 – 1%
Leasing Performance in sqm 2,544,900 2,498,600 2%
Owner-Occupiers in % 14% 17% – 18%
Number of Deals 571 578 – 2%
Average Area Size in sqm 4,862 5,010 – 3%
Leasing Performance Owner-Occupiers
0
100
200
300
400
500
600
StuttgartMunich
LeipzigCologne
HamburgFrankfurt
DüsseldorfBerlin
up to 500 0%
501–1,000 3%
1,001–3,000 11%
above 10,000 57%
3,001–5,000 8%
5,001–10,000 21%100
22
86 92
12
68
043
322296
564
393
236276
201
257
Others 12%
Logistics ServiceProviders 43%
TradingCompanies 24%
Production &Manufacturing
Companies 21%
4
5
6
7
20182017201620152014
Cologne Leipzig StuttgartMunich
HamburgFrankfurtDüsseldorfBerlin
FIGURE 1: Take-up in 1,000 sqm FIGURE 2: Take-up by Size Category in %
9LEaSiNg m
arkET gErmaNy
| 2018 / 2019 Industrial and Logistics M
arkets Overview
| Colliers International
take-up due to limited supply. In contrast,
Cologne (248,100 sqm) posted a 25% yoy
increase in take-up, thanks in part to sev-
eral property developments that added
space to the market. The Leipzig logistics
region almost tripled its take-up result
yoy to 343,700 sqm thanks to a number of
large-scale deals and was able to hold
onto its status as one of Germany’s most
popular logistics regions locations.
Supply and Demand
Current excess demand has triggered an
increase in speculative property develop-
ments in Germany’s key logistics regions.
The only thing putting the brakes on this
trend is a lack of available land sites.
Unless new space is added to the market
soon, this trend will become even more
pronounced. In addition, tenants are
proving willing to sign longer-term
leases. With construction and land-site
costs rising, property developers are
increasingly stocking up on land sites.
Tenants with larger space requirements
(more than 10,000 sqm) are struggling
to find space in all of Germany’s top 8
logistics markets and are having to
compromise. Demand will likely shift to
the surrounding areas in the medium to
long-term, with neighboring logistics
regions like Hanover and Nuremberg,
which have comparatively favorable
prices and higher space potential, set to
benefit in the future. Demand for business
parks with good access to infrastructure
is on the rise in almost all conurbations
as well. We are also seeing an increase in
demand for smaller urban logistics space
instead of big box options.
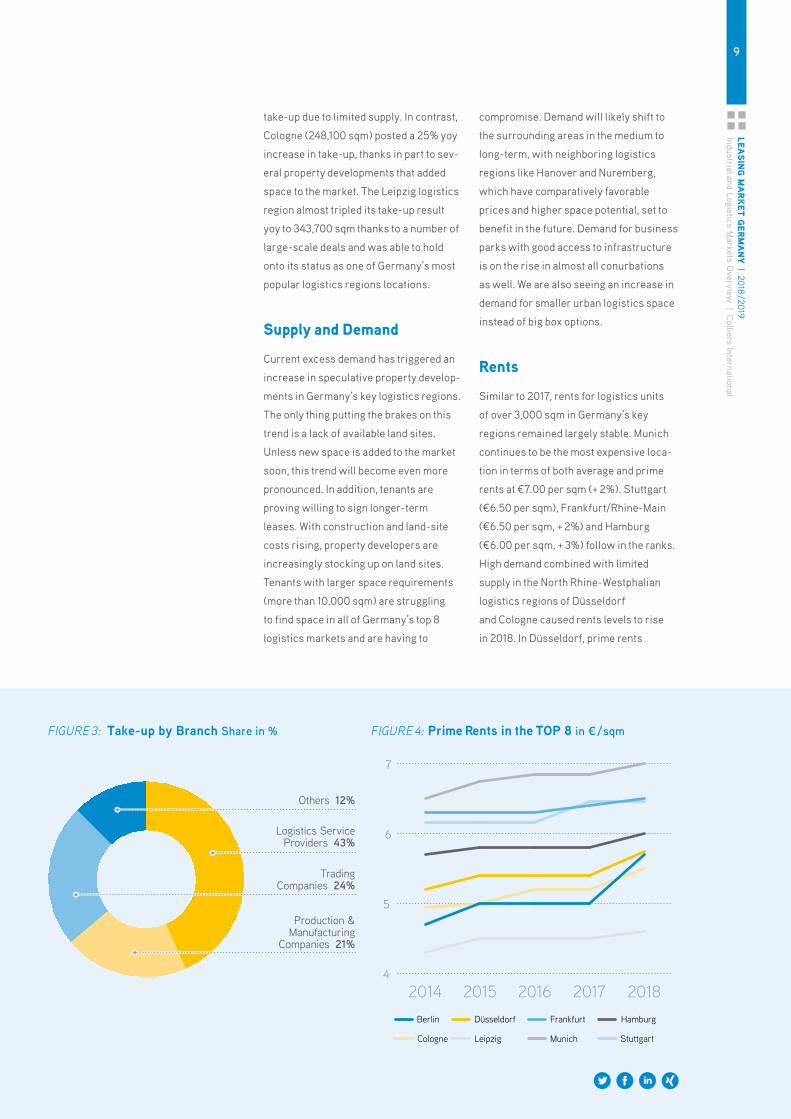
rents
Similar to 2017, rents for logistics units
of over 3,000 sqm in Germany’s key
regions remained largely stable. Munich
continues to be the most expensive loca-
tion in terms of both average and prime
rents at €7.00 per sqm (+ 2%). Stuttgart
(€6.50 per sqm), Frankfurt/Rhine-Main
(€6.50 per sqm, + 2%) and Hamburg
(€6.00 per sqm, + 3%) follow in the ranks.
High demand combined with limited
supply in the North Rhine-Westphalian
logistics regions of Düsseldorf
and Cologne caused rents levels to rise
in 2018. In Düsseldorf, prime rents
Others 12%
Logistics ServiceProviders 43%
TradingCompanies 24%
Production &Manufacturing
Companies 21%
4
5
6
7
20182017201620152014
Cologne Leipzig StuttgartMunich
HamburgFrankfurtDüsseldorfBerlin
FIGURE 3: Take-up by Branch Share in % FIGURE 4: Prime Rents in the TOP 8 in € / sqm
10LE
aSiN
g m
arkE
T gE
rmaN
y |
2018
/ 201
9In
dust
rial
and
Log
istic
s M
arke
ts O
verv
iew
| C
ollie
rs In
tern
atio
nal
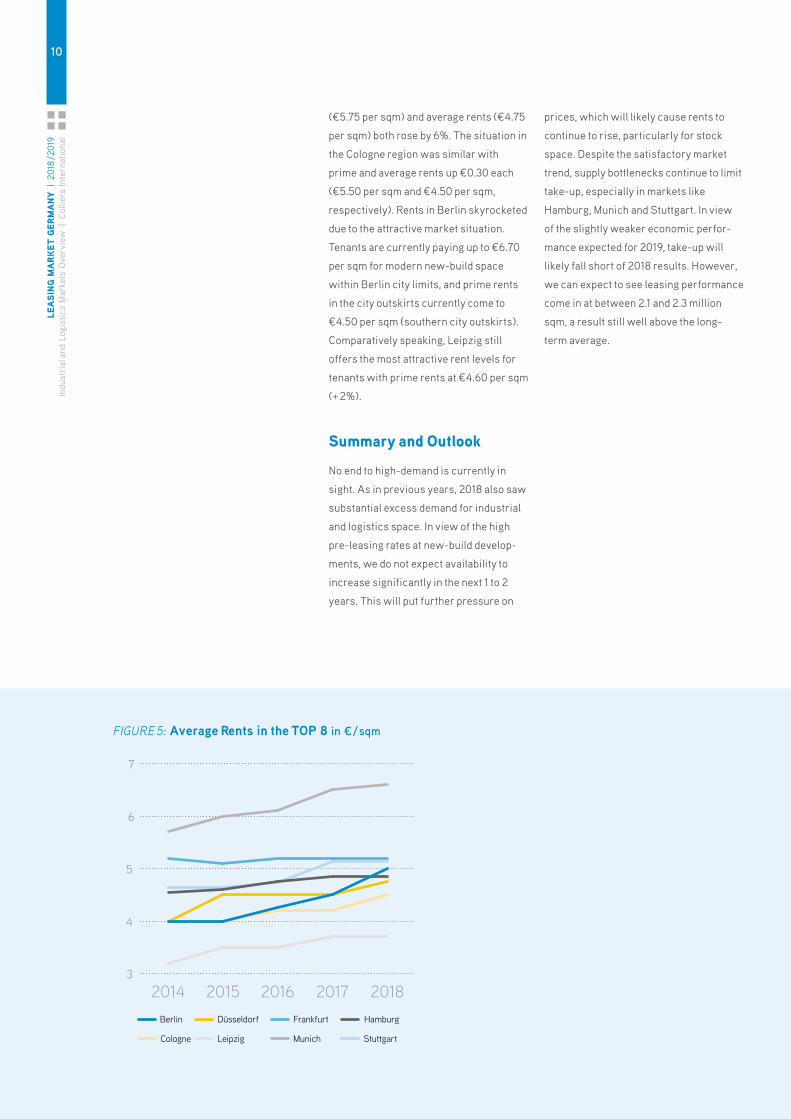
(€5.75 per sqm) and average rents (€4.75
per sqm) both rose by 6%. The situation in
the Cologne region was similar with
prime and average rents up €0.30 each
(€5.50 per sqm and €4.50 per sqm,
respectively). Rents in Berlin skyrocketed
due to the attractive market situation.
Tenants are currently paying up to €6.70
per sqm for modern new-build space
within Berlin city limits, and prime rents
in the city outskirts currently come to
€4.50 per sqm (southern city outskirts).
Comparatively speaking, Leipzig still
offers the most attractive rent levels for
tenants with prime rents at €4.60 per sqm
(+ 2%).
Summary and Outlook
No end to high-demand is currently in
sight. As in previous years, 2018 also saw
substantial excess demand for industrial
and logistics space. In view of the high
pre-leasing rates at new-build develop-
ments, we do not expect availability to
increase significantly in the next 1 to 2
years. This will put further pressure on
prices, which will likely cause rents to
continue to rise, particularly for stock
space. Despite the satisfactory market
trend, supply bottlenecks continue to limit
take-up, especially in markets like
Hamburg, Munich and Stuttgart. In view
of the slightly weaker economic perfor-
mance expected for 2019, take-up will
likely fall short of 2018 results. However,
we can expect to see leasing performance
come in at between 2.1 and 2.3 million
sqm, a result still well above the long-
term average.
3
4
5
6
7
20182017201620152014
Cologne Leipzig StuttgartMunich
HamburgFrankfurtDüsseldorfBerlin
FIGURE 5: Average Rents in the TOP 8 in € / sqm
11BErLiN / BraNDENBurg
| 2018 / 2019 Industrial and Logistics M
arkets Overview
| Colliers International
FAST FACTS2018 2017 Change
Take-up in sqm 422,500 424,800 – 1%
Leasing Performance in sqm 322,300 359,800 – 10%
Number of Deals 102 80 28%
Prime Rent* in €/sqm/month 5.70 5.00 14%
Average Rent in €/sqm/month 5.00 4.50 11%
*achievable top rent in new buildings
Take-up according to Location
Submarket Take-up in sqm Share
1 Center 19,500 5%
2 City North 30,800 7%
3 City East 8,500 2%
4 City South 86,000 20%
5 City West 15,900 4%
6 Periphery North 12,500 3%
7 Periphery East 1,000 0%
8 Airport Area BER 10,500 3%
9 Periphery South 219,400 52%
10 Periphery West 18,400 4%
Total 422,500 100%
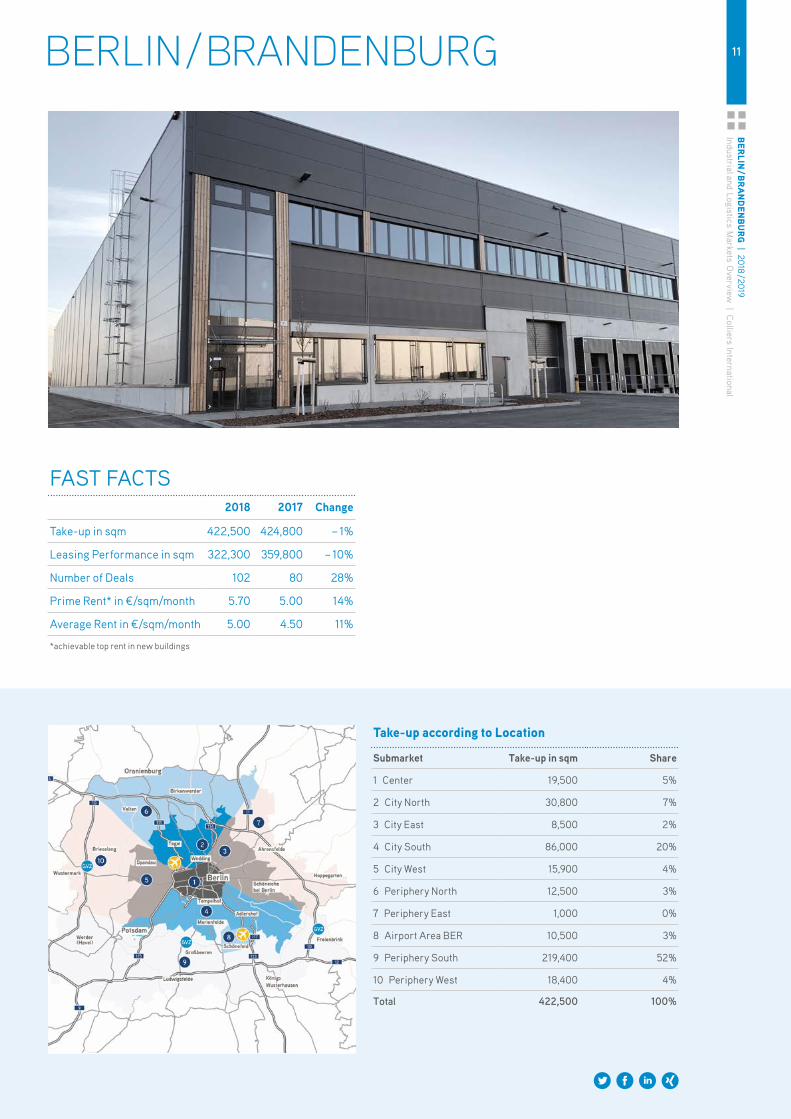
BERLIN / BRANDENBURG
12BE
rLiN
/ Bra
NDEN
Burg
| 2
018
/ 201
9In
dust
rial
and
Log
istic
s M
arke
ts O
verv
iew
| C
ollie
rs In
tern
atio
nal
0
100
200
300
400
500
20182017201620152014Average 2014 – 2018Whole year
314.3
451.4
352.7
424.8 422.5
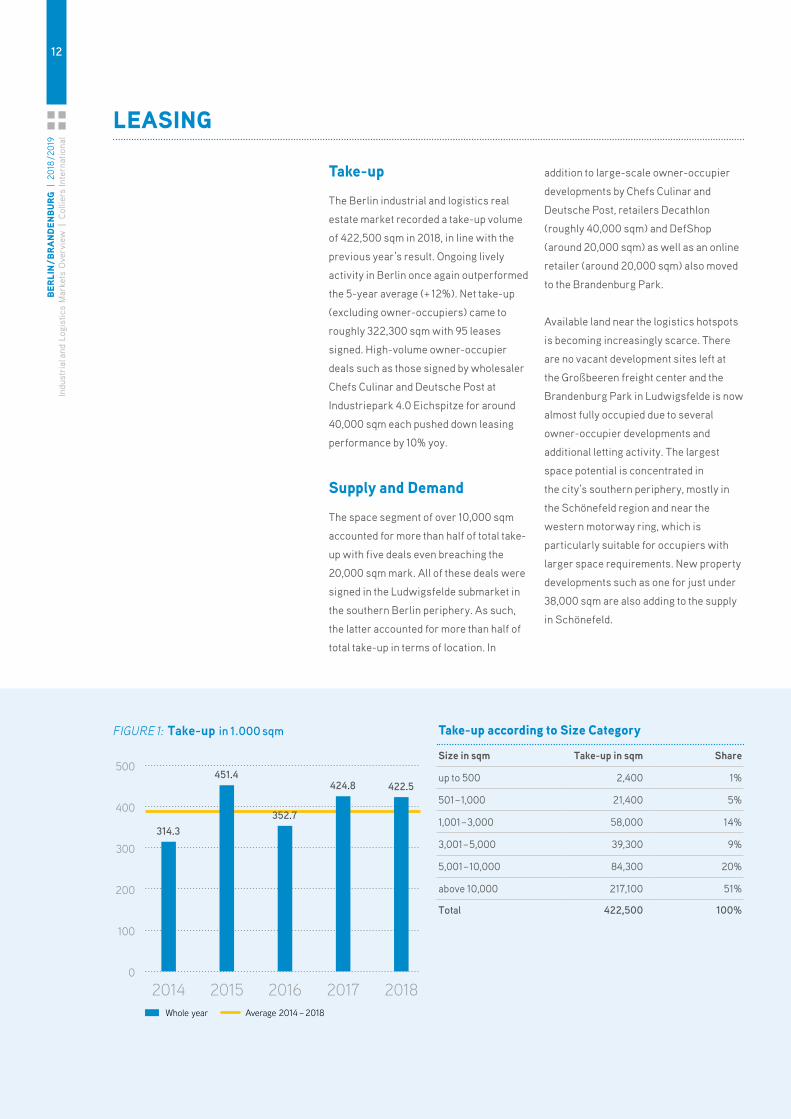
Take-up
The Berlin industrial and logistics real
estate market recorded a take-up volume
of 422,500 sqm in 2018, in line with the
previous year’s result. Ongoing lively
activity in Berlin once again outperformed
the 5-year average (+ 12%). Net take-up
(excluding owner-occupiers) came to
roughly 322,300 sqm with 95 leases
signed. High-volume owner-occupier
deals such as those signed by wholesaler
Chefs Culinar and Deutsche Post at
Industriepark 4.0 Eichspitze for around
40,000 sqm each pushed down leasing
performance by 10% yoy.
Supply and Demand
The space segment of over 10,000 sqm
accounted for more than half of total take-
up with five deals even breaching the
20,000 sqm mark. All of these deals were
signed in the Ludwigsfelde submarket in
the southern Berlin periphery. As such,
the latter accounted for more than half of
total take-up in terms of location. In
addition to large-scale owner-occupier
developments by Chefs Culinar and
Deutsche Post, retailers Decathlon
(roughly 40,000 sqm) and DefShop
(around 20,000 sqm) as well as an online
retailer (around 20,000 sqm) also moved
to the Brandenburg Park.
Available land near the logistics hotspots
is becoming increasingly scarce. There
are no vacant development sites left at
the Großbeeren freight center and the
Brandenburg Park in Ludwigsfelde is now
almost fully occupied due to several
owner-occupier developments and
additional letting activity. The largest
space potential is concentrated in
the city’s southern periphery, mostly in
the Schönefeld region and near the
western motorway ring, which is
particularly suitable for occupiers with
larger space requirements. New property
developments such as one for just under
38,000 sqm are also adding to the supply
in Schönefeld.
Take-up according to Size Category
Size in sqm Take-up in sqm Share
up to 500 2,400 1%
501 – 1,000 21,400 5%
1,001 – 3,000 58,000 14%
3,001 – 5,000 39,300 9%
5,001 – 10,000 84,300 20%
above 10,000 217,100 51%
Total 422,500 100%
LEaSiNg
FIGURE 1: Take-up in 1.000 sqm
13BErLiN / BraNDENBurg
| 2018 / 2019 Industrial and Logistics M
arkets Overview
| Colliers International
0
100
200
300
400
500
20182017201620152014Average 2014 – 2018Whole year
314.3
451.4
352.7
424.8 422.5
Others 7%
Logistics ServiceProviders 35%
TradingCompanies 48%
Production & ManufacturingCompanies 10%
4.70
5.00 5.00 5.00
4.00 4.00
4.254.50
5.70
5.00
Average RentPrime Rent
3
4
5
6
20182017201620152014
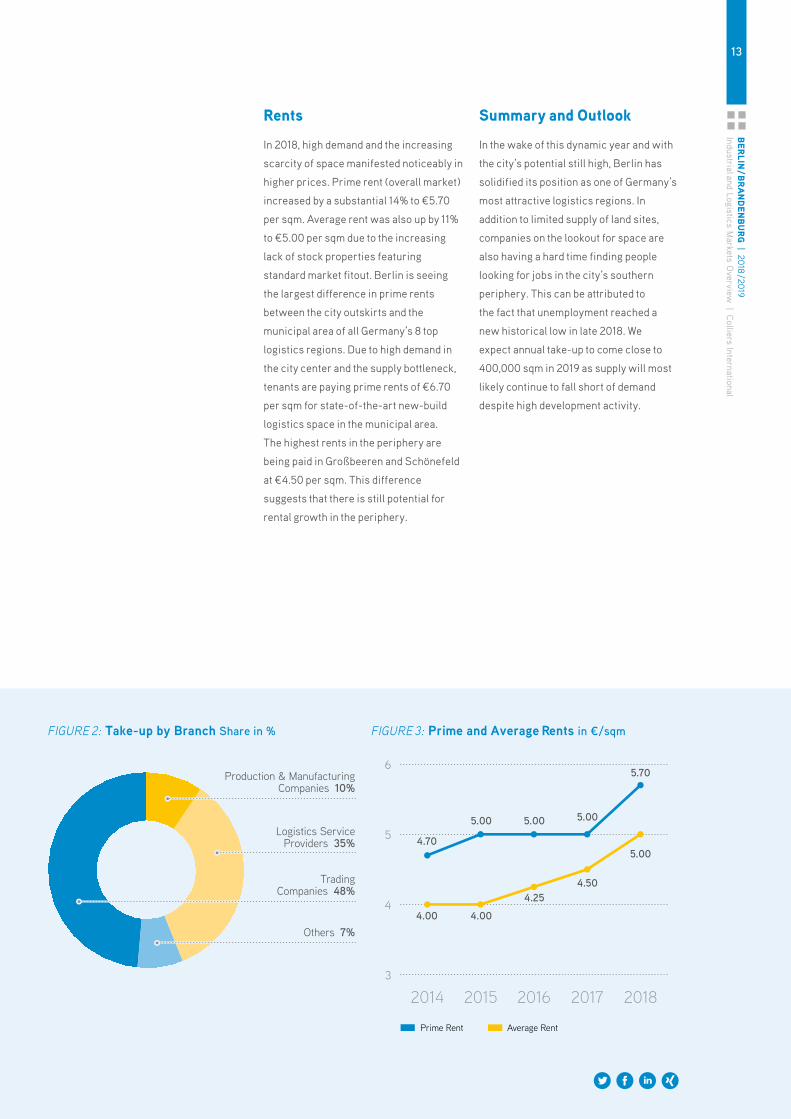
rents
In 2018, high demand and the increasing
scarcity of space manifested noticeably in
higher prices. Prime rent (overall market)
increased by a substantial 14% to €5.70
per sqm. Average rent was also up by 11%
to €5.00 per sqm due to the increasing
lack of stock properties featuring
standard market fitout. Berlin is seeing
the largest difference in prime rents
between the city outskirts and the
municipal area of all Germany’s 8 top
logistics regions. Due to high demand in
the city center and the supply bottleneck,
tenants are paying prime rents of €6.70
per sqm for state- of-the-art new-build
logistics space in the municipal area.
The highest rents in the periphery are
being paid in Großbeeren and Schönefeld
at €4.50 per sqm. This difference
suggests that there is still potential for
rental growth in the periphery.
Summary and Outlook
In the wake of this dynamic year and with
the city’s potential still high, Berlin has
solidified its position as one of Germany’s
most attractive logistics regions. In
addition to limited supply of land sites,
companies on the lookout for space are
also having a hard time finding people
looking for jobs in the city’s southern
periphery. This can be attributed to
the fact that unemployment reached a
new historical low in late 2018. We
expect annual take-up to come close to
400,000 sqm in 2019 as supply will most
likely continue to fall short of demand
despite high development activity.
FIGURE 2: Take-up by Branch Share in % FIGURE 3: Prime and Average Rents in ¤/sqm
14Dü
SSEL
DOrf
| 2
018
/ 201
9In
dust
rial
and
Log
istic
s M
arke
ts O
verv
iew
| C
ollie
rs In
tern
atio
nal
Take-up according to Location
Submarket Take-up in sqm Share
1 Düsseldorf 67,000 21%
2 Neuss 70,700 22%
3 Kaarst 1,500 1%
4 Willich 26,500 8%
5 Krefeld 62,100 20%
6 Meerbusch 400 0%
7 Ratingen 39,000 12%
8 Erkrath 0 0%
9 Hilden 800 0%
10 Langenfeld 8,000 3%
11 Dormagen 29,400 9%
12 Grevenbroich 8,900 3%
13 Korschenbroich 0 0%
14 Mönchengladbach 3,300 1%
Total 317,600 100%
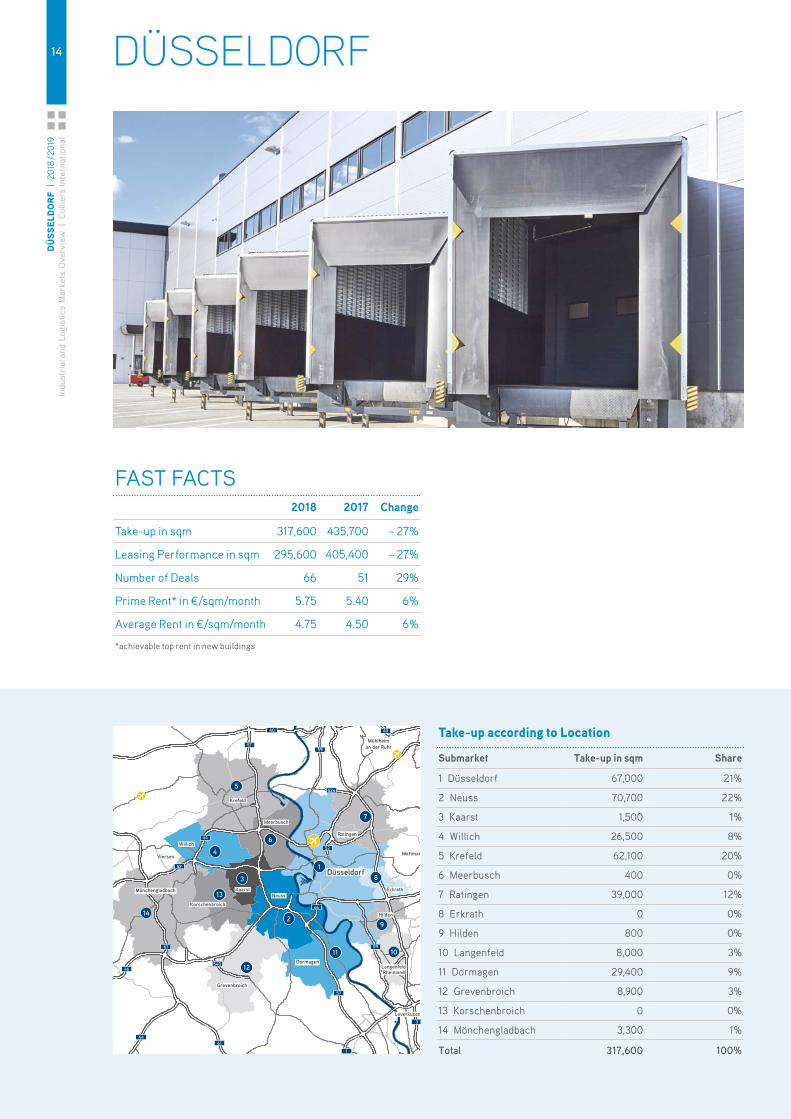
DÜSSELDORF
NeussMönchengladbach Kaarst
Meerbusch
Krefeld
Willich
Viersen
Korschenbroich
Dormagen
Grevenbroich
Hilden
Erkrath
Mettmann
LangenfeldRheinland
Leverkusen
Ratingen
Mühlheim an der Ruhr
2
1
4
6
5
3
7
8
9
10
Düsseldorf
11
12
13
14
44
59
4040
57
524
52
46
59
57
3
1
6144
61
46540
52
44
FAST FACTS2018 2017 Change
Take-up in sqm 317,600 435,700 – 27%
Leasing Performance in sqm 295,600 405,400 – 27%
Number of Deals 66 51 29%
Prime Rent* in €/sqm/month 5.75 5.40 6%
Average Rent in €/sqm/month 4.75 4.50 6%
*achievable top rent in new buildings
15DüSSELDOrf
| 2018 / 2019 Industrial and Logistics M
arkets Overview
| Colliers International
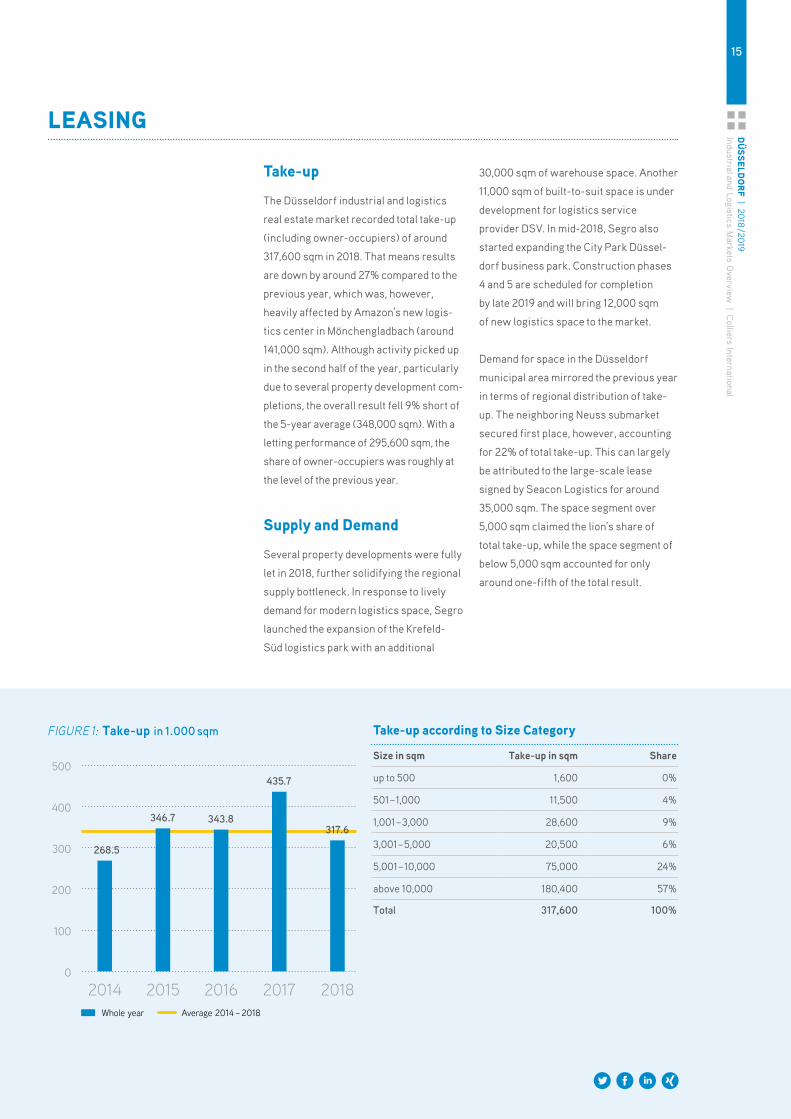
Take-up
The Düsseldorf industrial and logistics
real estate market recorded total take-up
(including owner-occupiers) of around
317,600 sqm in 2018. That means results
are down by around 27% compared to the
previous year, which was, however,
heavily affected by Amazon’s new logis-
tics center in Mönchengladbach (around
141,000 sqm). Although activity picked up
in the second half of the year, particularly
due to several property development com-
pletions, the overall result fell 9% short of
the 5-year average (348,000 sqm). With a
letting performance of 295,600 sqm, the
share of owner-occupiers was roughly at
the level of the previous year.
Supply and Demand
Several property developments were fully
let in 2018, further solidifying the regional
supply bottleneck. In response to lively
demand for modern logistics space, Segro
launched the expansion of the Krefeld-
Süd logistics park with an additional
30,000 sqm of warehouse space. Another
11,000 sqm of built-to-suit space is under
development for logistics service
provider DSV. In mid-2018, Segro also
started expanding the City Park Düssel-
dorf business park. Construction phases
4 and 5 are scheduled for completion
by late 2019 and will bring 12,000 sqm
of new logistics space to the market.
Demand for space in the Düsseldorf
municipal area mirrored the previous year
in terms of regional distribution of take-
up. The neighboring Neuss submarket
secured first place, however, accounting
for 22% of total take-up. This can largely
be attributed to the large-scale lease
signed by Seacon Logistics for around
35,000 sqm. The space segment over
5,000 sqm claimed the lion’s share of
total take-up, while the space segment of
below 5,000 sqm accounted for only
around one-fifth of the total result.
LEaSiNg
FIGURE 1: Take-up in 1.000 sqm
0
100
200
300
400
500
20182017201620152014
435.7
268.5
346.7 343.8317.6
Average 2014 – 2018Whole year
Take-up according to Size Category
Size in sqm Take-up in sqm Share
up to 500 1,600 0%
501 – 1,000 11,500 4%
1,001 – 3,000 28,600 9%
3,001 – 5,000 20,500 6%
5,001 – 10,000 75,000 24%
above 10,000 180,400 57%
Total 317,600 100%
16Dü
SSEL
DOrf
| 2
018
/ 201
9In
dust
rial
and
Log
istic
s M
arke
ts O
verv
iew
| C
ollie
rs In
tern
atio
nal
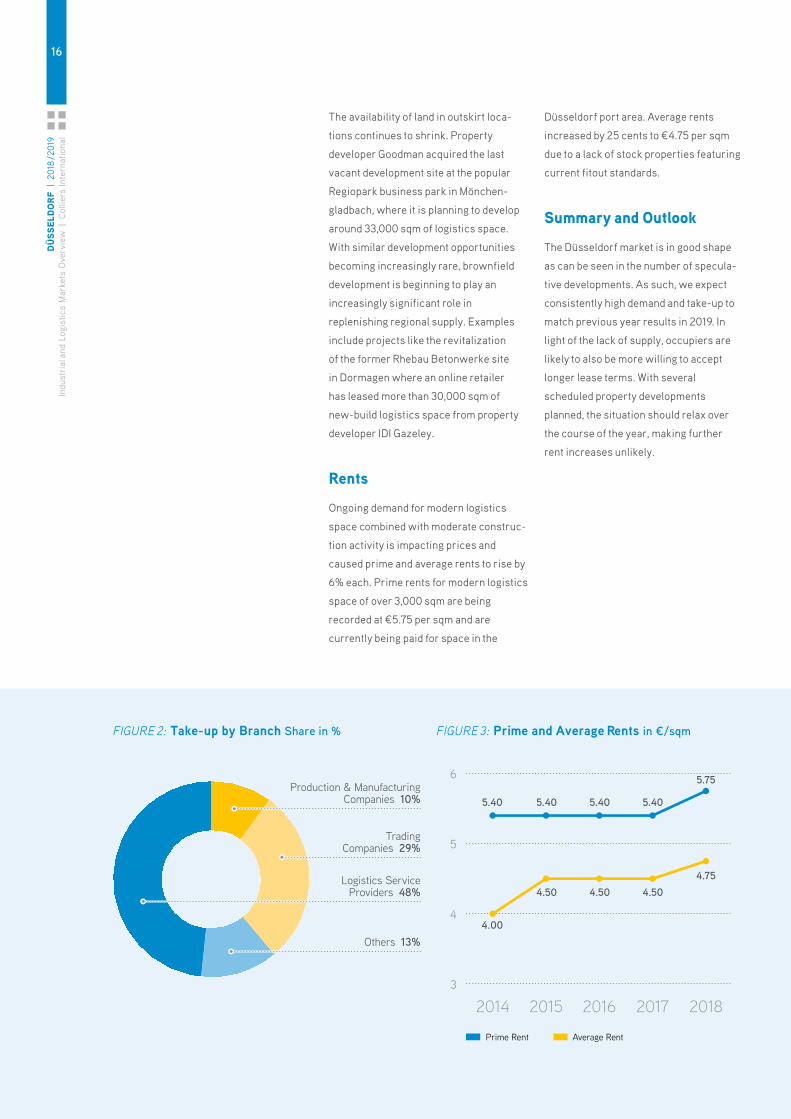
Others 13%
Logistics ServiceProviders 48%
TradingCompanies 29%
Production & ManufacturingCompanies 10% 5.40 5.40 5.40 5.40
4.00
4.50 4.50 4.50
5.75
4.75
Average RentPrime Rent
3
4
5
6
20182017201620152014
The availability of land in outskirt loca-
tions continues to shrink. Property
developer Goodman acquired the last
vacant development site at the popular
Regiopark business park in Mönchen-
gladbach, where it is planning to develop
around 33,000 sqm of logistics space.
With similar development opportunities
becoming increasingly rare, brownfield
development is beginning to play an
increasingly significant role in
replenishing regional supply. Examples
include projects like the revitalization
of the former Rhebau Betonwerke site
in Dormagen where an online retailer
has leased more than 30,000 sqm of
new-build logistics space from property
developer IDI Gazeley.
rents
Ongoing demand for modern logistics
space combined with moderate construc-
tion activity is impacting prices and
caused prime and average rents to rise by
6% each. Prime rents for modern logistics
space of over 3,000 sqm are being
recorded at €5.75 per sqm and are
currently being paid for space in the
Düsseldorf port area. Average rents
increased by 25 cents to €4.75 per sqm
due to a lack of stock properties featuring
current fitout standards.
Summary and Outlook
The Düsseldorf market is in good shape
as can be seen in the number of specula-
tive developments. As such, we expect
consistently high demand and take-up to
match previous year results in 2019. In
light of the lack of supply, occupiers are
likely to also be more willing to accept
longer lease terms. With several
scheduled property developments
planned, the situation should relax over
the course of the year, making further
rent increases unlikely.
FIGURE 2: Take-up by Branch Share in % FIGURE 3: Prime and Average Rents in ¤/sqm
17fraNkfurT / rH
iNE-maiN
| 2018 / 2019 Industrial and Logistics M
arkets Overview
| Colliers International
Others 13%
Logistics ServiceProviders 48%
TradingCompanies 29%
Production & ManufacturingCompanies 10% 5.40 5.40 5.40 5.40
4.00
4.50 4.50 4.50
5.75
4.75
Average RentPrime Rent
3
4
5
6
20182017201620152014
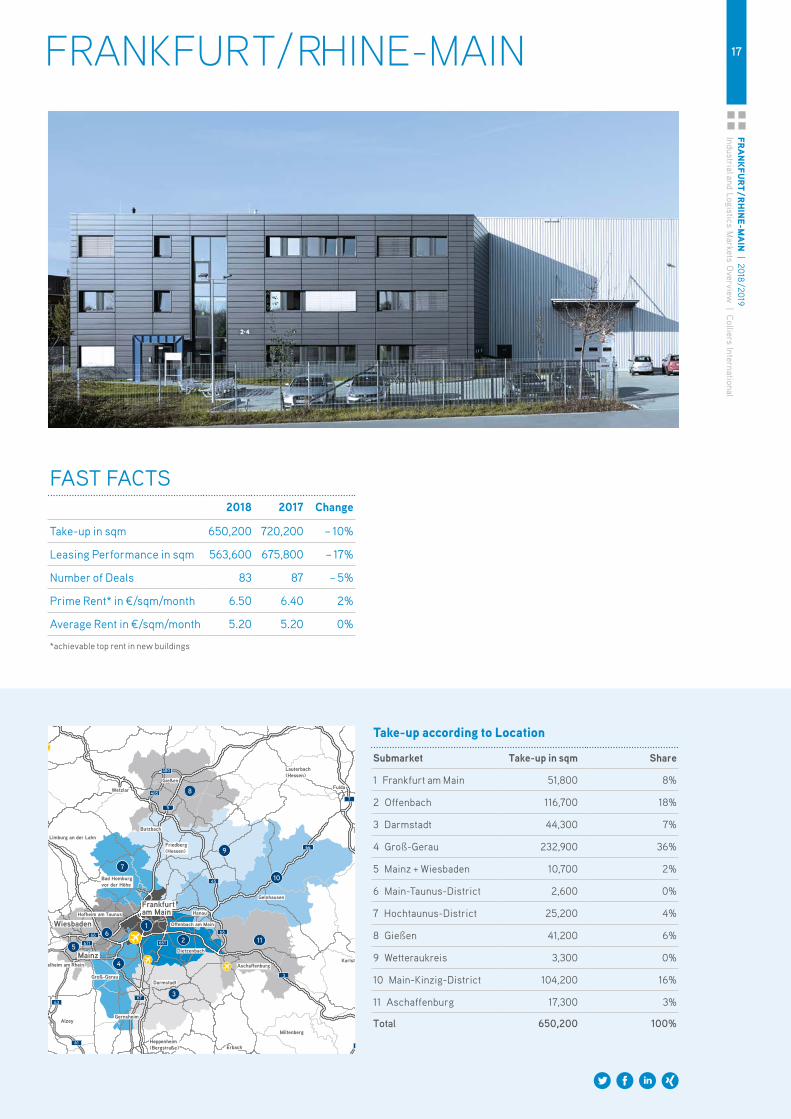
FAST FACTS2018 2017 Change
Take-up in sqm 650,200 720,200 – 10%
Leasing Performance in sqm 563,600 675,800 – 17%
Number of Deals 83 87 – 5%
Prime Rent* in €/sqm/month 6.50 6.40 2%
Average Rent in €/sqm/month 5.20 5.20 0%
*achievable top rent in new buildings
Take-up according to Location
Submarket Take-up in sqm Share
1 Frankfurt am Main 51,800 8%
2 Offenbach 116,700 18%
3 Darmstadt 44,300 7%
4 Groß-Gerau 232,900 36%
5 Mainz + Wiesbaden 10,700 2%
6 Main-Taunus-District 2,600 0%
7 Hochtaunus-District 25,200 4%
8 Gießen 41,200 6%
9 Wetteraukreis 3,300 0%
10 Main-Kinzig-District 104,200 16%
11 Aschaffenburg 17,300 3%
Total 650,200 100%
FRANKFURT / RHINE-MAIN
2
1
4
6
7
5
3
8
9
10
11
7
66
5
45
485
480
66
3
81
67
66
671
63
61
661
Frankfurt am Main
Gelnhausen
Offenbach am Main
Dietzenbach
KarlstadtAschaffenburg
Miltenberg
Heppenheim(Bergstraße) Erbach
DarmstadtGroß-Gerau
Alzey
MainzIngelheim am Rhein
WiesbadenHofheim am Taunus
Bad Homburg vor der Höhe
Friedberg (Hessen)
Limburg an der Lahn
Gießen
Wetzlar Fulda
Lauterbach (Hessen)
Butzbach
Hanau
Gernsheim
18fr
aNkf
urT /
rH
iNE-
mai
N |
2018
/ 201
9In
dust
rial
and
Log
istic
s M
arke
ts O
verv
iew
| C
ollie
rs In
tern
atio
nal
0
100
200
300
400
500
600
700
800
20182017201620152014
650.2677.7720.2
584.0
460.0
Average 2014 – 2018Whole year
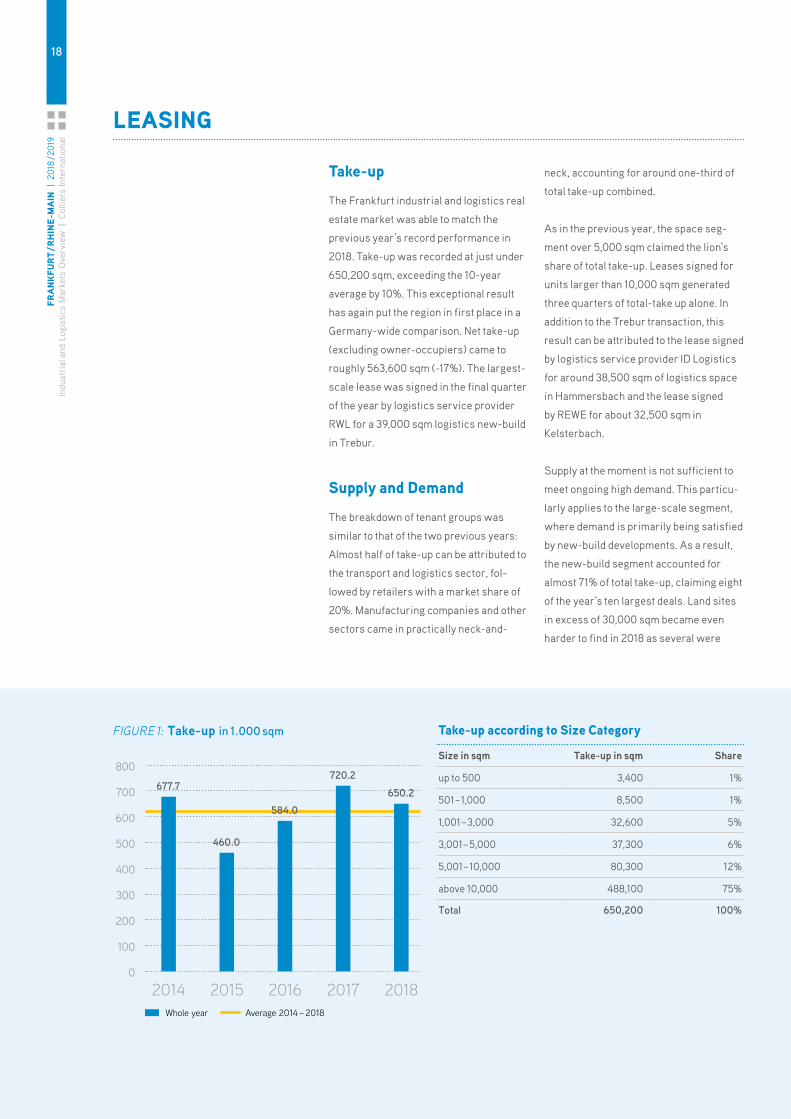
Take-up
The Frankfurt industrial and logistics real
estate market was able to match the
previous year’s record performance in
2018. Take-up was recorded at just under
650,200 sqm, exceeding the 10-year
average by 10%. This exceptional result
has again put the region in first place in a
Germany-wide comparison. Net take-up
(excluding owner-occupiers) came to
roughly 563,600 sqm (-17%). The largest-
scale lease was signed in the final quarter
of the year by logistics service provider
RWL for a 39,000 sqm logistics new-build
in Trebur.
Supply and Demand
The breakdown of tenant groups was
similar to that of the two previous years:
Almost half of take-up can be attributed to
the transport and logistics sector, fol-
lowed by retailers with a market share of
20%. Manufacturing companies and other
sectors came in practically neck-and-
neck, accounting for around one-third of
total take-up combined.
As in the previous year, the space seg-
ment over 5,000 sqm claimed the lion’s
share of total take-up. Leases signed for
units larger than 10,000 sqm generated
three quarters of total-take up alone. In
addition to the Trebur transaction, this
result can be attributed to the lease signed
by logistics service provider ID Logistics
for around 38,500 sqm of logistics space
in Hammersbach and the lease signed
by REWE for about 32,500 sqm in
Kelsterbach.
Supply at the moment is not sufficient to
meet ongoing high demand. This particu-
larly applies to the large-scale segment,
where demand is primarily being satisfied
by new-build developments. As a result,
the new-build segment accounted for
almost 71% of total take-up, claiming eight
of the year’s ten largest deals. Land sites
in excess of 30,000 sqm became even
harder to find in 2018 as several were
Take-up according to Size Category
Size in sqm Take-up in sqm Share
up to 500 3,400 1%
501 – 1,000 8,500 1%
1,001 – 3,000 32,600 5%
3,001 – 5,000 37,300 6%
5,001 – 10,000 80,300 12%
above 10,000 488,100 75%
Total 650,200 100%
LEaSiNg
FIGURE 1: Take-up in 1.000 sqm
19fraNkfurT / rH
iNE-maiN
| 2018 / 2019 Industrial and Logistics M
arkets Overview
| Colliers International
0
100
200
300
400
500
600
700
800
20182017201620152014
650.2677.7720.2
584.0
460.0
Average 2014 – 2018Whole year
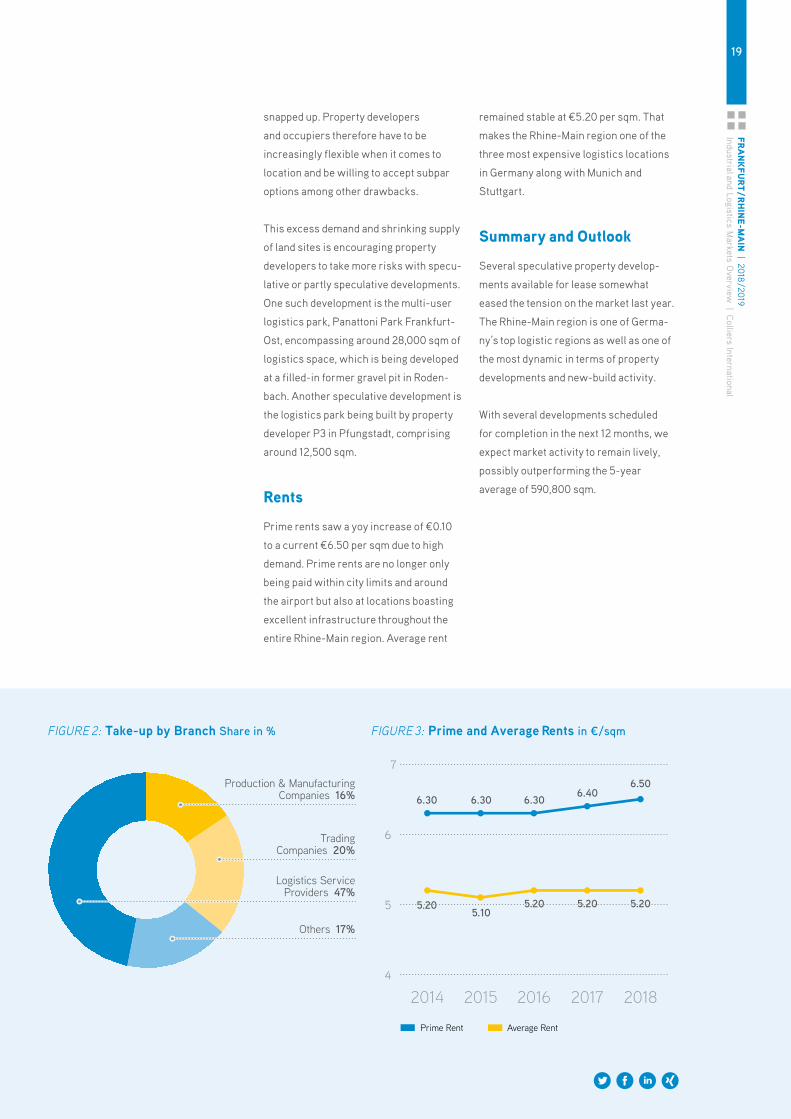
Others 17%
Logistics ServiceProviders 47%
TradingCompanies 20%
Production & ManufacturingCompanies 16% 6.30 6.30 6.30 6.40
5.205.10
5.20 5.20
6.50
5.20
Average RentPrime Rent
4
5
6
7
20182017201620152014
snapped up. Property developers
and occupiers therefore have to be
increasingly flexible when it comes to
location and be willing to accept subpar
options among other drawbacks.
This excess demand and shrinking supply
of land sites is encouraging property
developers to take more risks with specu-
lative or partly speculative developments.
One such development is the multi-user
logistics park, Panattoni Park Frankfurt-
Ost, encompassing around 28,000 sqm of
logistics space, which is being developed
at a filled-in former gravel pit in Roden-
bach. Another speculative development is
the logistics park being built by property
developer P3 in Pfungstadt, comprising
around 12,500 sqm.
rents
Prime rents saw a yoy increase of €0.10
to a current €6.50 per sqm due to high
demand. Prime rents are no longer only
being paid within city limits and around
the airport but also at locations boasting
excellent infrastructure throughout the
entire Rhine-Main region. Average rent
remained stable at €5.20 per sqm. That
makes the Rhine-Main region one of the
three most expensive logistics locations
in Germany along with Munich and
Stuttgart.
Summary and Outlook
Several speculative property develop-
ments available for lease somewhat
eased the tension on the market last year.
The Rhine-Main region is one of Germa-
ny’s top logistic regions as well as one of
the most dynamic in terms of property
developments and new-build activity.
With several developments scheduled
for completion in the next 12 months, we
expect market activity to remain lively,
possibly outperforming the 5-year
average of 590,800 sqm.
FIGURE 2: Take-up by Branch Share in % FIGURE 3: Prime and Average Rents in ¤/sqm
20H
amBu
rg |
201
8 / 2
019
Indu
stri
al a
nd L
ogis
tics
Mar
kets
Ove
rvie
w |
Col
liers
Inte
rnat
iona
l
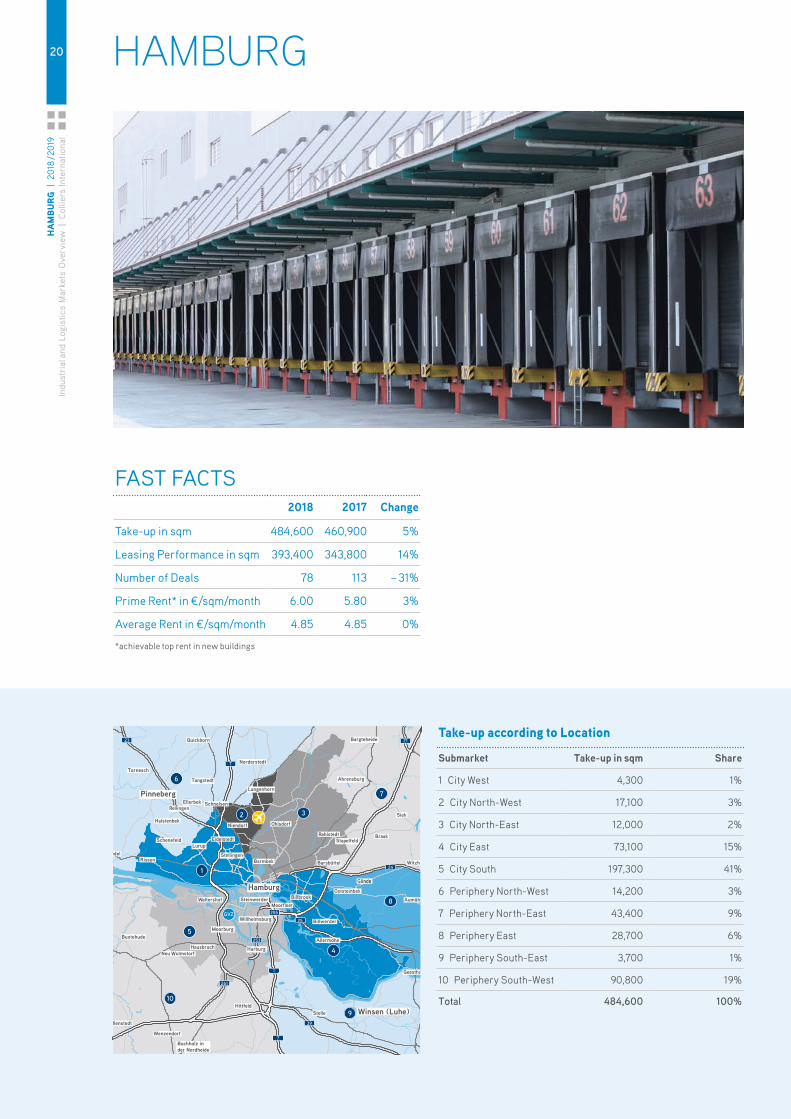
Take-up according to Location
Submarket Take-up in sqm Share
1 City West 4,300 1%
2 City North-West 17,100 3%
3 City North-East 12,000 2%
4 City East 73,100 15%
5 City South 197,300 41%
6 Periphery North-West 14,200 3%
7 Periphery North-East 43,400 9%
8 Periphery East 28,700 6%
9 Periphery South-East 3,700 1%
10 Periphery South-West 90,800 19%
Total 484,600 100%
HAMBURG
2
1
4
6
5
3
7
8
9
10
24
25
1
7
39
261
253
255
7
2123
GVZ
RellingenEllerbek
Tangstedt
Tornesch
Halstenbek
Schenefeld
Wedel
Quickborn Bargteheide
Ahrensburg
Stapelfeld
Siek
Braak
Glinde
OststeinbekAumühle
WitzhaveBarsbüttelBarmbek
Buxtehude
Neu Wulmstorf
HittfeldStelle
Hollenstedt
Wenzendorf
Buchholz in der Nordheide
Hamburg
Winsen (Luhe)
Geesthacht
Pinneberg
Billwerder
BillbrookMoorfleet
SteinwerderWaltershof
Moorburg
Hausbruch HarburgAllermöhe
Willhelmsburg
Rahlstedt
Ohlsdorf
Eidelstedt
Stellingen
Niendorf
Rissen
Lurup
Langenhorn
Schnelsen
Norderstedt
FAST FACTS2018 2017 Change
Take-up in sqm 484,600 460,900 5%
Leasing Performance in sqm 393,400 343,800 14%
Number of Deals 78 113 – 31%
Prime Rent* in €/sqm/month 6.00 5.80 3%
Average Rent in €/sqm/month 4.85 4.85 0%
*achievable top rent in new buildings
21H
amBurg
| 2018 / 2019 Industrial and Logistics M
arkets Overview
| Colliers International
0
100
200
300
400
500
600
700
800
20182017201620152014
668.8
460.9
Average 2014 – 2018Whole year
593.3
484.6450.0
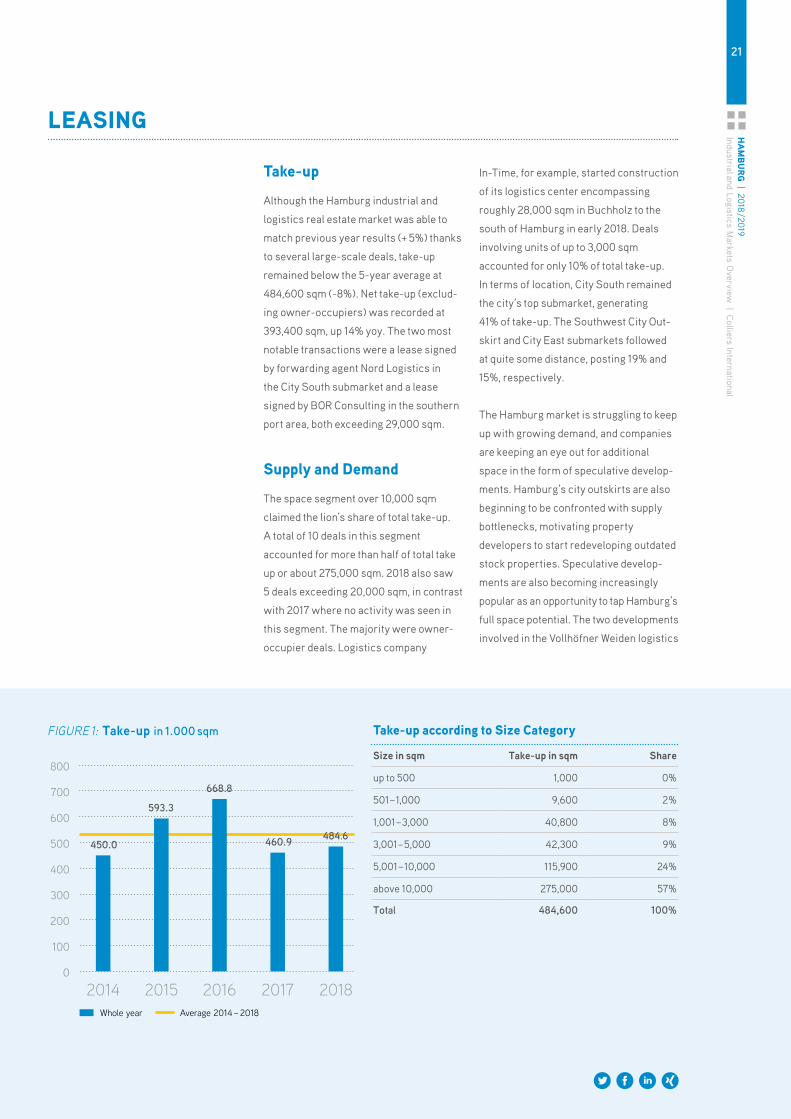
Take-up
Although the Hamburg industrial and
logistics real estate market was able to
match previous year results (+ 5%) thanks
to several large-scale deals, take-up
remained below the 5-year average at
484,600 sqm (-8%). Net take-up (exclud-
ing owner-occupiers) was recorded at
393,400 sqm, up 14% yoy. The two most
notable transactions were a lease signed
by forwarding agent Nord Logistics in
the City South submarket and a lease
signed by BOR Consulting in the southern
port area, both exceeding 29,000 sqm.
Supply and Demand
The space segment over 10,000 sqm
claimed the lion’s share of total take-up.
A total of 10 deals in this segment
accounted for more than half of total take
up or about 275,000 sqm. 2018 also saw
5 deals exceeding 20,000 sqm, in contrast
with 2017 where no activity was seen in
this segment. The majority were owner-
occupier deals. Logistics company
In-Time, for example, started construction
of its logistics center encompassing
roughly 28,000 sqm in Buchholz to the
south of Hamburg in early 2018. Deals
involving units of up to 3,000 sqm
accounted for only 10% of total take-up.
In terms of location, City South remained
the city’s top submarket, generating
41% of take-up. The Southwest City Out-
skirt and City East submarkets followed
at quite some distance, posting 19% and
15%, respectively.
The Hamburg market is struggling to keep
up with growing demand, and companies
are keeping an eye out for additional
space in the form of speculative develop-
ments. Hamburg’s city outskirts are also
beginning to be confronted with supply
bottlenecks, motivating property
developers to start redeveloping outdated
stock properties. Speculative develop-
ments are also becoming increasingly
popular as an opportunity to tap Hamburg’s
full space potential. The two developments
involved in the Vollhöfner Weiden logistics
Take-up according to Size Category
Size in sqm Take-up in sqm Share
up to 500 1,000 0%
501 – 1,000 9,600 2%
1,001 – 3,000 40,800 8%
3,001 – 5,000 42,300 9%
5,001 – 10,000 115,900 24%
above 10,000 275,000 57%
Total 484,600 100%
LEaSiNg
FIGURE 1: Take-up in 1.000 sqm
22H
amBu
rg |
201
8 / 2
019
Indu
stri
al a
nd L
ogis
tics
Mar
kets
Ove
rvie
w |
Col
liers
Inte
rnat
iona
l
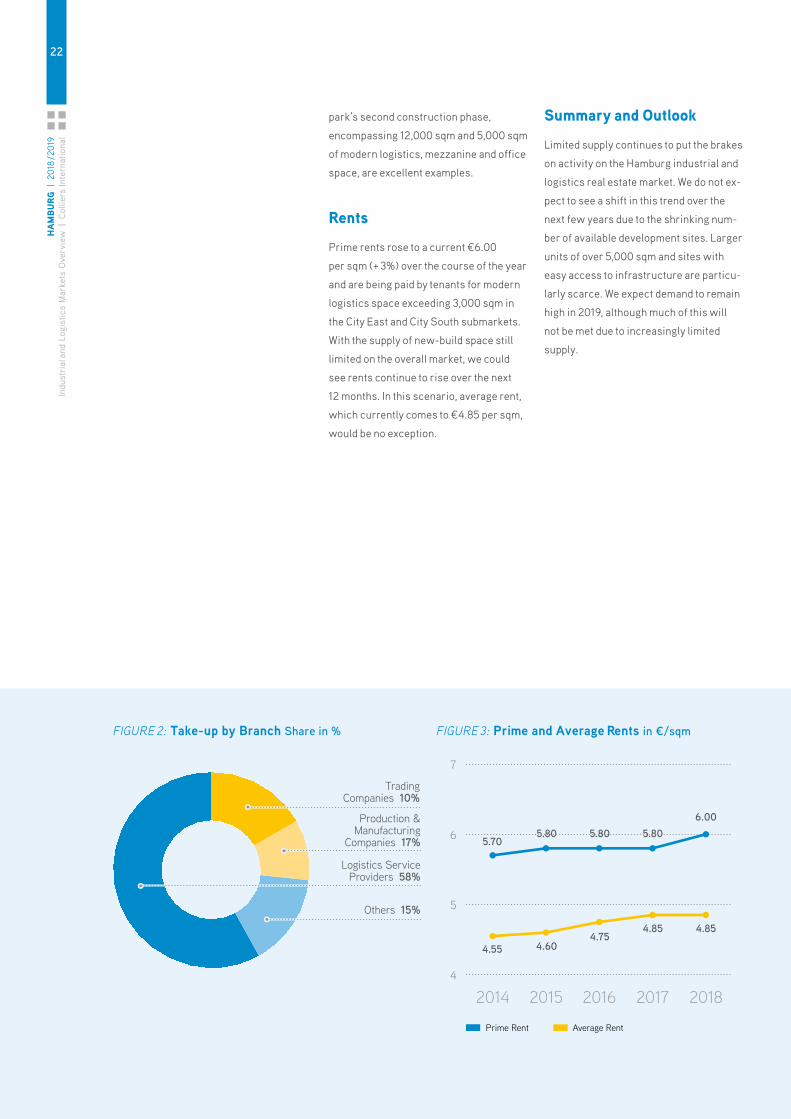
Others 15%
Logistics ServiceProviders 58%
TradingCompanies 10%
Production &Manufacturing
Companies 17% 5.705.80 5.80 5.80
4.55 4.604.75
4.85
6.00
4.85
Average RentPrime Rent
4
5
6
7
20182017201620152014
park’s second construction phase,
encompassing 12,000 sqm and 5,000 sqm
of modern logistics, mezzanine and office
space, are excellent examples.
rents
Prime rents rose to a current €6.00
per sqm (+ 3%) over the course of the year
and are being paid by tenants for modern
logistics space exceeding 3,000 sqm in
the City East and City South submarkets.
With the supply of new-build space still
limited on the overall market, we could
see rents continue to rise over the next
12 months. In this scenario, average rent,
which currently comes to €4.85 per sqm,
would be no exception.
Summary and Outlook
Limited supply continues to put the brakes
on activity on the Hamburg industrial and
logistics real estate market. We do not ex-
pect to see a shift in this trend over the
next few years due to the shrinking num-
ber of available development sites. Larger
units of over 5,000 sqm and sites with
easy access to infrastructure are particu-
larly scarce. We expect demand to remain
high in 2019, although much of this will
not be met due to increasingly limited
supply.
FIGURE 2: Take-up by Branch Share in % FIGURE 3: Prime and Average Rents in ¤/sqm
23COLOgNE
| 2018 / 2019 Industrial and Logistics M
arkets Overview
| Colliers International
Others 15%
Logistics ServiceProviders 58%
TradingCompanies 10%
Production &Manufacturing
Companies 17% 5.705.80 5.80 5.80
4.55 4.604.75
4.85
6.00
4.85
Average RentPrime Rent
4
5
6
7
20182017201620152014
FAST FACTS2018 2017 Change
Take-up in sqm 248,100 198,200 25%
Leasing Performance in sqm 236,100 163,400 44%
Number of Deals 37 21 76%
Prime Rent* in €/sqm/month 5.50 5.20 6%
Average Rent in €/sqm/month 4.50 4.20 7%
*achievable top rent in new buildings
Take-up according to Location
Submarket Take-up in sqm Share
1 Cologne 30,000 12%
2 Leverkusen 24,000 10%
3 Bergisch Gladbach 0 0%
4 Rösrath 0 0%
5 Airport Area Cologne/Bonn 0 0%
6 Troisdorf 14,100 6%
7 Niederkassel 0 0%
8 Wesseling 19,500 8%
9 Brühl 10,000 4%
10 Hürth 9,400 4%
11 Frechen 36,800 15%
12 Pulheim 12,200 5%
13 Kerpen 35,700 14%
14 Bergheim 11,400 4%
15 Bedburg 45,000 18%
Total 248,100 100%
COLOGNE
2
1
4
6
5
3
789
10
Köln11
12
13
14
15 Leverkusen
Euskirchen
Düren
Bonn
Troisdorf
Flughafen Köln/Bonn
Rösrath
Niederkassel
Wesseling
Brühl
Hürth
Frechen
Kerpen
PulheimBedburg
GVZ
Bergheim
Bergisch Gladbach
542
3
5957
46
46
540
44
61
61
565
562
560
59
555
535
4 559
4
1
3
24CO
LOgN
E |
2018
/ 201
9In
dust
rial
and
Log
istic
s M
arke
ts O
verv
iew
| C
ollie
rs In
tern
atio
nal
0
50
100
150
200
250
20182017201620152014Average 2014 – 2018Whole year
197.5
167.4
199.4 198.2
248.1
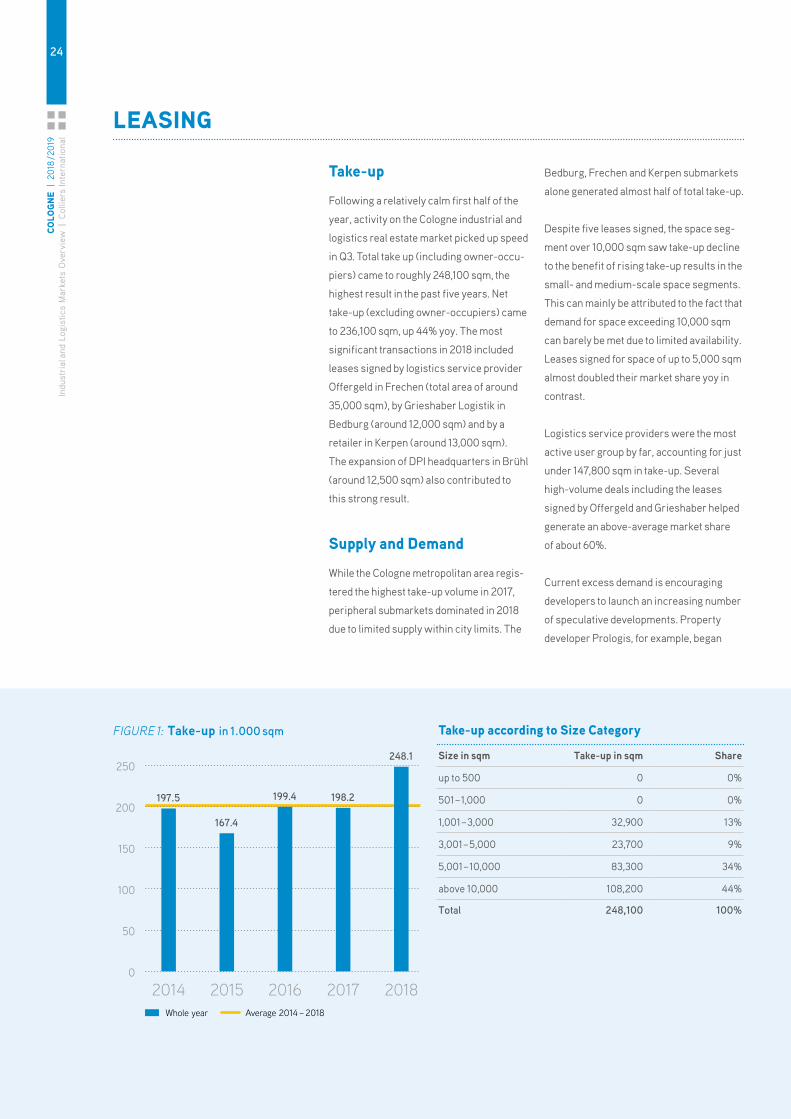
Take-up
Following a relatively calm first half of the
year, activity on the Cologne industrial and
logistics real estate market picked up speed
in Q3. Total take up (including owner-occu-
piers) came to roughly 248,100 sqm, the
highest result in the past five years. Net
take-up (excluding owner-occupiers) came
to 236,100 sqm, up 44% yoy. The most
significant transactions in 2018 included
leases signed by logistics service provider
Offergeld in Frechen (total area of around
35,000 sqm), by Grieshaber Logistik in
Bedburg (around 12,000 sqm) and by a
retailer in Kerpen (around 13,000 sqm).
The expansion of DPI headquarters in Brühl
(around 12,500 sqm) also contributed to
this strong result.
Supply and Demand
While the Cologne metropolitan area regis-
tered the highest take-up volume in 2017,
peripheral submarkets dominated in 2018
due to limited supply within city limits. The
Bedburg, Frechen and Kerpen submarkets
alone generated almost half of total take-up.
Despite five leases signed, the space seg-
ment over 10,000 sqm saw take-up decline
to the benefit of rising take-up results in the
small- and medium-scale space segments.
This can mainly be attributed to the fact that
demand for space exceeding 10,000 sqm
can barely be met due to limited availability.
Leases signed for space of up to 5,000 sqm
almost doubled their market share yoy in
contrast.
Logistics service providers were the most
active user group by far, accounting for just
under 147,800 sqm in take-up. Several
high- volume deals including the leases
signed by Offergeld and Grieshaber helped
generate an above-average market share
of about 60%.
Current excess demand is encouraging
developers to launch an increasing number
of speculative developments. Property
developer Prologis, for example, began
Take-up according to Size Category
Size in sqm Take-up in sqm Share
up to 500 0 0%
501 – 1,000 0 0%
1,001 – 3,000 32,900 13%
3,001 – 5,000 23,700 9%
5,001 – 10,000 83,300 34%
above 10,000 108,200 44%
Total 248,100 100%
LEaSiNg
FIGURE 1: Take-up in 1.000 sqm
25COLOgNE
| 2018 / 2019 Industrial and Logistics M
arkets Overview
| Colliers International
0
50
100
150
200
250
20182017201620152014Average 2014 – 2018Whole year
197.5
167.4
199.4 198.2
248.1
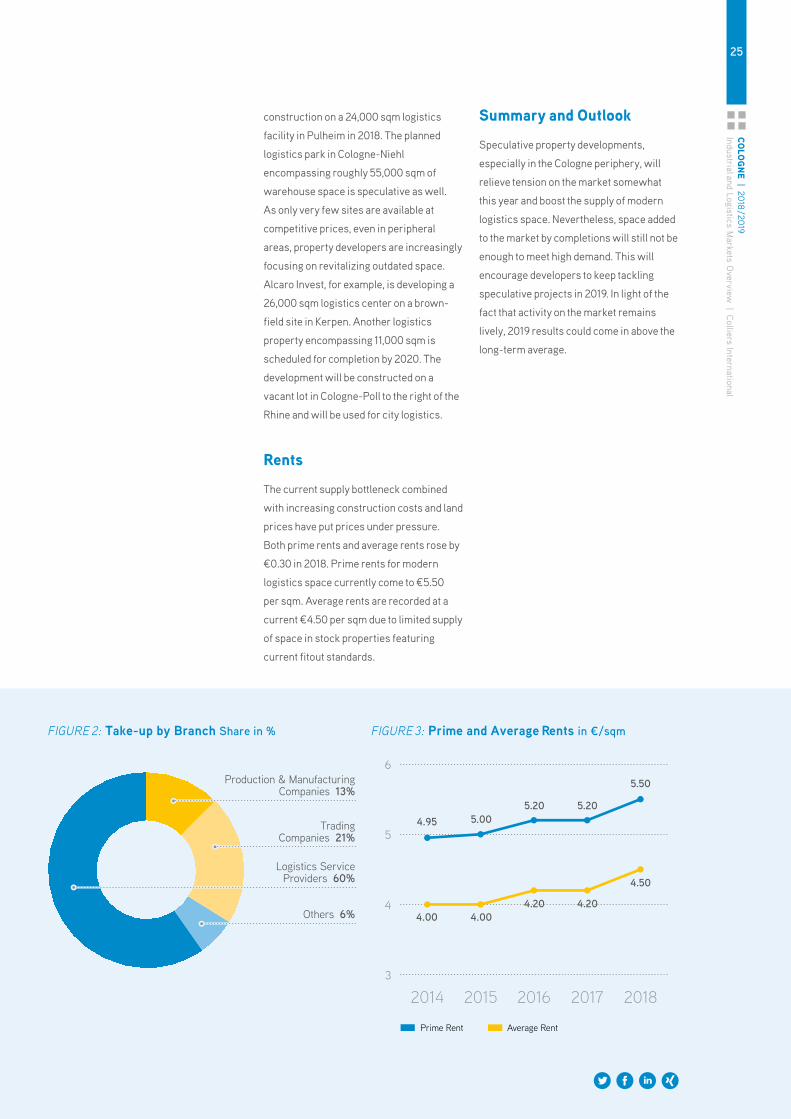
Others 6%
Logistics ServiceProviders 60%
TradingCompanies 21%
Production & ManufacturingCompanies 13%
4.95 5.005.20 5.20
4.00 4.004.20 4.20
5.50
4.50
Average RentPrime Rent
3
4
5
6
20182017201620152014
construction on a 24,000 sqm logistics
facility in Pulheim in 2018. The planned
logistics park in Cologne-Niehl
encompassing roughly 55,000 sqm of
warehouse space is speculative as well.
As only very few sites are available at
competitive prices, even in peripheral
areas, property developers are increasingly
focusing on revitalizing outdated space.
Alcaro Invest, for example, is developing a
26,000 sqm logistics center on a brown-
field site in Kerpen. Another logistics
property encompassing 11,000 sqm is
scheduled for completion by 2020. The
development will be constructed on a
vacant lot in Cologne- Poll to the right of the
Rhine and will be used for city logistics.
rents
The current supply bottleneck combined
with increasing construction costs and land
prices have put prices under pressure.
Both prime rents and average rents rose by
€0.30 in 2018. Prime rents for modern
logistics space currently come to €5.50
per sqm. Average rents are recorded at a
current €4.50 per sqm due to limited supply
of space in stock properties featuring
current fitout standards.
Summary and Outlook
Speculative property developments,
e specially in the Cologne periphery, will
relieve tension on the market somewhat
this year and boost the supply of modern
logistics space. Nevertheless, space added
to the market by completions will still not be
enough to meet high demand. This will
encourage developers to keep tackling
speculative projects in 2019. In light of the
fact that activity on the market remains
lively, 2019 results could come in above the
long-term average.
FIGURE 2: Take-up by Branch Share in % FIGURE 3: Prime and Average Rents in ¤/sqm
26LE
iPzi
g |
2018
/ 201
9In
dust
rial
and
Log
istic
s M
arke
ts O
verv
iew
| C
ollie
rs In
tern
atio
nal
Take-up according to Location
Submarket Take-up in sqm Share
1 Leipzig 118,000 34%
2 District Leipzig 5,000 2%
3 Nordsachsen 3,300 1%
4 Wittenberg 0 0%
5 Dessau-Roßlau 0 0%
6 Anhalt-Bitterfeld 4,700 1%
7 Halle (Saale) 167,800 49%
8 Saalekreis 44,900 13%
Total 343,700 100%
LEIPZIG
GVZ
2
1
4
6
5
3
7
8
38
143
14
9
389
14
72
Leipzig
Magdeburg
Landkreis Leipzig
Nordsachsen
Saalekreis
Halle (Saale) Stadt
Anhalt-Bitterfeld
WittenbergDessau-Roßlau Stadt
FAST FACTS2018 2017 Change
Take-up in sqm 343,700 116,000 196%
Leasing Performance in sqm 275,800 57,400 380%
Number of Deals 25 28 – 11%
Prime Rent* in €/sqm/month 4.60 4.50 2%
Average Rent in €/sqm/month 3.70 3.50 6%
*achievable top rent in new buildings
27LEiPzig
| 2018 / 2019 Industrial and Logistics M
arkets Overview
| Colliers International
0
100
200
300
400
20182017201620152014
258.0
343.7
116.0
279.0
Average 2014 – 2018Whole year
216.0
Take-up
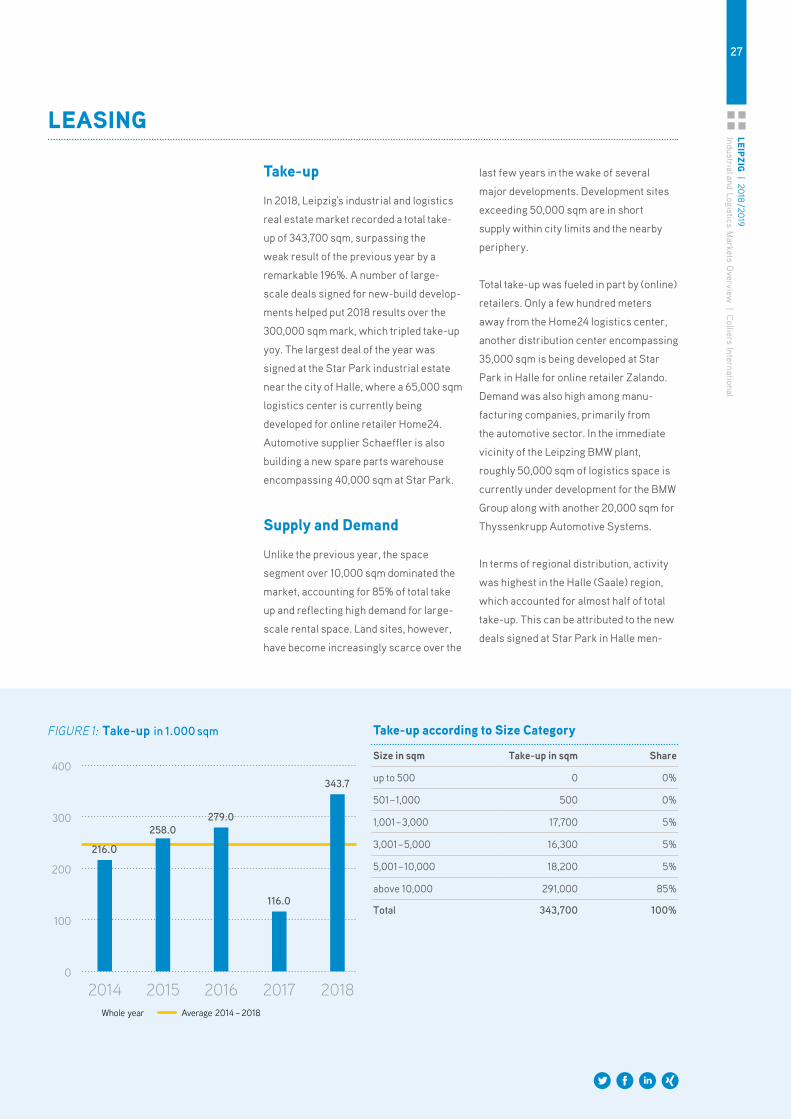
In 2018, Leipzig's industrial and logistics
real estate market recorded a total take-
up of 343,700 sqm, surpassing the
weak result of the previous year by a
remarkable 196%. A number of large-
scale deals signed for new-build develop-
ments helped put 2018 results over the
300,000 sqm mark, which tripled take-up
yoy. The largest deal of the year was
signed at the Star Park industrial estate
near the city of Halle, where a 65,000 sqm
logistics center is currently being
developed for online retailer Home24.
Automotive supplier Schaeffler is also
building a new spare parts warehouse
encompassing 40,000 sqm at Star Park.
Supply and Demand
Unlike the previous year, the space
segment over 10,000 sqm dominated the
market, accounting for 85% of total take
up and reflecting high demand for large-
scale rental space. Land sites, however,
have become increasingly scarce over the
last few years in the wake of several
major developments. Development sites
exceeding 50,000 sqm are in short
supply within city limits and the nearby
periphery.
Total take-up was fueled in part by (online)
retailers. Only a few hundred meters
away from the Home24 logistics center,
another distribution center encompassing
35,000 sqm is being developed at Star
Park in Halle for online retailer Zalando.
Demand was also high among manu-
facturing companies, primarily from
the automotive sector. In the immediate
vicinity of the Leipzing BMW plant,
roughly 50,000 sqm of logistics space is
currently under development for the BMW
Group along with another 20,000 sqm for
Thyssenkrupp Automotive Systems.
In terms of regional distribution, activity
was highest in the Halle (Saale) region,
which accounted for almost half of total
take-up. This can be attributed to the new
deals signed at Star Park in Halle men-
Take-up according to Size Category
Size in sqm Take-up in sqm Share
up to 500 0 0%
501 – 1,000 500 0%
1,001 – 3,000 17,700 5%
3,001 – 5,000 16,300 5%
5,001 – 10,000 18,200 5%
above 10,000 291,000 85%
Total 343,700 100%
LEaSiNg
FIGURE 1: Take-up in 1.000 sqm
28LE
iPzi
g |
2018
/ 201
9In
dust
rial
and
Log
istic
s M
arke
ts O
verv
iew
| C
ollie
rs In
tern
atio
nal
tioned above, which have drastically
reduced the supply of new-build space
currently available in the area. Potential
has shifted in favor of Leipzig as a result,
which is expected to offer an increased
supply of new-build space going forward.
A new-build property development by
Baytree, the company’s largest adjoining
new-build development in Leipzig to date,
is primarily behind this increased availa-
bility and addresses the growing demand
for automotive logistics space. The
development will encompass up to
100,000 sqm of new-build space, which
may be completely taken up by BMW
and automotive suppliers in the area
over the next one to two years.
rents
Most companies currently on the lookout
for space are having to turn to property
developments due to the limited supply of
stock space. The market share generated
by property developments has increased
significantly yoy with new-builds
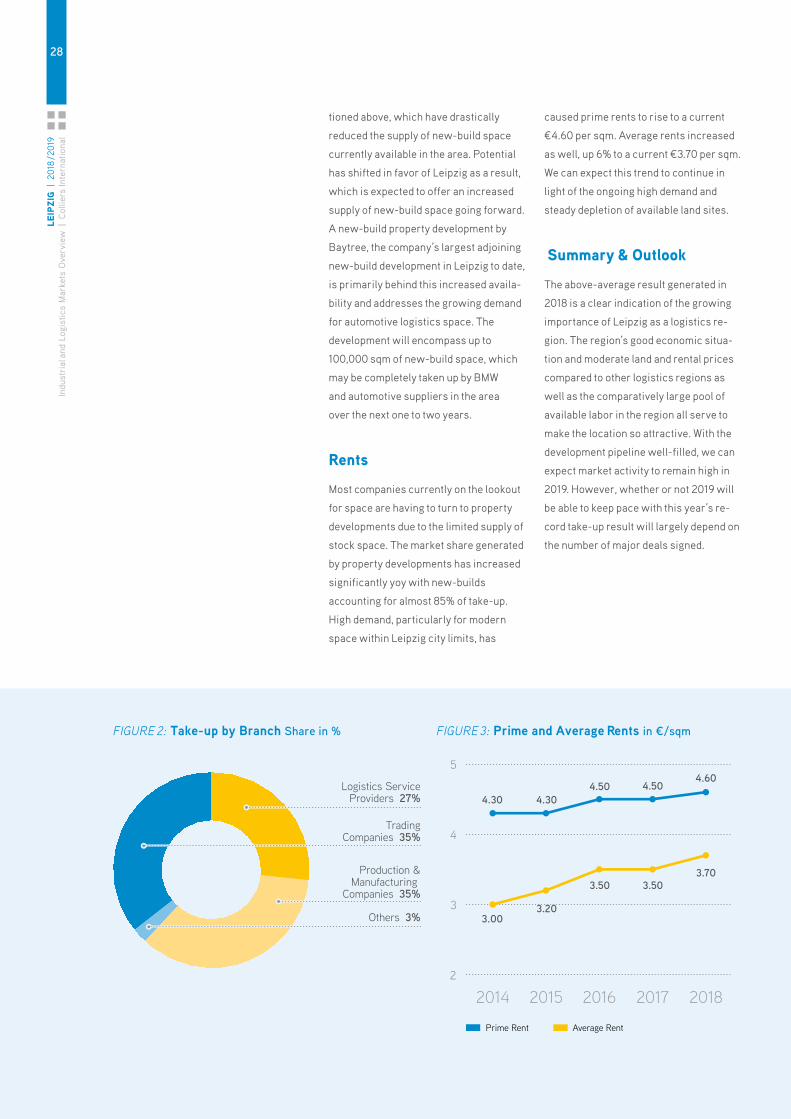
accounting for almost 85% of take-up.
High demand, particularly for modern
space within Leipzig city limits, has
caused prime rents to rise to a current
€4.60 per sqm. Average rents increased
as well, up 6% to a current €3.70 per sqm.
We can expect this trend to continue in
light of the ongoing high demand and
steady depletion of available land sites.
Summary & Outlook
The above-average result generated in
2018 is a clear indication of the growing
importance of Leipzig as a logistics re-
gion. The region’s good economic situa-
tion and moderate land and rental prices
compared to other logistics regions as
well as the comparatively large pool of
available labor in the region all serve to
make the location so attractive. With the
development pipeline well-filled, we can
expect market activity to remain high in
2019. However, whether or not 2019 will
be able to keep pace with this year’s re-
cord take-up result will largely depend on
the number of major deals signed.
FIGURE 2: Take-up by Branch Share in % FIGURE 3: Prime and Average Rents in ¤/sqm
Others 3%
TradingCompanies 35%
Production &Manufacturing
Companies 35%
4.30 4.304.50 4.50
4.60
3.003.20
3.50 3.503.70
Average RentPrime Rent
2
3
4
5
20182017201620152014
Logistics ServiceProviders 27%
29m
uNiCH | 2018 / 2019
Industrial and Logistics Markets O
verview | C
olliers International
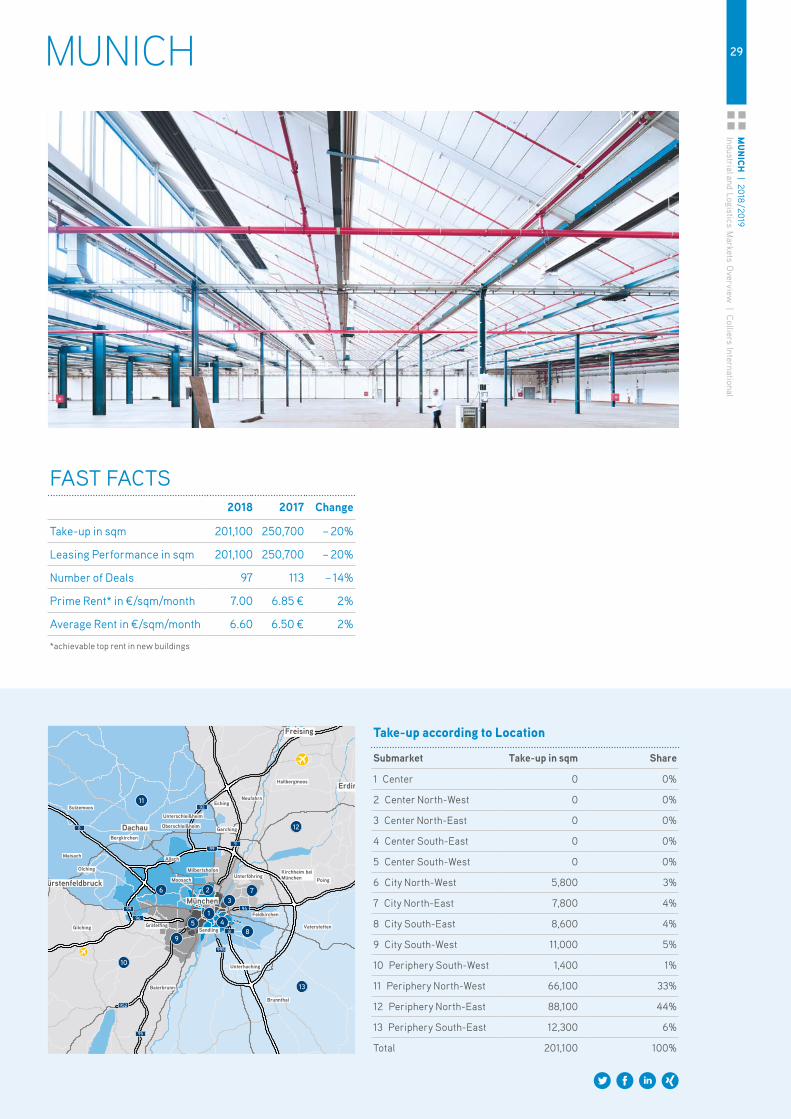
FAST FACTS2018 2017 Change
Take-up in sqm 201,100 250,700 – 20%
Leasing Performance in sqm 201,100 250,700 – 20%
Number of Deals 97 113 – 14%
Prime Rent* in €/sqm/month 7.00 6.85 € 2%
Average Rent in €/sqm/month 6.60 6.50 € 2%
*achievable top rent in new buildings
Take-up according to Location
Submarket Take-up in sqm Share
1 Center 0 0%
2 Center North-West 0 0%
3 Center North-East 0 0%
4 Center South-East 0 0%
5 Center South-West 0 0%
6 City North-West 5,800 3%
7 City North-East 7,800 4%
8 City South-East 8,600 4%
9 City South-West 11,000 5%
10 Periphery South-West 1,400 1%
11 Periphery North-West 66,100 33%
12 Periphery North-East 88,100 44%
13 Periphery South-East 12,300 6%
Total 201,100 100%
MUNICH
Others 3%
TradingCompanies 35%
Production &Manufacturing
Companies 35%
4.30 4.304.50 4.50
4.60
3.003.20
3.50 3.503.70
Average RentPrime Rent
2
3
4
5
20182017201620152014
Logistics ServiceProviders 27%
8
2
14
6
5
37
89
10
München
13
12
11
995
94
999
92
88
99
96
95
952
Garching
Hallbergmoos
NeufahrnEching
Unterschleißheim
Oberschleißheim
Allach
Moosach
Milbertshofen
Poing
Sendling
Baierbrunn
Brunnthal
Vaterstetten
Unterhaching
Feldkirchen
UnterföhringKirchheim bei München
Gräfelfing
Olching
Maisach
Sulzemoos
Bergkirchen
Gilching
Fürstenfeldbruck
Dachau
Freising
Erding
30m
uNiC
H |
201
8 / 2
019
Indu
stri
al a
nd L
ogis
tics
Mar
kets
Ove
rvie
w |
Col
liers
Inte
rnat
iona
l
Take-up
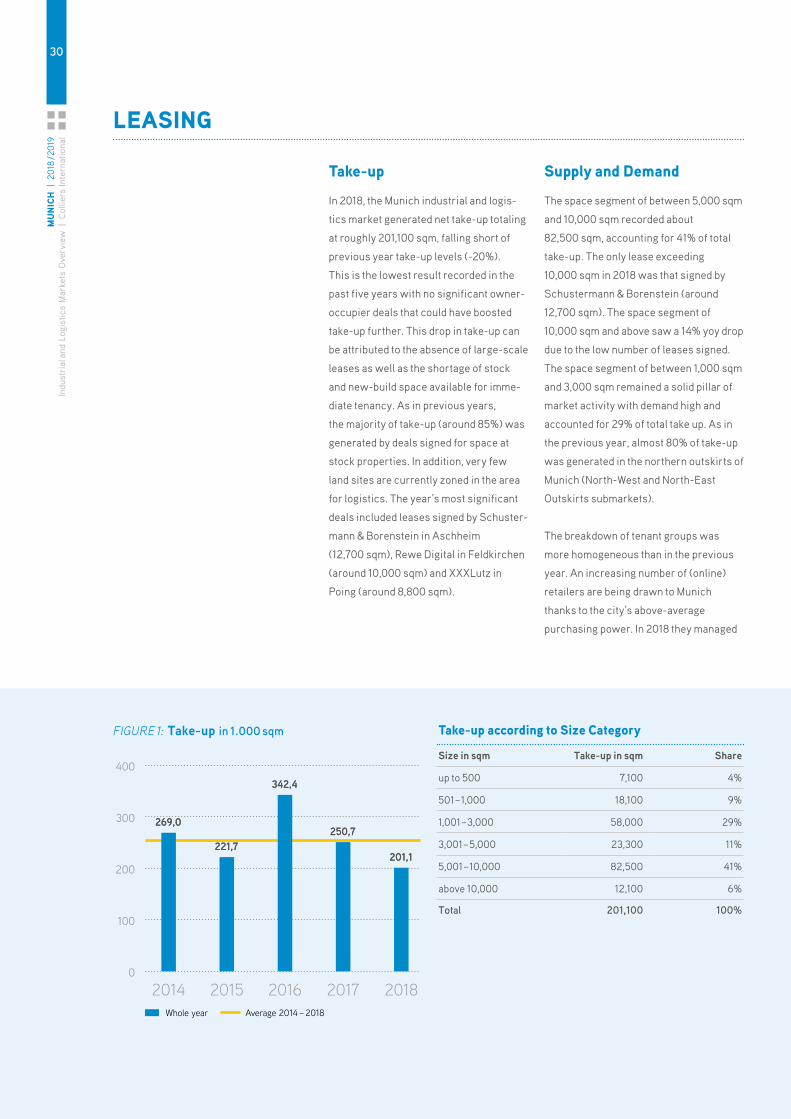
In 2018, the Munich industrial and logis-
tics market generated net take-up totaling
at roughly 201,100 sqm, falling short of
previous year take-up levels (-20%).
This is the lowest result recorded in the
past five years with no significant owner-
occupier deals that could have boosted
take-up further. This drop in take-up can
be attributed to the absence of large-scale
leases as well as the shortage of stock
and new-build space available for imme-
diate tenancy. As in previous years,
the majority of take-up (around 85%) was
generated by deals signed for space at
stock properties. In addition, very few
land sites are currently zoned in the area
for logistics. The year’s most significant
deals included leases signed by Schuster-
mann & Borenstein in Aschheim
(12,700 sqm), Rewe Digital in Feldkirchen
(around 10,000 sqm) and XXXLutz in
Poing (around 8,800 sqm).
Supply and Demand
The space segment of between 5,000 sqm
and 10,000 sqm recorded about
82,500 sqm, accounting for 41% of total
take-up. The only lease exceeding
10,000 sqm in 2018 was that signed by
Schustermann & Borenstein (around
12,700 sqm). The space segment of
10,000 sqm and above saw a 14% yoy drop
due to the low number of leases signed.
The space segment of between 1,000 sqm
and 3,000 sqm remained a solid pillar of
market activity with demand high and
accounted for 29% of total take up. As in
the previous year, almost 80% of take-up
was generated in the northern outskirts of
Munich (North-West and North-East
Outskirts submarkets).
The breakdown of tenant groups was
more homogeneous than in the previous
year. An increasing number of (online)
retailers are being drawn to Munich
thanks to the city’s above-average
p urchasing power. In 2018 they managed
LEaSiNg
FIGURE 1: Take-up in 1.000 sqm
0
100
200
300
400
20182017201620152014
269,0
221,7
342,4
250,7
201,1
Average 2014 – 2018Whole year
269.0
221.7
342.4
250.7
201.1
Take-up according to Size Category
Size in sqm Take-up in sqm Share
up to 500 7,100 4%
501 – 1,000 18,100 9%
1,001 – 3,000 58,000 29%
3,001 – 5,000 23,300 11%
5,001 – 10,000 82,500 41%
above 10,000 12,100 6%
Total 201,100 100%
31m
uNiCH | 2018 / 2019
Industrial and Logistics Markets O
verview | C
olliers International
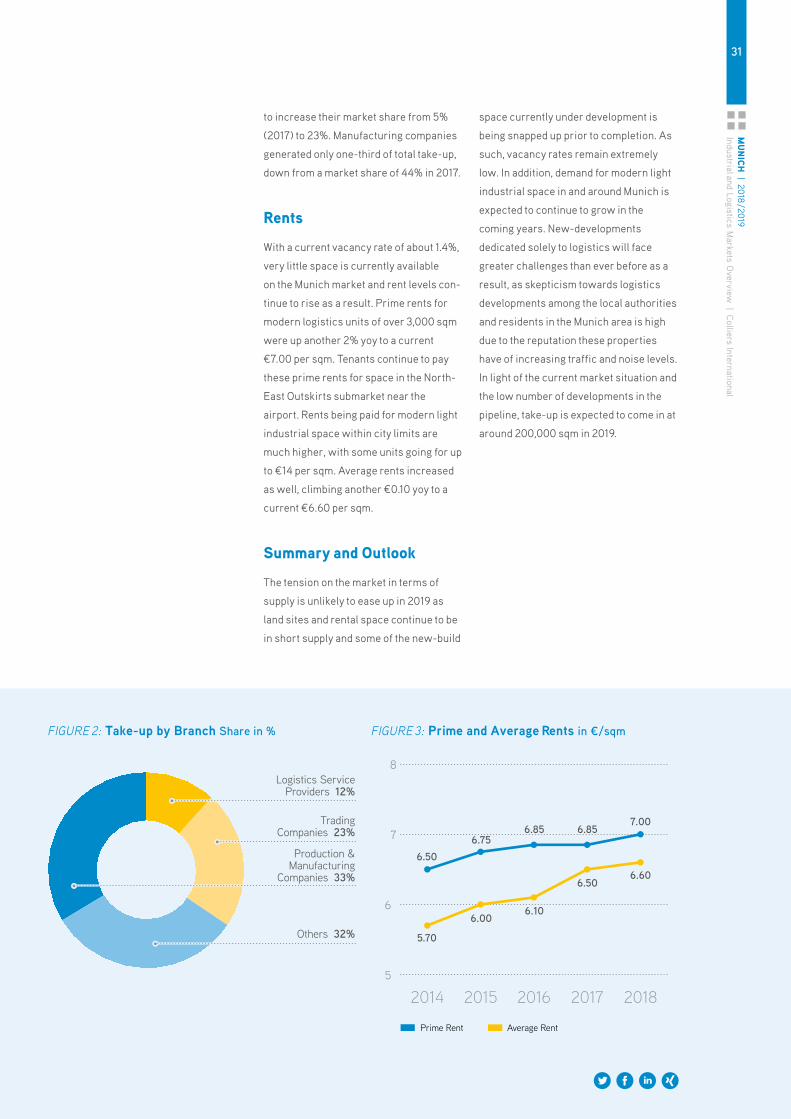
to increase their market share from 5%
(2017) to 23%. Manufacturing companies
generated only one-third of total take-up,
down from a market share of 44% in 2017.
rents
With a current vacancy rate of about 1.4%,
very little space is currently available
on the Munich market and rent levels con-
tinue to rise as a result. Prime rents for
modern logistics units of over 3,000 sqm
were up another 2% yoy to a current
€7.00 per sqm. Tenants continue to pay
these prime rents for space in the North-
East Outskirts submarket near the
airport. Rents being paid for modern light
industrial space within city limits are
much higher, with some units going for up
to €14 per sqm. Average rents increased
as well, climbing another €0.10 yoy to a
current €6.60 per sqm.
Summary and Outlook
The tension on the market in terms of
supply is unlikely to ease up in 2019 as
land sites and rental space continue to be
in short supply and some of the new-build
space currently under development is
being snapped up prior to completion. As
such, vacancy rates remain extremely
low. In addition, demand for modern light
industrial space in and around Munich is
expected to continue to grow in the
coming years. New-developments
dedicated solely to logistics will face
greater challenges than ever before as a
result, as skepticism towards logistics
developments among the local authorities
and residents in the Munich area is high
due to the reputation these properties
have of increasing traffic and noise levels.
In light of the current market situation and
the low number of developments in the
pipeline, take-up is expected to come in at
around 200,000 sqm in 2019.
FIGURE 2: Take-up by Branch Share in % FIGURE 3: Prime and Average Rents in ¤/sqm
0
100
200
300
400
20182017201620152014
269,0
221,7
342,4
250,7
201,1
Average 2014 – 2018Whole year
269.0
221.7
342.4
250.7
201.1
Others 32%
Logistics ServiceProviders 12%
TradingCompanies 23%
Production &Manufacturing
Companies 33%
6.506.75
6.85 6.85
5.70
6.006.10
6.50
7.00
6.60
Average RentPrime Rent
5
6
7
8
20182017201620152014
32ST
uTTg
arT
| 20
18 / 2
019
Indu
stri
al a
nd L
ogis
tics
Mar
kets
Ove
rvie
w |
Col
liers
Inte
rnat
iona
l
Take-up according to Location
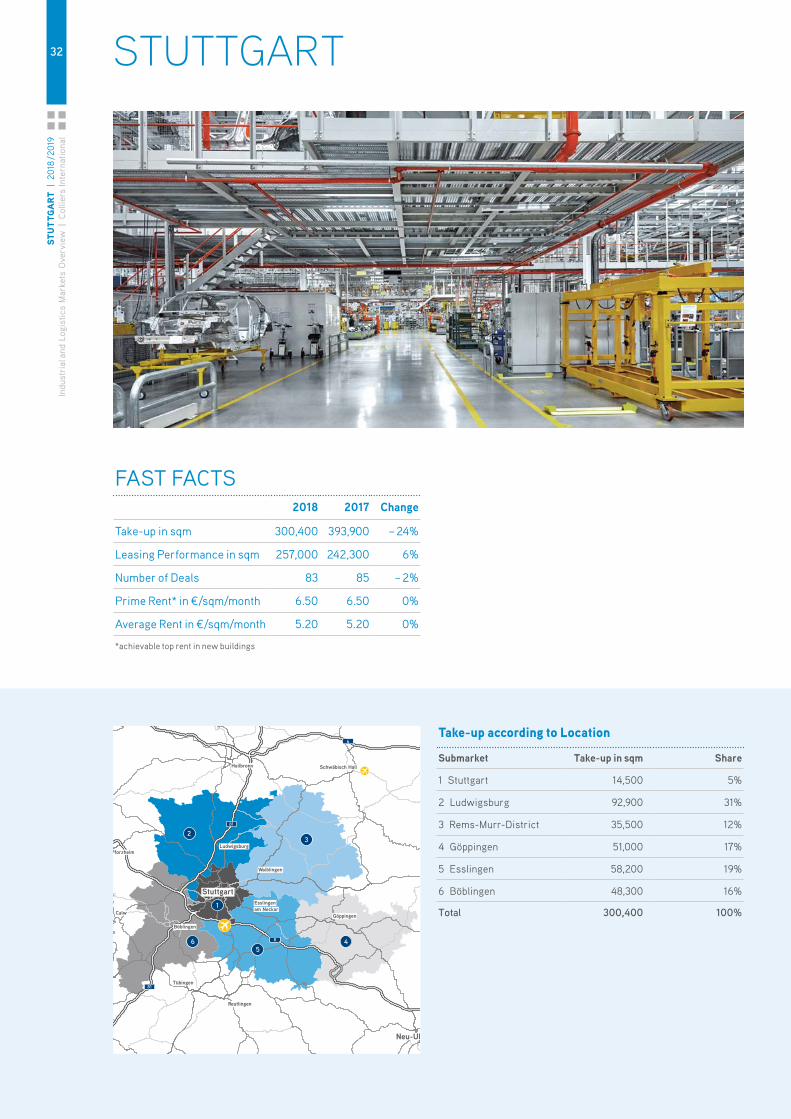
Submarket Take-up in sqm Share
1 Stuttgart 14,500 5%
2 Ludwigsburg 92,900 31%
3 Rems-Murr-District 35,500 12%
4 Göppingen 51,000 17%
5 Esslingen 58,200 19%
6 Böblingen 48,300 16%
Total 300,400 100%
STUTTGART
am Neckar
Waiblingen
Esslingen
Göppingen
Ludwigsburg
Böblingen
Calw
Pforzheim
Heilbronn Schwäbisch Hall
Tübingen
Reutlingen
Stuttgart
Neu-Ulm
2
1
465
3
6
81
8
81
FAST FACTS2018 2017 Change
Take-up in sqm 300,400 393,900 – 24%
Leasing Performance in sqm 257,000 242,300 6%
Number of Deals 83 85 – 2%
Prime Rent* in €/sqm/month 6.50 6.50 0%
Average Rent in €/sqm/month 5.20 5.20 0%
*achievable top rent in new buildings
33STuTTgarT
| 2018 / 2019 Industrial and Logistics M
arkets Overview
| Colliers International
0
100
200
300
400
20182017201620152014
171.0
235.0267.6
393.9
300.4
Average 2014 – 2018Whole year
Take-up
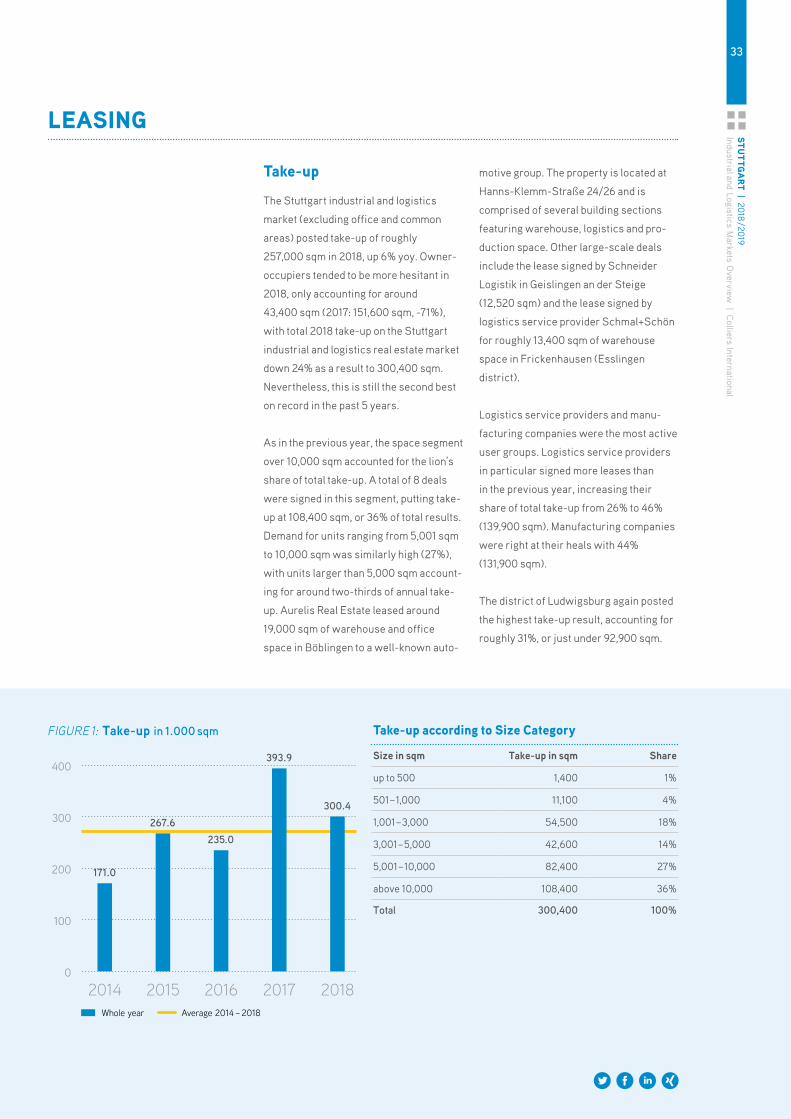
The Stuttgart industrial and logistics
market (excluding office and common
areas) posted take-up of roughly
257,000 sqm in 2018, up 6% yoy. Owner-
occupiers tended to be more hesitant in
2018, only accounting for around
43,400 sqm (2017: 151,600 sqm, -71%),
with total 2018 take-up on the Stuttgart
industrial and logistics real estate market
down 24% as a result to 300,400 sqm.
Nevertheless, this is still the second best
on record in the past 5 years.
As in the previous year, the space segment
over 10,000 sqm accounted for the lion’s
share of total take-up. A total of 8 deals
were signed in this segment, putting take-
up at 108,400 sqm, or 36% of total results.
Demand for units ranging from 5,001 sqm
to 10,000 sqm was similarly high (27%),
with units larger than 5,000 sqm account-
ing for around two-thirds of annual take-
up. Aurelis Real Estate leased around
19,000 sqm of warehouse and office
space in Böblingen to a well-known auto-
motive group. The property is located at
Hanns-Klemm-Straße 24/26 and is
comprised of several building sections
featuring warehouse, logistics and pro-
duction space. Other large-scale deals
include the lease signed by Schneider
Logistik in Geislingen an der Steige
(12,520 sqm) and the lease signed by
logistics service provider Schmal+Schön
for roughly 13,400 sqm of warehouse
space in Frickenhausen (Esslingen
district).
Logistics service providers and manu-
facturing companies were the most active
user groups. Logistics service providers
in particular signed more leases than
in the previous year, increasing their
share of total take-up from 26% to 46%
(139,900 sqm). Manufacturing companies
were right at their heals with 44%
(131,900 sqm).
The district of Ludwigsburg again posted
the highest take-up result, accounting for
roughly 31%, or just under 92,900 sqm.
Take-up according to Size Category
Size in sqm Take-up in sqm Share
up to 500 1,400 1%
501 – 1,000 11,100 4%
1,001 – 3,000 54,500 18%
3,001 – 5,000 42,600 14%
5,001 – 10,000 82,400 27%
above 10,000 108,400 36%
Total 300,400 100%
LEaSiNg
FIGURE 1: Take-up in 1.000 sqm
34ST
uTTg
arT
| 20
18 / 2
019
Indu
stri
al a
nd L
ogis
tics
Mar
kets
Ove
rvie
w |
Col
liers
Inte
rnat
iona
l
One-third of all deals signed in 2018
involved space in this submarket, with
units averaging at 3,400 sqm.
rents
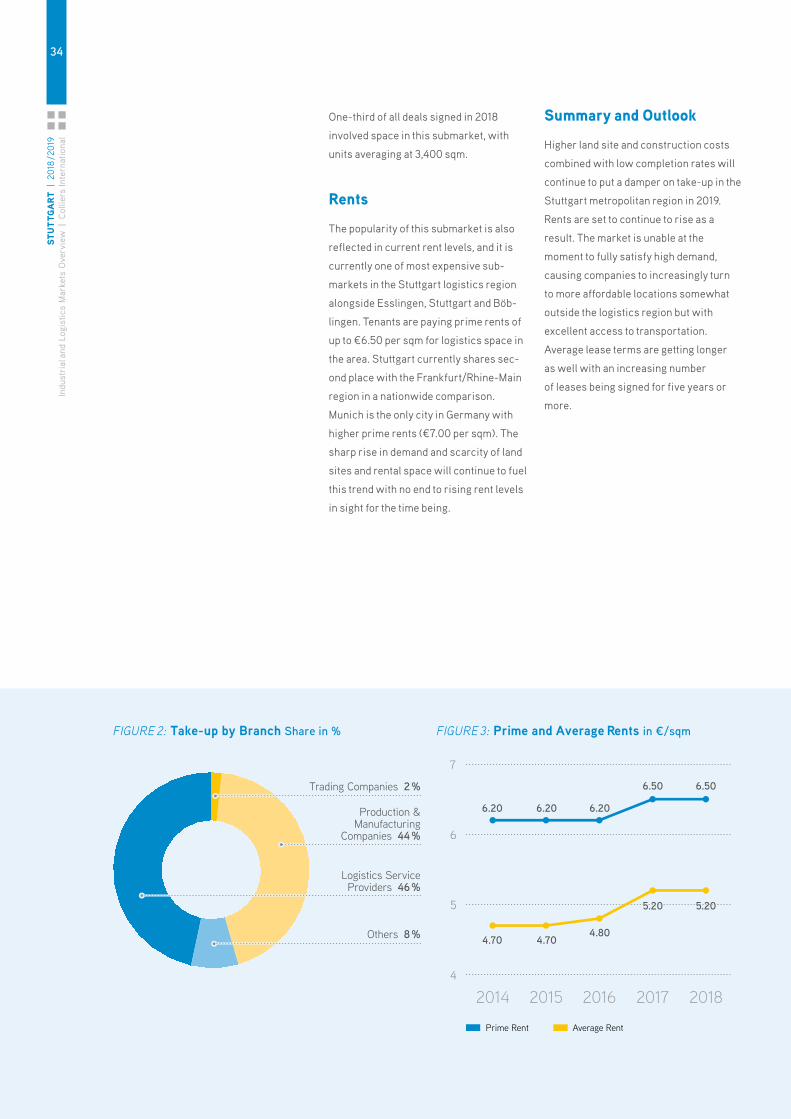
The popularity of this submarket is also
reflected in current rent levels, and it is
currently one of most expensive sub-
markets in the Stuttgart logistics region
alongside Esslingen, Stuttgart and Böb-
lingen. Tenants are paying prime rents of
up to €6.50 per sqm for logistics space in
the area. Stuttgart currently shares sec-
ond place with the Frankfurt/Rhine-Main
region in a nationwide comparison.
Munich is the only city in Germany with
higher prime rents (€7.00 per sqm). The
sharp rise in demand and scarcity of land
sites and rental space will continue to fuel
this trend with no end to rising rent levels
in sight for the time being.
Summary and Outlook
Higher land site and construction costs
combined with low completion rates will
continue to put a damper on take-up in the
Stuttgart metropolitan region in 2019.
Rents are set to continue to rise as a
result. The market is unable at the
moment to fully satisfy high demand,
causing companies to increasingly turn
to more affordable locations somewhat
outside the logistics region but with
excellent access to transportation.
Average lease terms are getting longer
as well with an increasing number
of leases being signed for five years or
more.
FIGURE 2: Take-up by Branch Share in % FIGURE 3: Prime and Average Rents in ¤/sqm
Others 8 %
Trading Companies 2 %
Production &Manufacturing
Companies 44 %
6.20 6.20 6.20
6.50 6.50
4.70 4.704.80
5.20 5.20
Average RentPrime Rent
4
5
6
7
20182017201620152014
Logistics ServiceProviders 46 %
35iNvESTm
ENT | 2018 / 2019
Industrial and Logistics Markets O
verview | C
olliers International INVESTMENT
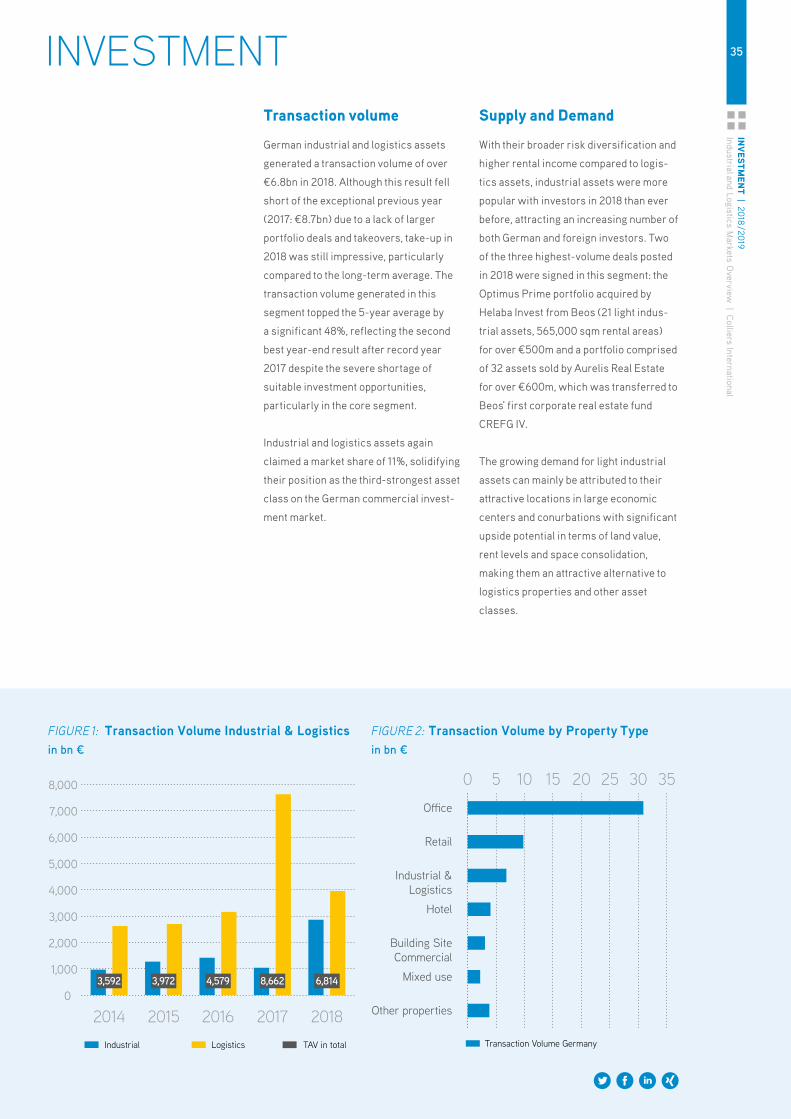
Transaction volume
German industrial and logistics assets
generated a transaction volume of over
€6.8bn in 2018. Although this result fell
short of the exceptional previous year
(2017: €8.7bn) due to a lack of larger
portfolio deals and takeovers, take-up in
2018 was still impressive, particularly
compared to the long-term average. The
transaction volume generated in this
segment topped the 5-year average by
a significant 48%, reflecting the second
best year-end result after record year
2017 despite the severe shortage of
suitable investment opportunities,
particularly in the core segment.
Industrial and logistics assets again
claimed a market share of 11%, solidifying
their position as the third-strongest asset
class on the German commercial invest-
ment market.
Supply and Demand
With their broader risk diversification and
higher rental income compared to logis-
tics assets, industrial assets were more
popular with investors in 2018 than ever
before, attracting an increasing number of
both German and foreign investors. Two
of the three highest-volume deals posted
in 2018 were signed in this segment: the
Optimus Prime portfolio acquired by
Helaba Invest from Beos (21 light indus-
trial assets, 565,000 sqm rental areas)
for over €500m and a portfolio comprised
of 32 assets sold by Aurelis Real Estate
for over €600m, which was transferred to
Beos' first corporate real estate fund
CREFG IV.
The growing demand for light industrial
assets can mainly be attributed to their
attractive locations in large economic
centers and conurbations with significant
upside potential in terms of land value,
rent levels and space consolidation,
making them an attractive alternative to
logistics properties and other asset
classes.
Others 8 %
Trading Companies 2 %
Production &Manufacturing
Companies 44 %
6.20 6.20 6.20
6.50 6.50
4.70 4.704.80
5.20 5.20
Average RentPrime Rent
4
5
6
7
20182017201620152014
Logistics ServiceProviders 46 %
Industrial Logistics
0
1,000
2,000
3,000
4,000
5,000
6,000
7,000
8,000
20182017201620152014Transaction Volume Germany
0 5 10 15 20 25 30 35
Other properties
Mixed use
Building SiteCommercial
Hotel
Industrial &Logistics
Retail
Office
TAV in total
3,592 3,972 4,579 8,662 6,814
FIGURE 2: Transaction Volume by Property Type in bn €
FIGURE 1: Transaction Volume Industrial & Logistics in bn €
36iN
vEST
mEN
T |
2018
/ 201
9In
dust
rial
and
Log
istic
s M
arke
ts O
verv
iew
| C
ollie
rs In
tern
atio
nal
0 1 2 3 4
Other Investors
Property Developers
Closed-ended Real Estate Funds
REITs
Open-ended Real Estate Funds/Special Funds
Asset Managers/Fund Managers
Other Investors
Private Investors/Family Offices
Open-ended Real Estate Funds/Special Funds
Corporates/Owner-Occupiers
Asset Managers/Fund Managers
Property Developers
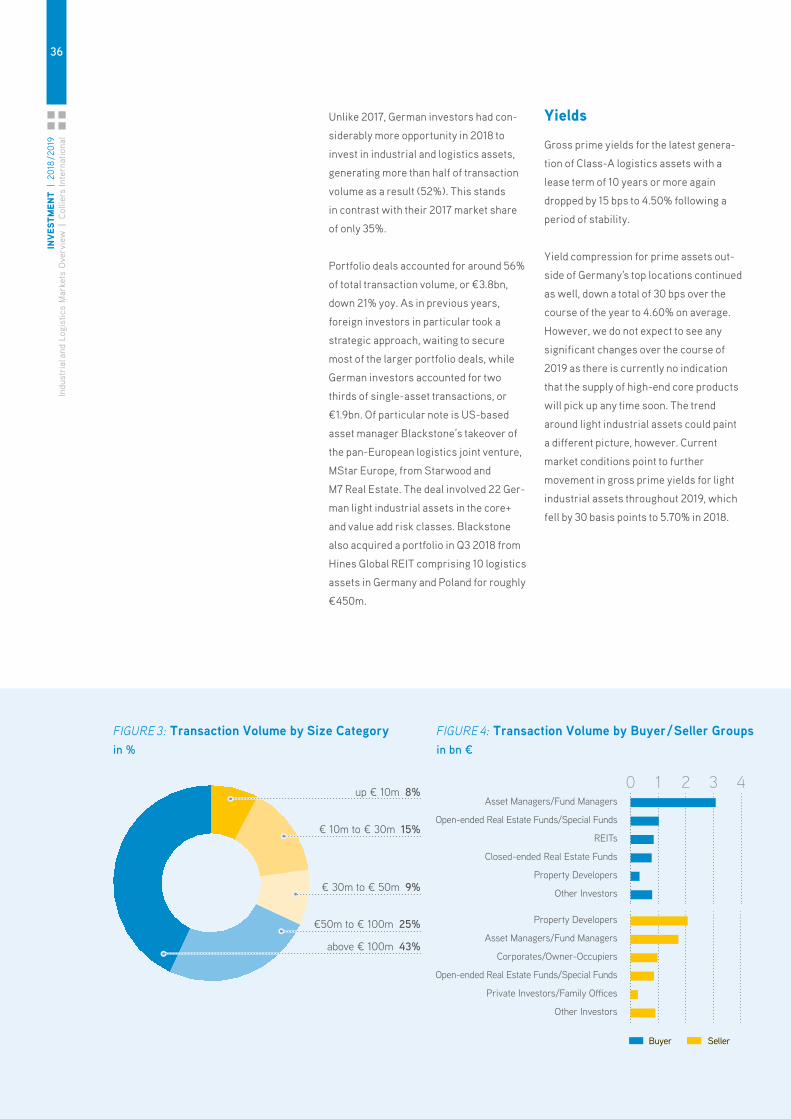
up € 10m 8%
€ 10m to € 30m 15%
€ 30m to € 50m 9%
above € 100m 43%
€50m to € 100m 25%
SellerBuyer SellerBuyer National International
0
20
40
60
80
100
201820172016201520144,0
4,5
5,0
5,5
6,0
6,5
7,0
Q4 18Q4 17Q4 16Q4 15Q4 14
Unlike 2017, German investors had con-
siderably more opportunity in 2018 to
invest in industrial and logistics assets,
generating more than half of transaction
volume as a result (52%). This stands
in contrast with their 2017 market share
of only 35%.
Portfolio deals accounted for around 56%
of total transaction volume, or €3.8bn,
down 21% yoy. As in previous years,
foreign investors in particular took a
strategic approach, waiting to secure
most of the larger portfolio deals, while
German investors accounted for two
thirds of single-asset transactions, or
€1.9bn. Of particular note is US-based
asset manager Blackstone’s takeover of
the pan-European logistics joint venture,
MStar Europe, from Starwood and
M7 Real Estate. The deal involved 22 Ger-
man light industrial assets in the core+
and value add risk classes. Blackstone
also acquired a portfolio in Q3 2018 from
Hines Global REIT comprising 10 logistics
assets in Germany and Poland for roughly
€450m.
yields
Gross prime yields for the latest genera-
tion of Class-A logistics assets with a
lease term of 10 years or more again
dropped by 15 bps to 4.50% following a
period of stability.
Yield compression for prime assets out-
side of Germany's top locations continued
as well, down a total of 30 bps over the
course of the year to 4.60% on average.
However, we do not expect to see any
significant changes over the course of
2019 as there is currently no indication
that the supply of high-end core products
will pick up any time soon. The trend
around light industrial assets could paint
a different picture, however. Current
market conditions point to further
movement in gross prime yields for light
industrial assets throughout 2019, which
fell by 30 basis points to 5.70% in 2018.
FIGURE 3: Transaction Volume by Size Category in %
FIGURE 4: Transaction Volume by Buyer / Seller Groups in bn €
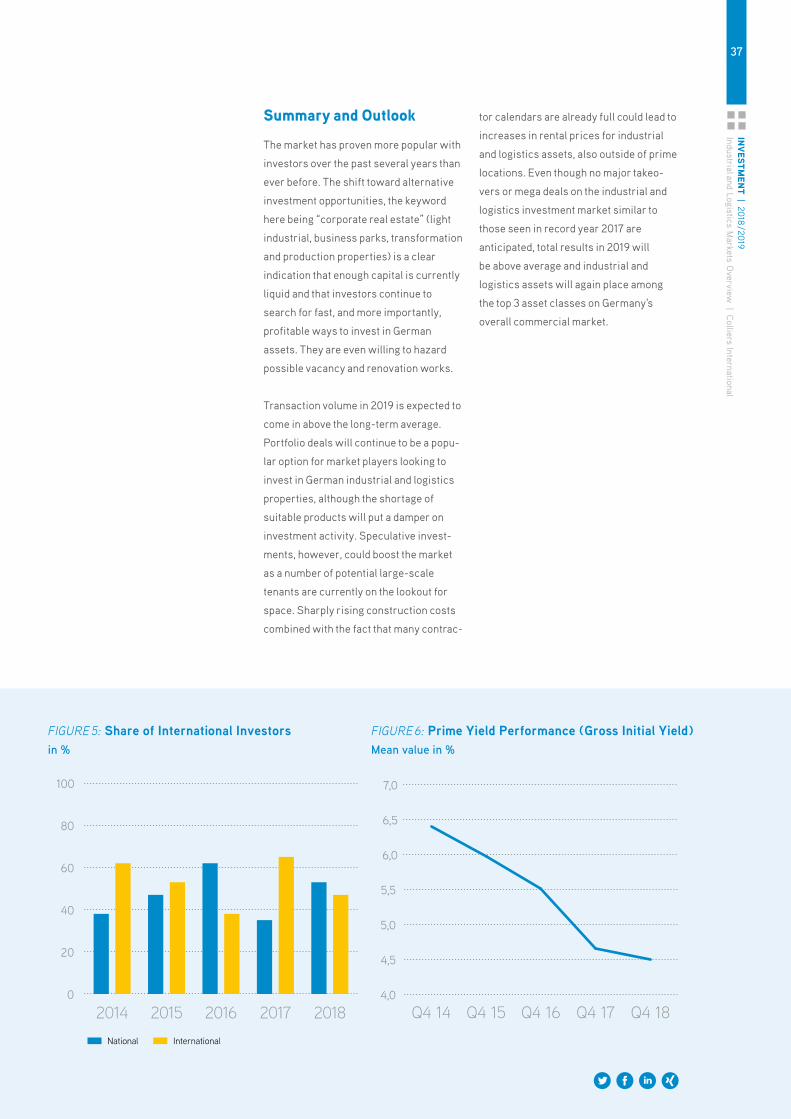
37iNvESTm
ENT | 2018 / 2019
Industrial and Logistics Markets O
verview | C
olliers International
0 1 2 3 4
Other Investors
Property Developers
Closed-ended Real Estate Funds
REITs
Open-ended Real Estate Funds/Special Funds
Asset Managers/Fund Managers
Other Investors
Private Investors/Family Offices
Open-ended Real Estate Funds/Special Funds
Corporates/Owner-Occupiers
Asset Managers/Fund Managers
Property Developers
up € 10m 8%
€ 10m to € 30m 15%
€ 30m to € 50m 9%
above € 100m 43%
€50m to € 100m 25%
SellerBuyer SellerBuyer National International
0
20
40
60
80
100
201820172016201520144,0
4,5
5,0
5,5
6,0
6,5
7,0
Q4 18Q4 17Q4 16Q4 15Q4 14
Summary and Outlook
The market has proven more popular with
investors over the past several years than
ever before. The shift toward alternative
investment opportunities, the keyword
here being “corporate real estate” (light
industrial, business parks, transformation
and production properties) is a clear
indication that enough capital is currently
liquid and that investors continue to
search for fast, and more importantly,
profitable ways to invest in German
assets. They are even willing to hazard
possible vacancy and renovation works.
Transaction volume in 2019 is expected to
come in above the long-term average.
Portfolio deals will continue to be a popu-
lar option for market players looking to
invest in German industrial and logistics
properties, although the shortage of
suitable products will put a damper on
investment activity. Speculative invest-
ments, however, could boost the market
as a number of potential large-scale
tenants are currently on the lookout for
space. Sharply rising construction costs
combined with the fact that many contrac-
tor calendars are already full could lead to
increases in rental prices for industrial
and logistics assets, also outside of prime
locations. Even though no major takeo-
vers or mega deals on the industrial and
logistics investment market similar to
those seen in record year 2017 are
anti cipated, total results in 2019 will
be above average and industrial and
logistics assets will again place among
the top 3 asset classes on Germany's
overall commercial market.
FIGURE 5: Share of International Investors in %
FIGURE 6: Prime Yield Performance (Gross Initial Yield) Mean value in %
38gL
OSSa
ry |
201
8 / 2
019
Indu
stri
al a
nd L
ogis
tics
Mar
kets
Ove
rvie
w |
Col
liers
Inte
rnat
iona
l
Take-up of space Take-up of space is the sum of all spaces
either newly let, or built by an owner-
occupier within the period under conside-
ration. The salient date is that on which
the lease agreement is signed. The
renewal of an existing lease is not coun-
ted in the take-up of space. Exclusively
logistics and industrial space serves
as the basis of calculation; pro-rata office
and ancillary space is not taken into
account.
Leasing PerformanceLeasing performance reflects take-up
excluding owner-occupied space.
Exclusively logistics and industrial
space serves as the basis of calculation;
pro- rata office and ancillary space is
not taken into account.
Prime RentPrime rent refers to latest generation
logistics space exceeding 3,000 sqm
(min. height 10 m bottom edge,
2–3 docking gates / 1,000 sqm, sprink-
ler system, office share up to 10%).
Average RentAverage rent refers to multi-functional
logistics space exceeding 3,000 sqm
(height > 7 m bottom edge, 1–2 docking
gates / 1,000 sqm, low office share).
Prime YieldsGross prime yield refers to Class-A
properties (latest generation logistics
properties, max. age of building 10 years,
> 5,000 sqm, height > 10.0 m bottom
edge with docking gates, long lease
terms) in Germany’s top investment
markets.
GLOSSARY
BerlinBudapester Straße 50
10787 Berlin
Phone +49 30 202993-0
DüsseldorfKönigsallee 60 C
(Entrance Grünstraße)
40212 Düsseldorf
Phone +49 211 862062-0
FrankfurtThurn-und-Taxis-Platz 6
60313 Frankfurt am Main
Phone +49 69 719192-0
HamburgBurchardstraße 17
20095 Hamburg
Phone +49 40 328701-0
CologneKranhaus 1, Im Zollhafen 18
50678 Cologne
Phone +49 221 986537-0
LeipzigMarkgrafenstraße 2
04109 Leipzig
Phone +49 341 2182990-0
MunichDachauer Straße 63
80335 Munich
Phone +49 89 624294-0
StuttgartKönigstraße 5
70173 Stuttgart
Phone +49 711 22733-0
CONTACTS / LOCATIONSPeter Kunz FRICSHEAD OF INDUSTRIAL
& LOGISTICS EMEA
Hubert ReckHEAD OF INDUSTRIAL &
LOGISTICS INVESTMENT
Susanne KieseHEAD OF RESEARCH
Nicole KinneRESEARCH INDUSTRIAL
& LOGISTICS
Manuela EggRESEARCH INDUSTRIAL
& LOGISTICS
Photo credits
Front page: VGP Park Leipzig, VGP Industriebau GmbH
Berlin : Segro Airport Park Berlin, Segro Germany GmbH
Düsseldorf : iStock, Acnakelsy
Frankfurt : BTS Logistikpark Lorsch, Panattoni Europe
Hamburg : Loading Bay, Matic Kuder
Cologne : Interior view of a modern logistics property,
Thinkstock, Alexey05
Leipzig : VGP Park Leipzig, VGP Industriebau GmbH
Munich : NOVA Neufahrn, BEOS AG
Stuttgart : iStock, Automotive, Morsa Images
CONTACT
Copyright © 2019 Colliers International Deutschland GmbH
This document has been prepared by Colliers International for advertising and general information only. Colliers Inter-national makes no guarantees, representations or warranties of any kind, expressed or implied, regarding the informa-tion including, but not limited to, warranties of content, accuracy and reliability. Any interested party should undertake their own inquiries as to the accuracy of the information. Colliers International excludes unequivocally all inferred or implied terms, conditions and warranties arising out of this document and excludes all liability for loss and damages arising there from. This publication is the copyrighted property of Colliers International and/or its licensor(s).
© 2019. All rights reserved.
Colliers InternationalDeutschland GmbHThurn-und-Taxis-Platz 660313 Frankfurt
rESEarCH
Nicole KinneSenior Consultant I Research Industrial & Logistics+49 89 [email protected]
Manuela EggJunior Consultant I Research Industrial & Logistics+ 49 89 [email protected]