Embed Size (px)
Citation preview
GET BalticRegional gas trading platform for the Baltic States
Gintaras Buzkys
Chief Business Development Officer
Baltic Gas Market Forum (Tartu, Estonia)
April 17th 2018
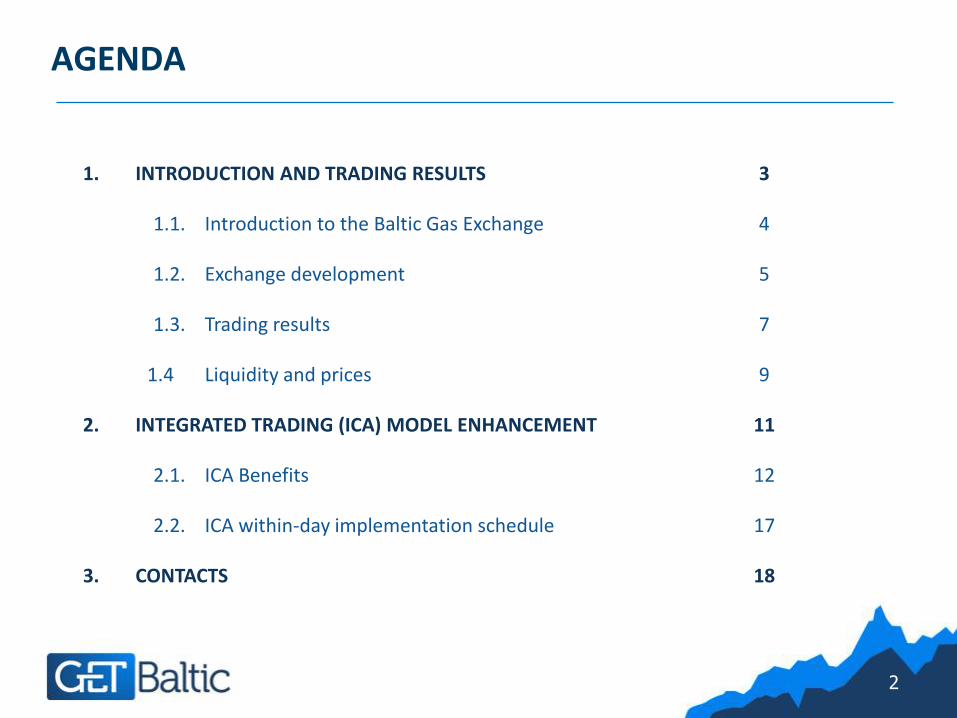
AGENDA
2
1. INTRODUCTION AND TRADING RESULTS 3
1.1. Introduction to the Baltic Gas Exchange 4
1.2. Exchange development 5
1.3. Trading results 7
1.4 Liquidity and prices 9
2. INTEGRATED TRADING (ICA) MODEL ENHANCEMENT 11
2.1. ICA Benefits 12
2.2. ICA within-day implementation schedule 17
3. CONTACTS 18
3
INTRODUCTION AND DEVELOPMENT
Introduction to the Baltic Gas Exchange
4
7
8
66
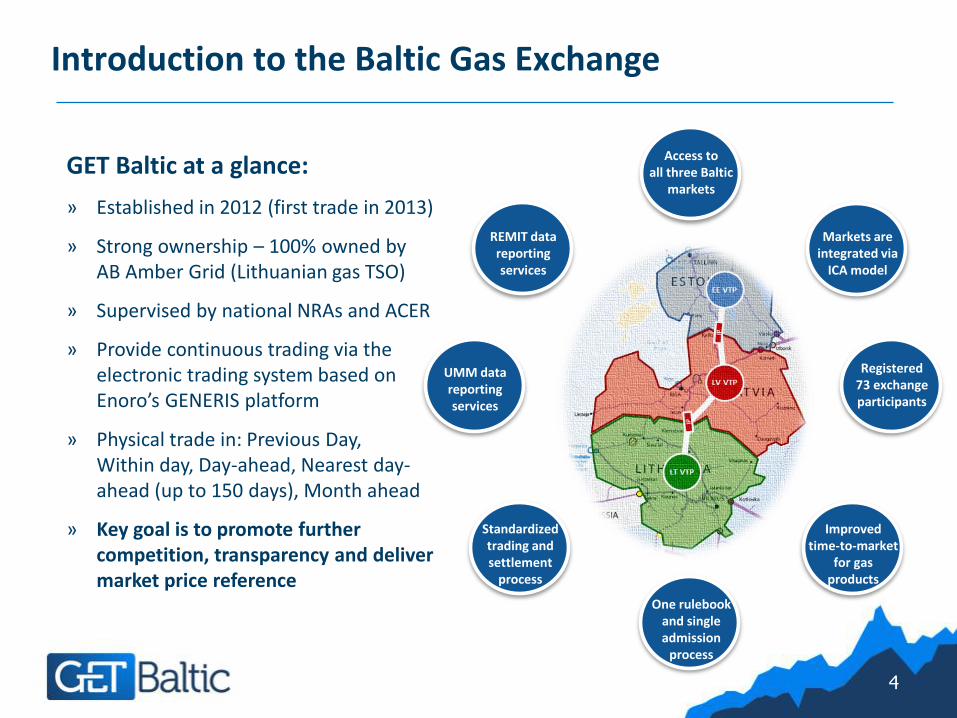
GET Baltic at a glance:
» Established in 2012 (first trade in 2013)
» Strong ownership – 100% owned by AB Amber Grid (Lithuanian gas TSO)
» Supervised by national NRAs and ACER
» Provide continuous trading via the electronic trading system based on Enoro’s GENERIS platform
» Physical trade in: Previous Day, Within day, Day-ahead, Nearest day-ahead (up to 150 days), Month ahead
» Key goal is to promote further competition, transparency and deliver market price reference
REMIT data reporting services
Access to all three Baltic
markets
Markets are integrated via
ICA model
Registered 73 exchange participants
Improved time-to-market
for gas products
One rulebook and single admission
process
Standardized trading and settlement
process
UMM data reporting services
Exchange development
5
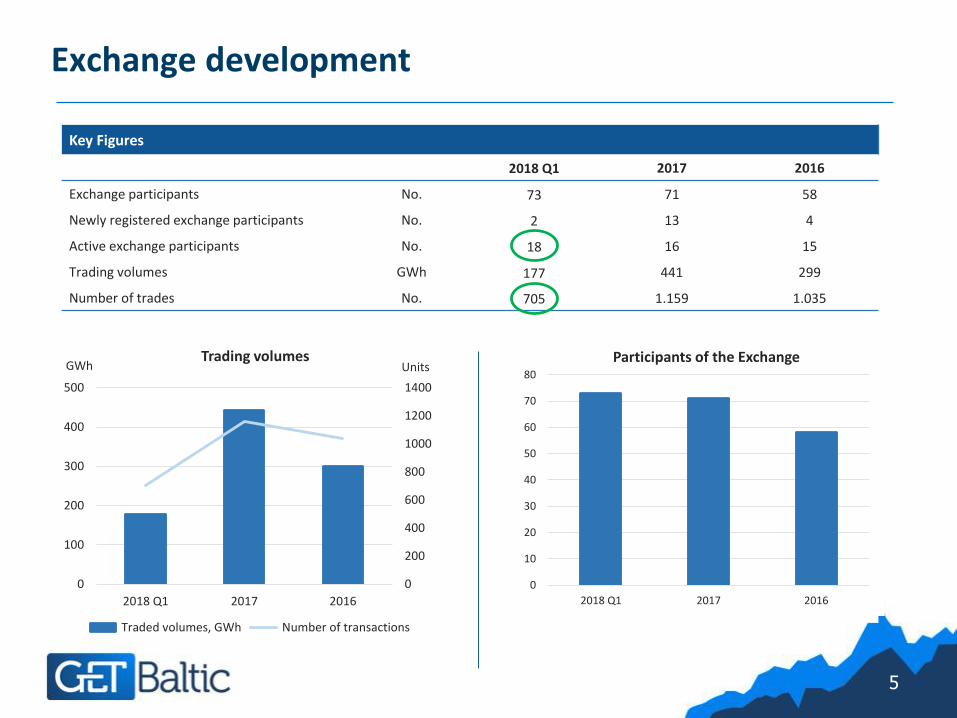
Key Figures
2018 Q1 2017 2016
Exchange participants No. 73 71 58
Newly registered exchange participants No. 2 13 4
Active exchange participants No. 18 16 15
Trading volumes GWh 177 441 299
Number of trades No. 705 1.159 1.035
0
10
20
30
40
50
60
70
80
2017 2016 2015
Participants of the Exchange
0
200
400
600
800
1000
1200
1400
0
100
200
300
400
500
2018 Q1 2017 2016
UnitsGWhTrading volumes
Traded volumes, GWh Number of transactions
0
10
20
30
40
50
60
70
80
2018 Q1 2017 2016
Participants of the Exchange
Exchange participants on the Baltic Gas Exchange
6
Trading volumes and activity | Baltics
7
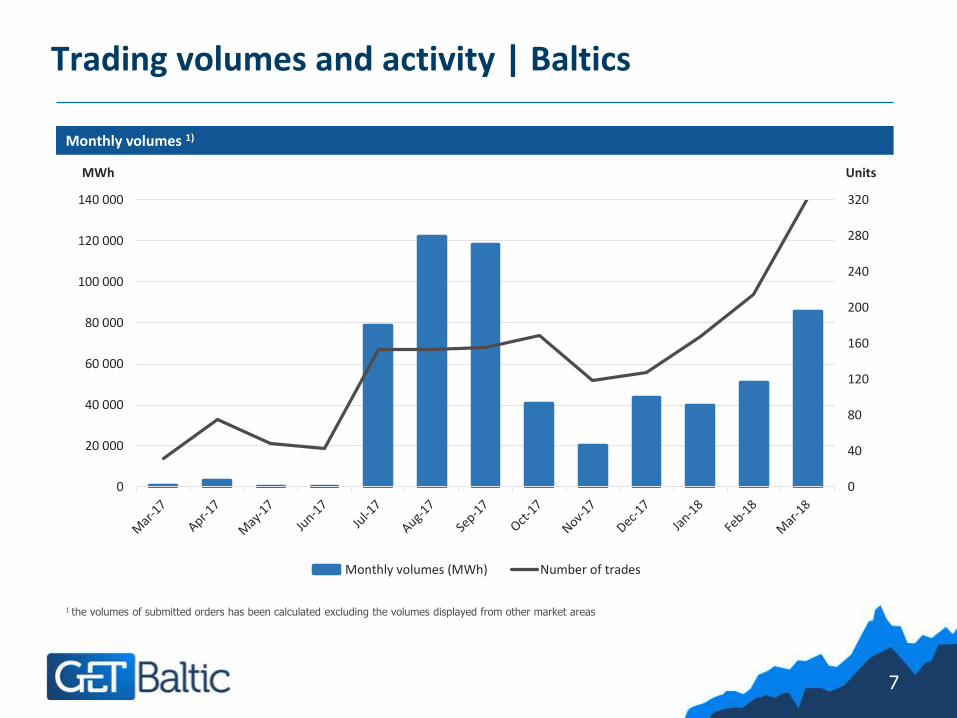
Monthly volumes 1)
1 the volumes of submitted orders has been calculated excluding the volumes displayed from other market areas
0
40
80
120
160
200
240
280
320
0
20 000
40 000
60 000
80 000
100 000
120 000
140 000
UnitsMWh
Monthly volumes (MWh) Number of trades
8
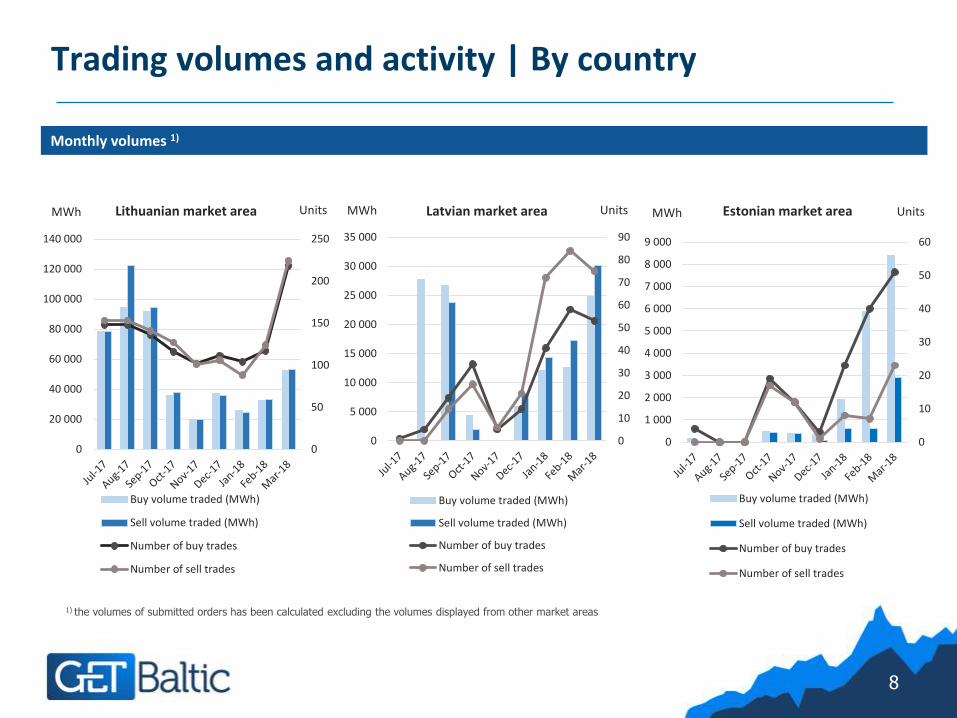
Trading volumes and activity | By country
Monthly volumes 1)
1) the volumes of submitted orders has been calculated excluding the volumes displayed from other market areas
0
50
100
150
200
250
0
20 000
40 000
60 000
80 000
100 000
120 000
140 000
UnitsMWh Lithuanian market area
Buy volume traded (MWh)
Sell volume traded (MWh)
Number of buy trades
Number of sell trades
0
10
20
30
40
50
60
70
80
90
0
5 000
10 000
15 000
20 000
25 000
30 000
35 000
UnitsMWh Latvian market area
Buy volume traded (MWh)
Sell volume traded (MWh)
Number of buy trades
Number of sell trades
0
10
20
30
40
50
60
0
1 000
2 000
3 000
4 000
5 000
6 000
7 000
8 000
9 000
UnitsMWh Estonian market area
Buy volume traded (MWh)
Sell volume traded (MWh)
Number of buy trades
Number of sell trades
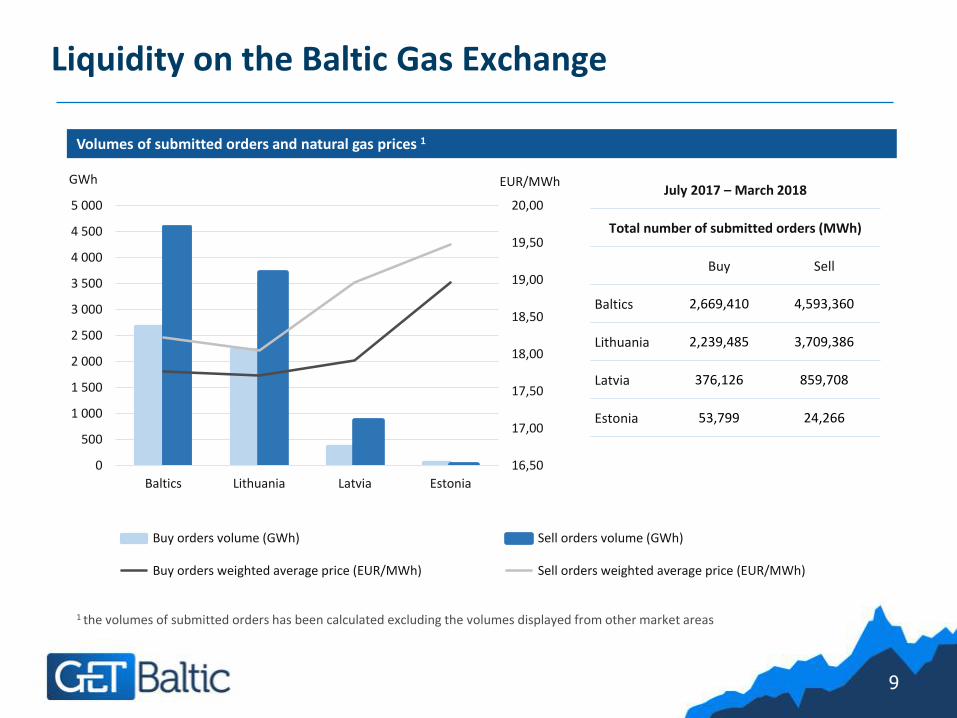
Liquidity on the Baltic Gas Exchange
9
Volumes of submitted orders and natural gas prices 1
1 the volumes of submitted orders has been calculated excluding the volumes displayed from other market areas
16,50
17,00
17,50
18,00
18,50
19,00
19,50
20,00
0
500
1 000
1 500
2 000
2 500
3 000
3 500
4 000
4 500
5 000
Baltics Lithuania Latvia Estonia
EUR/MWhGWh
Buy orders volume (GWh) Sell orders volume (GWh)
Buy orders weighted average price (EUR/MWh) Sell orders weighted average price (EUR/MWh)
July 2017 – March 2018
Total number of submitted orders (MWh)
Buy Sell
Baltics 2,669,410 4,593,360
Lithuania 2,239,485 3,709,386
Latvia 376,126 859,708
Estonia 53,799 24,266

Liquidity impact on prices on the Baltic Gas Exchange
10
Market Makers program increases liquidity and ensures lower spreads for the Baltic market
Argus started publishing Baltic Gas Spot Index (BGSI) in a daily publications of Argus European Natural Gas
Natural Gas Prices, July 2017 – March 2018
0,00
10,00
20,00
30,00
40,00
50,00
60,00
70,00
EUR
/MW
h
BGSI GASPOOL index
11
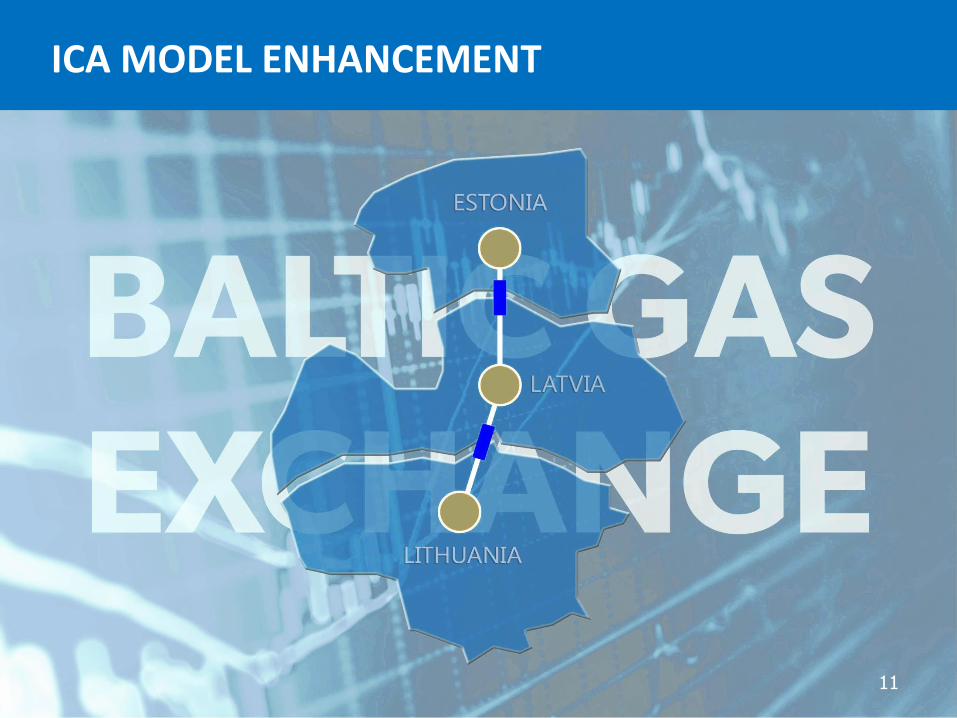
ICA MODEL ENHANCEMENT

ICA Benefits 1)
12
• Increased liquidity in the region
• Increased competition in the region
• Short-term price convergence
• Virtual reverse capacity opportunity from EE to LV
• Convenient for traders and shippers:
o No double or triple capacity bookings necessary at IPs
o Capacity is booked automatically
o Capacity is booked only for purchased gas quantity
MARKET INTEGRATION TOOL
1) ICA – implicit capacity allocation model includes the allocation of short-term transmission capacities between member states on the natural gas exchange platform together with the volume of gas sold on the Baltic countries’ markets through the exchange.
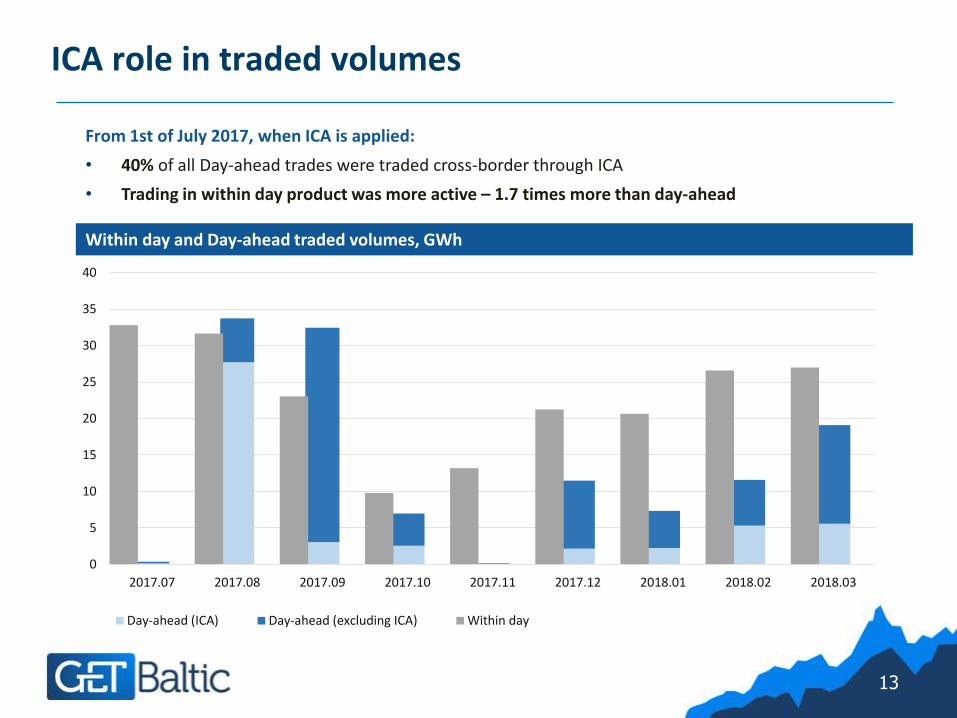
ICA role in traded volumes
13
From 1st of July 2017, when ICA is applied:
• 40% of all Day-ahead trades were traded cross-border through ICA
• Trading in within day product was more active – 1.7 times more than day-ahead
Within day and Day-ahead traded volumes, GWh
0
5
10
15
20
25
30
35
40
2017.07 2017.08 2017.09 2017.10 2017.11 2017.12 2018.01 2018.02 2018.03
Day-ahead (ICA) Day-ahead (excluding ICA) Within day first second
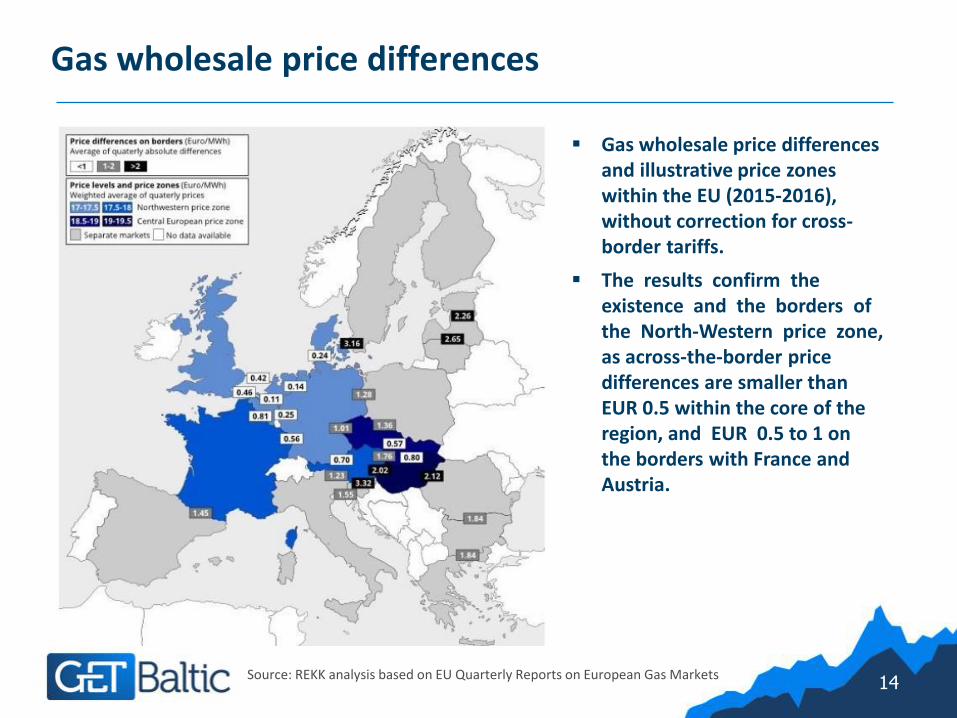
Gas wholesale price differences
14
Gas wholesale price differences and illustrative price zones within the EU (2015-2016), without correction for cross-border tariffs.
The results confirm the existence and the borders of the North-Western price zone, as across-the-border price differences are smaller than EUR 0.5 within the core of the region, and EUR 0.5 to 1 on the borders with France and Austria.
Source: REKK analysis based on EU Quarterly Reports on European Gas Markets
0,00
0,10
0,20
0,30
0,40
0,50
0,60
0,70
0,80
0,90
1,00
2017.07 2017.08 2017.09 2017.10 2017.11 2017.12 2018.01 2018.02 2018.03
Day-ahead Entry/exit tariff at LT-LV IP*
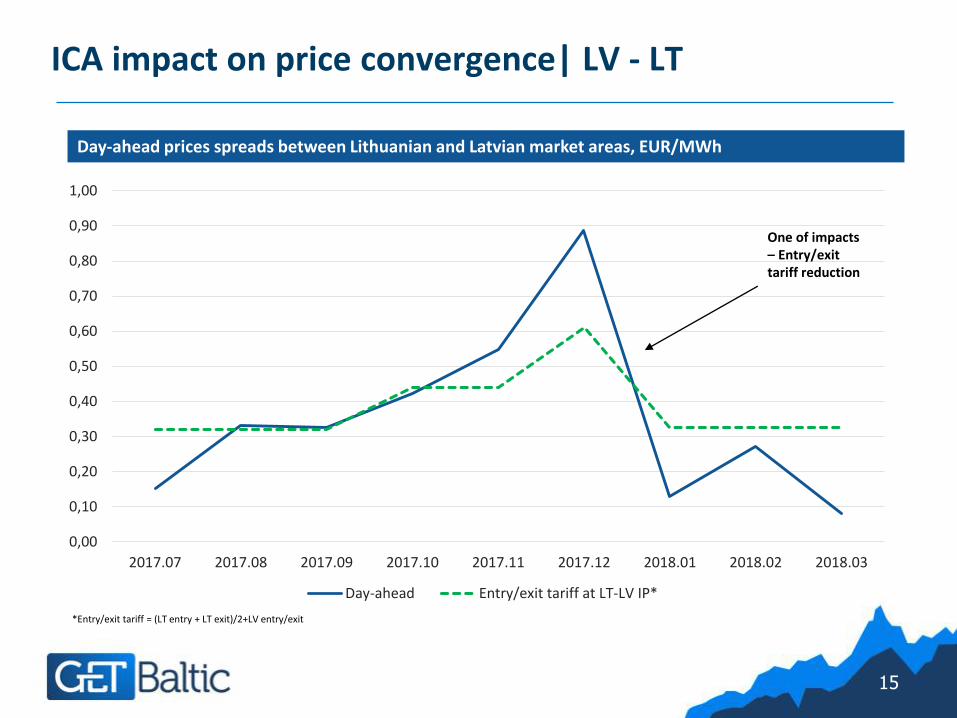
ICA impact on price convergence| LV - LT
15
Day-ahead prices spreads between Lithuanian and Latvian market areas, EUR/MWh
One of impacts – Entry/exit tariff reduction
*Entry/exit tariff = (LT entry + LT exit)/2+LV entry/exit
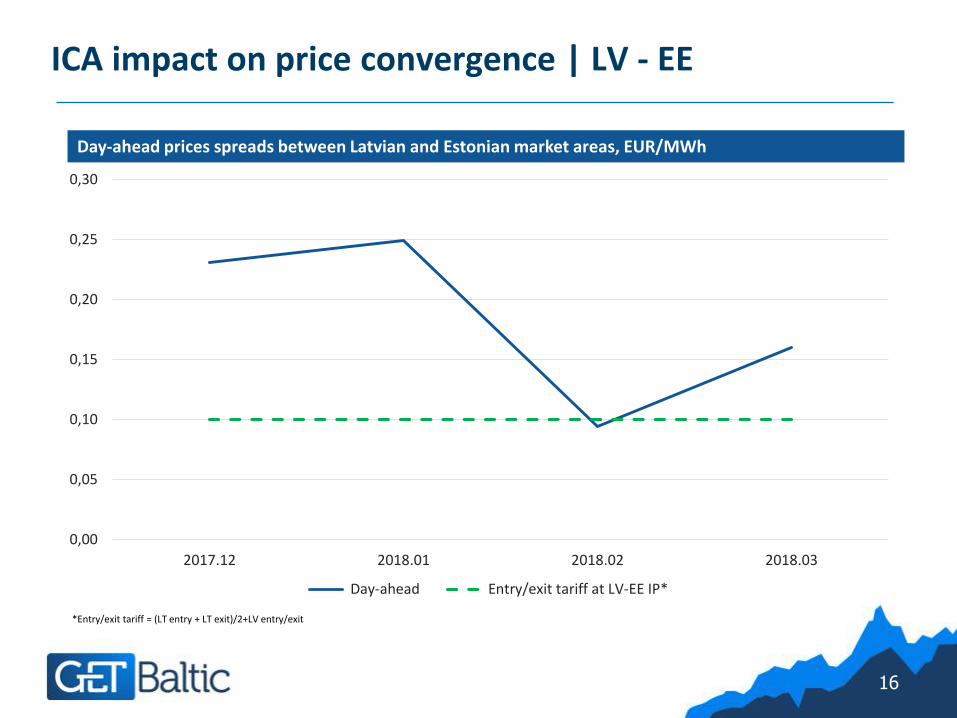
ICA impact on price convergence | LV - EE
16
Day-ahead prices spreads between Latvian and Estonian market areas, EUR/MWh
*Entry/exit tariff = (LT entry + LT exit)/2+LV entry/exit
0,00
0,05
0,10
0,15
0,20
0,25
0,30
2017.12 2018.01 2018.02 2018.03
Day-ahead Entry/exit tariff at LV-EE IP*
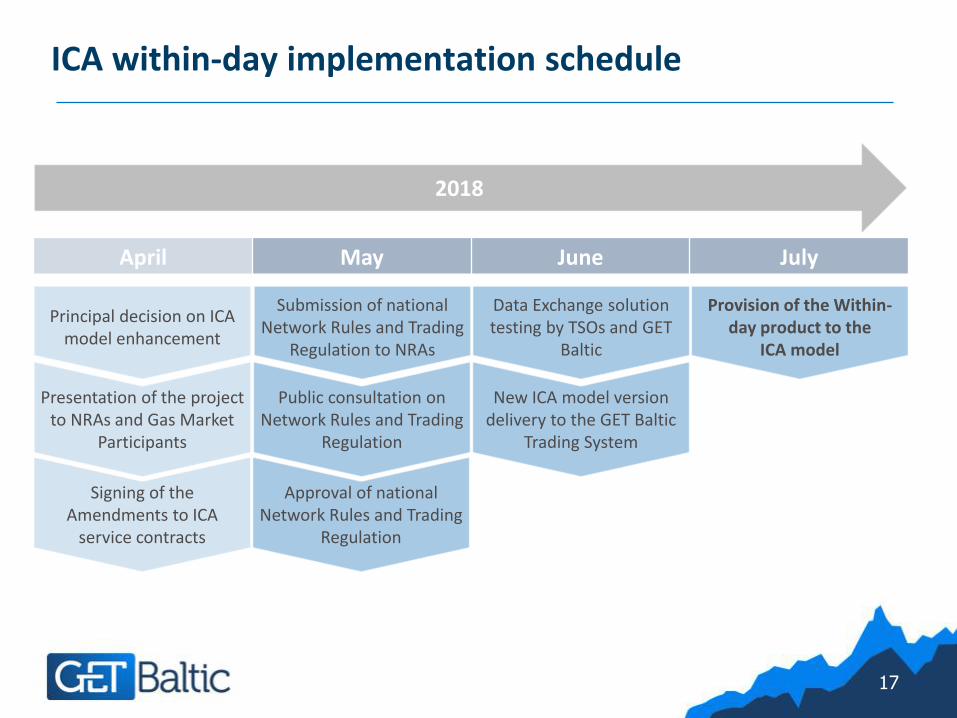
ICA within-day implementation schedule
17
2018
April May June July
Principal decision on ICA model enhancement
Submission of national Network Rules and Trading
Regulation to NRAs
Data Exchange solution testing by TSOs and GET
Baltic
Provision of the Within-day product to the
ICA model
Presentation of the project to NRAs and Gas Market
Participants
Public consultation on Network Rules and Trading
Regulation
New ICA model version delivery to the GET Baltic
Trading System
Approval of national Network Rules and Trading
Regulation
Signing of the Amendments to ICA
service contracts