Embed Size (px)
Citation preview
Getting a Return on Your Testing Investment
Ted DaranyDarany and Associates
29th Annual IPMAAC Conference SHAPING THE FUTURE Through Excellence in Personnel Selection
June 22, 2005
We Can Do Better!
“It’s a lot more work, but we’ll all be thebetter for it.”
=> R.J. Harvey, 2005 IPMAAC Keynote Address
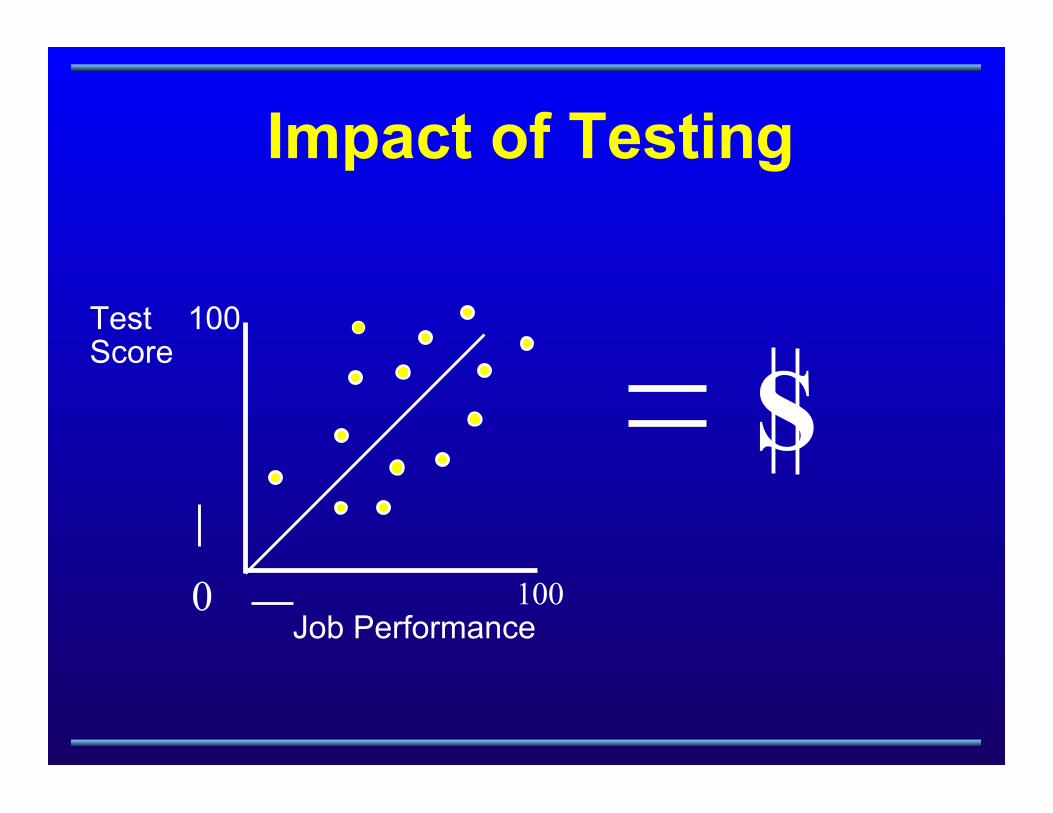
Impact of Testing
Test 100 Score
100Job Performance
0
S
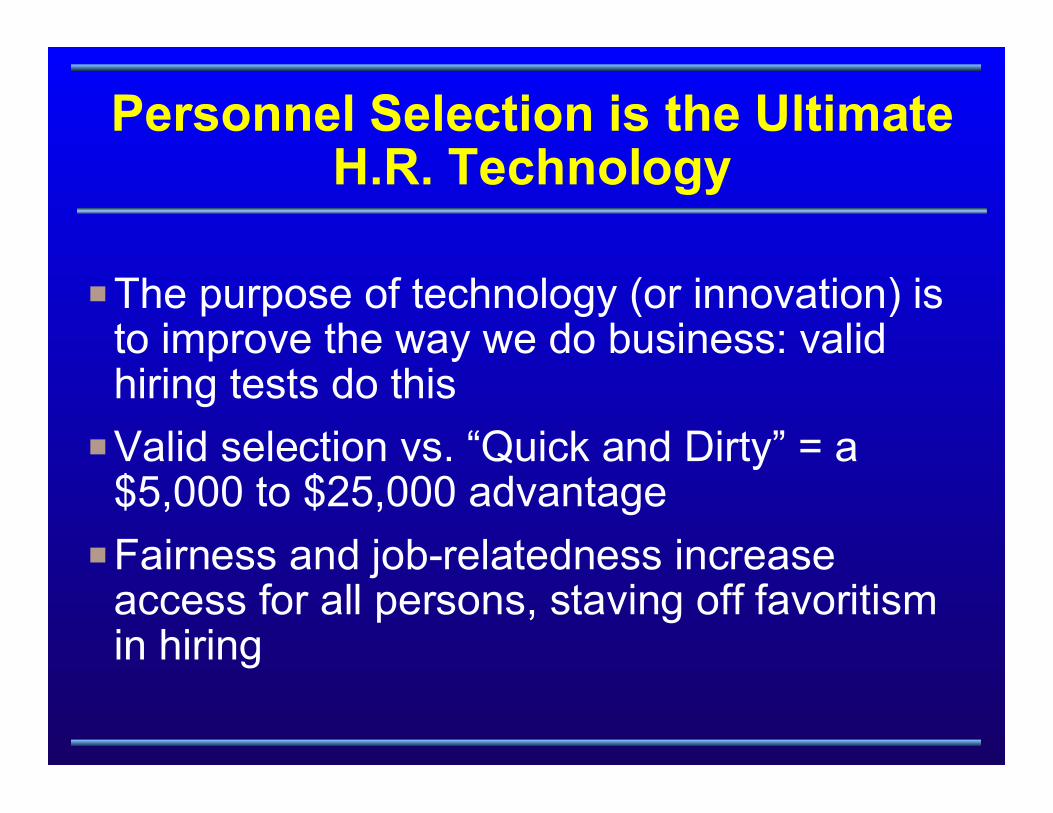
Personnel Selection is the UltimateH.R. Technology
PThe purpose of technology (or innovation) isto improve the way we do business: validhiring tests do this
PValid selection vs. “Quick and Dirty” = a$5,000 to $25,000 advantage
PFairness and job-relatedness increaseaccess for all persons, staving off favoritismin hiring
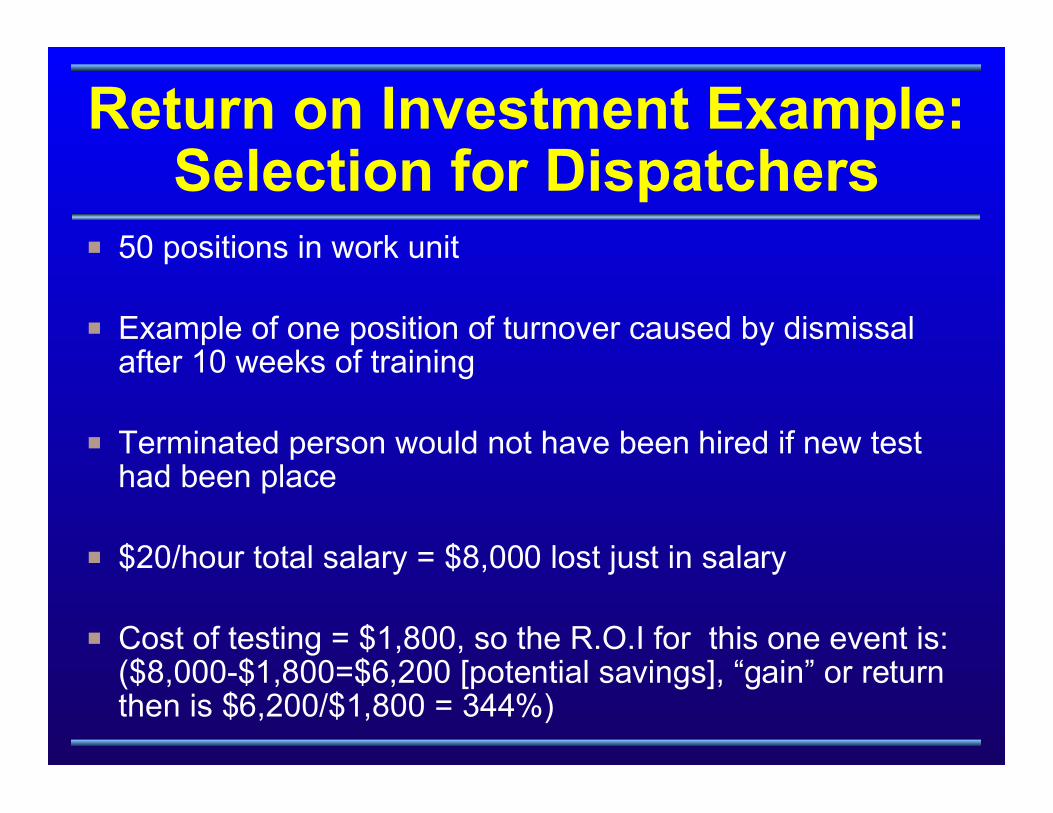
Return on Investment Example:Selection for Dispatchers
P 50 positions in work unit
P Example of one position of turnover caused by dismissalafter 10 weeks of training
P Terminated person would not have been hired if new testhad been place
P $20/hour total salary = $8,000 lost just in salary
P Cost of testing = $1,800, so the R.O.I for this one event is:($8,000-$1,800=$6,200 [potential savings], “gain” or returnthen is $6,200/$1,800 = 344%)
Return on Investment
PWhat is it?
PWhy should we care about it?
PWhat is the investment?
PWhat is the return?
Return on Investment Involves
P Investment: buying or doing something with $
P A process or use for what was acquired
P Tracking of costs to buy
P Tracking of costs to use
P Tracking of outcomes: did it payoff?
P Reporting (proclaiming) the results
Why Not to Care About Return on Investment
POur leaders are frequently influenced by theslogan of the month (e.g., reinventinggovernment, best practices, better-faster-cheaper)
PAt the time, the slogan may seem to makesense (or is it cents? - what currency does itreally have?)
Why Care About Return onInvestment Now
P It makes good business sense
P It makes good professional sense
P It makes for improved customer relations
PThings that are shown to work get rewarded
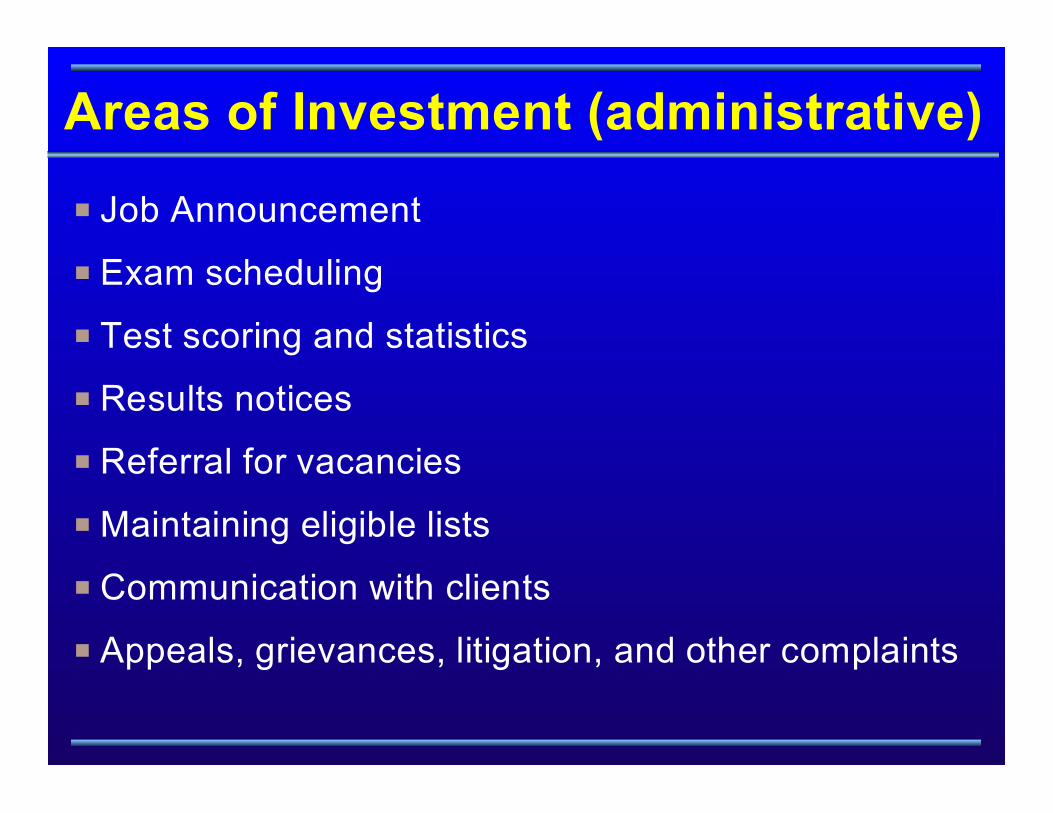
Areas of Investment (administrative)
P Job Announcement
P Exam scheduling
P Test scoring and statistics
P Results notices
P Referral for vacancies
P Maintaining eligible lists
P Communication with clients
P Appeals, grievances, litigation, and other complaints
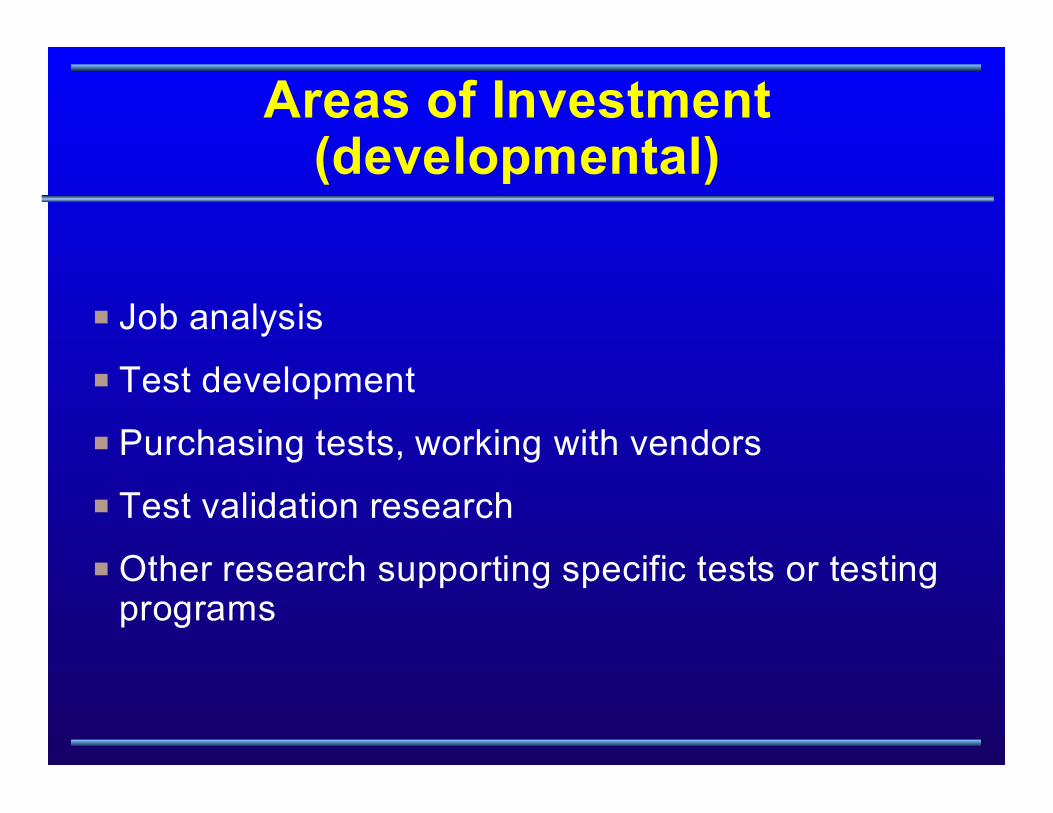
Areas of Investment(developmental)
P Job analysis
P Test development
P Purchasing tests, working with vendors
P Test validation research
P Other research supporting specific tests or testingprograms
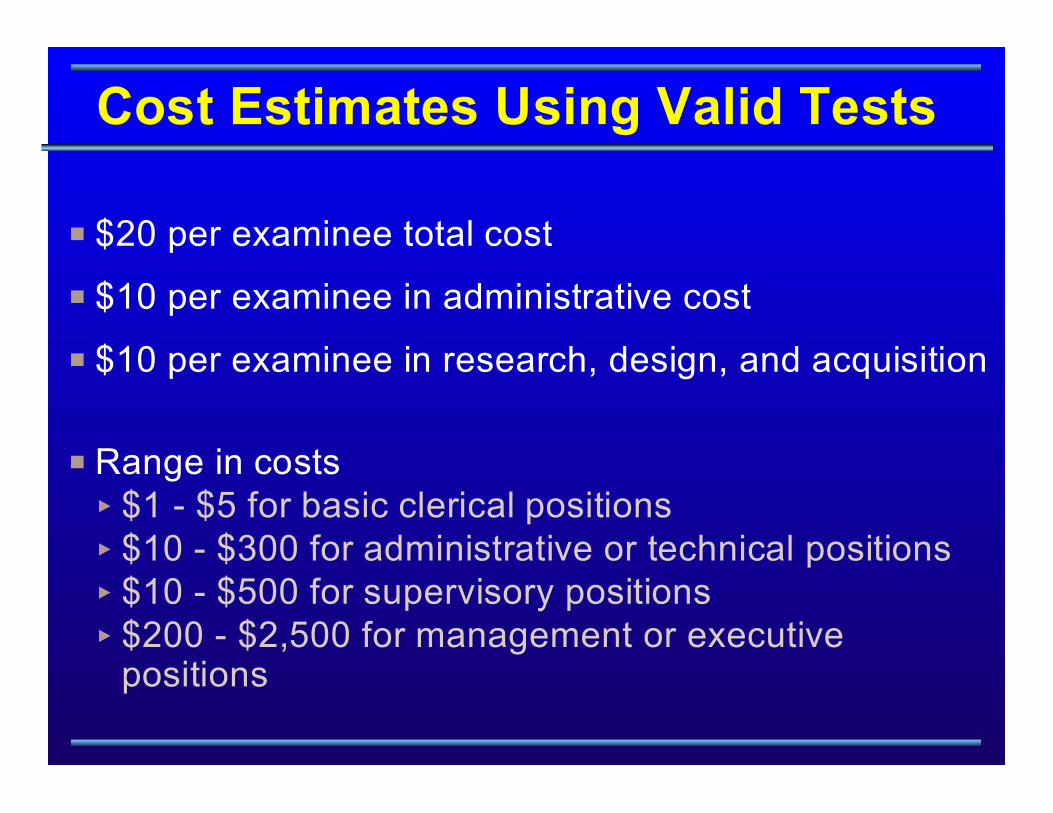
Cost Estimates Using Valid Tests
P $20 per examinee total cost
P $10 per examinee in administrative cost
P $10 per examinee in research, design, and acquisition
P Range in costs< $1 - $5 for basic clerical positions< $10 - $300 for administrative or technical positions< $10 - $500 for supervisory positions< $200 - $2,500 for management or executive
positions

But, What’s the Trend in Hiring?
PBetter
PFaster
PCheaper

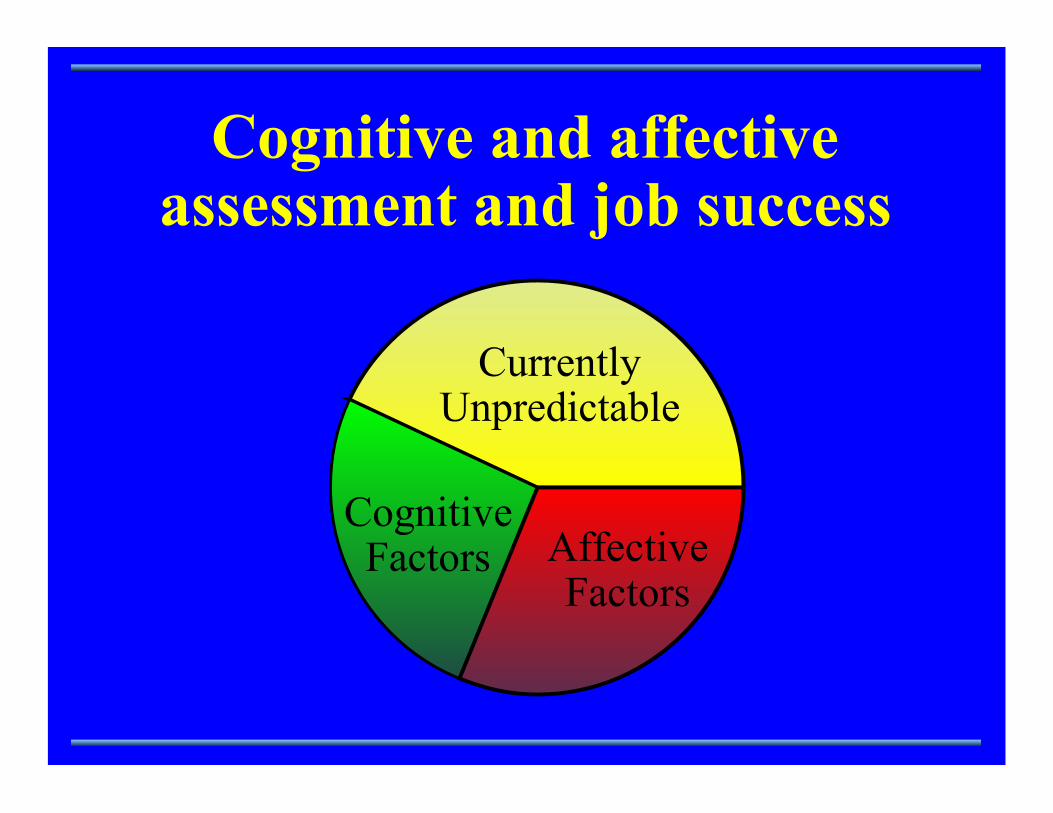
Cognitive and affectiveassessment and job success
CurrentlyUnpredictable
AffectiveFactors
CognitiveFactors
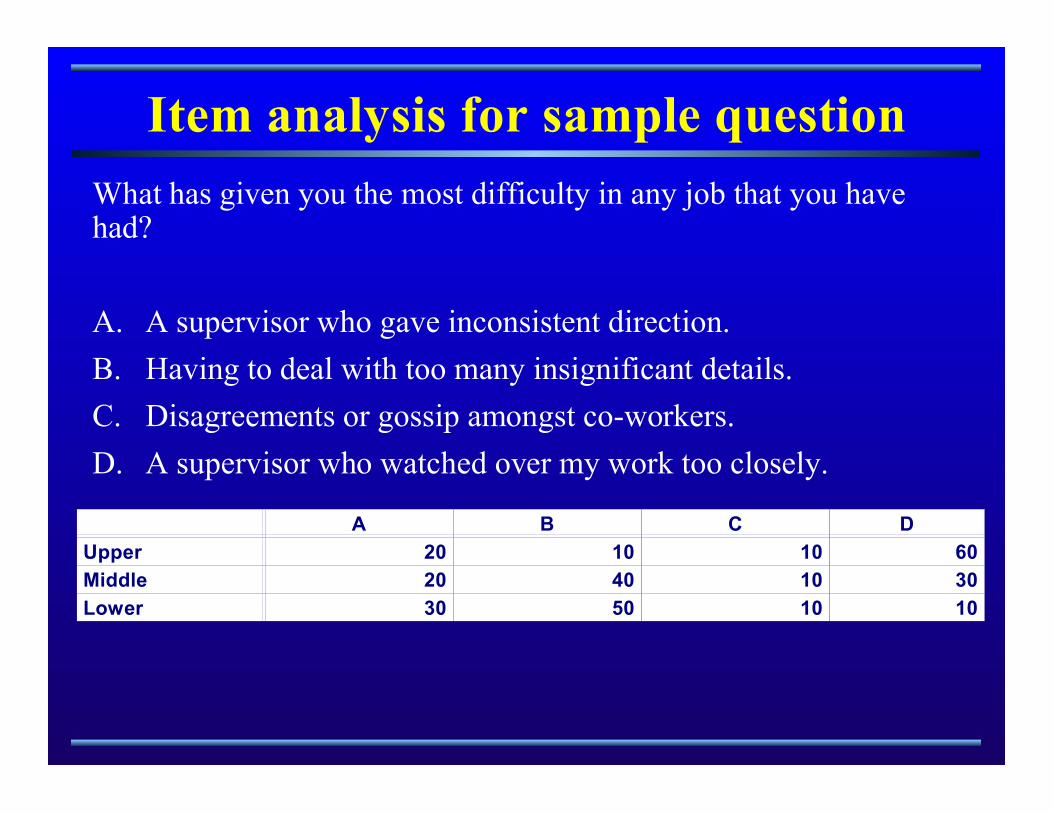
Item analysis for sample question
What has given you the most difficulty in any job that you havehad?
A. A supervisor who gave inconsistent direction.
B. Having to deal with too many insignificant details.
C. Disagreements or gossip amongst co-workers.
D. A supervisor who watched over my work too closely.
A B C D
Upper 20 10 10 60
Middle 20 40 10 30
Lower 30 50 10 10

But Good Tests AreExpensive. Where Will We
Get The Money?
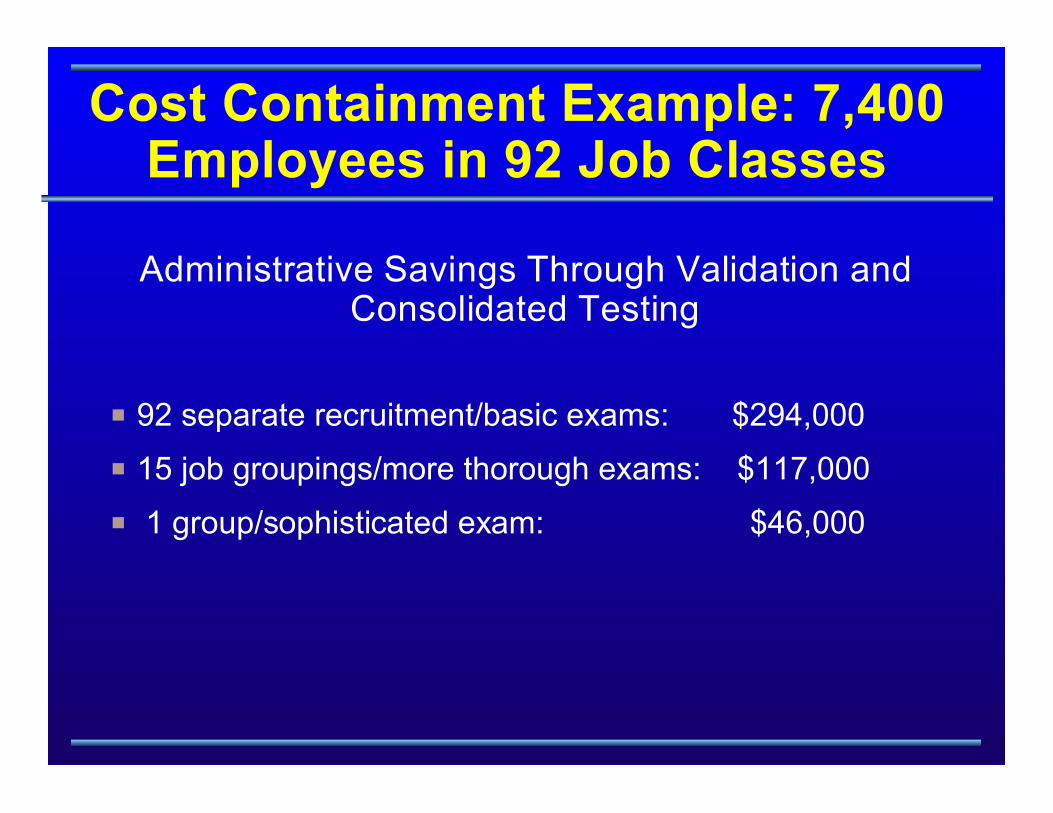
Cost Containment Example: 7,400Employees in 92 Job Classes
Administrative Savings Through Validation andConsolidated Testing
P 92 separate recruitment/basic exams: $294,000
P 15 job groupings/more thorough exams: $117,000
P 1 group/sophisticated exam: $46,000
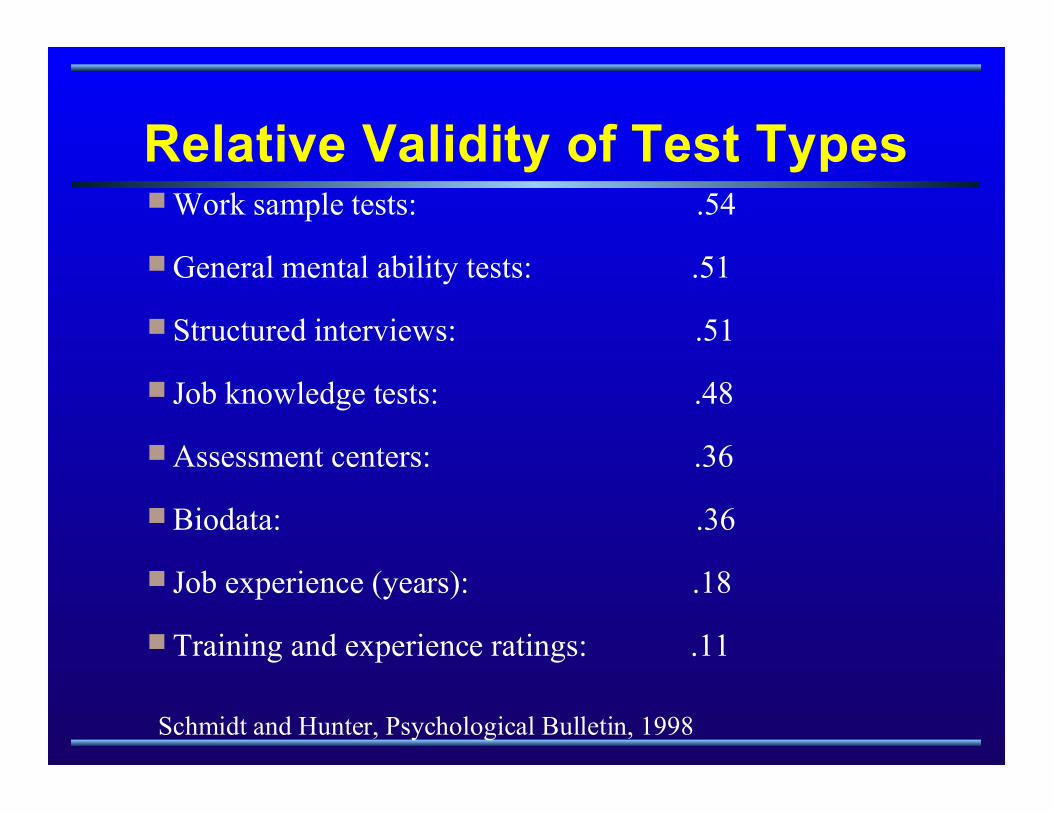
Relative Validity of Test TypesPWork sample tests: .54
PGeneral mental ability tests: .51
PStructured interviews: .51
P Job knowledge tests: .48
PAssessment centers: .36
PBiodata: .36
P Job experience (years): .18
PTraining and experience ratings: .11
Schmidt and Hunter, Psychological Bulletin, 1998
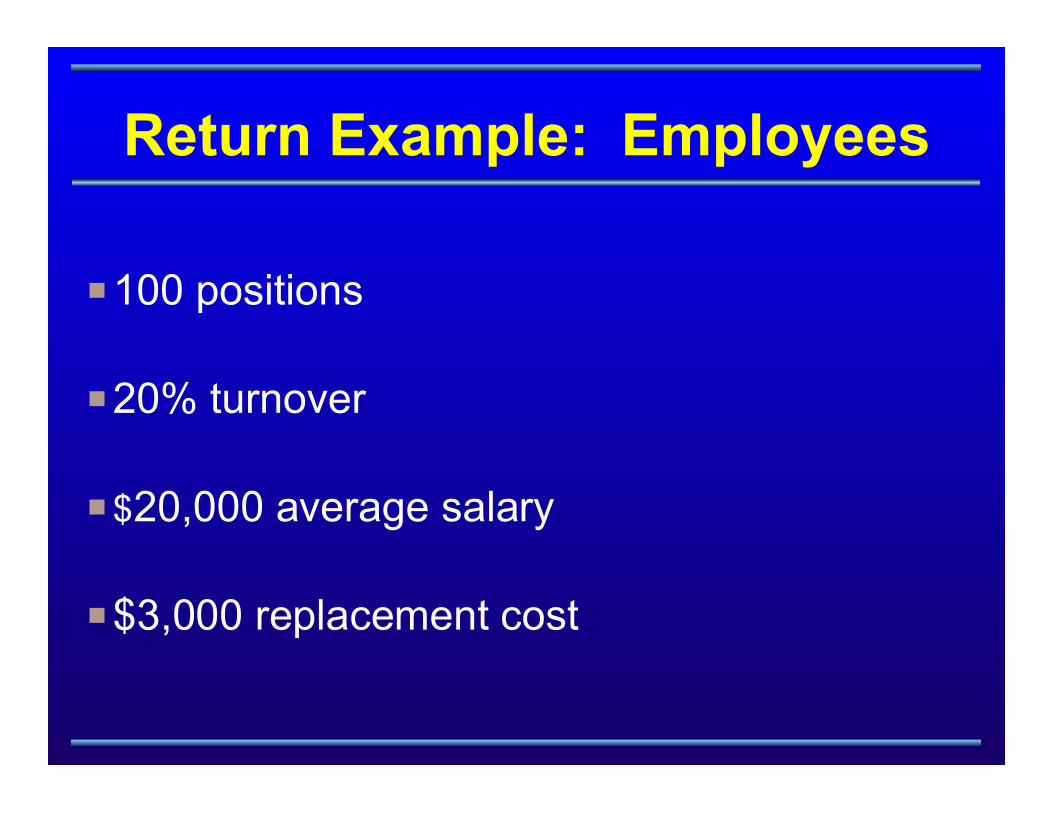
Return Example: Employees
P100 positions
P20% turnover
P$20,000 average salary
P$3,000 replacement cost
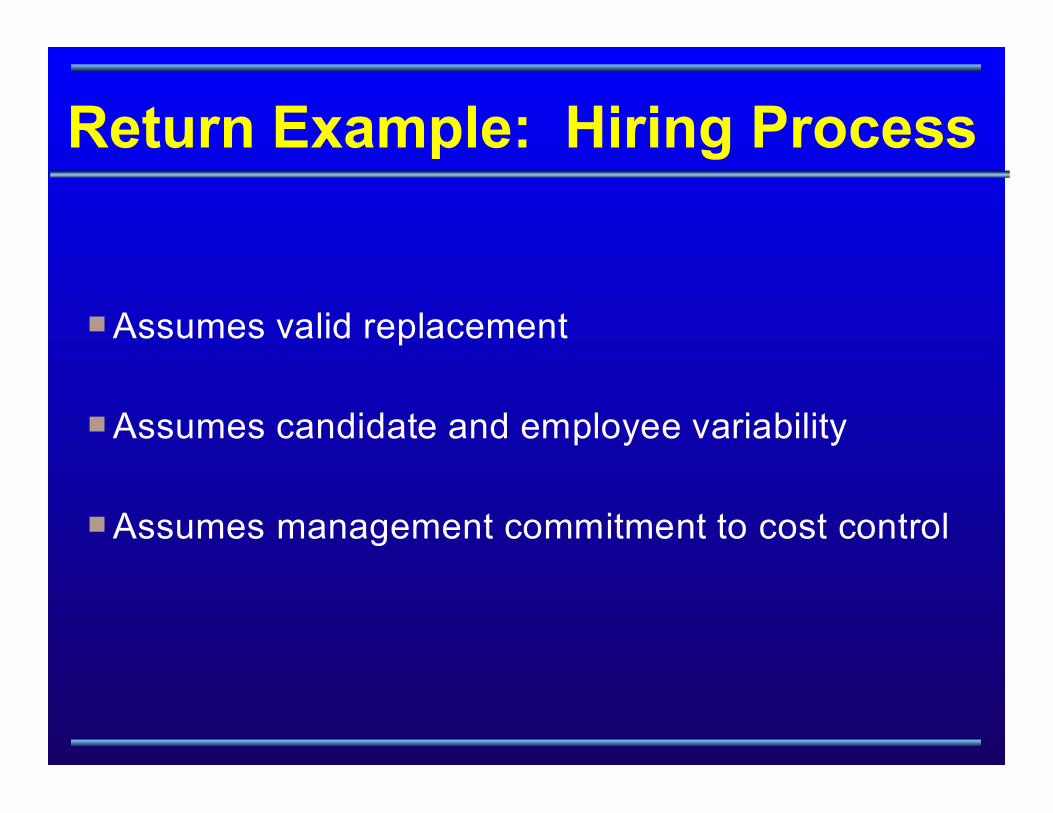
Return Example: Hiring Process
PAssumes valid replacement
PAssumes candidate and employee variability
PAssumes management commitment to cost control
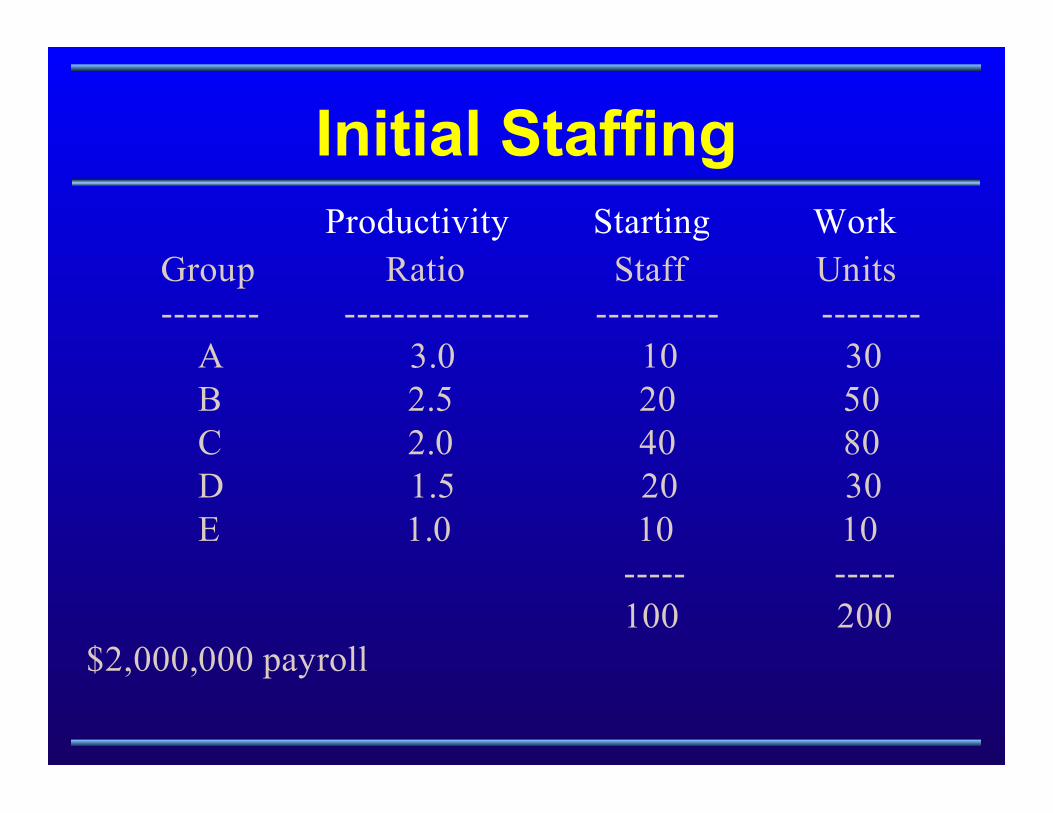
Initial Staffing Productivity Starting Work
Group Ratio Staff Units -------- --------------- ---------- -------- A 3.0 10 30 B 2.5 20 50 C 2.0 40 80 D 1.5 20 30 E 1.0 10 10 ----- ----- 100 200$2,000,000 payroll
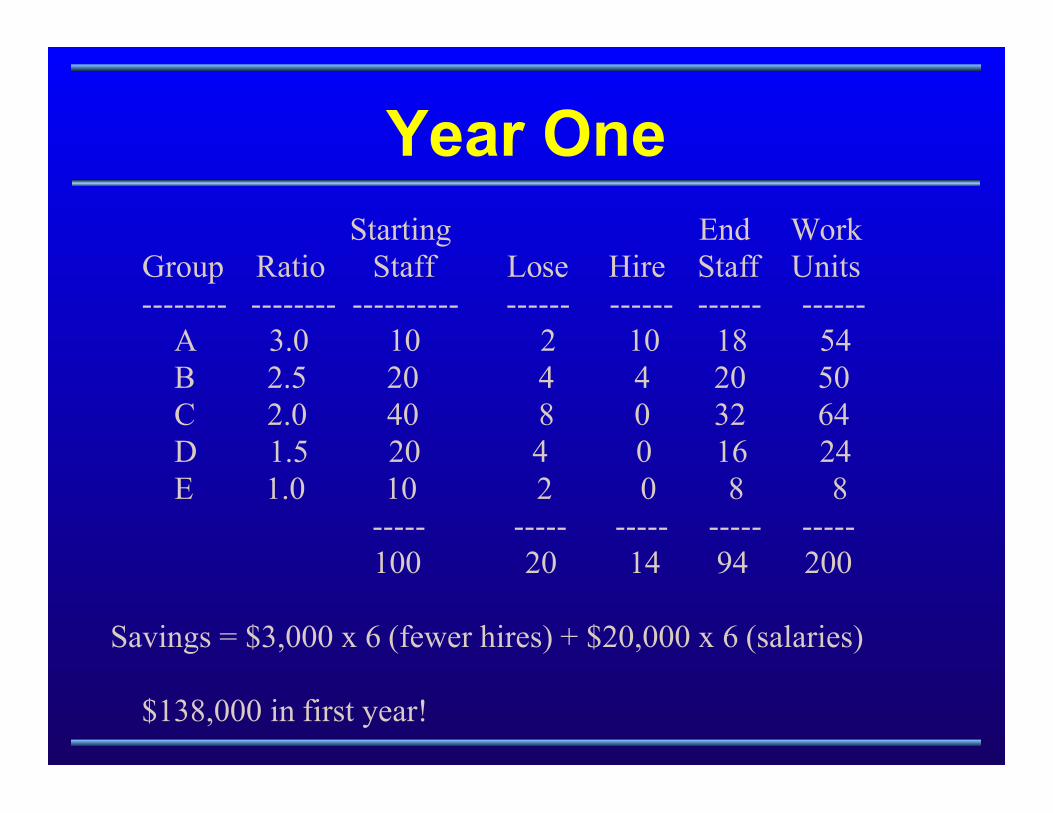
Year One
Starting End Work Group Ratio Staff Lose Hire Staff Units -------- -------- ---------- ------ ------ ------ ------ A 3.0 10 2 10 18 54 B 2.5 20 4 4 20 50 C 2.0 40 8 0 32 64 D 1.5 20 4 0 16 24 E 1.0 10 2 0 8 8 ----- ----- ----- ----- ----- 100 20 14 94 200
Savings = $3,000 x 6 (fewer hires) + $20,000 x 6 (salaries) $138,000 in first year!
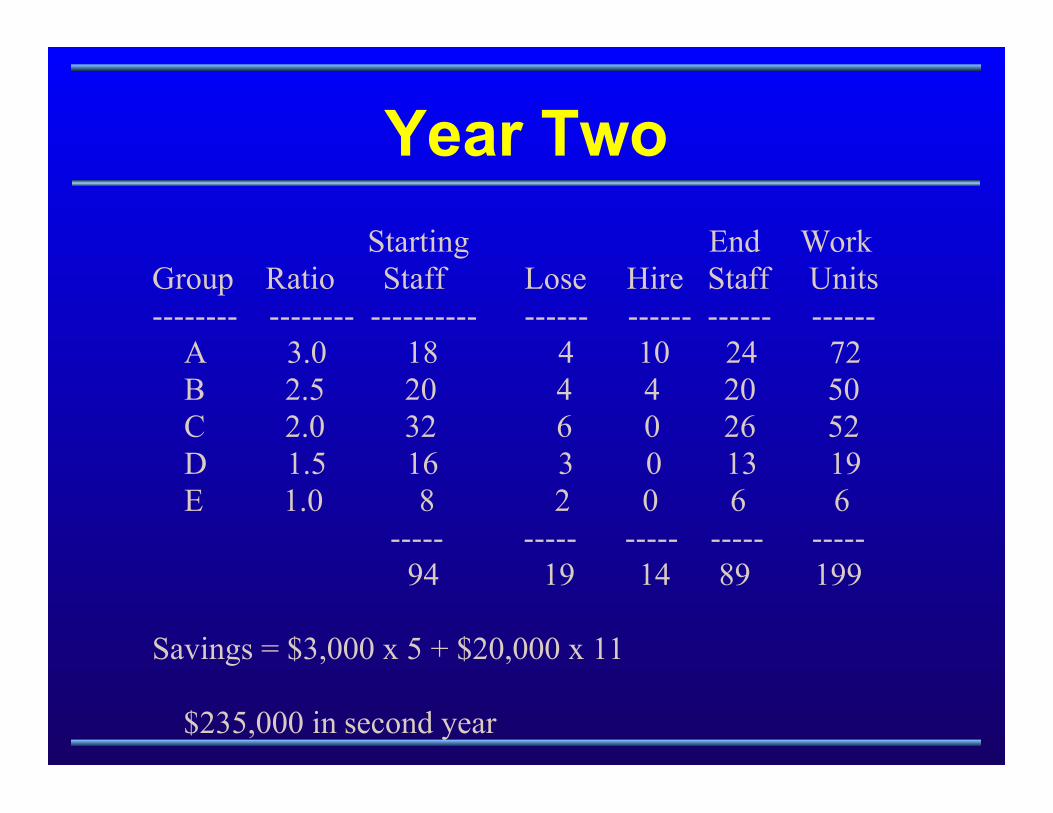
Year Two
Starting End WorkGroup Ratio Staff Lose Hire Staff Units-------- -------- ---------- ------ ------ ------ ------ A 3.0 18 4 10 24 72 B 2.5 20 4 4 20 50 C 2.0 32 6 0 26 52 D 1.5 16 3 0 13 19 E 1.0 8 2 0 6 6 ----- ----- ----- ----- ----- 94 19 14 89 199
Savings = $3,000 x 5 + $20,000 x 11 $235,000 in second year
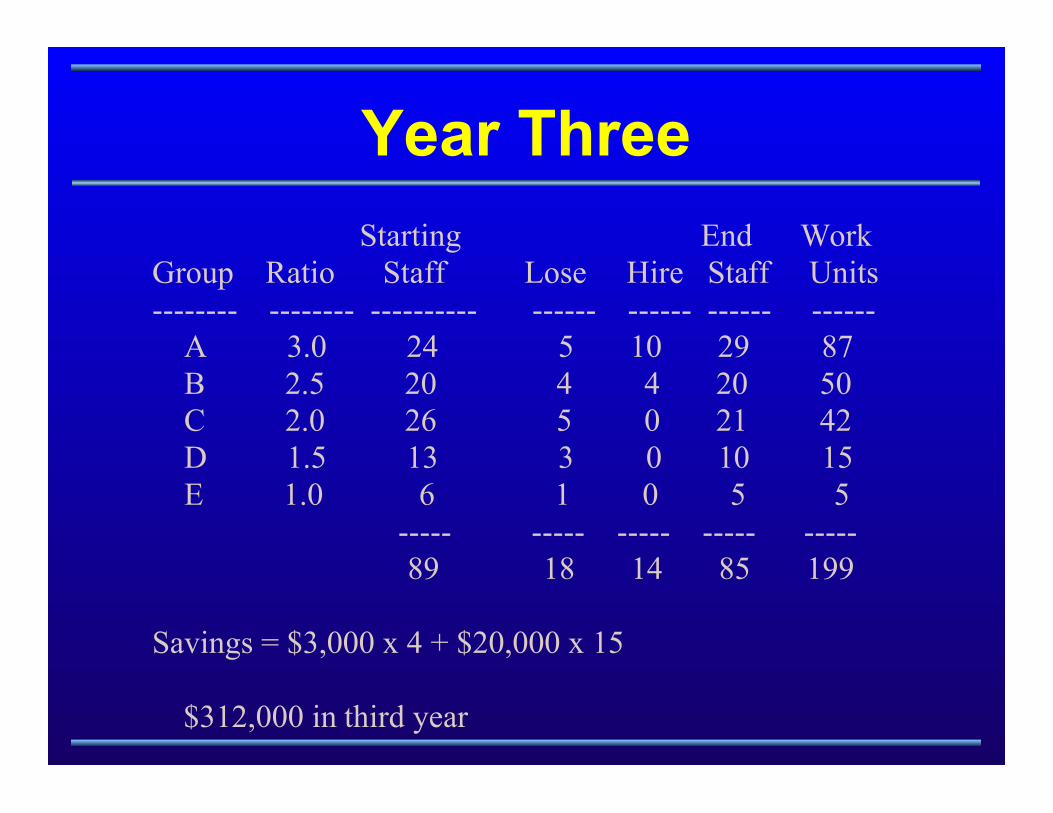
Year Three
Starting End WorkGroup Ratio Staff Lose Hire Staff Units-------- -------- ---------- ------ ------ ------ ------ A 3.0 24 5 10 29 87 B 2.5 20 4 4 20 50 C 2.0 26 5 0 21 42 D 1.5 13 3 0 10 15 E 1.0 6 1 0 5 5 ----- ----- ----- ----- ----- 89 18 14 85 199
Savings = $3,000 x 4 + $20,000 x 15 $312,000 in third year
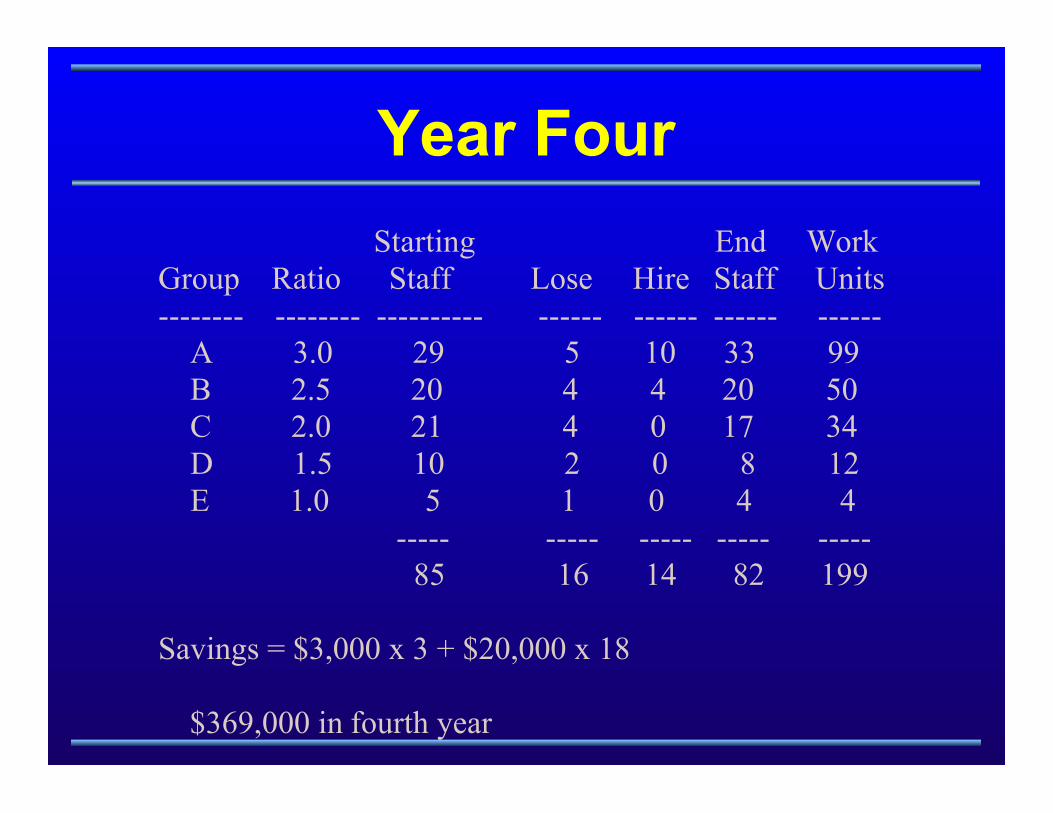
Year Four
Starting End WorkGroup Ratio Staff Lose Hire Staff Units-------- -------- ---------- ------ ------ ------ ------ A 3.0 29 5 10 33 99 B 2.5 20 4 4 20 50 C 2.0 21 4 0 17 34 D 1.5 10 2 0 8 12 E 1.0 5 1 0 4 4 ----- ----- ----- ----- ----- 85 16 14 82 199
Savings = $3,000 x 3 + $20,000 x 18 $369,000 in fourth year
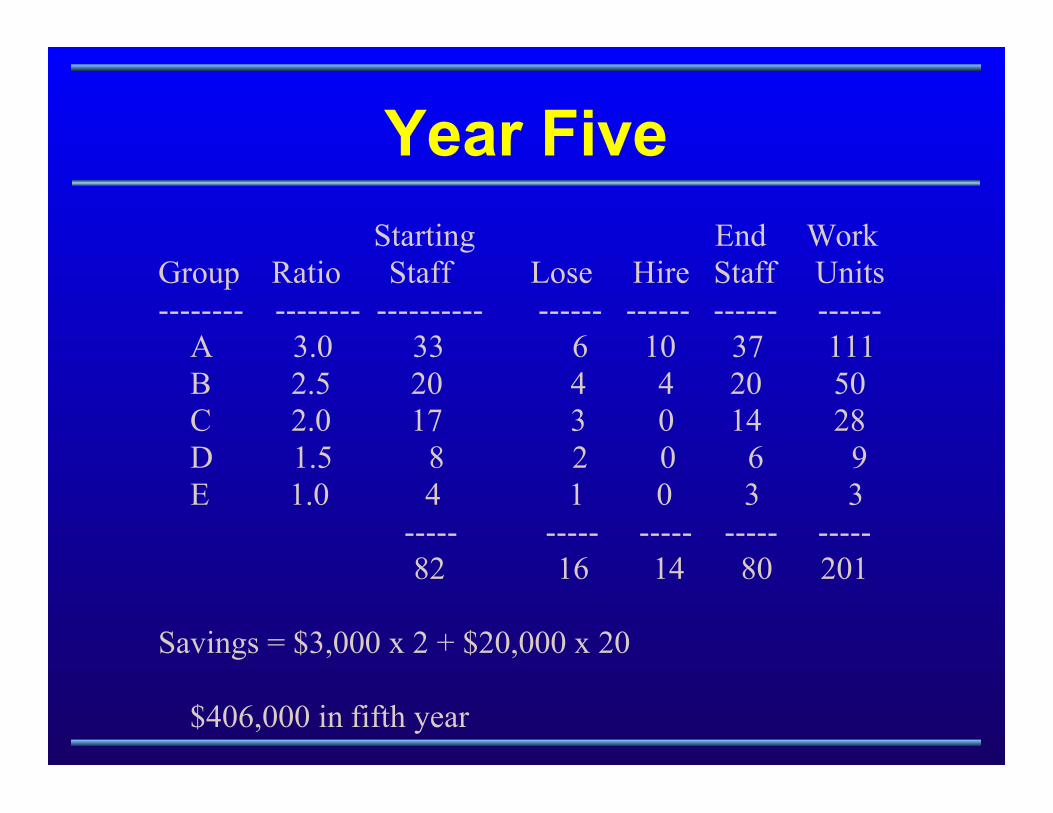
Year Five
Starting End WorkGroup Ratio Staff Lose Hire Staff Units-------- -------- ---------- ------ ------ ------ ------ A 3.0 33 6 10 37 111 B 2.5 20 4 4 20 50 C 2.0 17 3 0 14 28 D 1.5 8 2 0 6 9 E 1.0 4 1 0 3 3 ----- ----- ----- ----- ----- 82 16 14 80 201
Savings = $3,000 x 2 + $20,000 x 20 $406,000 in fifth year
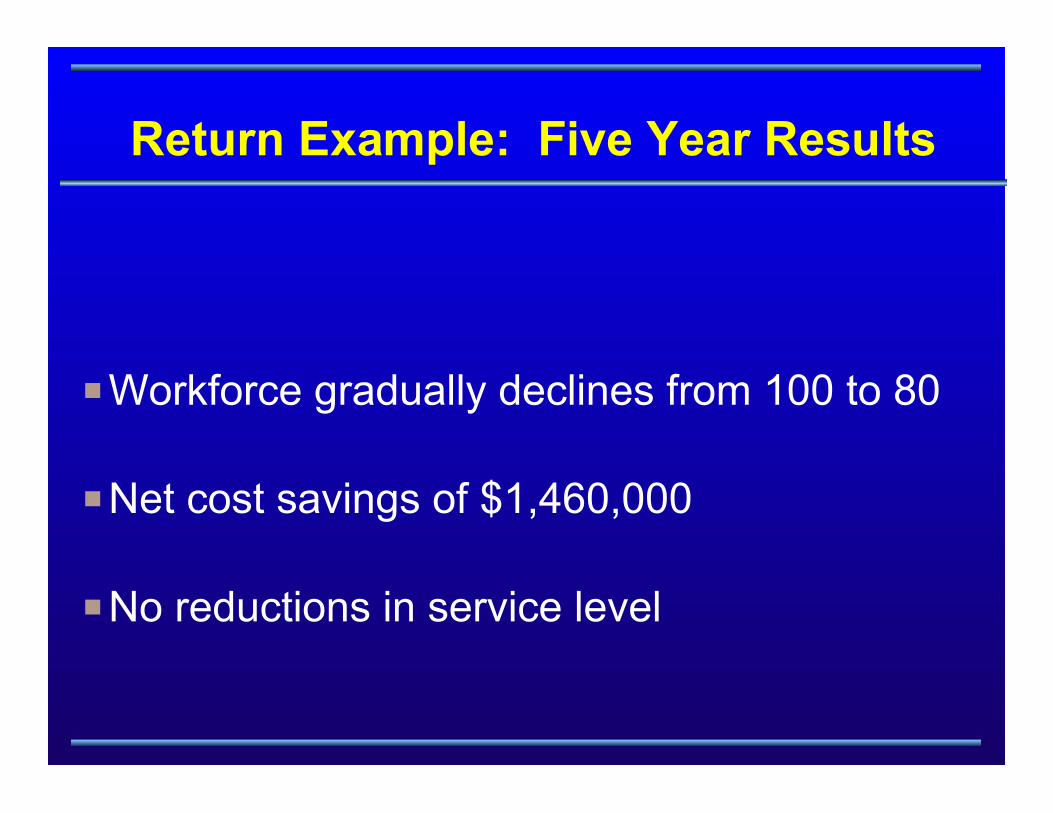
Return Example: Five Year Results
PWorkforce gradually declines from 100 to 80
PNet cost savings of $1,460,000
PNo reductions in service level

But How Can You Find TheTime?
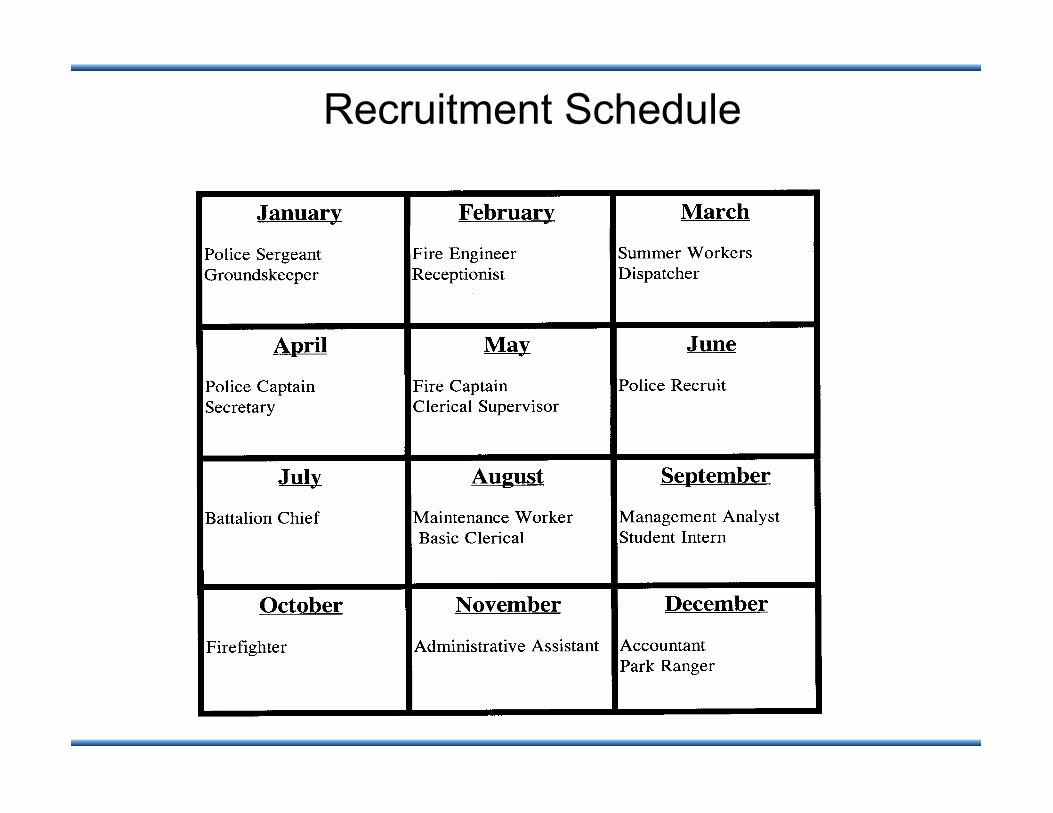
Recruitment Schedule
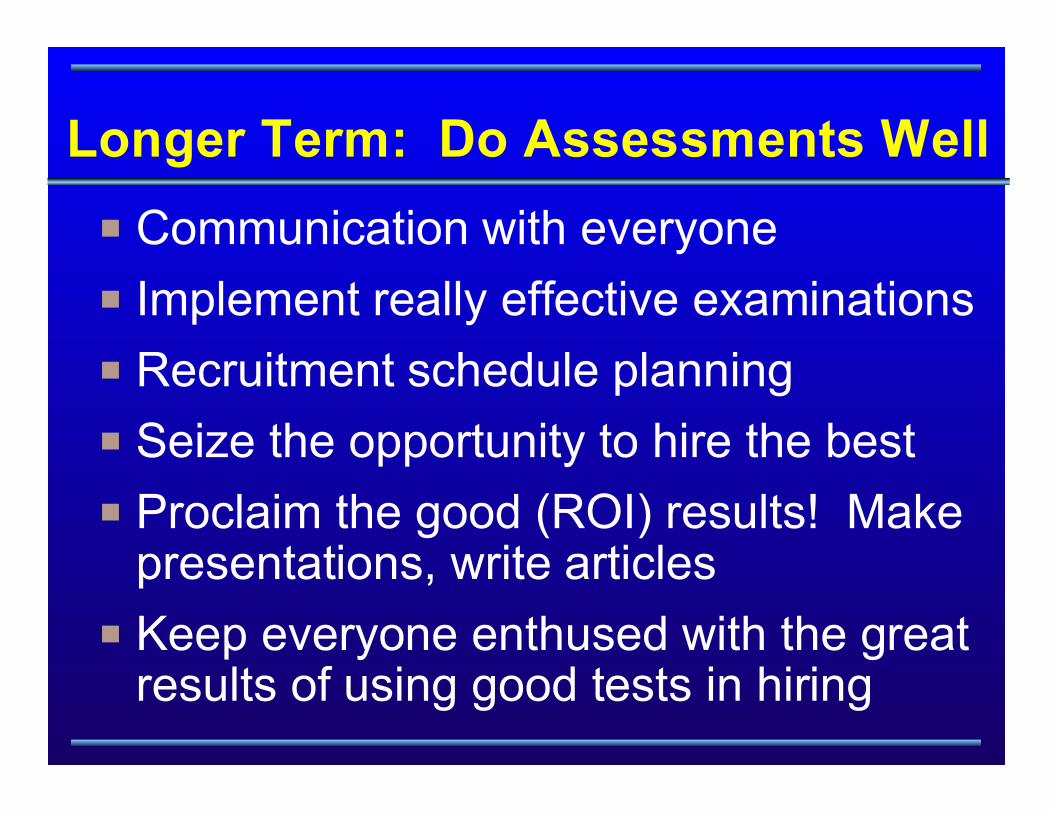
Longer Term: Do Assessments Well
P Communication with everyone
P Implement really effective examinations
P Recruitment schedule planning
P Seize the opportunity to hire the best
P Proclaim the good (ROI) results! Makepresentations, write articles
P Keep everyone enthused with the greatresults of using good tests in hiring

We Have the Best StoryAround. We Need to
Discover and Develop theBest Ways to Tell it.
Contact for more
Ted DaranyDarany and Associates
(909) 798-4475