Embed Size (px)
Citation preview

Getting America’s Freight Back on the MoveA Plan for Investing in Our Freight Infrastructure
Keith Miller, Kristina Costa, and Donna Cooper August 2012
WWW.AMERICANPROGRESS.ORG
AP PH
OTO
/RICK BOW
MER

Getting America’s Freight Back on the MoveA Plan for Investing in Our Freight Infrastructure
Keith Miller, Kristina Costa, and Donna Cooper August 2012

1 Introduction and Summary
4 Freight rail
9 Inland waterways
13 Ports
18 Closing the freight infrastructure gap
24 Conclusion
26 About the authors
29 Endnotes
Contents

1 Center for American Progress | Getting America’s Freight Back on the Move
Introduction and summary
Ports, freight railways, and inland waterways together comprise the backbone of the American economy. Employing over 4.1 million Americans, the U.S. freight transport and warehousing industries are relied upon every day to transport mil-lions of tons of raw materials and finished merchandise to destinations across the nation and around the globe. 1
But despite its indispensability for sustaining economic growth and ensuring international competitiveness, America’s goods movement system has been allowed to fall into a dangerous state of disrepair. Decades of chronic underinvest-ment have left the system incapable of keeping up with routine maintenance, let alone sufficiently increasing capacity to accommodate forecasted growth.
The Obama administration understands the gravity of the situation. The president recently announced that seven improvement projects at five major ports would be expedited, with an additional 36 projects to be expedited by executive order in the near future as part of the administration’s “We Can’t Wait” initiative. The admin-istration also announced the creation of a Task Force on Ports to facilitate better cross-agency coordination and help assess the relative importance of projects from a national perspective.
These developments represent significant steps in the right direction. But more must be done. Freight bottlenecks and other congestion cost businesses, consum-ers, and the public at large approximately $200 billion per year, according to a report by the Building America’s Future Educational Fund.2 The U.S. Chamber of Commerce places the annual cost of congestion as high as $1 trillion annually—roughly 7 percent of U.S. economic output.3 These costs result from higher trans-portation costs, more expensive everyday goods, and increased levels of pollution.
What’s more, delays and backlogs in goods transport systems that are designed to move large volumes of commodities—such as freight rail and waterways—also lead to ever-increasing shares of freight being moved by truck across the nation’s

2 Center for American Progress | Getting America’s Freight Back on the Move
highway system. The more freight is diverted to trucks, the more congested America’s roadways become. In 2010 roadway congestion alone cost American highway commuters an estimated $101 billion in lost productivity and wasted gas—a sum that doesn’t include the cost of increased wear and tear on roadways or the societal cost incurred by higher emissions levels.4
With total U.S. freight traffic anticipated to increase by over 50 percent by 2040, significant expansion, modernization, and system integration will be required.5 Investing in our freight infrastructure system would not only help American businesses remain competitive but would also immediately produce hundreds of thousands of new jobs in the construction and manufacturing industries, which are among those hardest hit by the recession. By investing in our ports, railroads, and waterways and implementing a number of commonsense legislative reforms, the United States can both help get our economy get back on track in the short term and ensure continued prosperity for decades to come.
This will require significant public-private cooperation. The nation’s freight rail system is mostly privately owned and operated, though the federal government invested about $560 million in freight rail in FY 2010, the last year for which complete data for all freight transportation modes are available. About half of the nation’s 25,000 miles of navigable inland waterways are federally maintained, with the Army Corps of Engineers responsible for infrastructure maintenance. In FY 2010, the federal government spent $882 million on inland waterways. Port own-ership and management varies widely, but in many states, public port authorities own most port infrastructure and may lease it to private corporations such that both public and private entities contribute to capital investment and maintenance. The federal government spent $896 million on port infrastructure in FY 2010.
To bring our freight transportation system in line with modern standards, we rec-ommend increasing annual public investment in freight rail, inland waterways, and ports by about $2.5 billion over current levels. We estimate that about $1.4 billion in new annual freight rail spending could be used to upgrade tracks, improve signal and control systems, eliminate street-level freight rail crossings, and retrofit tunnels and bridges. $150 million in additional annual investment in inland water-ways should go toward repairing and replacing outdated locks and dams. And an additional $1 billion per year should be spent on maintaining and increasing chan-nel depth and conducting water-side improvements in the nation’s ports.6

3 Center for American Progress | Getting America’s Freight Back on the Move
But public expenditures alone will not address the pressing repair, maintenance, and capacity expansion needs of our goods movement system. More must be done to encourage private investment in freight infrastructure projects. Government expenditures should be particularly targeted toward projects the private sector cannot complete on its own and should always seek to draw in as much invest-ment as possible from the industries and companies that benefit most from given infrastructure improvements. Only through collaboration and innovation can we successfully implement a comprehensive, national plan to repair, modernize, and expand our goods movement system.
In addition to increasing public expenditures and leveraging more private invest-ment, we must seek to allocate money more efficiently and improve overall system planning and coordination. For decades, funding for ports and inland waterways has been distributed with an eye to politically driven geographic considerations rather than economic competitiveness or the relative urgency of repairs. Funds should instead be disbursed in a way that guarantees the highest possible return on investment. And while many of the nations that have recently surpassed the United States in infrastructure quality have comprehensive, national plans for modernizing and expanding their systems, infrastructure planning and spending in the United States is conducted in a siloed fashion that makes interagency or intermodal planning difficult, if not impossible.
In this report, we will first discuss in detail the unique challenges faced by our freight rail, inland waterways, and ports. We then will lay out how the federal government provides financial assistance to each mode of transport and illustrate how inefficiencies, redundancies, and underutilization of existing programs have undermined necessary investment. Finally, we will discuss in detail our general and sector-specific recommendations for boosting investment in our economi-cally critical freight infrastructure.
One final note before turning to the topic at hand. This report does not address truck freight. Although trucks move the largest share of freight by tonnage and are a critical part of the supply chain, almost all of their infrastructure costs are already borne by taxpayers who pay for the maintenance and construction of roads and interstates. This infrastructure also overwhelmingly benefits many other kinds of road users and strategies for its improvement do not fall exclusively under the purview of improving freight movement. Consequently, we feel truck freight is better addressed in con-junction with policies addressing roads and highways, on which states and localities already spend tens of billions of dollars per year—$53.3 billion in 2008 alone.7

4 Center for American Progress | Getting America’s Freight Back on the Move
Freight rail
TABLE 1
U.S. freight rail by the numbers
Key statistics on U.S. freight rail
Freight moved annually (tons), 2010: 1.7 billion
Percentage of U.S. freight moved (tonnage), 2010: 15.9
Percentage of U.S. freight moved (ton-miles), 2010: 39.5
Miles of track, 2009: 139,118
Ownership of infrastructure:Almost entirely private, barring some state-owned Class II and Class III lines.
FY2010 federal funding*:
So-called SAFETEA-LU appropriations ($220 million),** Railroad Rehabilitation and Improvement Financing loans ($172 million), one-time Transportation Investment Generat-ing Economic Recovery grants ($169 million, including funds appropriated to ports for intermodal rail improvements).
* FY2010 numbers are used, as this was the last year for which complete data for all freight transportation modes are available.
** Federal funds disbursed under the “Safe, Accountable, Flexible, Efficient Transportation Equity Act: A Legacy for Users” program.
Sources: Author’s calculations based on sources:
“Surface Transportation Reauthorization Bill,” available at http://rsiweb.org/advocacy/surface-transportation-bill/.
Federal Highway Administration, Freight Facts and Figures (Department of Transportation, 2011), available at http://www.ops.fhwa.dot.gov/freight/freight_analysis/nat_freight_stats/docs/11factsfigures/pdfs/fff2011_highres.pdf.
Federal Railroad Administration, National Rail Plan: Moving Forward (Department of Transportation, 2010), available at http://www.fra.dot.gov/downloads/NRP_Sept2010_WEB.pdf.
“Railroad Rehabilitation & Improvement Financing (RRIF) Program,” available at http://www.fra.dot.gov/rpd/freight/1770.shtml#RPO.
Department of Transportation, Capital Grants (2010), available at http://www.dot.gov/tiger/docs/TIGER%202%20Capital%20Highlights.pdf.
Current infrastructure conditions
For 180 years, America’s freight railroads have been the critical link between industrial and agricultural hubs, domestic consumers, ports, and our biggest trading partners in Canada and Mexico. Despite being on the verge of collapse in 1970s, the industry has since revived itself, witnessing a steady return to profitability thanks to increased productivity, streamlined regulations, and improved fuel efficiency.
5 Center for American Progress | Getting America’s Freight Back on the Move
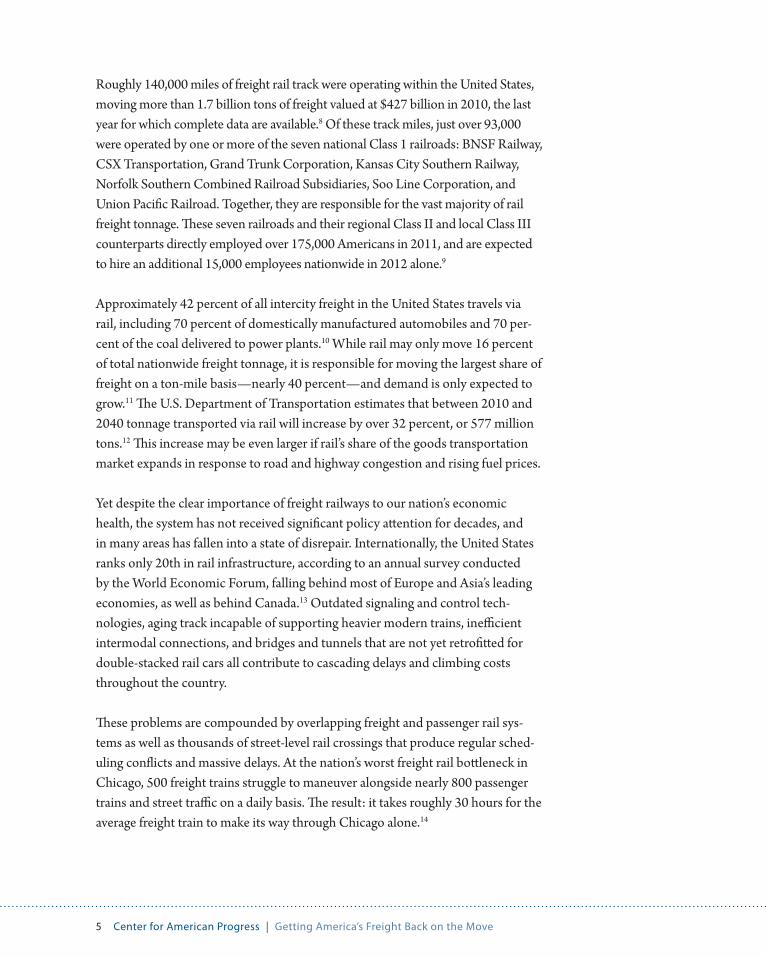
Roughly 140,000 miles of freight rail track were operating within the United States, moving more than 1.7 billion tons of freight valued at $427 billion in 2010, the last year for which complete data are available.8 Of these track miles, just over 93,000 were operated by one or more of the seven national Class 1 railroads: BNSF Railway, CSX Transportation, Grand Trunk Corporation, Kansas City Southern Railway, Norfolk Southern Combined Railroad Subsidiaries, Soo Line Corporation, and Union Pacific Railroad. Together, they are responsible for the vast majority of rail freight tonnage. These seven railroads and their regional Class II and local Class III counterparts directly employed over 175,000 Americans in 2011, and are expected to hire an additional 15,000 employees nationwide in 2012 alone.9
Approximately 42 percent of all intercity freight in the United States travels via rail, including 70 percent of domestically manufactured automobiles and 70 per-cent of the coal delivered to power plants.10 While rail may only move 16 percent of total nationwide freight tonnage, it is responsible for moving the largest share of freight on a ton-mile basis—nearly 40 percent—and demand is only expected to grow.11 The U.S. Department of Transportation estimates that between 2010 and 2040 tonnage transported via rail will increase by over 32 percent, or 577 million tons.12 This increase may be even larger if rail’s share of the goods transportation market expands in response to road and highway congestion and rising fuel prices.
Yet despite the clear importance of freight railways to our nation’s economic health, the system has not received significant policy attention for decades, and in many areas has fallen into a state of disrepair. Internationally, the United States ranks only 20th in rail infrastructure, according to an annual survey conducted by the World Economic Forum, falling behind most of Europe and Asia’s leading economies, as well as behind Canada.13 Outdated signaling and control tech-nologies, aging track incapable of supporting heavier modern trains, inefficient intermodal connections, and bridges and tunnels that are not yet retrofitted for double-stacked rail cars all contribute to cascading delays and climbing costs throughout the country.
These problems are compounded by overlapping freight and passenger rail sys-tems as well as thousands of street-level rail crossings that produce regular sched-uling conflicts and massive delays. At the nation’s worst freight rail bottleneck in Chicago, 500 freight trains struggle to maneuver alongside nearly 800 passenger trains and street traffic on a daily basis. The result: it takes roughly 30 hours for the average freight train to make its way through Chicago alone.14

6 Center for American Progress | Getting America’s Freight Back on the Move
Due to these inefficiencies, larger and larger numbers of trucks are forced to haul freight that rail cannot accommodate, producing ever-increasing congestion on a highway system that already robs American drivers of 4.8 billion hours in wasted time every year.15 Inadequate rail infrastructure forces passenger vehicles to share congested roads with 39,000 trucks from the ports of Los Angeles and Long Beach on a daily basis, while in New York City, port container traffic results in 13,000 truck trips per day on the highways in and around the city.16
This traffic results in billions of dollars of annual productivity losses and fuel costs and contributes significantly to urban pollution. According to a 2007 Cambridge Systematics study, without increased investment 30 percent of all rail miles in primary corridors—cross-country Class 1 rail lines—will be operating above capacity by 2035, causing even worse congestion and delays affecting every region of the country.17
Current financial investment environment
As is the case with most federal investment in infrastructure, freight rail is financed through multiple and overlapping funding streams. The primary source of federal assistance comes in the form of loans and loan guarantees of up to 35 years extended to private, public, and joint projects from the Railroad Rehabilitation and Improvement Financing program. Authorized in 1998 as part of the Transportation Equity Act for the 21st Century, the program had an initial lend-ing authority of $3.5 billion, which was extended to $35 billion in 2005, with $7 billion explicitly set aside for Class II and III rail projects legislators worried might otherwise be ignored.
In practice, however, the program has primarily served these smaller regional and local carriers as they have generally found it much more difficult to secure adequate financing on the private market than have their Class 1 counterparts.18 Despite this massive lending authority, only a minuscule percentage of available funds have been allocated. Since the expansion of the Railroad Rehabilitation and Improvement Financing program’s lending authority seven years ago, it has provided a total of only $1.3 billion in loans, over $500 million of which went to Amtrak for the purchasing of new passenger railcars in 2011.19
This failure to put available funds to work has been largely due to both a lack of political support from previous administrations and insufficient attempts to

7 Center for American Progress | Getting America’s Freight Back on the Move
create awareness of the program.20 Since coming into office, the Obama admin-istration has placed a much greater emphasis on the Railroad Rehabilitation and Improvement Financing program, and lending has increased, but the vast majority of its potential impact remains untapped.
Other federal funding for freight rail infrastructure is provided by an annual $220 million appropriation for rail crossing improvements, which was again renewed in the recently passed Moving Ahead for Progress in the 21st Century, or MAP-21, surface transportation bill, and via the Transportation Department’s Transportation Investment Generating Economic Recovery, or TIGER, grant program.21 From 2009 to 2012 the TIGER program allocated over $830 million in one-time freight rail improvement grants targeting both rail-line improvements and the construction of more efficient intermodal connections with ports and warehousing facilities.22
The funding gap
Much of the funding from these various streams results from temporary provi-sions that are subject to congressional reauthorization, making overall availability of funds unpredictable. Indeed, in the recently passed MAP-21 bill, the TIGER program was not allocated funds to continue operation beyond FY 2012, although $500 million was set aside for unspecified projects of “national and regional significance.”23 Even with these additional funds, however, the United States is still falling well short of the annual investment needed to upgrade and improve our freight rail infrastructure. The 2007 Cambridge Systematics study estimated that $148 billion in investment would be required between 2007 and 2035. Of that amount, $135 billion would be required for Class 1 lines and $13 billion for short-line and regional freight rail.24
Class 1 railroads anticipated they could generate approximately $96 billion in funds for additional investments on their own through increased earnings and revenue growth, higher volumes, and productivity improvements. Given these carriers’ increasing—and in some cases record-breaking—profits, Class 1 freight railroads should be expected to pay for the majority of system-improvement costs.25 To their credit, Class 1 railroads do appear to be following through on their commitment, and are planning to invest a record $13 billion in improve-ments in 2012.26

8 Center for American Progress | Getting America’s Freight Back on the Move
Assuming Class 1 railroads can raise $96 billion, there still remains an unfunded balance of $39 billion for Class 1 line improvements and expansion alone—$1.4 billion per year. To cover this gap and continue to aid Class II and Class III rail-roads, existing programs will have to either be expanded or replaced with larger and more dependable initiatives targeting those areas most in need.
For Class I railroads, these investments must concentrate on removing existing barriers to their modernization and calibrating assistance to enable and encour-age further private investment. This can be done by eliminating so-called at-grade road crossings, where train tracks cross roadways, as well as by resolving overlap issues with passenger services, improving intermodal linkages, and updating dilapidated bridges and undersized tunnels. Programs targeting local and regional lines should concentrate more heavily on the provision of capital for upgrading track, improving signal and control technologies, and expanding services.
If this funding for all railroads is not provided either by government or private investors, America’s freight rail infrastructure may fail to keep pace with antici-pated economic and population growth, undermining American manufacturers’ ability to get back on their feet and pushing an even greater share of freight trans-port onto America’s overburdened highway system.

9 Center for American Progress | Getting America’s Freight Back on the Move
TABLE 2
U.S. inland waterways by the numbers
Key statistics on U.S. waterways
Freight moved annually (tons), 2010*: 860 million
Percentage of U.S. freight moved (tonnage), 2010: 3.4
Percentage of U.S. freight moved (ton-miles), 2010: 12–15
Miles of navigable waterways 2012:25,000, which include 12,000 that are federally maintained and taxed.
Ownership of infrastructure:Mostly publically maintained; Army Corps responsible for all infrastructure on federal waterways.
FY2010 federal funding**:
General fund appropriations ($796 million), Inland Waterways Trust Fund allotment to Army Corps ($73.3 million), Transportation Investment Generating Economic Recovery grants ($13 million).
* FY2010 numbers are used, as this was the last year for which complete data for all freight transportation modes are available.
** FY2010 numbers are used, as this was the last year for which complete data for all freight transportation modes are available.
Sources: Author’s calculations based on sources:
Department of the Army, Fiscal Year 2010: Civil Works Budget for the U.S. Army Corps of Engineers (2009), available at http://www.usace.army.mil/Portals/2/docs/civilworks/press_book/budget2010.pdf.
Federal Railroad Administration, National Rail Plan: Moving Forward (Department of Transportation, 2010), available at http://www.fra.dot.gov/downloads/NRP_Sept2010_WEB.pdf.
U.S. Army Corps of Engineers, “U.S. Port and Inland Waterways Modernization: Preparing for Post-Panamax Vessels” (2012), available at http://www.iwr.usace.army.mil/docs/portswaterways/rpt/June_20_U.S._Port_and_Inland_Waterways_Preparing_for_Post_Panamax_Vessels.pdf.
Federal Highway Administration, Freight Facts and Figures (Department of Transportation, 2011), available at http://www.ops.fhwa.dot.gov/freight/freight_analysis/nat_freight_stats/docs/11factsfigures/pdfs/fff2011_highres.pdf.
Inland Waterway Users Boards, “Inland Waterways Trust Fund Status Report” (2011), available at http://www.waterwaysusers.us/IWTF_Status_65.pdf.
Department of Transportation, Capital Grants (2010), available at http://www.dot.gov/tiger/docs/TIGER%202%20Capital%20Highlights.pdf.
Current infrastructure conditions
Commercially navigable waterways reach into 41 states, including all states east of the Mississippi, and service 16 state capitals. These inland waterways—includ-ing the entire Mississippi River system, the Ohio River Basin, and the Gulf Intracoastal waterway that stretches from Florida to Texas, among others—play
Inland waterways

10 Center for American Progress | Getting America’s Freight Back on the Move
a crucial but frequently overlooked role in connecting America’s heartland to its coastal cities and ports.27
The system comprises 25,000 miles of commercially active inland and intracoastal waterways, including 12,000 miles of federally maintained and fuel-taxed water-ways managed by the Army Corps of Engineers. Also included in this network are 191 commercially active lock sites with 238 chambers that help the network carry approximately 15 percent of the nation’s domestic freight.28
Each year businesses and consumers throughout the country rely on waterways to move approximately 860 million tons of cargo valued at more than $343 bil-lion.29 Inland waterways are a primary mode of transport for U.S.-produced grain and oilseed, as well as for raw materials and liquid and bulk products such as coal, petroleum, chemicals, cement, processed metals, sand, and gravel.30
This network is particularly vital for large inland port cities such as Memphis, St. Louis, Chicago, Minneapolis, Cincinnati, and Pittsburgh, as well as for the thousands of farming communities that rely on barges to deliver their produce to domestic markets and major ports like New Orleans for export. Ports served by inland waterways exported 346 million tons of goods in 2010, much of which originated from inland farms and manufacturing centers.31
But America’s inland waterway system has been chronically underfunded, allowing it to deteriorate over the past five decades. With waterway cargo traffic expected to grow by almost 50 percent by 2040 it is almost certain the system will be incapable of handling this increased burden, making systemwide failures likely.32
Indeed, the majority of the locks and dams operated by the Army Corps are over 50 years old and are still in use well beyond their intended operational life.33 As of 2006, 47 percent of all locks had already been classified as functionally obsolete, and if no new locks are built by 2020, this figure will rise to over 80 percent.34 Lock outages have sharply increased over the last 20 years, resulting in significant delivery disruptions and increased costs passed on to consumers. On the Ohio River system alone, river haulers lost nearly 80,000 hours to lock outages in 2009, an increase of 25,000 hours over 2005 levels.35
Also found on the nation’s inland waterways are thousands of levees and dams not connected to lock chambers, and which have similarly been allowed to fall into a state of dangerous disrepair. Because these structures’ primary purpose is not

11 Center for American Progress | Getting America’s Freight Back on the Move
freight movement, they will not be discussed in detail in this report. Their mainte-nance, however, also is critically important to public safety and will be addressed in an upcoming CAP report on water infrastructure.
Current financial investment environment
Of all modes of goods transportation in the United States, inland waterways rely most heavily on federal money, which comprises between 80 percent to 85 percent of all spending on the system in any given year.36 General revenue funds are used to pay for 100 percent of operation and maintenance costs—approxi-mately $500 million per year—and also cover half of the costs of capital improve-ments.37 The other half is taken from the Inland Waterways Trust Fund, which collects money from users of federally maintained waterways via a 20 cent per gallon tax on diesel fuel. Every dollar allocated to the Army Corps from the Inland Waterways Trust Fund for capital projects is matched by the federal government.
In recent years, however, the trust fund balance has declined precipitously because of a combination of increased expenditures, cost overruns, and decreasing revenues.38 Year-end balances have declined almost every year since fiscal year 2002, from a high of $412 million that year to $58.5 million at the end of FY 2010.39 Outlays for capital improvements—which had averaged $133 million per year from FY 2000 to FY 2009—dropped to only $73.3 million in FY 2010, while revenues from the fuel tax fell to just $73.9 million, down from $112.7 million in FY 2001.40
These problems have been compounded by projects plagued with unexpected complications and delays resulting from insufficient year-to-year funding as well as poor planning and inaccurate cost estimates. Emblematic of the problem is the ongoing lock-and-dam project on the Ohio River at Olmsted, Illinois, which was scheduled to have been completed by 2000 after being originally authorized in 1988 at an expected cost of $775 million. The Corps now estimates the project will not be finished until 2024—nearly a quarter century later than expected—and at a revised total cost of $3.1 billion.41
Congress and the executive branch have helped to temporarily mitigate the decline in trust fund revenues by appropriating over $400 million in American Recovery and Reinvestment Act funds exempt from the Inland Waterways Trust Fund matching requirement to the Corps in 2009, as well as providing for $76.5 million in Transportation Investment Generating Economic Recovery grants to
“This is a ticking
time bomb. It’s not
a matter of if but
when there will
be a catastrophic
failure on our
inland waterway
system.”
Michael Hennessey
Chairman, National
Waterways
Foundation,
as quoted in
the Pittsburgh
Post-Gazette,
March 19th 2012

12 Center for American Progress | Getting America’s Freight Back on the Move
inland waterways through FY 2012.42 These stop-gap measures, however, have done nothing to address the trust fund’s long-term prospects and their implica-tions for inland waterway infrastructure. If current trends continue, the Corps is expected to have sufficient appropriations for just one ongoing lock replacement project—the Olmsted project—through FY 2016.43
The funding gap
Bringing America’s inland waterway system into a state of good repair will require investment significantly above current levels. A recent assessment by the Inland Waterways User Board, an industry-staffed federal advisory committee, estimated total required spending on capital projects at approximately $7.6 billion over the next 20 years.44 This equates to total annual spending of $380 million—roughly $150 million more per year more than the average combined annual allotment for projects on inland waterways since 1994 from both the IWTF and general fund.45
If this funding is not provided, the system will be unable to accommodate projected growth, delays will continue to increase, and the economies of both America’s heartland and her coastal ports will suffer as American goods and agri-cultural products become less and less competitive.

13 Center for American Progress | Getting America’s Freight Back on the Move
Ports
TABLE 3
U.S. ports by the numbers
Key statistics on U.S. ports
Freight moved annually (tons), 2011*: 2 billion
Percentage of U.S. overseas trade moved (tons), 2011: 95
Percentage of U.S. overseas trade moved (value), 2011: 75
Top five U.S. ports by twenty-foot equivalent (TEU) capacity, 2011:
Los Angeles, Long Beach, New York/New Jersey, Savannah, Oakland.
Ownership of infrastructure:
Public port authorities own most port infrastructure and lease it to private corpora-tions—both can contribute to capital invest-ment and maintenance.
FY2010 federal funding**:
Harbor Maintenance Trust Fund allotment to Army Corps ($828 million), Transportation Investment Generating Economic Recovery grants ($68.2 million).
* FY2011 numbers are used, as this was the last year for which complete data for all freight transportation modes are available.
** FY2010 numbers are used, as this was the last year for which complete data for all freight transportation modes are available.
Source: Author’s calculations based on sources:
Office of Management and Budget, Fiscal Year 2012 Budget of the U.S. Government – Appendix (2012) available at http://m.whitehouse.gov/sites/default/files/omb/budget/fy2012/assets/appendix.pdf.
Jo-Ellen Darcy, Response to questions at the House of Representatives, Transportation and Infrastructure Committee, Subcommittee on Water Resources and Environment, “Economic Importance of Seaports,” October 26, 2011, available at http://republicans.transportation.house.gov/Media/file/TestimonyWater/2011-10-26%20Darcy.pdf.
American Association of Port Authorities, “North America Container Traffic: 2011 Port Rankings by TEUs” (2011), available at http://aapa.files.cms-plus.com/Statistics/NORTH%20AMERICA%20PORT%20CONTAINER%20TRAFFIC%20RANKING%202011.pdf.
Department of Transportation, Capital Grants (2010), available at http://www.dot.gov/tiger/docs/TIGER%202%20Capital%20Highlights.pdf.
Current infrastructure conditions
America’s ports are key gateways for exports and imports, and maintaining their vitality is essential for ensuring continued economic growth. America’s seaports handle over 2 billion tons of cargo annually, including 70 percent of imported oil and 48 percent of all goods purchased by American consumers.46 This accounts for 95 percent of overseas trade by weight and 75 percent by value.47 In 2009 alone,

14 Center for American Progress | Getting America’s Freight Back on the Move
U.S. ports handled approximately $474 billion worth of imports and $177 billion in exports.48 On an average weekday that year, they processed 68,000 20-foot equivalent units, or TEUs, compared to only 37,000 TEUs in 1995.
To provide some context for these numbers, a single 20-foot container can hold approximately 48,000 bananas.49 This means that one state-of-the-art container vessel with a capacity of 14,000 TEUs could theoretically deliver 672 million bananas on a single voyage, or enough bananas to give one to every person living in the United States, Canada, and Mexico with 200 million to spare.
Ports including Los Angeles, Seattle, New York, and Miami also serve as criti-cal intermodal hubs for transferring waterborne cargo to and from freight rail, trucking services, and barges serving inland waterways. As the economy grows and populations increase, ports will continue to grow in importance. Total U.S. container traffic more than doubled in volume between 1995 and 2007, and cur-rent forecasts predict exports and imports traveling through American ports will increase by approximately 39 and 43 million TEUs, respectively, by 2037.50
Alongside increases in cargo volume, the size of ships calling on U.S. ports has also increased dramatically in recent decades, a trend that is expected to continue. In 2000, the average container vessel size was 2,900 TEUs, whereas the current average is closer to 6,100 TEUs.51 This is largely due to an increase in the number of so-called ‘Post-Panamax’ vessels—vessels too large to currently fit through the Panama Canal—being put into service. These ships are in excess of 1,000 feet long, 125 feet wide, and can draw more than 50 feet of water. Once the ongoing Panama Canal expansion is completed in 2014, the number of such vessels calling on U.S. ports, particularly on East Coast ports, will likely increase even further.
Unfortunately, much of America’s port infrastructure is not prepared to accommo-date these increases in cargo volume and ship size. The Army Corps of Engineers estimates that full channel dimensions are available less than 35 percent of the time at the nation’s 59 busiest ports.52 This means that while a port’s listed channel depth may be 50 feet, the majority of the time this is not true due to silt and sand accumulation and infrequent or inadequate dredging.
This lack of capacity increases shipping costs, as vessels are forced to carry less cargo to reduce their draft, and also increases the risk of ships grounding or col-liding with one another in narrowed channels. Currently, the United States ranks only 23rd in the quality of its port infrastructure, well behind countries such as

15 Center for American Progress | Getting America’s Freight Back on the Move
Malaysia, Namibia, Panama, and Estonia.53 As of 2009, only two U.S. ports—those at Los Angeles and Long Beach—ranked in the world’s top 20 container ports in terms of TEU capacity, placing 16th and 18th respectively.54 By compari-son, Chinese seaports accounted for six of the top 10. Shanghai’s port alone has greater container capacity than the top seven U.S. ports combined.55
Almost all U.S. ports still need to expand capacity and make significant infra-structure investments to prepare for increased cargo volume and ship size. These investments must include increasing berth lengths, crane sizes, and storage capac-ity, as well as improving railway and highway access. Some ports will also require significant channel deepening if they wish to accommodate post-Panamax vessels, as only eight U.S. ports can currently handle their 50-foot drafts.56
Additionally, as the largest ports begin to handle increased volumes and ship sizes, smaller ports further down the supply chain may experience a “cascade effect” as vessels currently servicing the largest ports are displaced by post-Panamax vessels and redirected to routes previously dominated by smaller ships.57 This means that considerable investments may also be needed ‘downstream’ on top of those already required at major ports. Unfortunately, opportunities for growth are often constrained by landside congestion and capacity challenges, meaning significant innovation and operational efficiency improvements will be required.
Current financial investment environment
Port operators pay for the majority of capital improvements to ports, but the federal government provides significant assistance, particularly for maintaining channel depths. This is the responsibility of the Army Corps of Engineers, which assists in covering the costs of required dredging and other channel maintenance activities with funds from the Harbor Maintenance Trust Fund. The fund was established in 1986 and collects revenues by charging a 0.125 percent tax on cargo value and cruise ship tickets, with the majority of its funding coming from freight imports. For several years it has collected more in revenues than Congress has appropriated for infrastructure improvements, resulting in a FY 2010 year-end cumulative balance of over $5.4 billion.58 That year the fund dispersed only $828 million, despite collecting almost $1.3 billion.59
While there is money to spend, however, Corps data indicate that the money that is disbursed is often spent inefficiently on ports that handle little to no cargo.

16 Center for American Progress | Getting America’s Freight Back on the Move
According to the Congressional Research Service, the nation’s 20 busiest ports—including the ports of Los Angeles, New York, Seattle, Houston, and Savannah—handle 80 percent of the oceangoing ships arriving in the United States but account for less than 40 percent of trust fund expenditures.60 Instead, millions are directed to smaller harbors used primarily by fishermen and recreational boats, neither of which pays into the Harbor Maintenance Trust Fund.
Take the Oregon Inlet in North Carolina between the Outer Banks and the Cape Hatteras Islands along the state’s north Atlantic coast. More than $60 million has been spent over the last decade to dredge the Oregon—a fishing channel that handles no cargo. Over the same time period only $16.8 million was allocated to the ports of Seattle and Tacoma, which handle approximately 75 oceangoing ships and thousands of barges per week.61
Harbor Maintenance Trust Fund money is also restricted by law for use on waterside improvements only, despite the fact that improved intermodal connections between ports, rail, inland waterways, and highways are among the areas most in need of investment. To help address this problem the Department of Transportation did allocate $256 million in Transportation Investment Generating Economic Recovery grants to ports from 2009 through 2012, most of which was directed toward intermodal linkage improvements.62 But this funding source has not been renewed and one-time grants to individual projects will not be sufficient to solve America’s systemic goods movement problems and ensure that the entirety of its port infra-structure is adequately prepared for projected growth.
Fortunately, some progress has been made in accelerating the delivery of available funds to port projects and improving coordination between the agencies responsi-ble for both waterside and landside improvements. As part of its “We Can’t Wait” initiative, the Obama administration recently announced that seven projects at five major ports would be expedited, with an additional 36 projects to be expe-dited by executive order in the near future. The administration also announced the creation of a Task Force on Ports to facilitate better cross-agency coordination and help assess the relative importance of projects from a national perspective.
These developments represent significant steps in the right direction, although much more remains to be done if America’s ports are to be more efficiently integrated into the national goods movement system and brought up to world-class standards.

17 Center for American Progress | Getting America’s Freight Back on the Move
The funding gap
To make certain that U.S. ports are ready to meet the needs of the economy of tomorrow, significant additional investment on top of that already being provided will be required, particularly concentrating on upgrades to intermodal connec-tions. While public port authorities have estimated they will invest $18.3 billion over the next five years on top of the $27.6 billion the expect their private-sector terminal partners to invest, this amount will still be insufficient to cover the costs of all required waterside and landside improvements.63 The Army Corps’ initial estimates have put the additional costs of expanding some ports along both coasts at between $3 and $5 billion. That total may change, however, when results are available from 17 studies the corps is currently conducting to assess the costs and benefits of additional port expansion projects.64
Regardless of the final cost estimate, it is clear that American ports are falling behind. Caterpillar Inc., the world’s largest manufacturer of construction and mining equip-ment, has already moved 30 percent to 40 percent of its export and import opera-tions to Canada in recent years to cut down on costs.65 This is not surprising given Canada’s multibillion dollar investments in its ports, including the recently opened facility at Prince Rupert on British Columbia province’s Pacific coast. This port is not only two shipping-days closer to the major Asian markets than are America’s southern California ports but also offers lower rail rates for cargo traveling to Chicago than can American rail lines operating out of Los Angeles.66
Without immediate and substantive intervention America risks undermining essential economic growth and watching its trade diverted elsewhere, potentially jeopardizing millions of jobs in the process.

18 Center for American Progress | Getting America’s Freight Back on the Move
To bring America’s goods movement infrastructure into a state of good repair and adequately prepare ourselves for the economic challenges of tomorrow, we must not only increase spending but also reform the ways in which government finances its investments and leverages private capital. In this section we will set out our recommendations for overcoming the investment gap and restoring America’s waterways, freight rail, and ports to the world-class condition necessary to enable future prosperity.
First we will look at general solutions applicable to all sectors of good transporta-tion. Then we will detail more mode-specific proposals.
Increased public investment
To keep pace with economic development and a growing population, all goods movement modes will require some additional public investment on top of that already being provided. The figures below represent our conservative estimates of additional annual spending needed per sector:
•Freight rail: $1.4 billion. These funds are needed to eliminate at-grade rail crossings, retrofit tunnels and bridges, and expand network-operating capabili-ties. Money should also be used to improve intermodal linkages with ports and warehousing facilities and to reduce congestion caused by scheduling conflicts and route overlaps with passenger rail.
• Inland waterways: $150 million. These funds are needed to repair and replace outdated lock-and-dam facilities and to invest in landside improvements at inland ports to improve intermodal transfers and accommodate increased freight volumes and ship sizes.
Closing the freight infrastructure gap

19 Center for American Progress | Getting America’s Freight Back on the Move
•Ports: $1 billion. These funds are needed for maintaining and increasing channel depths and for conducting other water-side improvements. This would bring annual expenditures from the Harbor Maintenance Trust Fund to approxi-mately $1.8 billion annually. This annual expenditure level should be maintained until the fund’s balance falls to $1 billion. No new revenues will be needed, as the trust fund balance and projected future revenues are likely to be sufficient to meet these needs.
Together, these spending increases would amount to roughly $2.5 billion in addi-tional annual expenditures over current funding levels. While present fiscal uncer-tainty might make such appropriations appear difficult to accommodate, these investments are essential and make sound economic sense. Not only will these investments enable economic growth in the long term, but they will produce thou-sands of jobs almost immediately in many of the sectors hit worst by the recession.
It should be noted, however, that these estimates are based on each mode’s current share of the goods movement market, and do not include any additional alloca-tions that might be made to increase the market shares of specific sectors. Such policies have been advocated by many concerned with the environmental and public health costs of freight transport as well as those attempting to maximize the efficiency of the system as a whole. This is primarily due to the greater fuel efficiency of freight rail and barge transport compared to truck transport. Freight trains and barges can get 413 ton-miles per gallon and 576 ton-miles per gallon, respectively, compared to only 110 ton-miles per gallon for trucks.67
While constrained by geographic barriers and available speeds, increasing the share of freight moved by these modes could significantly reduce pollution and improve public health while also reducing congestion and costs.
Increased private investment
Policymakers should also look into options for attracting additional private capital to major goods movement-related infrastructure projects. This could be done through increased use of public-private partnerships, or by offering special-pur-pose tax credit bonds. To make such investments attractive would likely require more widespread application of user fees to pay back investors.

20 Center for American Progress | Getting America’s Freight Back on the Move
While such methods may require significant cultural shifts and alterations to existing statutes—particularly in the case of inland waterways—they hold great potential for increasing investment in vital problem areas while at least partially reducing the government’s cost burden. This can be done by allocating money more efficiently, improving system coordination and integration on the railways, waterways, and ports. Let’s look at each in turn.
Allot money more efficiently
To ensure that federal spending achieves the maximum possible impact, multiple commonsense changes must also be made to the methodologies used to allot proj-ect funding. Such changes are particularly needed in the allocation processes for ports and inland waterways, which for decades have focused more on disbursing funds based on geography and politics than on maximizing economic efficiency.
Funds should be disbursed in a way that guarantees the highest return on each dollar spent and ensures that allocations intended to improve goods movement are actually directed toward that purpose. To this end, we recommend that Congress require the Army Corps of Engineers not only to continue conducting the project cost-benefit analyses they currently do, but also require them to rank all projects in a portfolio on the basis of their potential benefits. This would help to ensure that those projects with the greatest potential economic impact are undertaken first and that Congress and the American taxpayer are able to get the biggest bang for their buck.
Improve system coordination and integration
While many nations invest in infrastructure on the basis of a national infrastruc-ture plan, planning and spending in the United States is conducted in a thoroughly siloed fashion with extremely limited interprogram or interdepartmental plan-ning. Projects are generally funded on an individual basis, often ignoring potential cross-mode redundancies and more general systemic needs.
The Army Corps, for example, does not take into consideration freight rail improvements along the Mississippi River when allocating funding for nearby waterway improvements. What’s more, the Army Corps’ waterside undertakings are not even coordinated with landside investments at the same ports funded by the Department of Transportation.

21 Center for American Progress | Getting America’s Freight Back on the Move
The various goods movement modes and the agencies overseeing them need to dramatically improve coordination between systems to accommodate projected growth in freight tonnage and ton-miles while limiting already crippling conges-tion. Planning must be conducted on a less myopic scale, and no significant projects should be undertaken without the input of all relevant agencies and departments.
Significant investment must also be directed toward upgrading intermodal con-nections and ensuring that goods are moved from point A to point B in the most efficient manner possible. Spending on ports, waterways, rail, airports, or high-ways must cease to be considered as separate or competing ventures and must be viewed as part of a national integrated plan to reduce congestion, lower costs, and enable growth in both the short and long term.
Freight rail
In addition to increased direct federal investment, policymakers should encourage a more rapid allocation of Railroad Rehabilitation and Improvement Financing loans. Despite the Obama administration’s increased emphasis on this program, only a tiny fraction of the $35 billion available is being loaned out.
These funds hold the potential to leverage large-scale private investment in capital upgrades and rail network expansion—particularly for Class II and III railroads—at almost zero cost to the government. While allocations will of course be depen-dent on the number and quality of applications submitted, far more can be done to market the program and make it more attractive to both private and public investors throughout the country.
Inland waterways
There are a variety of methods that can—and should—be used to raise new rev-enues, pay for the additional $150 million per year in new spending we believe is required to improve the system, and to stabilize the Inland Waterways Trust Fund. First, we recommend that the fuel tax on diesel be raised from 20 cents per gallon to a minimum of 24.4 cents—equal to that paid by surface transportation users. This would raise an additional $20 million annually while also encouraging more efficient fuel consumption. The tax should also be indexed for inflation to ensure that the Inland Waterways Trust Fund’s purchasing power does not erode over time. Since

22 Center for American Progress | Getting America’s Freight Back on the Move
1994, the tax’s nonindexed status has cost the trust fund approximately $300 million in forgone revenues, according to the Congressional Research Service.68
Additional user fees should also be considered to raise revenues and increase the share of waterway infrastructure paid for by those who most benefit from its upkeep. Since the 1980s, multiple user-fee proposals have been considered and proposed by presidents on both sides of the aisle, including a Bush administration proposal to fully replace the fuel tax with a user fee collected at lock sites.69 More recently, the Obama administration has proposed adding two separate user fees—one for waterway usage and another for lock usage—on top of the fuel tax, which could raise up to $1 billion in additional revenues over 10 years.70 Whichever mechanism is chosen, we call on Congress to act quickly to raise the additional funds required to support required additional yearly investment.
It should be noted, however, that not all proposals for increasing spending should be treated equally. The Inland Waterway Users Board recently demonstrated a willingness to increase the fuel tax by six to nine cents, but conditioned this increase on altering the current cost-sharing formula such that the federal govern-ment would be wholly responsible for all capital projects under $100 million.71 Currently, the federal government is solely responsible for capital projects only under $8 million. According to the Congressional Research Service, this proposal would increase the federal share of waterway spending from between 80 and 85 percent to 90 percent.72
Given that waterways are already extremely dependent on federal spending, such a policy would be unwise. Alterations to cost-sharing formulas should be focused on more fairly distributing the cost for capital improvements between the govern-ment and the system’s users.
Ports
Multiple changes to the Harbor Maintenance Trust Fund should be considered to allow ports to initiate and complete necessary improvements. First, federal law should be changed to allow for these funds to be used for landside improvements. This will allow ports to adequately address intermodal connection needs, thereby minimizing congestion and increasing efficiency.

23 Center for American Progress | Getting America’s Freight Back on the Move
Policymakers should also look into options for levying user fees on those benefi-ciaries of trust fund investments who do not currently contribute to the Harbor Maintenance Trust Fund. These include commercial fishing vessels and private recreational craft that pay no fees, as well as domestic freight carriers who often avoid paying the 0.125 percent tax. Army Corps data estimate that approximately $500 million per year goes uncollected from these carriers—roughly eight times more than the total amount they currently pay.73 While the corps has taken some steps to increase cooperation with Customs and Border Protection to improve collection, more must be done.
Finally, lawmakers may want to evaluate the potential benefits of altering the Harbor Maintenance Trust Fund tax in such a way that a portion of the tax would be levied based on ship volume instead of only on cargo value. This idea, first proposed by the Clinton administration, would force shippers to at least partially assume responsibility for the costs of using larger ships. Currently only port authorities and governments cover these costs, as they alone are responsible for channel deepening, equipment replacement, and dock renovations.

24 Center for American Progress | Getting America’s Freight Back on the Move
When the golden spike was driven in Promontory Summit, Utah in 1869, it repre-sented the completion of an astounding technological feat of railroad engineering and the beginning of a new era. In the century that followed, America’s govern-ment and entrepreneurs together laid the foundation of an economy that would surpass anything known before it—a foundation of steel, timber, and cement.
But as time passed and responsibilities were ignored, cracks began to appear in the bridges, locks, dams, and railways that at one time could claim no peer the world over. In recent decades, the United States has done little but sit back and watch as its neighbors and competitors poured billions into modern rail, waterways, and ports, all at the expense of American competitiveness abroad.
Lawmakers in Washington now recognize that if our nation is to keep pace they must change the way they do business, and the most recent surface transporta-tion bill passed by Congress in June does contain language establishing a National Freight Program. The bill recognizes the importance of improving the national freight network to economic competitiveness and to reducing congestion. It’s unfor-tunate that the bill focuses almost exclusively on truck freight, with only limited provisions for improving rail-highway grade separations and intermodal facilities.
But the Obama administration can use the requirement for planning to open the door to the development of a broader national freight plan.74 Concentrating on highway improvements alone will not sufficiently address the nation’s goods movement needs. An effective national freight plan must optimize the nation’s railways, waterways, and ports in order to reduce the cost of goods movement and congestion for businesses and individual travelers.
If the United States is to regain its economic footing it has no option but to reinvest in the system of goods movement that enabled its past prosperity. Such investment not only would enable sustained economic growth in long term but could also produce thousands of jobs almost immediately and offer hope to many
Conclusion
25 Center for American Progress | Getting America’s Freight Back on the Move
of those hit hardest by the recession. Whether this investment takes place now or at a much higher cost in the future is up to today’s policymakers, who must decide how many more billions of dollars they are willing to watch go up in exhaust at collapsing lock sites, gridlocked rail bottlenecks, and overburdened port terminals throughout the country.

26 Center for American Progress | Getting America’s Freight Back on the Move
About the authors
Donna Cooper is a Senior Fellow with the Economic Policy team at American Progress. Formerly the deputy mayor for policy for Philadelphia and secretary of policy and planning for the Commonwealth of Pennsylvania, Cooper brings 20 years managing large-scale programs to assist struggling families to exit poverty. Her experience ranges from homeless jobs programs to holistic training and sup-port programs aimed at single mothers. She has written extensively on infrastruc-ture at CAP.
Kristina Costa is a research assistant in economic policy at the Center. She has written on regulatory policy, government reform, innovation, education, and infrastructure, among other areas. Costa received her B.A. in political philosophy from Wellesley College. Prior to joining CAP, she worked as a legislative corre-spondent for Rep. Carol Shea-Porter (D-NH).
Keith Miller is an intern with the economic policy team at the Center for American Progress and a student at the Georgetown Public Policy Institute.
Acknowledgements
We are grateful for the generous support of Bernard Schwartz and the Rockefeller Foundation.

27 Center for American Progress | Getting America’s Freight Back on the Move
1 Federal Highway Administration, “Freight Facts and Figures 2011” (Department of Transportation, 2011), available at http://www.ops.fhwa.dot.gov/freight/freight_analysis/nat_freight_stats/docs/11factsfigures/pdfs/fff2011_highres.pdf.
2 Building America’s Future, “Falling Apart and Falling Behind” (2011), available at http://www.bafuture.com/sites/default/files/Report_0.pdf.
3 Paul Davidson, “USA’s creaking infrastructure holds back economy,” USA Today, May 20, 2012, available at http://www.usatoday.com/money/economy/story/2012-05-20/creaking-infrastructure/55096396/1.
4 Texas Transportation Institute, “2011 Urban Mobility Report” (2011), available at http://tti.tamu.edu/docu-ments/mobility-report-2011.pdf.
5 Federal Register 77 (84), May 1, 2012, available at http://www.gpo.gov/fdsys/pkg/FR-2012-05-01/html/2012-10364.htm.
6 Donna Cooper, “Meeting the Infrastructure Imperative” (Washington: Center for American Progress, 2012), available at http://www.americanprogress.org/is-sues/2012/02/infrastructure.html.
7 Federal Highway Administration, 2010 Status of the Nation’s Highways, Bridges, and Transit: Conditions and Performance (Department of Transportation, 2010), Exhibit 6-6, available at http://www.fhwa.dot.gov/policy/2010cpr/chap6.htm#2.
8 Federal Highway Administration, Freight Facts and Figures (Department of Transportation, 2011), available at http://www.ops.fhwa.dot.gov/freight/freight_analy-sis/nat_freight_stats/docs/11factsfigures/pdfs/fff2011_highres.pdf.
9 Association of American Railroads, “The Economic Im-pact of America’s Freight Railroads” (2011) available at http://www.aar.org/~/media/aar/Background-Papers/The-Economic-Impact-of-Freight.ashx; “Rail Industry Plans for Growth in 2012,” available at http://fastlane.dot.gov/2012/01/rail-industry-plans-big-2012.html (last accessed June 2012).
10 “America’s Infrastructure Report Card: Rail,” available at http://www.infrastructurereportcard.org/fact-sheet/rail (last accessed June 2012).
11 Federal Railroad Administration, National Rail Plan: Moving Forward (Department of Transportation, 2010) available at http://www.fra.dot.gov/downloads/NRP_Sept2010_WEB.pdf.
12 Federal Highway Administration, Freight Facts and Figures.
13 World Economic Forum, “The Global Competitiveness Report, 2011-12” (2011), available at http://www3.weforum.org/docs/WEF_GCR_Report_2011-12.pdf.
14 “About CREATE,” available at http://www.createpro-gram.org/about.htm (last accessed July 2012).
15 Texas Transportation Institute, “2011 Urban Mobility Report” (2011) available at http://tti.tamu.edu/docu-ments/mobility-report-2011.pdf.
16 Michael S. Bronzini, “Relationships Between Land Use and Freight and Commercial Truck Traffic in Metropolitan Areas” (Fairfax: Transportation Research Board of the Na-tional Academies of Sciences, 2008) available at http://onlinepubs.trb.org/onlinepubs/sr/sr298bronzini.pdf.
17 Cambridge Systematics Inc., “National Rail Freight Infrastructure Capacity and Investment Study” (2007), available at http://www.aar.org/~/media/aar/Files/natl_freight_capacity_study.ashx.
18 “Railroad Rehabilitation & Improvement Financing (RRIF) Program,” available at http://www.fra.dot.gov/rpd/freight/1770.shtml#RPO (last accessed June 2012).
19 Ibid.
20 The Bush administration did not look favorably on the program and attempted to eliminate it in their proposed FY 2007 budget, “Department of Transporta-tion Budget FY 2007,” available at http://www.gpo.gov/fdsys/pkg/BUDGET-2007-BUD/pdf/BUDGET-2007-BUD-21.pdf.
21 “Surface Transportation Reauthorization Bill,” available at http://rsiweb.org/advocacy/surface-transportation-bill/ (last accessed July 2012).
22 Author’s calculation based on data, Department of Transportation, “TIGER 2012 Awards” (2012) available at http://www.dot.gov/tiger/fy2012tiger.pdf; Department of Transportation, “TIGER 2011 Awards” (2011) available at http://www.dot.gov/tiger/docs/FY2011_TIGER.pdf; Department of Transportation, “Capital Grants” (2010) available at http://www.dot.gov/tiger/docs/TIGER%202%20Capital%20Highlights.pdf and Department of Transportation, “Transportation Investment Generating Economic Recovery Grants” (2009) available at http://www.dot.gov/tiger/docs/TIGER%20Capital%20High-lights.pdf.
23 “Moving Ahead for Progress in the 21st Century Act (MAP-21): A Summary of Highway Provisions,” available at http://www.fhwa.dot.gov/map21/summaryinfo.cfm (last accessed July 2012).
24 Cambridge Systematics Inc., “National Rail Freight Infrastructure Capacity and Investment Study.”
25 Abram Brown, “Union Pacific on Fast Track to Record Profit,” Forbes, July 19, 2012, available at http://www.forbes.com/sites/abrambrown/2012/07/19/union-pacifics-on-fast-track-to-record-profits-shares-at-all-time-high/; “Norfolk Southern sees record profit,” The Altoona Mirror, July 25, 2012, available at http://www.altoonamirror.com/page/content.detail/id/562771/Norfolk-Southern-sees-record-profit.html?nav=725; “UPDATE 1-Norfolk Southern profit up despite coal drop,” Reuters, July 25, 2012, available at http://in.reuters.com/article/2012/07/24/norfolksouthern-earnings-idINL2E8IOD5420120724.
26 “Rail Industry Plans for Growth in 2012,” available at http://fastlane.dot.gov/2012/01/rail-industry-plans-big-2012.html (last accessed June 2012).
27 “America’s Infrastructure Report Card: Inland Water-ways,” available at http://www.infrastructurereportcard.org/fact-sheet/inland-waterways (last accessed June 2012).
Endnotes

28 Center for American Progress | Getting America’s Freight Back on the Move
28 U.S. Army Corps of Engineers, “U.S. Port and Inland Waterways Modernization: Preparing for Post-Panamax Vessels” (2012) available at http://www.iwr.usace.army.mil/docs/portswaterways/rpt/June_20_U.S._Port_and_Inland_Waterways_Preparing_for_Post_Panamax_Ves-sels.pdf.
29 Federal Highway Administration, Freight Facts and Figures.
30 David Grier, “The Declining Reliability of the U.S. Inland Waterway System” (Alexandria: U.S. Army Corps of Engineers, 2005), available at http://onlinepubs.trb.org/onlinepubs/archive/Conferences/MTS/4A%20GrierPa-per.pdf.
31 U.S. Army Corps of Engineers, “U.S. Port and Inland Waterways Modernization: Preparing for Post-Panamax Vessels” (2012), available at http://www.iwr.usace.army.mil/docs/portswaterways/rpt/June_20_U.S._Port_and_Inland_Waterways_Preparing_for_Post_Panamax_Ves-sels.pdf.
32 Authors calculation based on data, Federal Highway Administration, Freight Facts and Figures.
33 U.S. Army Corps of Engineers, “Inland Waterway Naviga-tion: Value to the Nation” (2009), available at http://www.corpsresults.us/docs/VTNInlandNavBro_loresprd.pdf.
34 “America’s Infrastructure Report Card: Inland Water-ways,” available at http://www.infrastructurereportcard.org/fact-sheet/inland-waterways (last accessed June 2012).
35 Jennifer Levitz and Cameron McWhirter, “Old Locks Jam River Traffic,” The Wall Street Journal, January 6, 2011, available at http://online.wsj.com/article/SB10001424052748704735304576057903661752050.html#.
36 Congressional Research Service, “Inland Waterways: Recent Proposals and Issues for Congress” (2012) avail-able at www.fas.org/sgp/crs/misc/R41430.pdf.
37 Ibid.
38 Ibid.
39 Inland Marine Transportation System Capital Invest-ment Strategy Team, “Inland Marine Transportation Systems (IMTS) Capital Projects Business Model – Final Report” (2010), available at http://www.waterway-scouncil.org/WCIExtras/IMTS_IWUB_Report.pdf.
40 Inland Marine Transportation System Capital Invest-ment Strategy Team, “Inland Marine Transportation Systems (IMTS) Capital Projects Business Model – Final Report”; Inland Waterway Users Boards, “Inland Wa-terways Trust Fund Status Report” (2011), available at http://www.waterwaysusers.us/IWTF_Status_65.pdf.
41 Len Boselovic, “Locked and Dammed: Ohio River proj-ect decades late, billions over,” Pittsburgh Post-Gazette, March 19, 2012, available at http://old.post-gazette.com/pg/12079/1217879-113.stm.
42 Inland Waterways Users Board, “Inland Waterways Users Board 23rd Annual Report to the Secretary of the Army and the United States Congress” (2009), available at http://www.waterwaysusers.us/Annual_Report_23.pdf; Author’s calculation based on data, Department of Transportation, “TIGER 2012 Awards” (2012) available at http://www.dot.gov/tiger/fy2012tiger.pdf; Department of Transportation, “TIGER 2011 Awards” (2011) available at http://www.dot.gov/tiger/docs/FY2011_TIGER.pdf; Department of Transportation, “Capital Grants” (2010) available at http://www.dot.gov/tiger/docs/TIGER%202%20Capital%20Highlights.pdf; Department of
Transportation, “Transportation Investment Generating Economic Recovery Grants” (2009) available at http://www.dot.gov/tiger/docs/TIGER%20Capital%20High-lights.pdf.
43 Congressional Research Service, “Inland Waterways: Recent Proposals and Issues for Congress.”
44 Inland Waterways Users Board, “Inland Waterways User Board 24th Annual Report” (2010) available at http://www.waterwaysusers.us/Annual_Report_FY10.pdf.
45 Congressional Research Service, “Inland Waterways: Recent Proposals and Issues for Congress.”
46 Jo-Ellen Darcy, Response to questions at the House of Representatives, Transportation and Infrastructure Committee, Subcommittee on Water Resources and Environment, “Economic Importance of Seaports,” Octo-ber 26 2011, http://republicans.transportation.house.gov/Media/file/TestimonyWater/2011-10-26%20Darcy.pdf.
47 Ibid.
48 Bureau of Transportation Statistics, “America’s Container Ports: Linking Markets at Home and Abroad” (Depart-ment of Transportation, 2011) available at http://www.bts.gov/publications/americas_container_ports/2011/pdf/entire.pdf.
49 “Company facts and information,” available at http://www.maerskline.com/link/?page=brochure&path=/about_us/company_info (last accessed July, 2012).
50 Bureau of Transportation Statistics, America’s Container Ports: Linking Markets at Home and Abroad (Depart-ment of Transportation, 2011) available at http://www.bts.gov/publications/americas_container_ports/2011/pdf/entire.pdf; U.S. Army Corps of Engineers, “U.S. Port and Inland Waterways Modernization: Preparing for Post-Panamax Vessels” (2012) available at http://www.iwr.usace.army.mil/docs/portswaterways/rpt/June_20_U.S._Port_and_Inland_Waterways_Prepar-ing_for_Post_Panamax_Vessels.pdf.
51 U.S. Army Corps of Engineers, “U.S. Port and Inland Waterways Modernization: Preparing for Post-Panamax Vessels.”
52 Congressional Research Service, “Harbor Maintenance Trust Fund Expenditures” (2011) available at http://www.fas.org/sgp/crs/misc/R41042.pdf.
53 World Economic Forum, “The Global Competitiveness Report, 2011-12” (2011), available at http://www3.weforum.org/docs/WEF_GCR_Report_2011-12.pdf.
54 Bureau of Transportation Statistics, America’s Container Ports: Linking Markets at Home and Abroad.
55 Building America’s Future Educational Fund, “Building America’s Future: Falling Apart and Falling Behind” (2011) available at http://www.bafuture.com/sites/default/files/Report_0.pdf.
56 In addition to these eight ports (Seattle, Oakland, Los Angeles, Long Beach, Baltimore, New York, Norfolk, and Charleston when at high tide), two others (Miami and Savannah) are currently expanding their draft capacity. U.S. Army Corps of Engineers, “U.S. Port and Inland Waterways Modernization: Preparing for Post-Panamax Vessels.”. (2012
57 U.S. Army Corps of Engineers, “U.S. Port and Inland Waterways Modernization: Preparing for Post-Panamax Vessels.”

29 Center for American Progress | Getting America’s Freight Back on the Move
58 Office of Management and Budget, “Balances of Budget Authority Fiscal Year 2012,” available at http://www.whitehouse.gov/sites/default/files/omb/budget/fy2012/assets/balances.pdf. The OMB estimates indicate the year-end balance for FY 2011 may reach $6.9 billion.
59 Office of Management and Budget, “Fiscal Year 2012 Budget of the U.S. Government – Appendix” (2012) available at http://m.whitehouse.gov/sites/default/files/omb/budget/fy2012/assets/appendix.pdf.
60 Congressional Research Service, “Harbor Maintenance Trust Fund Expenditures.”
61 Ibid.
62 Author’s calculation based on data, Department of Transportation, “TIGER 2012 Awards”; Department of Transportation, “TIGER 2011 Awards”; Department of Transportation, “Capital Grants” (2010), available at http://www.dot.gov/tiger/docs/TIGER%202%20Capital%20Highlights.pdf; Department of Transporta-tion, “Transportation Investment Generating Economic Recovery Grants” (2009), available at http://www.dot.gov/tiger/docs/TIGER%20Capital%20Highlights.pdf.
63 American Association of Port Authorities, “U.S. Port Infrastructure Investment Survey: 2012-2016” (2012), available at http://aapa.files.cms-plus.com/2012%20AAPA%20Port%20Infrastructure%20Spending%20Sur-vey%20Summary.pdf.
64 U.S. Army Corps of Engineers, “U.S. Port and Inland Waterways Modernization: Preparing for Post-Panamax Vessels.”
65 Paul Davidson, “USA’s creaking infrastructure holds back economy,” USA Today, May 20, 2012, available at http://www.usatoday.com/money/economy/story/2012-05-20/creaking-infrastructure/55096396/1.
66 U.S. Army Corps of Engineers, “U.S. Port and Inland Waterways Modernization: Preparing for Post-Panamax Vessels.”
67 Federal Railroad Administration, National Rail Plan: Moving Forward (Department of Transportation, 2010), available at http://www.fra.dot.gov/downloads/NRP_Sept2010_WEB.pdf.
68 Congressional Research Service, “Inland Waterways: Recent Proposals and Issues for Congress.”
69 Ibid.
70 Ibid.
71 Ibid.
72 Ibid.
73 Congressional Research Service, “Harbor Maintenance Trust Fund Expenditures.”
74 S. 1813 – MAP-21, available at http://www.govtrack.us/congress/bills/112/s1813/text.

The Center for American Progress is a nonpartisan research and educational institute
dedicated to promoting a strong, just, and free America that ensures opportunity
for all. We believe that Americans are bound together by a common commitment to
these values and we aspire to ensure that our national policies reflect these values.
We work to find progressive and pragmatic solutions to significant domestic and
international problems and develop policy proposals that foster a government that
is “of the people, by the people, and for the people.”
1333 H STREET, NW, 10TH FLOOR, WASHINGTON, DC 20005 • TEL: 202-682-1611 • FAX: 202-682-1867 • WWW.AMERICANPROGRESS.ORG