Embed Size (px)
Citation preview
1
Getting ROI Numbers from Usability TestingJohn Sorflaten , PhDCertified Professional Ergonomist (CPE)Certified Usability Analyst (CUA)
“Midwife to successful web and application design”User testing, analysis, strategy, eCommerce, mobile apps
User Experience Workshttp://www.linkedin.com/in/johnsorflaten (see SlideShare)www.userexperienceworks.com www.iphoneroi.com 641-455-1873
2
Overview
Making usability more meaningful and consumable to business…
Quantitative usability testing (UT) Converting UT results to business measures Presenting UT results in relevant business
terms
Why scare you with “Quantitative” word?
3
1. Beyond “More” and “Less” Measure usability to learn “quantity” of…
Efficiency (time-on-task) Effectiveness (task success rates) Satisfaction (subjective ratings) Learning (time to learn) Errors (ouch)
“Quantity” allows ROI calculations (!)
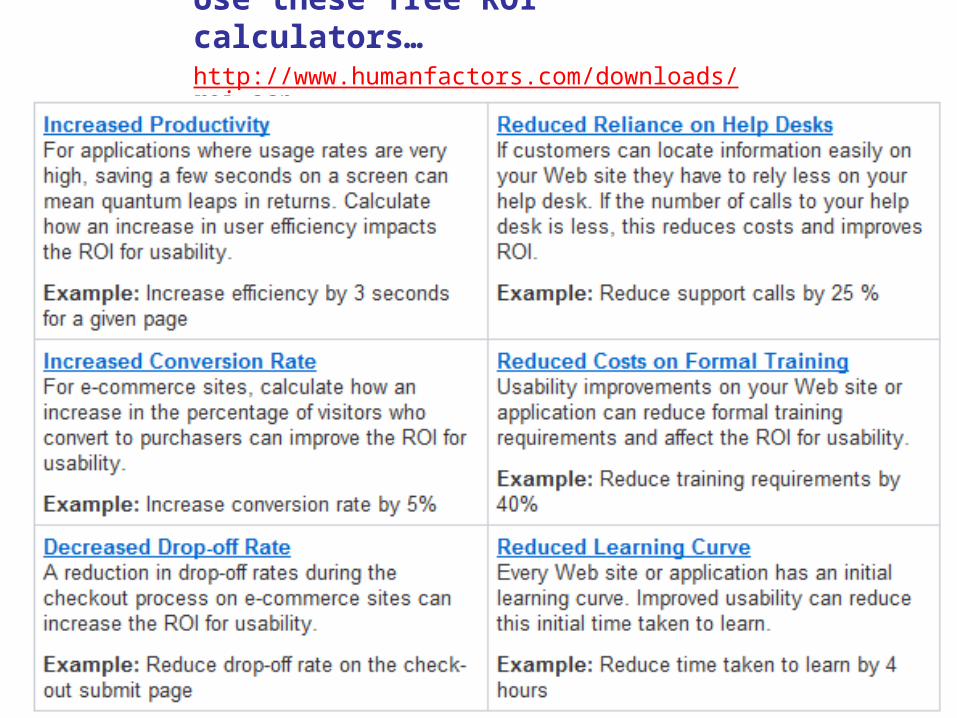
Use these free ROI calculators…http://www.humanfactors.com/downloads/roi.asp
4
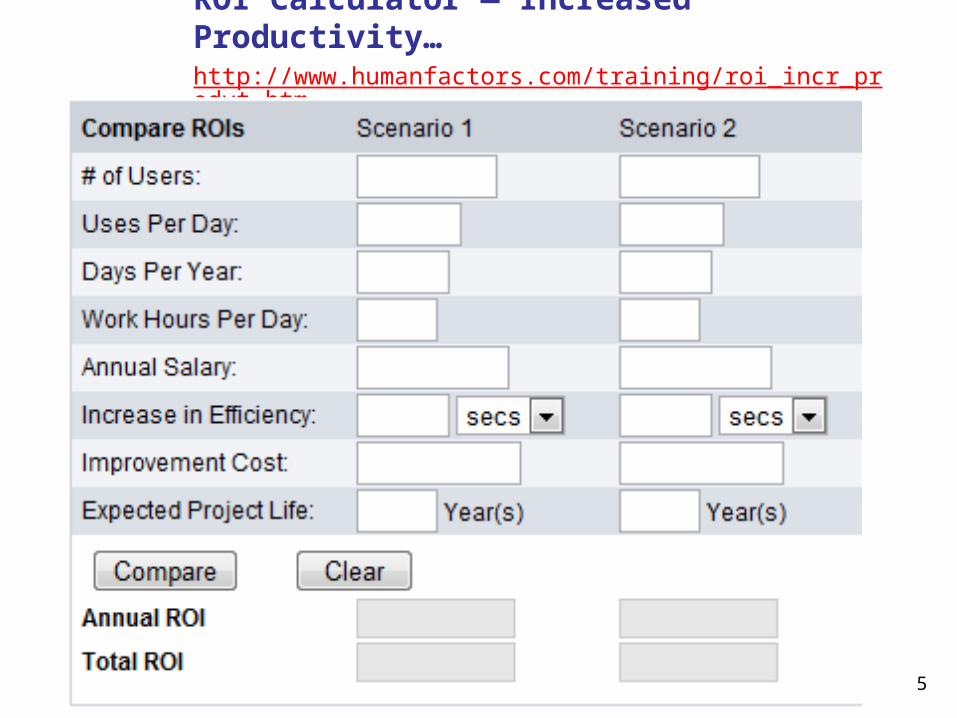
ROI Calculator — Increased Productivity…http://www.humanfactors.com/training/roi_incr_prodvt.htm
5
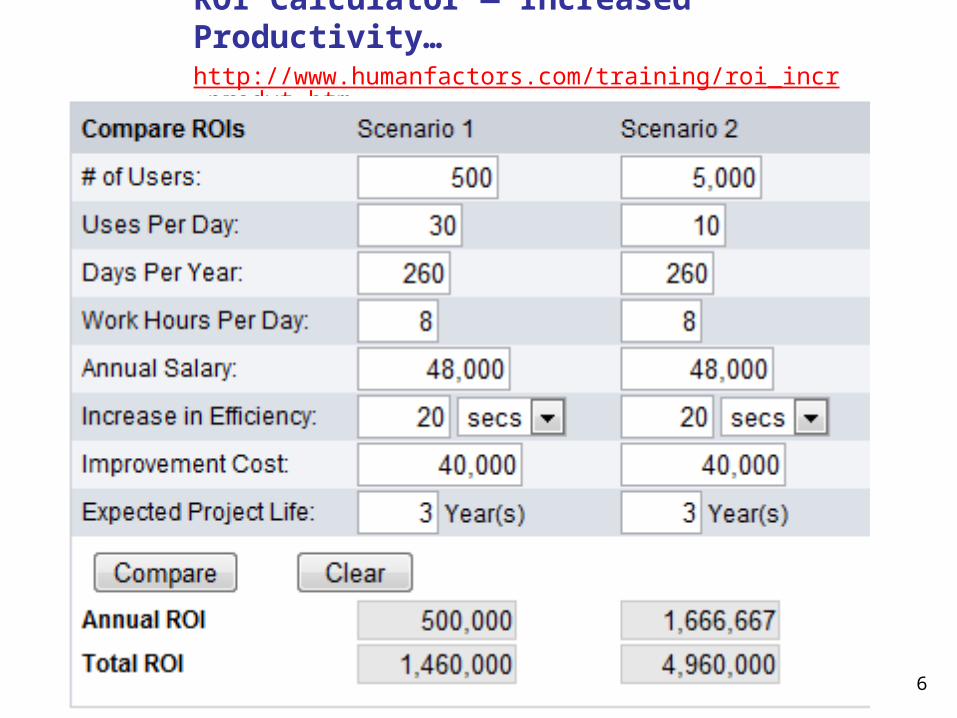
ROI Calculator — Increased Productivity…http://www.humanfactors.com/training/roi_incr_prodvt.htm
6
7
2. Remember:“Margin of Error” Like voting polls… measures are fuzzy.
Remember +/- 3%? (You need 1067 people needed to get +/-3%…)
If 8 of 10 test participants succeed, DON’T say “80% passed.”
Best you can say: 48% to 96% passed. www.measuringusability.com/wald.htm
8
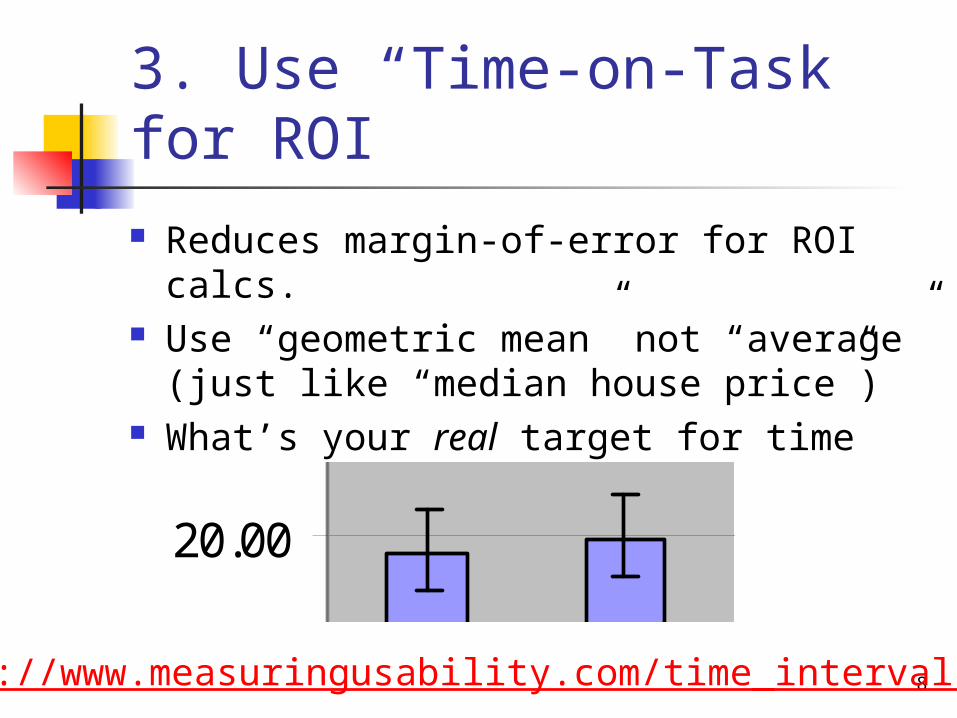
3. Use “Time-on-Task” for ROI Reduces margin-of-error for ROI calcs. Use “geometric mean” not “average”
(just like “median house price”) What’s your real target for time savings?
(test)
0.00
10.00
20.00
30.00
http://www.measuringusability.com/time_intervals.php
9
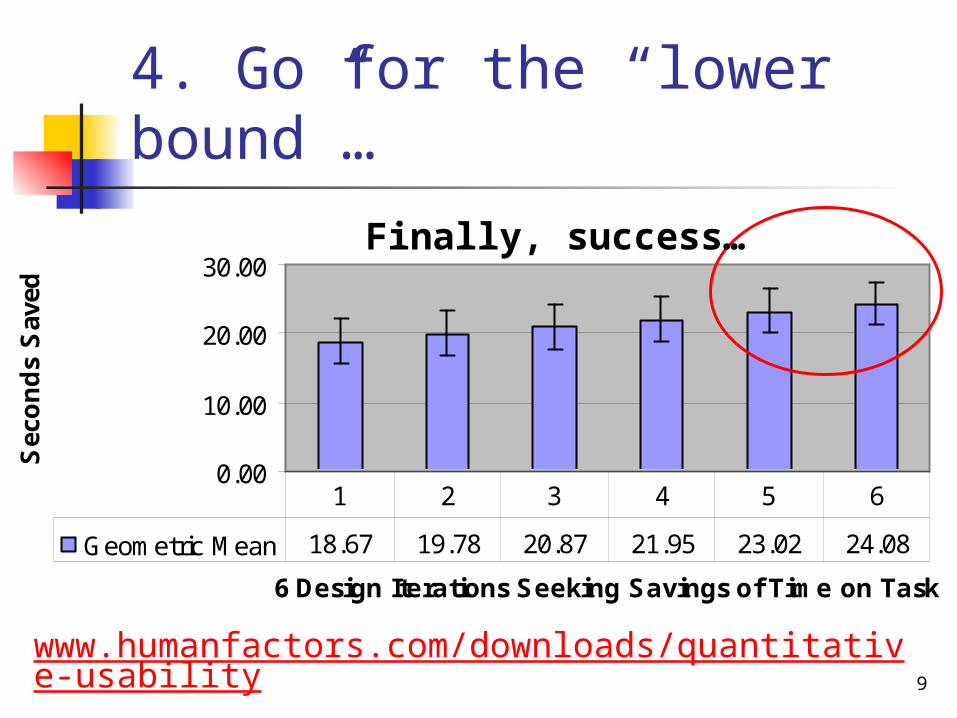
4. Go for the “lower bound”…
www.humanfactors.com/downloads/quantitative-usability
0.00
10.00
20.00
30.00
6 Design Iterations Seeking Savings of Time on Task
Sec
on
ds
Sav
ed
Geometric Mean 18.67 19.78 20.87 21.95 23.02 24.08
1 2 3 4 5 6
Finally, success…
10
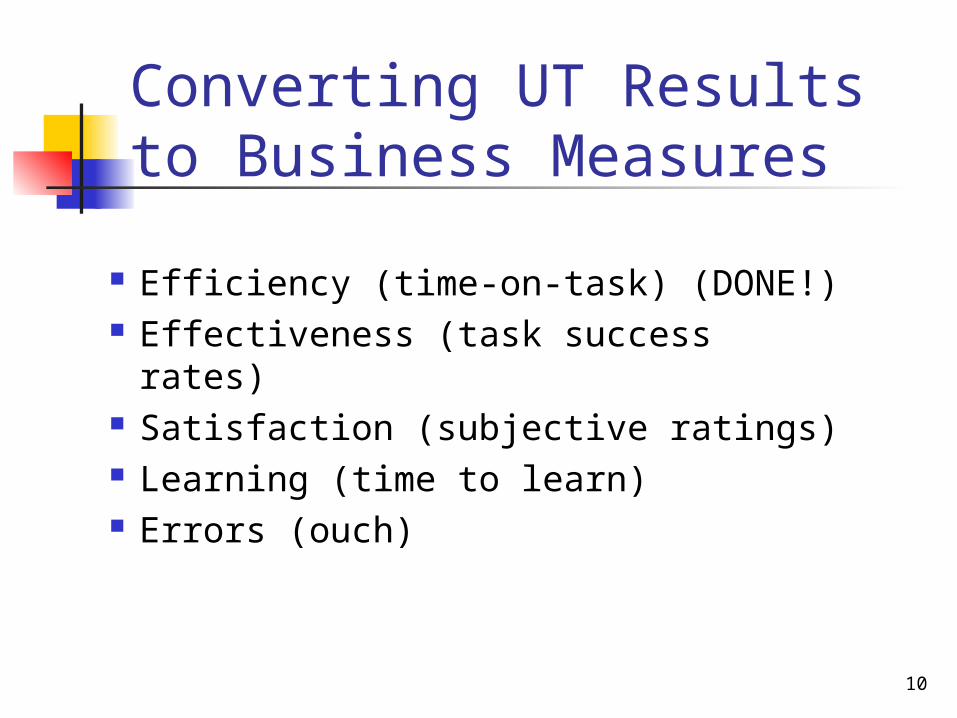
Converting UT Results to Business Measures
Efficiency (time-on-task) (DONE!) Effectiveness (task success rates) Satisfaction (subjective ratings) Learning (time to learn) Errors (ouch)
11
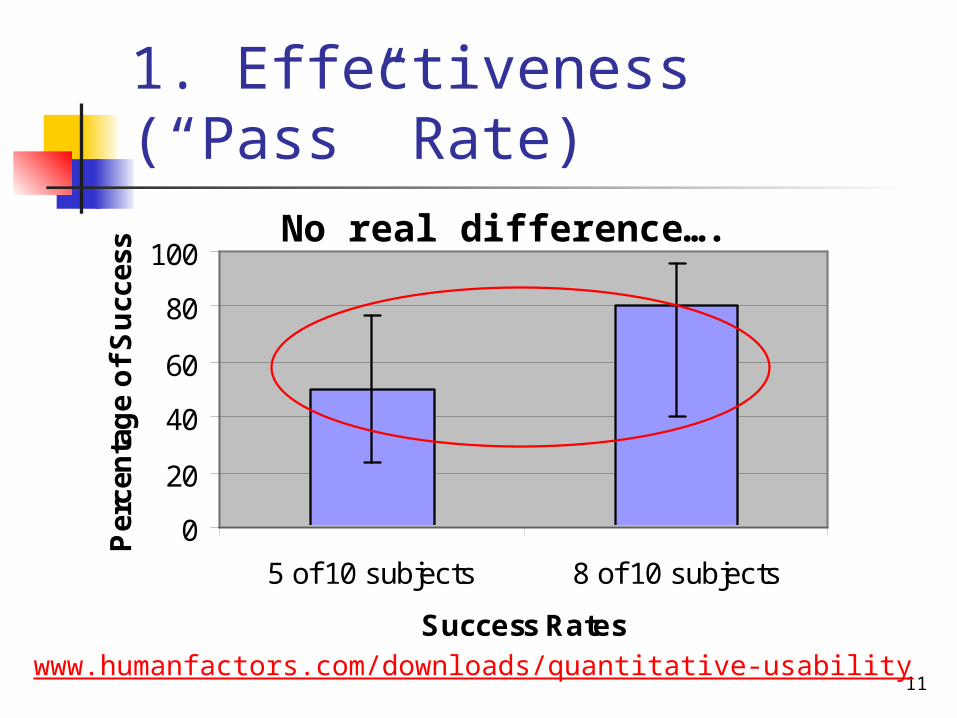
1. Effectiveness (“Pass” Rate)
www.humanfactors.com/downloads/quantitative-usability
0
20
40
60
80
100
5 of 10 subjects 8 of 10 subjects
Success Rates
Per
cen
tag
e o
f S
ucc
ess No real difference….
12
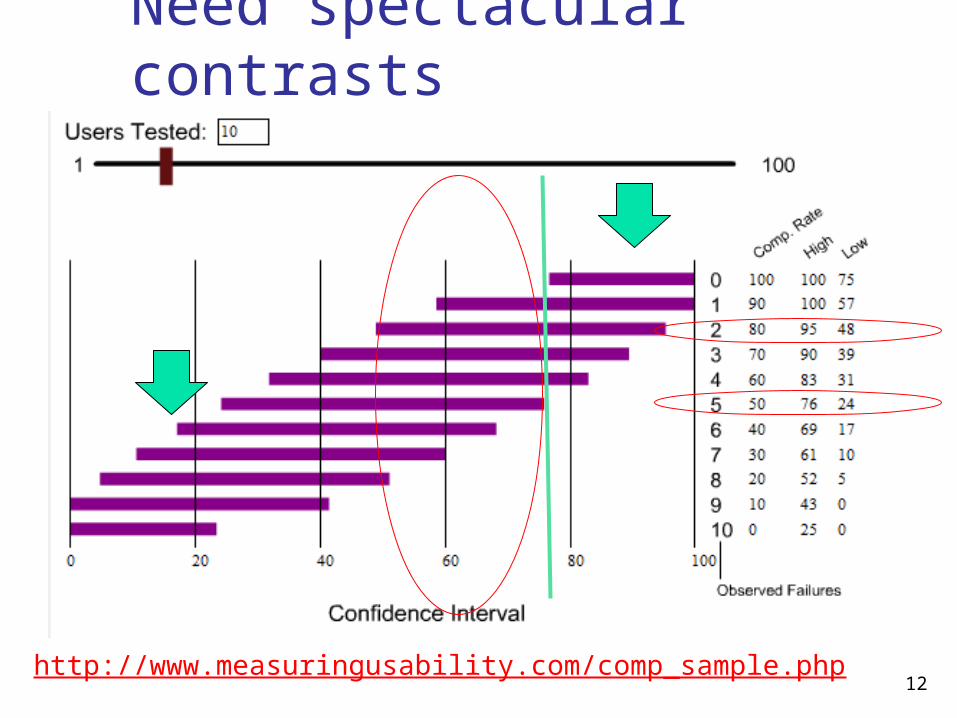
Need spectacular contrasts
http://www.measuringusability.com/comp_sample.php
13
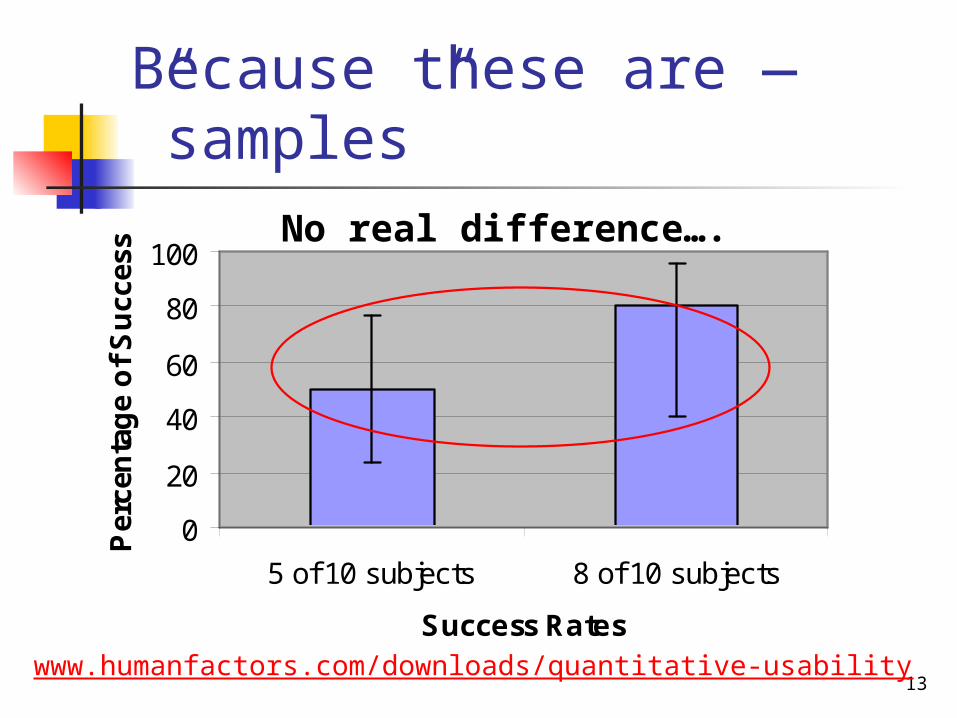
Because these are — ”samples”
www.humanfactors.com/downloads/quantitative-usability
0
20
40
60
80
100
5 of 10 subjects 8 of 10 subjects
Success Rates
Per
cen
tag
e o
f S
ucc
ess No real difference….
14
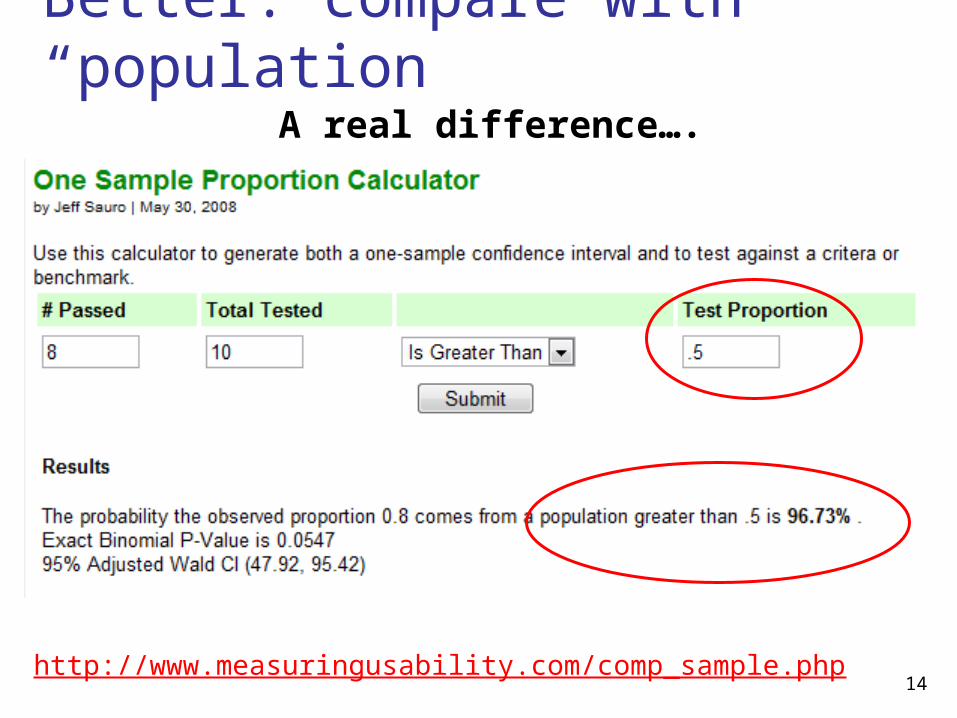
Better: compare with “population”
http://www.measuringusability.com/comp_sample.php
A real difference….
15
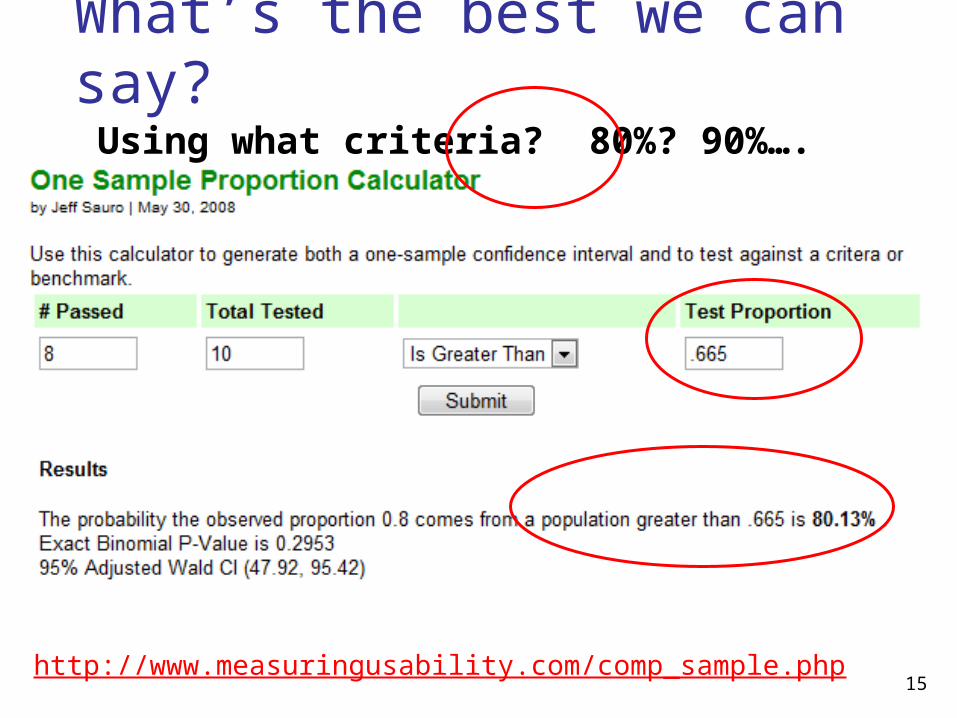
What’s the best we can say?
http://www.measuringusability.com/comp_sample.php
Using what criteria? 80%? 90%….
16
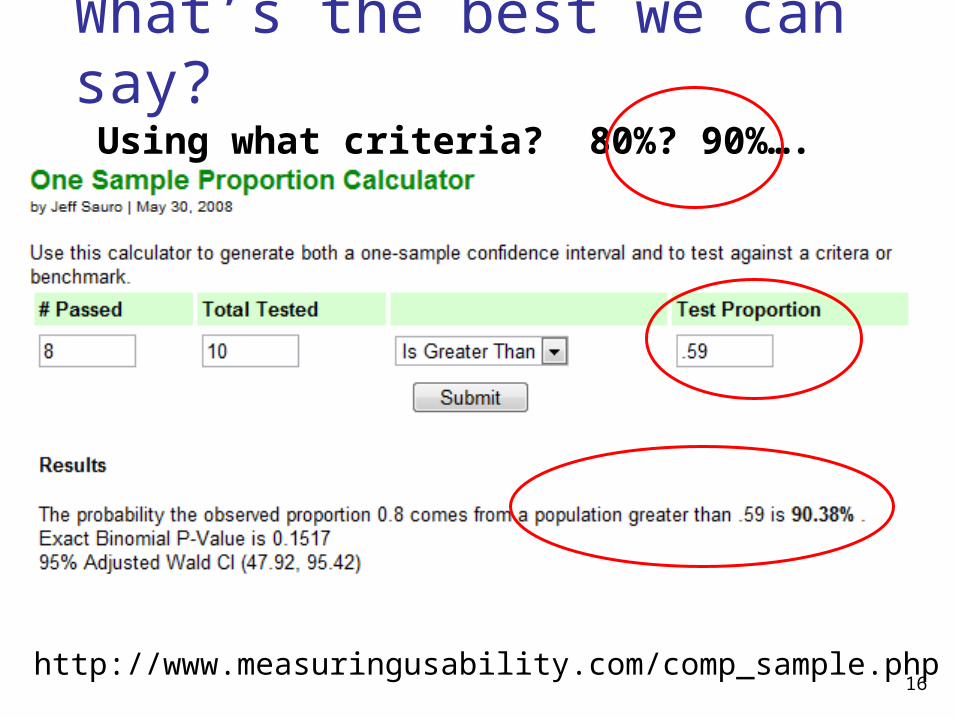
What’s the best we can say?
http://www.measuringusability.com/comp_sample.php
Using what criteria? 80%? 90%….
17
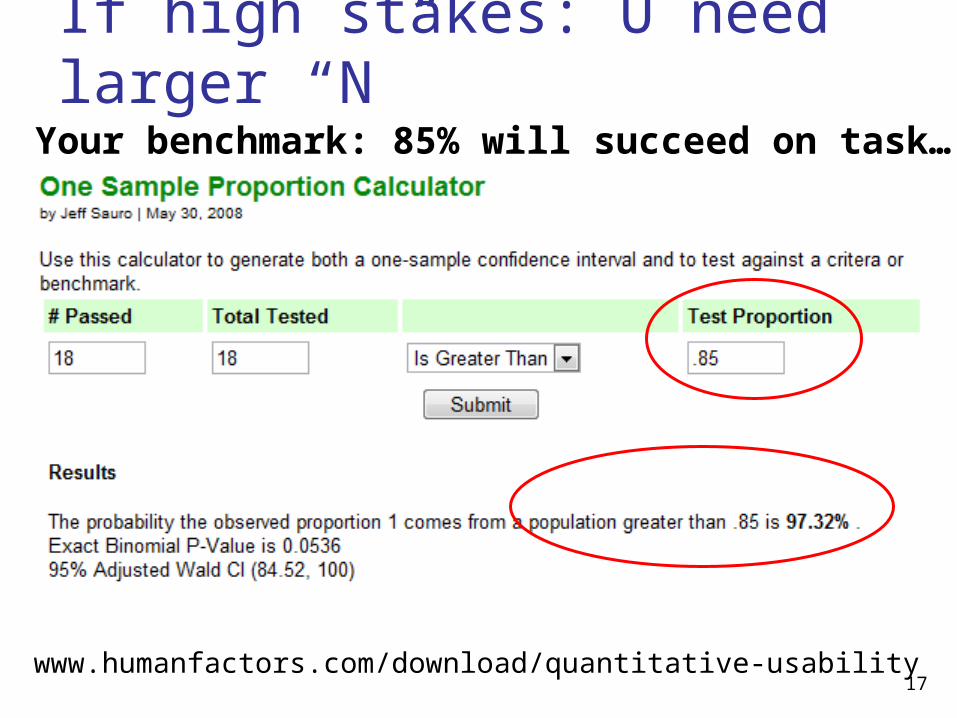
If high stakes: U need larger “N”
www.humanfactors.com/download/quantitative-usability
Your benchmark: 85% will succeed on task…
ROI = “profit only if usable by at least 85% of people who try…”
18
19
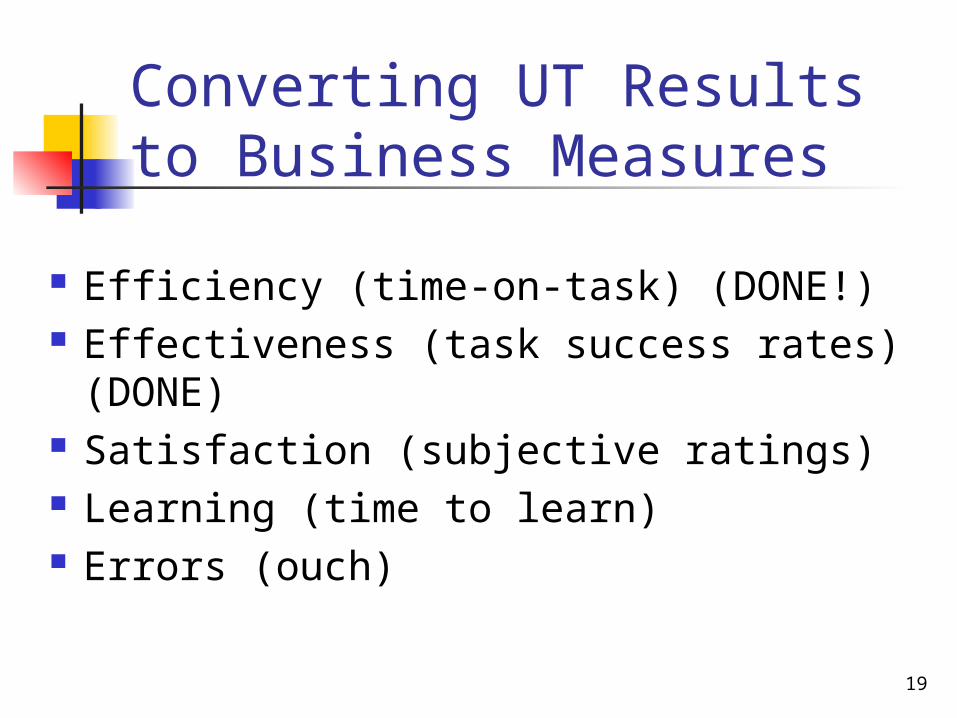
Converting UT Results to Business Measures
Efficiency (time-on-task) (DONE!) Effectiveness (task success rates)
(DONE) Satisfaction (subjective ratings) Learning (time to learn) Errors (ouch)
20
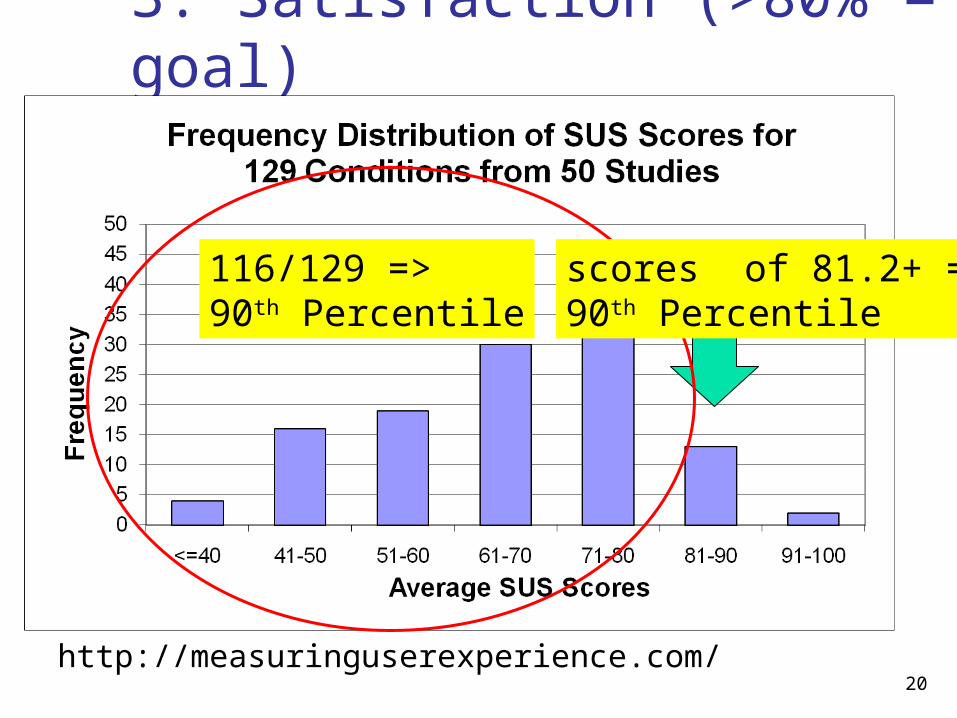
3. Satisfaction (>80% = goal)
http://measuringuserexperience.com/
116/129 => 90th Percentile
scores of 81.2+ = 90th Percentile
21
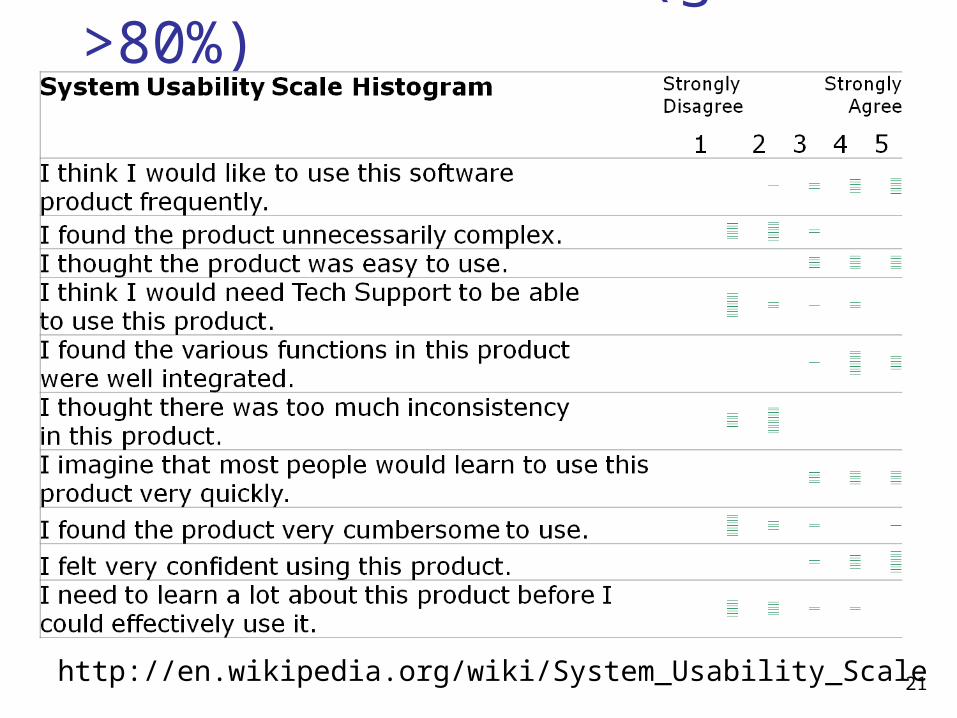
3. Satisfaction (goal: >80%)
http://en.wikipedia.org/wiki/System_Usability_Scale
22
3. Satisfaction (>80% = goal)
http://www.upassoc.org/usability_resources/conference/2004/UPA-2004-TullisStetson.pdf
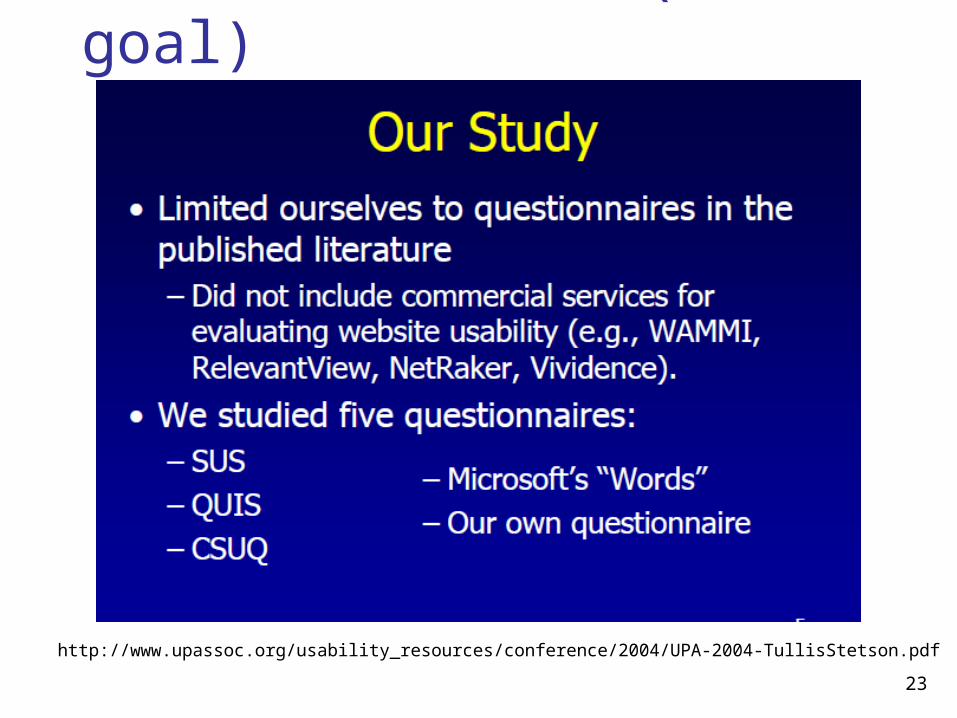
23
3. Satisfaction (>80% = goal)
http://www.upassoc.org/usability_resources/conference/2004/UPA-2004-TullisStetson.pdf
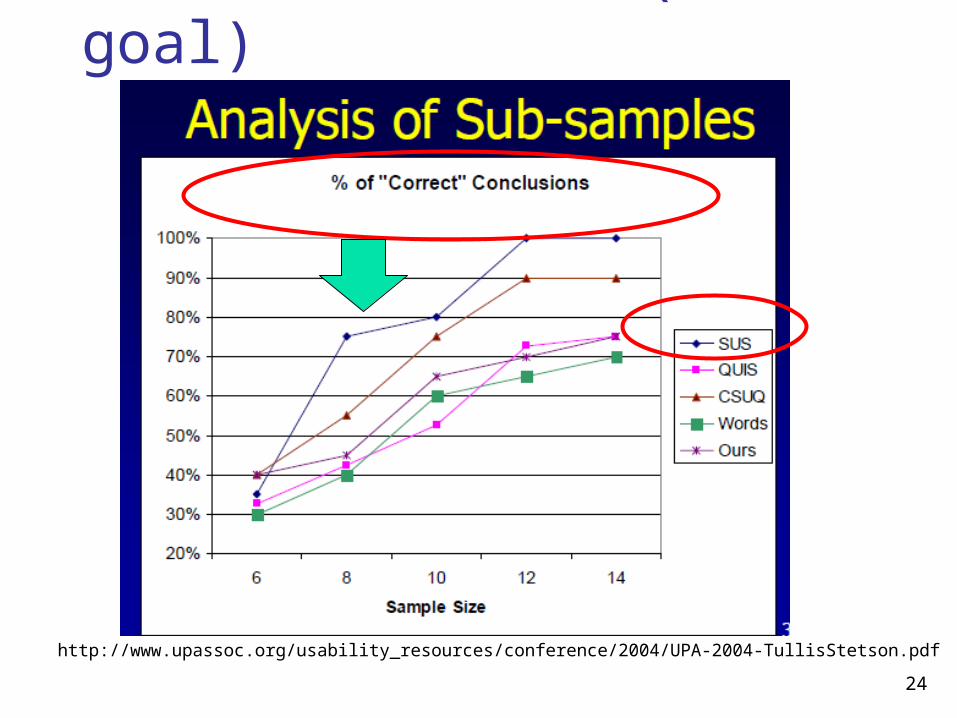
24
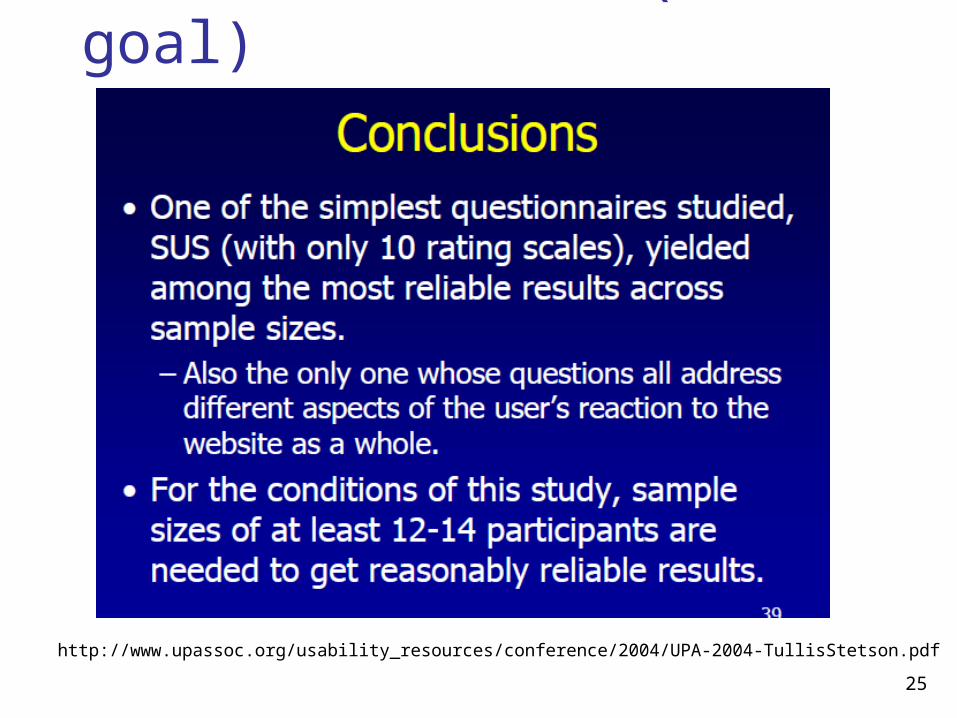
3. Satisfaction (>80% = goal)
http://www.upassoc.org/usability_resources/conference/2004/UPA-2004-TullisStetson.pdf
25
3. Satisfaction (>80% = goal)
http://www.upassoc.org/usability_resources/conference/2004/UPA-2004-TullisStetson.pdf
Final Report: Satisfaction The test of the High Point Quote
application with 18 participants (and 17 results on the SUS) resulted in an average score of 79.7.
This compares very well with the 81.2 score that represents the 90th percentile. We conclude that the application created a very good feeling of “usability” in our test participants.
26
Final Report: Success Rate
All 18 participants successfully completing the main task.
This implies that we can have 97.32% confidence of meeting our target that 85% of people like our participants will succeed.
We can also say that we have a 95% chance that at least 88% can do the task.
27
http://www.measuringusability.com/onep.php
28
Converting UT Results to Business Measures
Efficiency (time-on-task) (DONE!) Effectiveness (task success rates) (DONE) Satisfaction (subjective ratings) (DONE) Learning (time to learn) (See time-on-task) Errors (See time-on-task)
29
UT Results in Business Terms
What percent of visitors can do the task? Our income depends on your prediction! Use estimates like….
95% confidence that 88% of end-users can do it!
60% chance that 85% can do it (uhmmmm) 95% chance that 60% of end-users can do it… ! Goforit…
E-mail your ideas: [email protected]


![Poster [Tadzkirah Ramadhan06 Sept09]](https://img.pdfslide.net/doc/110x75/58a739f01a28ab84308b57ef/poster-tadzkirah-ramadhan06-sept09.jpg)


![Poster [Tadzkirah Ramadhan13 Sept09]](https://img.pdfslide.net/doc/110x75/58ec877a1a28abe4478b4669/poster-tadzkirah-ramadhan13-sept09.jpg)