Embed Size (px)
Citation preview

Getting Started - Version 6.0
®

bpmToolbox 6.0 – Getting Started Guide
www.bestpracticemodelling.com
bpmToolbox 6.0 – Getting Started Guide
This publication is owned and maintained by bpmToolbox Pty Ltd.
This document contains an overview of bpmToolbox 6.0 and the ways in which this tool can be used to develop best practice spreadsheet models. Please check www.bestpracticemodelling.com for any upgrades to bpmToolbox and the related help and training materials. All copyright in this document and any derivation of this document is owned by bpmToolbox Pty Ltd.
First Published in Australia in September 2006. Printed and bound (if hard copy) in Australia. Copyright © bpmToolbox Pty Ltd. All rights reserved.
This publication and many other spreadsheet modelling resources are available at www.bestpracticemodelling.com.
Please use the following details if you have any inquiries about bpmToolbox:
Address: Best Practice Modelling (BPM) Level 8, 330 Collins Street Melbourne, Victoria Australia 3000
Telephone: +613 9244 9800
Email: [email protected]
Website: www.bestpracticemodelling.com
bpmToolbox 6.0 – Getting Started
www.bestpracticemodelling.com Page 1 of 22
Table of Contents Chapter 1. Introduction .......................................................................................... 3
Chapter 2. Overview of bpmToolbox ...................................................................... 5
2.1. Theme ..............................................................................................6
2.2. Structure ...........................................................................................7
2.3. Components ......................................................................................8
2.3.1. Keys....................................................................................8
2.3.2. Time Series..........................................................................8
2.3.3. Checks ................................................................................9
2.4. Content ...........................................................................................11
2.4.1. Formats & Styles ................................................................11
2.4.2. Accessories........................................................................12
2.4.3. Forms................................................................................13
2.4.4. Hyperlinks .........................................................................14
2.4.5. Names...............................................................................15
2.4.6. Schematics, Borders & Charting...........................................16
2.4.7. Quick Tools........................................................................17
2.5. Finalization & Review........................................................................18
2.5.1. Auditing.............................................................................19
2.5.2. Printing & Viewing..............................................................20
Chapter 3. Fundamental First Steps… .................................................................. 21

bpmToolbox 6.0 – Getting Started
Page 2 of 22 www.bestpracticemodelling.com

bpmToolbox 6.0 – Getting Started
www.bestpracticemodelling.com Page 3 of 22
Chapter 1. Introduction
Welcome to bpmToolbox; the world’s most comprehensive best practice modelling spreadsheet modelling tool. By utilising bpmToolbox, you have put the wheels in motion for implementing BPM’s Best Practice Modelling System. This system is comprised of four components:
1) Best Practice Spreadsheet Modelling Standards;
2) bpmToolbox;
3) Training; and
4) Support.
These four components, when implemented together, can rapidly provide the knowledge, tools and support to efficiently develop and use best practice spreadsheet models. In summary, the primary purposes of the Best Practice Modelling System are to:
1) Ensure that models are built in accordance with the Best Practice Spreadsheet Modelling Standards; and
2) Make the model development process as efficient as possible.
The Best Practice Modelling System
Best Practice Modelling
Standards
- Best Practice SpreadsheetModelling Standards
- Govern how to model, not what to model
bpmToolbox
Comprehensive BestPractice Model DevelopmentSoftware
Support
- bpmToolbox Support (telephone, email, website)- Model Delivery Support
Training
- bpmToolbox Training Courses- Best Practice Modelling
Training Courses
bpmToolbox is a suite of universally applicable spreadsheet modelling tools that can be applied to every spreadsheet modelling task, from building a single table of numbers to building a complex multiple-workbook financial and valuation model.

bpmToolbox 6.0 – Getting Started
Page 4 of 22 www.bestpracticemodelling.com
bpmToolbox 6.0 – Getting Started
www.bestpracticemodelling.com Page 5 of 22
Chapter 2. Overview of bpmToolbox
This Getting Started Guide introduces you to the key features of bpmToolbox and explains in broad terms how the program can be used to build spreadsheet models efficiently and effectively in accordance with the Best Practice Spreadsheet Modelling Standards. You’ll learn how to develop fully-customized best practice spreadsheet models that can easily be used by anyone and printed and viewed in a similar way to Microsoft Word® and PowerPoint® documents. Additionally, you’ll learn how to do all this whilst almost subconsciously adhering to the Best Practice Spreadsheet Modelling Standards and your personal presentation preferences (or those of your organisation).
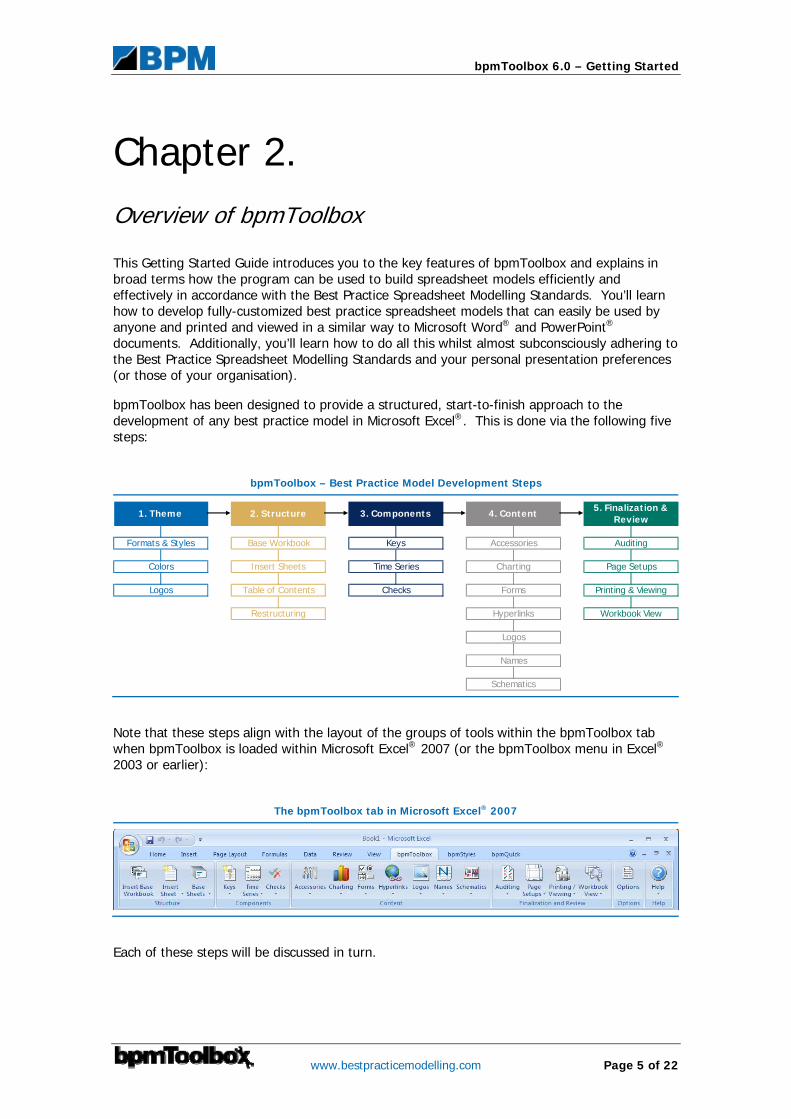
bpmToolbox has been designed to provide a structured, start-to-finish approach to the development of any best practice model in Microsoft Excel®. This is done via the following five steps:
bpmToolbox – Best Practice Model Development Steps
Logos
Names
Schematics
Auditing
Page Setups
Printing & Viewing
Workbook View
Accessories
Charting
Forms
Hyperlinks
Formats & Styles
Colors
Logos
Keys
Time Series
Checks
Base Workbook
Insert Sheets
Table of Contents
Restructuring
5. Finalization & Review
4. Content3. Components2. Structure1. Theme
Note that these steps align with the layout of the groups of tools within the bpmToolbox tab when bpmToolbox is loaded within Microsoft Excel® 2007 (or the bpmToolbox menu in Excel® 2003 or earlier):
The bpmToolbox tab in Microsoft Excel® 2007
Each of these steps will be discussed in turn.
bpmToolbox 6.0 – Getting Started
Page 6 of 22 www.bestpracticemodelling.com
2.1. Theme
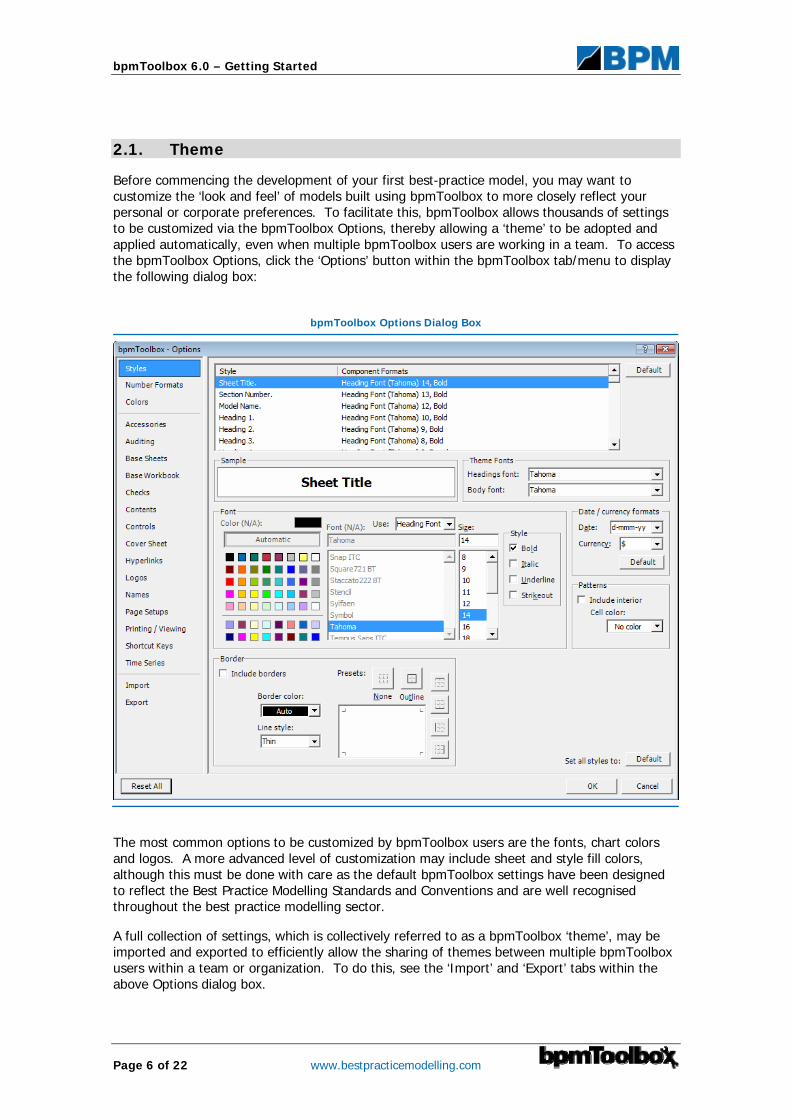
Before commencing the development of your first best-practice model, you may want to customize the ‘look and feel’ of models built using bpmToolbox to more closely reflect your personal or corporate preferences. To facilitate this, bpmToolbox allows thousands of settings to be customized via the bpmToolbox Options, thereby allowing a ‘theme’ to be adopted and applied automatically, even when multiple bpmToolbox users are working in a team. To access the bpmToolbox Options, click the ‘Options’ button within the bpmToolbox tab/menu to display the following dialog box:
bpmToolbox Options Dialog Box
The most common options to be customized by bpmToolbox users are the fonts, chart colors and logos. A more advanced level of customization may include sheet and style fill colors, although this must be done with care as the default bpmToolbox settings have been designed to reflect the Best Practice Modelling Standards and Conventions and are well recognised throughout the best practice modelling sector.
A full collection of settings, which is collectively referred to as a bpmToolbox ‘theme’, may be imported and exported to efficiently allow the sharing of themes between multiple bpmToolbox users within a team or organization. To do this, see the ‘Import’ and ‘Export’ tabs within the above Options dialog box.

bpmToolbox 6.0 – Getting Started
www.bestpracticemodelling.com Page 7 of 22
2.2. Structure
Having deciding upon the theme to be applied by bpmToolbox, it’s time to start building a best practice spreadsheet model. Unlike pure Microsoft Excel®, bpmToolbox provides a foundation for a new best practice model in the Base Workbook. The Base Workbook is a pre-determined collection of sheets (which can be customized in the bpmToolbox Options dialog discussed above) that can be inserted together in order to quickly provide a starting point for developing a best practice model. To insert a Base Workbook, click the ‘Insert Base Workbook’ button on the bpmToolbox tab/menu and follow the prompts. The table of contents for the default bpmToolbox Base Workbook is shown below:
bpmToolbox Default Base Workbook Table of Contents
bpmToolbox Base Sheets Menu
After inserting a Base Workbook, additional sheets can be added via the bpmToolbox ‘Insert Sheet’ menu, with the workbook table of contents being updated using the ‘Update Table of Contents’ tool on the ‘Base Sheets’ menu.
The Base Sheets System is fully automated. Upon insertion, every base sheet will automatically reflect your chosen theme settings and will include all the relevant attributes that ensure that the requirements of the Best Practice Spreadsheet Modelling Standards have been met. The base sheet will then automatically be added to the model’s table of contents (with or without page numbers), thereby ensuring that the model can easily be printed and viewed on screen.
Following the insertion of a base sheet, all you need to do is insert the worksheet content. And that’s where the rest of bpmToolbox becomes important…
bpmToolbox 6.0 – Getting Started
Page 8 of 22 www.bestpracticemodelling.com
2.3. Components
bpmToolbox is a tool focused on ‘how’ to model, not ‘what’ to model. However, the system does allow three common types of components to be quickly inserted into best practice spreadsheet models. These components are all available within the ‘Components’ section of the bpmToolbox tab/menu, and are as follows:
1) Keys: Provide users of the model with an understanding of the best practice formats and styles, sheet naming and range naming systems which have been used when building the model;
2) Time Series: Allows for the analysis of data over multiple time series periods based on time series assumptions including the model start date and periodicity; and
3) Checks: Facilitate the rapid creation, maintenance and use of exhaustive error, sensitivity and alert checks systems within a model.
All of these components are inserted by default when inserting a Base Workbook and can subsequently be removed if necessary. They are each discussed in turn below.
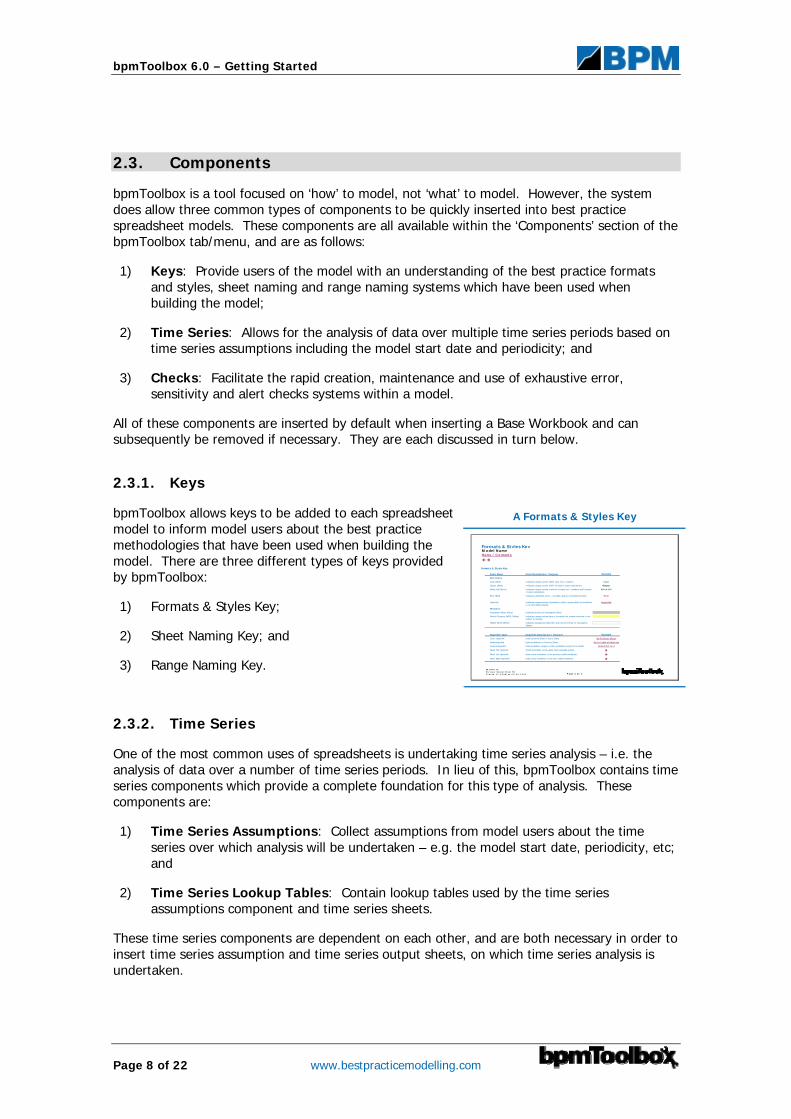
2.3.1. Keys
A Formats & Styles Key bpmToolbox allows keys to be added to each spreadsheet model to inform model users about the best practice methodologies that have been used when building the model. There are three different types of keys provided by bpmToolbox:
1) Formats & Styles Key;
2) Sheet Naming Key; and
3) Range Naming Key.
Formats & Styles KeyM o del N ame
File N a me . x ls
Fo r e c a s t O ut put S he e t FO
P r in t e d: 1 2 . 0 0 A M on 0 1 / 0 1 / 2 0 0 3 P a g e 1 o f 1
Home / C o nt ent s
Formats & Styles Key
Color Name Color Description / Purpose
Font Colors
Fill Colors
Hyperlink Type Hyperlink Description / Purpose
Sheet Right Hyperlink Links active worksheet to the next visible worksheet.
Sheet Top Hyperlink Scrolls worksheet to the upper-most viewable section.
Sheet Left Hyperlink Links active worksheet to the previous visible worksheet.
Home Hyperlink Links worksheets to Contents Sheet. Go To Table of Contents
Custom Hyperlink Links worksheet ranges to other worksheet ranges in the model. Linked Cell Text
Example
Cover Hyperlink Links Contents Sheet to Cover Sheet. Go To Cover Sheet
Hidden White (White) Indicates Assumption Cells when used on the interior of Assumption Sheets.
Assumption Sheet (Grey) Indicates sheet is an Assumption Sheet.
Work in Progress (WIP) (Yellow) Indicates ranges contain data or formulae that remain uncertain or are subject to change.
HyperlinkHyperlink Indicates ranges contain Hyperlinks to other ranges within the workbook or to other linked models.
ErrorError (Red) Indicates calculation errors – normally used as a conditional format.
Output (Black) Indicates ranges contain 100% formulas / output calculations. Output
Mixed CellMixed Cell (Green) Indicates ranges contain a mixture of input text / numbers and formulae / output calculations.
Example
Input (Blue) Indicates ranges contain 100% input text / numbers. Input
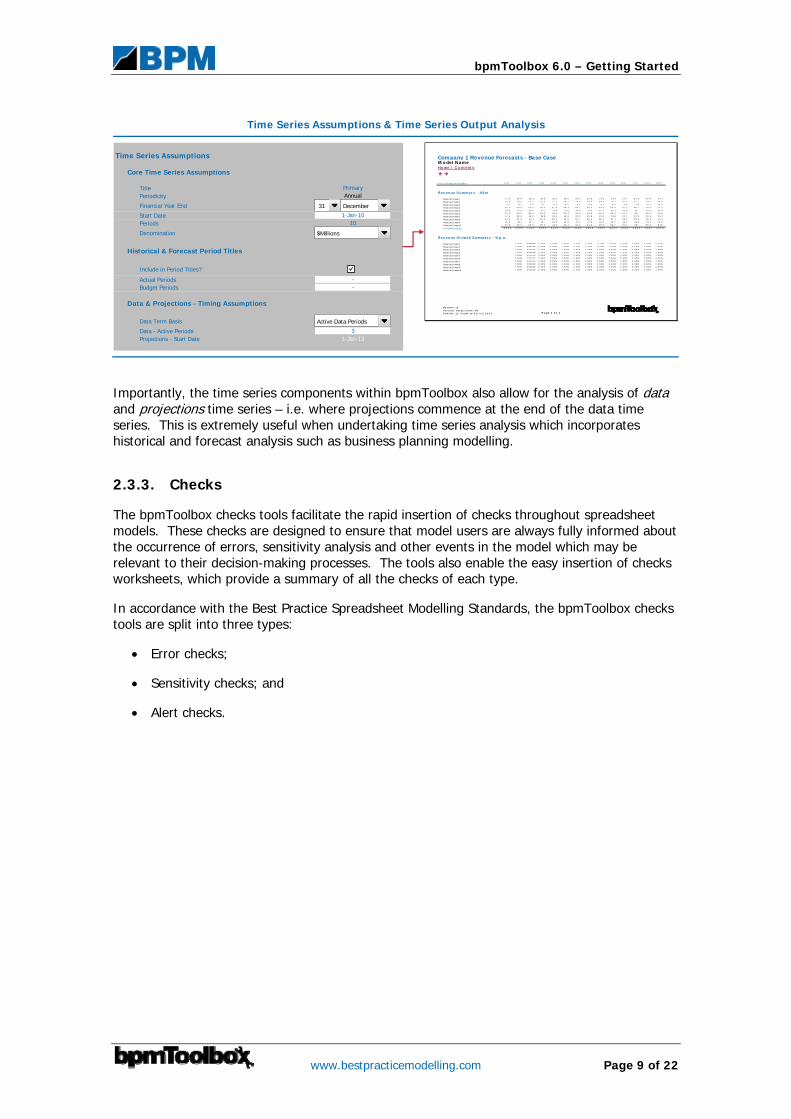
2.3.2. Time Series
One of the most common uses of spreadsheets is undertaking time series analysis – i.e. the analysis of data over a number of time series periods. In lieu of this, bpmToolbox contains time series components which provide a complete foundation for this type of analysis. These components are:
1) Time Series Assumptions: Collect assumptions from model users about the time series over which analysis will be undertaken – e.g. the model start date, periodicity, etc; and
2) Time Series Lookup Tables: Contain lookup tables used by the time series assumptions component and time series sheets.
These time series components are dependent on each other, and are both necessary in order to insert time series assumption and time series output sheets, on which time series analysis is undertaken.
bpmToolbox 6.0 – Getting Started
www.bestpracticemodelling.com Page 9 of 22
Time Series Assumptions & Time Series Output Analysis
Time Series Assumptions
Core Time Series Assumptions
TitlePeriodicity
Financial Year End 31 12
Start DatePeriods
Denomination
Historical & Forecast Period Titles
Include in Period Titles?
Actual PeriodsBudget Periods
Data & Projections - Timing Assumptions
Data Term Basis
Data - Active PeriodsProjections - Start Date 1-Jan-13
1
3
TRUE
--
2
PrimaryAnnual
1-Jan-1010
31 December
$Millions
Active Data Periods
Company 1 Revenue Forecasts - Base CaseM o del N ame
Y e a r E n d in g D e c e mb e r
Re v e nue S umma r y - A$ m
Reven ue St r eam 1
Reven ue St r eam 2
Reven ue St r eam 3
Reven ue St r eam 4
Reven ue St r eam 5
Reven ue St r eam 6
Reven ue St r eam 7
Reven ue St r eam 8
Reven ue St r eam 9
Reven ue St r eam 10
T o t a l R e v e n u e
Re v e nue Gr owt h S umma r y - % p. a .
Reven ue St r eam 1
Reven ue St r eam 2
Reven ue St r eam 3
Reven ue St r eam 4
Reven ue St r eam 5
Reven ue St r eam 6
Reven ue St r eam 7
Reven ue St r eam 8
Reven ue St r eam 9
Reven ue St r eam 10
File N a me . x ls
Fo r e c a s t O ut put S he e t F O
P r in t e d : 1 2 . 0 0 A M on 0 1 / 0 1 / 2 0 0 3 P a g e 1 o f 1
2 0 10 2 0 11 2 0 12 2 0 13 2 0 14
Ho me / C o nt ent s
2 0 2 1 2 0 2 2 2 0 2 32 0 17 2 0 18 2 0 19 2 0 2 02 0 15 2 0 16
# # # # # # # # # # # #
17 . 5
2 5 . 0
7 . 5
5 2 . 5
10 . 0
3 7 . 5
17 . 5
3 0 . 0
15 . 0
3 7 . 5
# # # # # # # #
16 . 1
4 0 . 3
18 . 8
2 6 . 9
8 . 1
5 6 . 4
10 . 8
4 0 . 3
18 . 8
3 2 . 3
18 . 3
2 6 . 2
7 . 9
5 5 . 0
10 . 5
3 9 . 3
18 . 3
3 1. 4
15 . 7
3 9 . 3
18 . 8
2 6 . 9
8 . 1
5 6 . 4
10 . 7
4 0 . 3
18 . 8
3 2 . 2
16 . 1
4 0 . 3
19 . 3
2 7 . 5
8 . 3
5 7 . 8
11. 0
4 1. 3
19 . 3
3 3 . 0
16 . 5
4 1. 3
19 . 8
2 8 . 2
8 . 5
5 9 . 3
11. 3
4 2 . 3
19 . 8
3 3 . 9
16 . 9
4 2 . 3
2 0 . 2
2 8 . 9
8 . 7
6 0 . 7
11. 6
4 3 . 4
2 0 . 2
3 4 . 7
17 . 4
4 3 . 4
2 0 . 8
2 9 . 6
8 . 9
6 2 . 3
11. 9
4 4 . 5
2 0 . 8
3 5 . 6
17 . 8
4 4 . 5
2 1. 3
3 0 . 4
9 . 1
6 3 . 8
12 . 2
4 5 . 6
2 1. 3
3 6 . 5
18 . 2
4 5 . 6
2 1. 8
3 1. 1
9 . 3
6 5 . 4
12 . 5
4 6 . 7
2 1. 8
3 7 . 4
18 . 7
4 6 . 7
2 2 . 3
3 1. 9
9 . 6
6 7 . 0
12 . 8
4 7 . 9
2 2 . 3
3 8 . 3
19 . 2
4 7 . 9
2 2 . 9
3 2 . 7
9 . 8
6 8 . 7
13 . 1
4 9 . 1
2 2 . 9
3 9 . 3
19 . 6
4 9 . 1
2 3 . 5
3 3 . 5
10 . 1
7 0 . 4
13 . 4
5 0 . 3
2 3 . 5
4 0 . 3
2 0 . 1
5 0 . 3
2 4 . 1
3 4 . 4
10 . 3
7 2 . 2
13 . 8
5 1. 6
2 4 . 1
4 1. 3
2 0 . 6
5 1. 6
# # # # # # # # # # # # # # # # # # # # # # # # # # # # # # # # # # # #
2 . 5 0 %
2 . 5 0 %
2 . 5 0 %
2 . 5 0 % 2 . 5 0 % 2 . 5 0 %
2 . 5 0 % 2 . 5 0 % 2 . 5 0 %
2 . 5 0 % 2 . 5 0 %
2 . 5 0 % 2 . 5 0 % 2 . 5 0 %
2 . 5 0 % 2 . 5 0 % 2 . 5 0 %
7 . 5 0 % # # # # # # 2 . 5 0 % 2 . 5 0 %
7 . 5 0 % # # # # # # 2 . 5 0 % 2 . 5 0 % 2 . 5 0 %
2 . 5 0 %
2 . 5 0 %
2 . 5 0 %
2 . 5 0 % 2 . 5 0 % 2 . 5 0 % 7 . 5 0 % # # # # # # 2 . 5 0 % 2 . 5 0 %
2 . 5 0 % 2 . 5 0 % 2 . 5 0 % 7 . 5 0 % # # # # # # 2 . 5 0 % 2 . 5 0 %
2 . 5 0 %
2 . 5 0 % 2 . 5 0 % 2 . 5 0 %
2 . 5 0 % 2 . 5 0 %
2 . 5 0 %
2 . 5 0 % 2 . 5 0 % 2 . 5 0 % 2 . 5 0 % 2 . 5 0 % 2 . 5 0 % 2 . 5 0 % 2 . 5 0 %
2 . 5 0 %
7 . 5 0 % # # # # # # 2 . 5 0 % 2 . 5 0 %
2 . 5 0 %
2 . 5 0 %
2 . 5 0 %
7 . 5 0 % # # # # # # 2 . 5 0 % 2 . 5 0 % 2 . 5 0 % 2 . 5 0 % 2 . 5 0 %
2 . 5 0 %
2 . 5 0 % 2 . 5 0 % 2 . 5 0 % 2 . 5 0 %
2 . 5 0 % 2 . 5 0 %
2 . 5 0 %
2 . 5 0 %7 . 5 0 % # # # # # # 2 . 5 0 % 2 . 5 0 % 2 . 5 0 % 2 . 5 0 % 2 . 5 0 %
2 . 5 0 % 2 . 5 0 % 2 . 5 0 % 7 . 5 0 % # # # # # # 2 . 5 0 % 2 . 5 0 % 2 . 5 0 % 2 . 5 0 % 2 . 5 0 %
2 . 5 0 % 2 . 5 0 %
2 . 5 0 %
2 . 5 0 % 2 . 5 0 % 2 . 5 0 % 2 . 5 0 % 2 . 5 0 % 2 . 5 0 % 2 . 5 0 % 2 . 5 0 %
2 . 5 0 %
7 . 5 0 % # # # # # # 2 . 5 0 % 2 . 5 0 %
2 . 5 0 %
2 . 5 0 %
7 . 5 0 % # # # # # # 2 . 5 0 % 2 . 5 0 % 2 . 5 0 % 2 . 5 0 % 2 . 5 0 % 2 . 5 0 % 2 . 5 0 % 2 . 5 0 % 2 . 5 0 %2 . 5 0 % 2 . 5 0 %
Importantly, the time series components within bpmToolbox also allow for the analysis of data and projections time series – i.e. where projections commence at the end of the data time series. This is extremely useful when undertaking time series analysis which incorporates historical and forecast analysis such as business planning modelling.
2.3.3. Checks
The bpmToolbox checks tools facilitate the rapid insertion of checks throughout spreadsheet models. These checks are designed to ensure that model users are always fully informed about the occurrence of errors, sensitivity analysis and other events in the model which may be relevant to their decision-making processes. The tools also enable the easy insertion of checks worksheets, which provide a summary of all the checks of each type.
In accordance with the Best Practice Spreadsheet Modelling Standards, the bpmToolbox checks tools are split into three types:
Error checks;
Sensitivity checks; and
Alert checks.
bpmToolbox 6.0 – Getting Started
Page 10 of 22 www.bestpracticemodelling.com
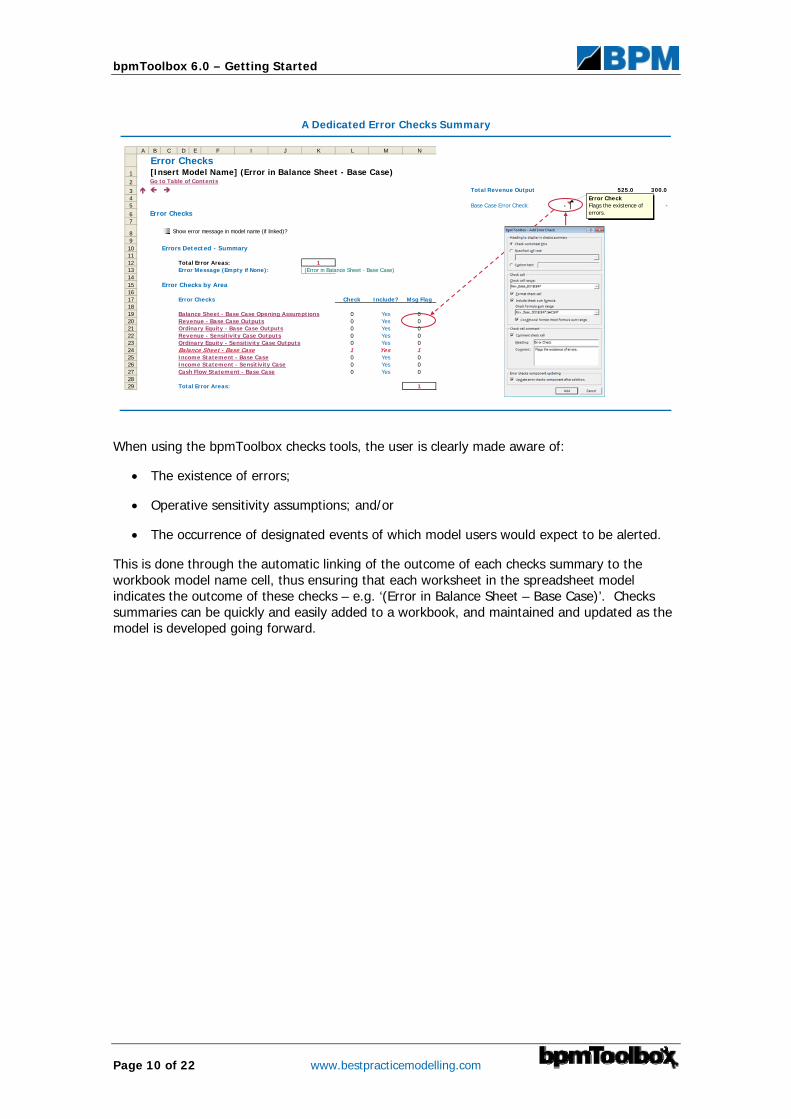
A Dedicated Error Checks Summary
A B C D E F I J K L M N
Error Checks1 [Insert Model Name] (Error in Balance Sheet - Base Case)23 Total Revenue Output 525.0 300.045 Base Case Error Check: - - - -
6 Error Checks7
8 TRUE
910 Errors Detected - Summary1112 Total Error Areas: 113 Error Message (Empty if None): (Error in Balance Sheet - Base Case)1415 Error Checks by Area1617 Error Checks Check Include? Msg Flag1819 Balance Sheet - Base Case Opening Assumptions 0 Yes 020 Revenue - Base Case Outputs 0 Yes 021 Ordinary Equity - Base Case Outputs 0 Yes 022 Revenue - Sensitivity Case Outputs 0 Yes 023 Ordinary Equity - Sensitivity Case Outputs 0 Yes 024 Balance Sheet - Base Case 1 Yes 125 Income Statement - Base Case 0 Yes 026 Income Statement - Sensitivity Case 0 Yes 027 Cash Flow Statement - Base Case 0 Yes 02829 Total Error Areas: 1
Go to Table of Contents
Show error message in model name (if linked)?
Error CheckFlags the existence of errors.
When using the bpmToolbox checks tools, the user is clearly made aware of:
The existence of errors;
Operative sensitivity assumptions; and/or
The occurrence of designated events of which model users would expect to be alerted.
This is done through the automatic linking of the outcome of each checks summary to the workbook model name cell, thus ensuring that each worksheet in the spreadsheet model indicates the outcome of these checks – e.g. ‘(Error in Balance Sheet – Base Case)’. Checks summaries can be quickly and easily added to a workbook, and maintained and updated as the model is developed going forward.
bpmToolbox 6.0 – Getting Started
www.bestpracticemodelling.com Page 11 of 22
2.4. Content
Once you have chosen your bpmToolbox theme, inserted a Base Workbook and ascertained the components to be included within your best practice model, the model development process turns to the content of the model. Model content may include headings, numbers, assumptions, controls, graphs, hyperlinks, formulas, range names, logos and any other content required to undertake the desired analysis. bpmToolbox contains a wide range of tools designed to dramatically assist in the development of this content. An overview of these tools has been provided below.
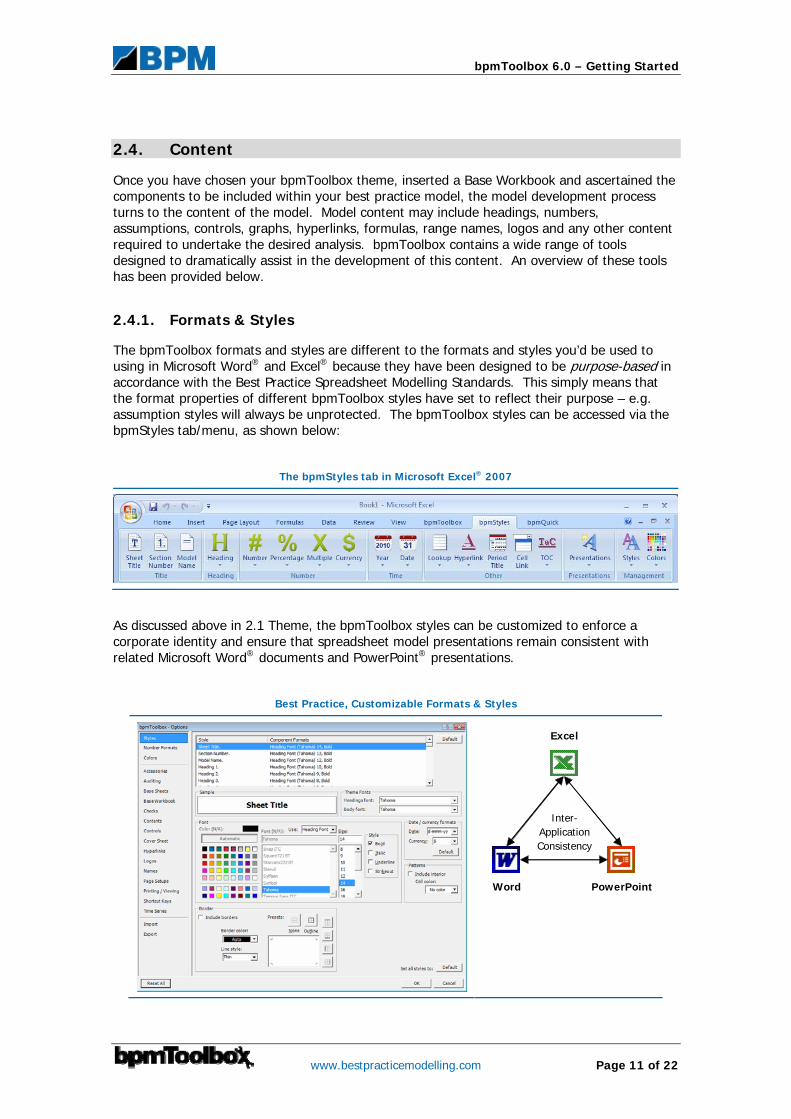
2.4.1. Formats & Styles
The bpmToolbox formats and styles are different to the formats and styles you’d be used to using in Microsoft Word® and Excel® because they have been designed to be purpose-based in accordance with the Best Practice Spreadsheet Modelling Standards. This simply means that the format properties of different bpmToolbox styles have set to reflect their purpose – e.g. assumption styles will always be unprotected. The bpmToolbox styles can be accessed via the bpmStyles tab/menu, as shown below:
The bpmStyles tab in Microsoft Excel® 2007
As discussed above in 2.1 Theme, the bpmToolbox styles can be customized to enforce a corporate identity and ensure that spreadsheet model presentations remain consistent with related Microsoft Word® documents and PowerPoint® presentations.
Best Practice, Customizable Formats & Styles
Excel
Word PowerPoint
Inter-ApplicationConsistency
bpmToolbox 6.0 – Getting Started
Page 12 of 22 www.bestpracticemodelling.com
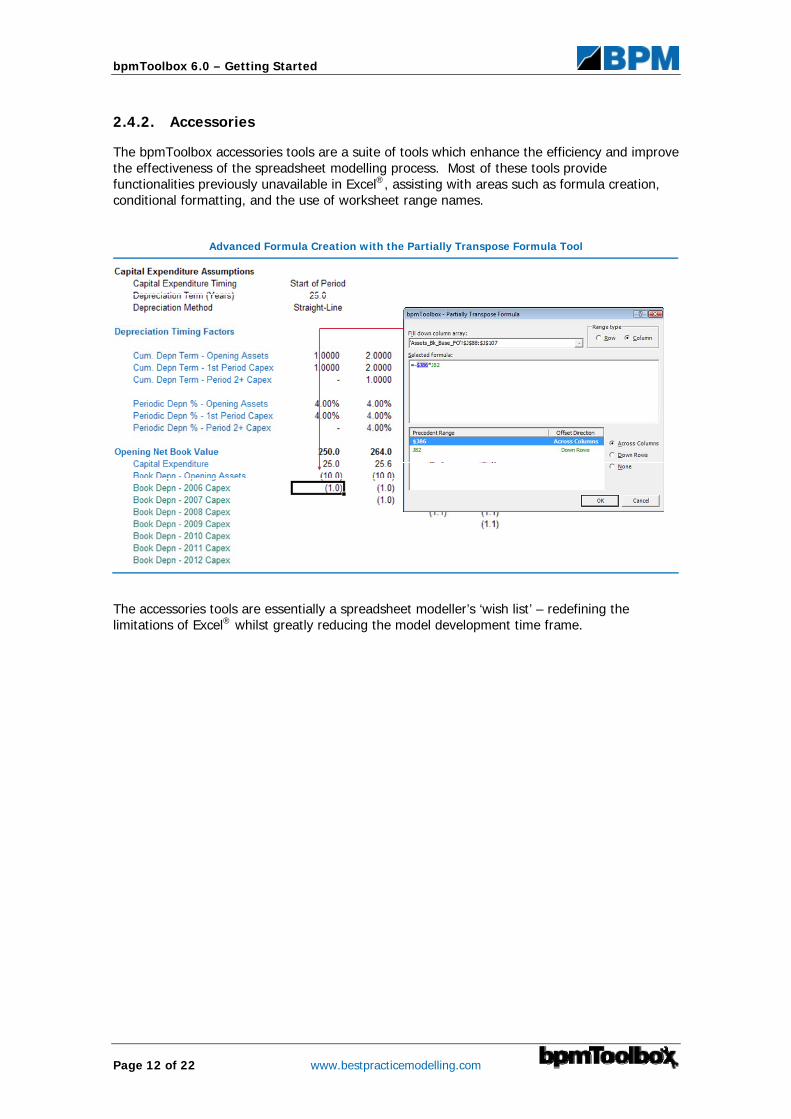
2.4.2. Accessories
The bpmToolbox accessories tools are a suite of tools which enhance the efficiency and improve the effectiveness of the spreadsheet modelling process. Most of these tools provide functionalities previously unavailable in Excel®, assisting with areas such as formula creation, conditional formatting, and the use of worksheet range names.
Advanced Formula Creation with the Partially Transpose Formula Tool
The accessories tools are essentially a spreadsheet modeller’s ‘wish list’ – redefining the limitations of Excel® whilst greatly reducing the model development time frame.

bpmToolbox 6.0 – Getting Started
www.bestpracticemodelling.com Page 13 of 22
2.4.3. Forms
bpmToolbox makes the use of controls (referred to with Excel® as ‘forms’) easy and ensures that your assumption entry interfaces always meet the requirements of the Best Practice Spreadsheet Modelling Standards and the interface control concept. Multiple controls can be inserted, sized to specified ranges and linked to range-named cell links, all via a single user-friendly dialog box.
Inserting Multiple Controls with Named Cell Links
A B C D E F G H I J K L M N O
1 FA Revenue Assumptions2 Model Name3
4 56
7 Revenue Assumptions8 Does Category9 Revenue Categories Unit Price ($) Total ($) Move with Inflation?
10 1 $1.25 - TRUE
11 2 $1.50 - FALSE
12 3 $1.75 - TRUE
13 4 $3.25 - TRUE
14 5 - $7,500.0 FALSE
1516
Revenue 5 Name
Revenue DriverBase Year
Revenue 1 Name
Revenue 2 Name
Revenue 3 Name
Revenue 4 Name
Home / Contents
Product A Volumes
Product B Volumes
Product C Volumes
Total Volumes
None - Fixed
Building fully controllable, user-friendly assumption entry interfaces has never been easier.
bpmToolbox 6.0 – Getting Started
Page 14 of 22 www.bestpracticemodelling.com
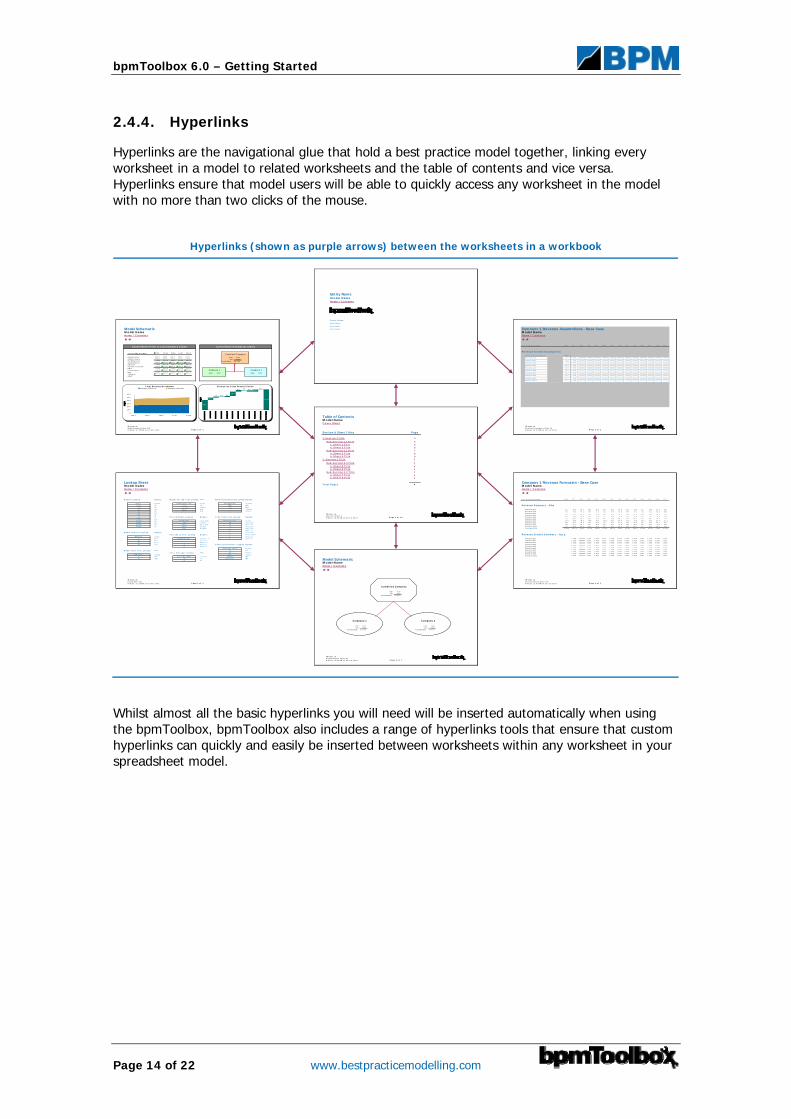
2.4.4. Hyperlinks
Hyperlinks are the navigational glue that hold a best practice model together, linking every worksheet in a model to related worksheets and the table of contents and vice versa. Hyperlinks ensure that model users will be able to quickly access any worksheet in the model with no more than two clicks of the mouse.
Hyperlinks (shown as purple arrows) between the worksheets in a workbook
Entity NameM o del N ameHo me / Co nt ent s
C o v e r N o t e s :
Cover Note 1
Cover Note 2
Cover Note 3 Company 1 Revenue Assumptions - Base CaseM o del N ame
Y e a r E n din g D e c e mb er
R e v e nue S t r ea m A ssumpt i ons
R e v en u e S t r e a m N a me s :
# ##
# ##
# ##
# ##
# ##
# ##
# ##
# ##
# ##
# ##
F ile N a me . x ls
F o r ec a s t A s s u mpt io n s S h e e t F A
P r in t e d : 1 2 . 0 0 A M o n 0 1 / 0 1 / 2 0 0 3
Ho me / C o ntent s
# # # # # # # # # # # # # ## # # # # # # ## #7 . 5 7 . 5 0 % # ## # # # # # # ## #
# # # # ## # # # # # # # # # # # #
# # # # ## # # # # # # # # # # # #
7 . 5 0 % # ## # # # # # # ## # # # # ## ## # # # # # # # # # # # # ## # # #
# # # ## # # # # # # #
# # # # # # # # # # # # # ## # # #
# # # # # # # ## # # # # ## # # #
2 0 11 2 0 12 2 0 13 2 014
# # # # # #7 . 5 0 % # ## # # # # # # ## # # # # # # #
2 0 15 2 0 16 2 0 17
# # # # ## # # # # # # # # # # # #
2 0 0 4 2 0 0 5 2 00 6 2 0 0 7 2 0 0 8 2 0 0 9 2 010
7 . 5 0 % # ## # # # # # # ## #
# ## # # ## # # # # # # # # # # #
# # # # # # # # # # # # # ## # # # # # # ## # # # # # # # # # # # # # # ## # # # # # # # ## # # # # # # # # # # # #
10 . 0 7 . 5 0 % # ## # # # # # # ## # # # # # # # # # # # # # # ## # # # # # # ## # # # # # # # # # # # # # # ## # # # # # # # ## # # # # # # # # # # # #
3 7 . 5 7 . 5 0 % # ## # # # # # # ## # # # # # # # # # # # # # # ## # # # # # # ## # # # # # # # # # # # # # # ## # # # # # # # ## # # # # # # # # # # # #
17 . 5 7 . 5 0 % # ## # # # # # # ## # # # # # # # # # # # # # # ## # # # # # # ## # # # # # # # # # # # # # # ## # # # # # # # ## # # # # # # # # # # # #
3 0 . 0 7 . 5 0 % # ## # # # # # # ## # # # # # # # # # # # # # # ## # # # # # # ## # # # # # # # # # # # # # # ## # # # # # # # ## # # # # # # # # # # # #
15 . 0 7 . 5 0 % # ## # # # # # # ## # # # # # # # # # # # # # # ## # # # # # # ## # # # # # # # # # # # # # # ## # # # # # # # ## # # # # # # # # # # # #
3 7 . 5 7 . 5 0 % # ## # # # # # # ## # # # # # # # # # # # # # # ## # # # # # # ## # # # # # # # # # # # # # # ## # # # # # # # ## # # # # # # # # # # # #
Revenue St r eam 7
Revenue St r eam 8
Revenue St r eam 1
Revenue St r eam 2
Revenue St r eam 3
Revenue St r eam 4
B a s e
Revenue St r eam 5
Revenue St r eam 6
5 2 . 5
17 . 5
2 5 . 0
Revenue St r eam 9
Revenue St r eam 10
P a g e 1 o f 1
Model SchematicM o del N ame
Y e a r E n d in g D e ce mb e r
Compan y 1 Reven ue Equit y Compan y 2 Reven ue Debt T o t a l R e v e n u e T o t a l C a p it a l Oper at in g Expen ses
E B I T D A
Depr eciat ion & Amor t isat ion
E B I T
I n t er est Expen se
E B T
T ax Expen se
N P A T
F ile N a me . x ls
M o d e l S c h e ma t ic S h e e t M S
P r in t e d : 1 2 . 0 0 A M o n 0 1 / 0 1 / 2 0 0 3
Ho me / C o ntent s
2 0 0 8
# # # # #
C o mp a n y 1
C onsol i da t i on D i a gr a m ( A $ m)
C o mb i n e d C o mp a n y
$ 5 0 0
$ 5 0 0
C onsol i da t e P r of i t & Loss S umma r y ( A $m)
Equit y: $ 5 0 0( 4 5 . 3 )
C o mp a n y 1
Equit y: $ 5 0 0# # # #
( 3 6 . 0 ) ( 3 9 . 2 ) ( 3 6 . 9 ) ( 3 8 . 7 )
2 0 0 4 2 0 0 5 2 0 0 6 2 0 0 7
# # # #
2 5 0 . 0
2 0 0 . 0
# # # #
( 2 15 . 0 )
# # # #
( 7 5 . 0 )
# # # #
( 4 0 . 0 )
# # # #
2 6 8 . 8
2 0 5 . 0
# # # #
# # # # # #
# # # #
( 7 7 . 0 )
# # # #
( 4 0 . 5 )
# # # #
# # # #
2 62 . 0
2 10 . 1
# # # #
( 2 29 . 1)
# # # #
( 7 9 . 0 )
# # # #
( 41. 0 )
# # # #
# # # #
2 6 8 . 6
2 15 . 4
# # # #
# # # # # #
# # # #
( 8 1. 0 )
# # # #
( 4 1. 5 )
# # # #
# # # #
( 8 3 . 0 )
# # # #
( 4 2 . 0 )
2 7 5 . 3
2 3 6 . 9
# # # #
( 2 3 6 . 1)
# # # ## # # #
P a g e 1 o f 1
E nt er pr i se V al ue Reconci l i at i on
5 0 0
1 0 0
2 2 0
1 0 0
1 , 0 0 0
1 06 02 0
5 02 55 0
7 5
T ot al Revenue Br eakdown
0
1 0 0
2 0 0
3 0 0
4 0 0
5 0 0
6 0 0
2 0 0 4 2 0 0 5 2 0 0 6 2 0 0 7 2 0 0 8
Company 1 Revenue Company 2 Revenue
Lookup SheetM o del N ame
M o n t h s L o o k u p N a me s : M o d e l P e r i o d T y p e L o o k u p Names: M o d e l D e n o mi n a t i o n L o o k u p N a me s :
LU_M t hs LU_Per s LU_Den om
Jan An n Billion s
Feb Semi_An n M illion s
M ar Qt r ly T housan ds
Apr M t hly Cur r en cy
M ay
Jun
Jul P e r i o d N a me s L o o k u p N a me s : T i me C o n s t a n t s L o o k u p N a me s :Aug
Sep LU_Per _Names LU_M t hs
Oct Yr _Name Secs_I n _M in
Nov Half _Yr _Name M in s_I n _Hr
Dec Qt r _Name Hr s_I n _Day
M t h_Name Days_I n _Wk
Wks_I n _Yr
M o d e l Q u a r t e r L o o k u p N a me s : M t hs_I n _Qt r
P e r i o d s i n Y e a r L o o k u p N a me s : M t hs_I n _Half _Yr
LU_Qt r s M t hs_I n _Yr
Qt r _1 LU_Per s_I n _Yr Qt r s_I n _Yr
Qt r _2 Yr s_I n_Yr
Qt r _3 Halves_I n _Yr
Qt r _4 Qt r s_I n _Yr C o n v e r s i o n F a c t o r L o o k u p N a me s :M t hs_I n _Yr
LU_M t hs
M o d e l H a l f Y e a r L o o k u p Names: T en
Y e s / N o I n p u t L o o k u p Names: Hun dr ed
LU_Halves T housan d
Half _1 LU_Yes_No M illion
Half _2 Yes Billion
No
F ile N a me . x ls
L o o ku p S h e e t B L
P r in t e d : 1 2 . 0 0 A M o n 0 1 / 0 1 / 2 0 0 3
Ho me / C o ntent s
$
6 0
6 0
T ime C o n s t a n t
C on v e r s io n F ac t o r
4
7
2 4
5 2
3
6
12
Apr il
M ay
Jun e
July
M o n t h
Jan uar y
Febr uar y
M ar ch
August
Sept ember
Oct ober
November
December
M o d e l P e r io d T y p e
An n ual
Semi- An n ual
Quar t er ly
Mon t hly
P e r iod N a me
Year
Half Year
Quar t er
H2
Q u a r t e r
Q1
Q2
Q3
Q4
H a lf Y e a r
H1
Mon t h
Y e s / N o I n p u t
Yes
No
P e r io d s in Y e a r
1
2
4
12
D e n o min a t io n
$ Billion s
$ M illion s
$ '0 0 0
10 0 0 0 0 0 0 0 0
10
10 0
10 0 0
10 0 0 0 0 0
P a g e 1 o f 1
Table of ContentsM o del N ame
Sect ion & Sheet T it les Pag e
3
4
567
89#
#
###
##
Tot a l P a ge s #
F ile N ame . x ls
C o n t en t s S h e e t C
P r in t ed : 1 2 . 0 0 A M o n 0 1 / 0 1 / 2 0 0 3
1. S e ct i on 1 Ti t l e
S ub- S e c t i on 2 . 1 Ti t le
S ub- S e c t i on 1. 1 Ti t l e
S ub- S e c t i on 2 . 2 Ti t le
2 . S e ct i on 2 Ti t l e
a . S he e t 3 Ti t l ea . S he e t 4 Ti t l e
a . S he e t 1 Ti t l ea . S he e t 2 Ti t l e
C o ver Sheet
P a g e 2 o f 1 6
S ub- S e c t i on 1. 1 Ti t l e
a . S he e t 8 Ti t l e
a . S he e t 5 Ti t l ea . S he e t 6 Ti t l e
a . S he e t 7 Ti t l e
Model SchematicM o del N ame
Equit y
Debt
T o t a l C a p it a l
Equit y Equit y
Debt Debt
T o t a l C a p it a l T o t a l C a p it a l
F ile N ame . x ls
M o d e l S c h e ma t ic S he e t M S
P r in t ed : 1 2 . 0 0 A M o n 0 1 / 0 1 / 2 0 0 3
Ho me / C o nt ent s
P a g e 1 o f 1
$ 5 0 0
$ 5 0 0
# # # # #
C ompa ny 1
$2 5 0
$2 5 0
C ompany 2
C ombi ne d Compa ny
# # # # #
$ 2 5 0
$ 2 5 0
# # # # #
Company 1 Revenue Forecasts - Base CaseM o del N ame
Y e a r E n din g D e c e mb er
R e v e nue S umma r y - A$ m
Revenue St r eam 1
Revenue St r eam 2
Revenue St r eam 3
Revenue St r eam 4
Revenue St r eam 5
Revenue St r eam 6
Revenue St r eam 7
Revenue St r eam 8
Revenue St r eam 9
Revenue St r eam 10
T o t a l R e v e n u e
R e v e nue Gr owt h S umma r y - % p. a .
Revenue St r eam 1
Revenue St r eam 2
Revenue St r eam 3
Revenue St r eam 4
Revenue St r eam 5
Revenue St r eam 6
Revenue St r eam 7
Revenue St r eam 8
Revenue St r eam 9
Revenue St r eam 10
F ile N a me . x ls
F o r ec a s t O u t p u t S h e e t F O
P r in t e d : 1 2 . 0 0 A M o n 0 1 / 0 1 / 2 0 0 3 P a g e 1 o f 1
2 0 0 4 2 0 0 5 2 00 6 2 0 0 7 2 0 0 8
Ho me / C o ntent s
2 0 15 2 0 16 2 0 172 0 11 2 0 12 2 0 13 2 0142 0 0 9 2 010
# # # # # # # # # # # #
17 . 5
2 5 . 0
7 . 5
5 2 . 5
10 . 0
3 7 . 5
17 . 5
3 0 . 0
15 . 0
3 7 . 5
# # # # # # # #
16 . 1
4 0 . 3
18 . 8
2 6 . 9
8 . 1
5 6 . 4
10 . 8
4 0 . 3
18 . 8
3 2 . 3
18 . 3
2 6 . 2
7 . 9
5 5 . 0
10 . 5
3 9 . 3
18 . 3
3 1. 4
15 . 7
3 9 . 3
18 . 8
2 6 . 9
8 . 1
5 6 . 4
10 . 7
4 0 . 3
18 . 8
3 2 . 2
16 . 1
4 0 . 3
19 . 3
2 7 . 5
8 . 3
5 7 . 8
11. 0
4 1. 3
19 . 3
3 3 . 0
16 . 5
4 1. 3
19 . 8
2 8 . 2
8 . 5
5 9 . 3
11. 3
4 2 . 3
19 . 8
3 3 . 9
16 . 9
4 2 . 3
20 . 2
28 . 9
8 . 7
60 . 7
11. 6
43 . 4
20 . 2
34 . 7
17 . 4
43 . 4
2 0 . 8
2 9 . 6
8 . 9
6 2 . 3
11. 9
4 4 . 5
2 0 . 8
3 5 . 6
17 . 8
4 4 . 5
2 1. 3
3 0 . 4
9 . 1
6 3 . 8
12 . 2
4 5 . 6
2 1. 3
3 6 . 5
18 . 2
4 5 . 6
2 1. 8
3 1. 1
9 . 3
6 5 . 4
12 . 5
4 6 . 7
2 1. 8
3 7 . 4
18 . 7
4 6 . 7
22 . 3
31. 9
9 . 6
67 . 0
12 . 8
47 . 9
22 . 3
38 . 3
19 . 2
47 . 9
2 2 . 9
3 2 . 7
9 . 8
6 8 . 7
13 . 1
4 9 . 1
2 2 . 9
3 9 . 3
19 . 6
4 9 . 1
2 3 . 5
3 3 . 5
10 . 1
7 0 . 4
13 . 4
5 0 . 3
2 3 . 5
4 0 . 3
2 0 . 1
5 0 . 3
2 4 . 1
3 4 . 4
10 . 3
7 2 . 2
13 . 8
5 1. 6
2 4 . 1
4 1. 3
2 0 . 6
5 1. 6
# # # # # # # # # # # # # # # # # # # # # # # # # # # # # # # # # # # #
2 . 5 0 %
2 . 5 0 %
2 . 5 0 %
2 . 5 0 % 2 . 50 % 2 . 5 0 %
2 . 5 0 % 2 . 50 % 2 . 5 0 %
2 . 5 0 %2 . 5 0 %
2 . 50 % 2 . 5 0 % 2 . 5 0 %
2 . 50 % 2 . 5 0 % 2 . 5 0 %
7 . 5 0 % # ## # # # 2 . 5 0 % 2 . 5 0 %
7 . 5 0 % # ## # # # 2 . 5 0 % 2 . 5 0 % 2 . 5 0 %
2 . 5 0 %
2 . 5 0 %
2 . 5 0 %
2 . 50 % 2 . 5 0 % 2 . 5 0 % 7 . 5 0 % # ## # # # 2 . 5 0 % 2 . 5 0 %
2 . 50 % 2 . 5 0 % 2 . 5 0 % 7 . 5 0 % # ## # # # 2 . 5 0 % 2 . 5 0 %
2 . 5 0 %
2 . 5 0 % 2 . 50 % 2 . 5 0 %
2 . 50 % 2 . 5 0 %
2 . 5 0 %
2 . 5 0 % 2 . 50 % 2 . 5 0 % 2 . 5 0 % 2 . 50 % 2 . 5 0 % 2 . 5 0 %2 . 5 0 %
2 . 5 0 %
7 . 5 0 % # ## # # # 2 . 5 0 % 2 . 5 0 %
2 . 5 0 %
2 . 5 0 %
2 . 5 0 %
7 . 5 0 % # ## # # # 2 . 5 0 % 2 . 5 0 % 2 . 5 0 % 2 . 50 % 2 . 5 0 %
2 . 5 0 %
2 . 5 0 % 2 . 50 % 2 . 5 0 % 2 . 5 0 %
2 . 5 0 % 2 . 5 0 %
2 . 5 0 %
2 . 5 0 %7 . 5 0 % # ## # # # 2 . 5 0 % 2 . 5 0 % 2 . 5 0 % 2 . 50 % 2 . 5 0 %
2 . 50 % 2 . 5 0 % 2 . 5 0 % 7 . 5 0 % # ## # # # 2 . 5 0 % 2 . 5 0 % 2 . 5 0 % 2 . 50 % 2 . 5 0 %
2 . 50 % 2 . 5 0 %
2 . 5 0 %
2 . 5 0 % 2 . 50 % 2 . 5 0 % 2 . 5 0 % 2 . 50 % 2 . 5 0 % 2 . 5 0 %2 . 5 0 %
2 . 5 0 %
7 . 5 0 % # ## # # # 2 . 5 0 % 2 . 5 0 %
2 . 5 0 %
2 . 5 0 %
7 . 5 0 % # ## # # # 2 . 5 0 % 2 . 5 0 % 2 . 5 0 % 2 . 50 % 2 . 5 0 % 2 . 5 0 % 2 . 5 0 % 2 . 50 % 2 . 5 0 %2 . 5 0 % 2 . 5 0 %
Whilst almost all the basic hyperlinks you will need will be inserted automatically when using the bpmToolbox, bpmToolbox also includes a range of hyperlinks tools that ensure that custom hyperlinks can quickly and easily be inserted between worksheets within any worksheet in your spreadsheet model.
bpmToolbox 6.0 – Getting Started
www.bestpracticemodelling.com Page 15 of 22
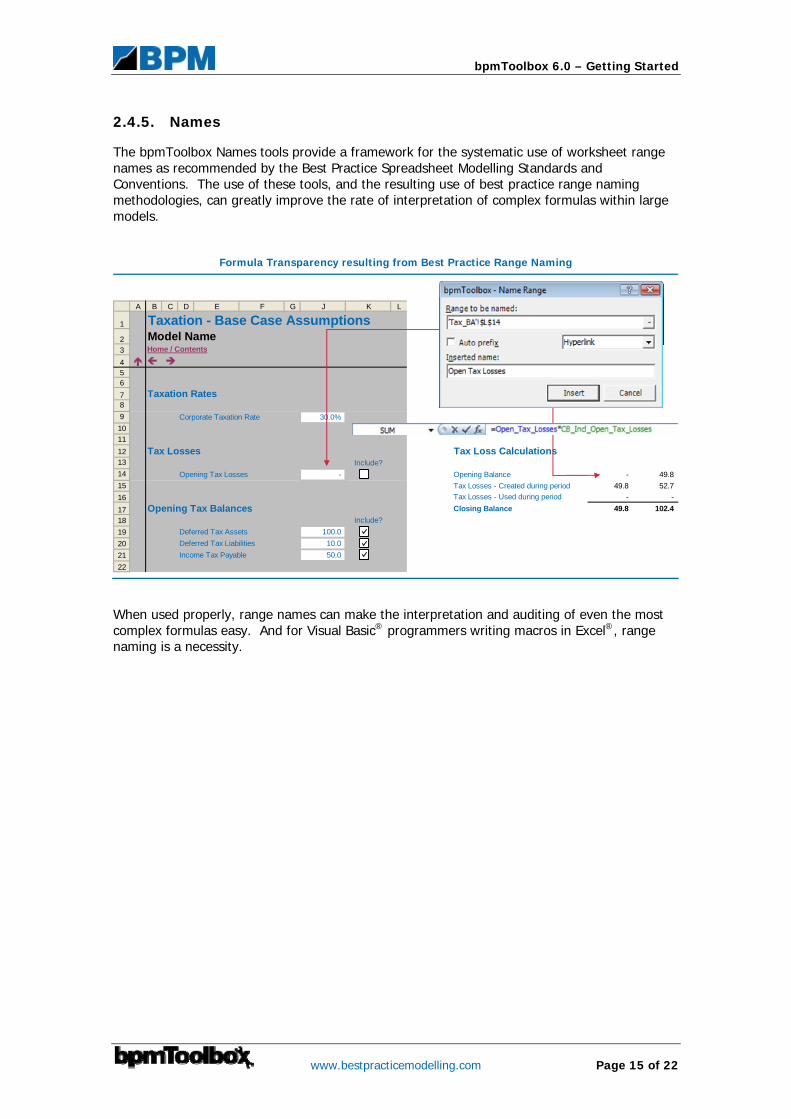
2.4.5. Names
The bpmToolbox Names tools provide a framework for the systematic use of worksheet range names as recommended by the Best Practice Spreadsheet Modelling Standards and Conventions. The use of these tools, and the resulting use of best practice range naming methodologies, can greatly improve the rate of interpretation of complex formulas within large models.
Formula Transparency resulting from Best Practice Range Naming
A B C D E F G J K L
1 FA Taxation - Base Case Assumptions2 Model Name3
4 56
7 Taxation Rates89 Corporate Taxation Rate 30.0%
1011
12 Tax Losses Tax Loss Calculations13 Include?
14 Opening Tax Losses - FALSE Opening Balance - 49.8
15 Tax Losses - Created during period 49.8 52.7
16 Tax Losses - Used during period - -
17 Opening Tax Balances Closing Balance 49.8 102.4
18 Include?
19 Deferred Tax Assets 100.0 TRUE
20 Deferred Tax Liabilities 10.0 TRUE
21 Income Tax Payable 50.0 TRUE
22
Home / Contents
When used properly, range names can make the interpretation and auditing of even the most complex formulas easy. And for Visual Basic® programmers writing macros in Excel®, range naming is a necessity.
bpmToolbox 6.0 – Getting Started
Page 16 of 22 www.bestpracticemodelling.com
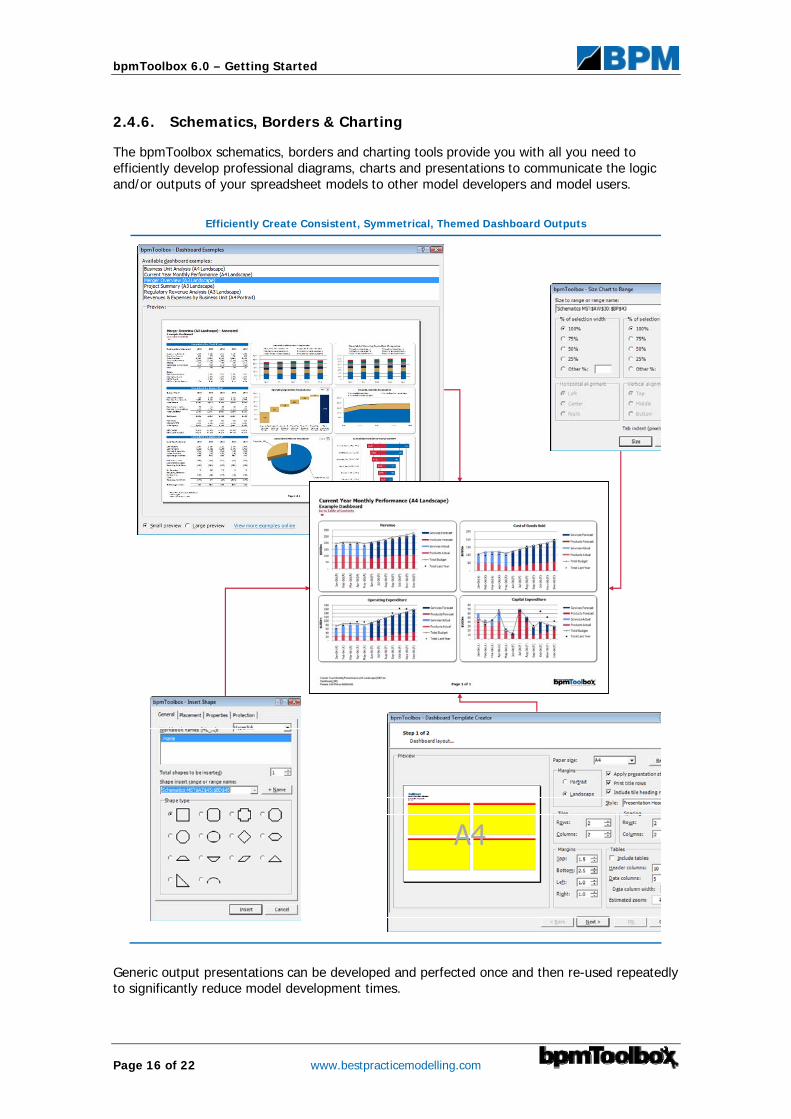
2.4.6. Schematics, Borders & Charting
The bpmToolbox schematics, borders and charting tools provide you with all you need to efficiently develop professional diagrams, charts and presentations to communicate the logic and/or outputs of your spreadsheet models to other model developers and model users.
Efficiently Create Consistent, Symmetrical, Themed Dashboard Outputs
Generic output presentations can be developed and perfected once and then re-used repeatedly to significantly reduce model development times.
bpmToolbox 6.0 – Getting Started
www.bestpracticemodelling.com Page 17 of 22
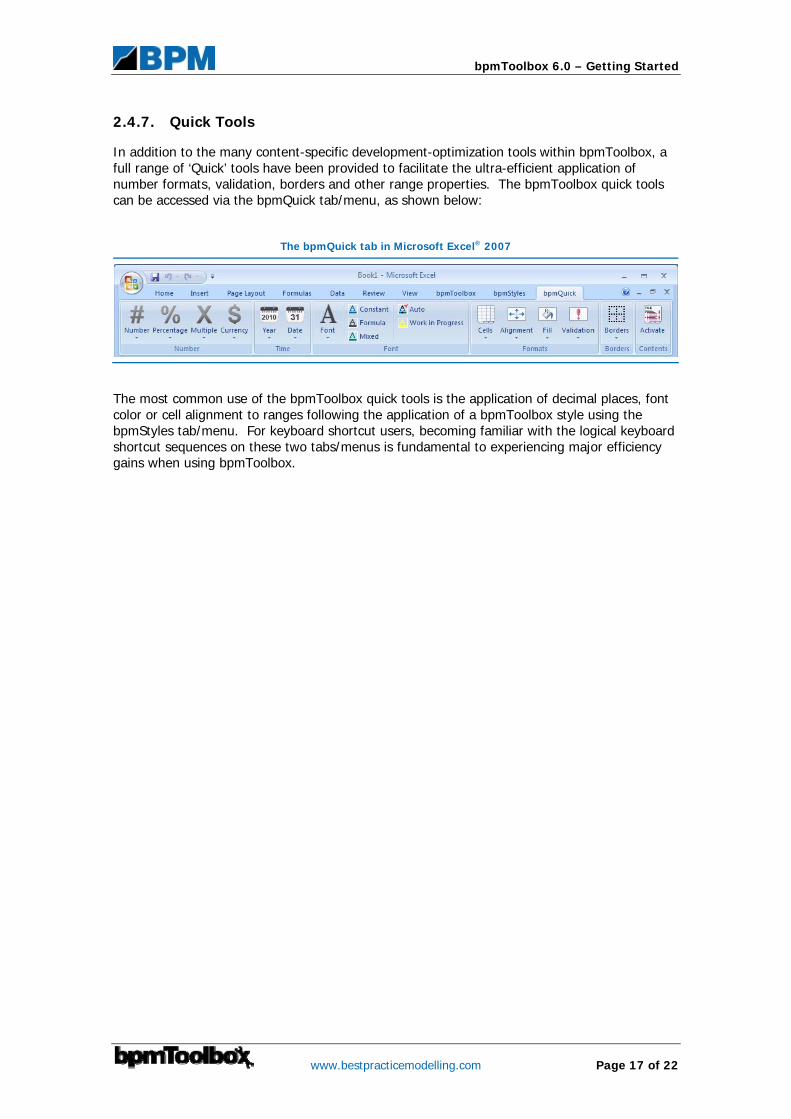
2.4.7. Quick Tools
In addition to the many content-specific development-optimization tools within bpmToolbox, a full range of ‘Quick’ tools have been provided to facilitate the ultra-efficient application of number formats, validation, borders and other range properties. The bpmToolbox quick tools can be accessed via the bpmQuick tab/menu, as shown below:
The bpmQuick tab in Microsoft Excel® 2007
The most common use of the bpmToolbox quick tools is the application of decimal places, font color or cell alignment to ranges following the application of a bpmToolbox style using the bpmStyles tab/menu. For keyboard shortcut users, becoming familiar with the logical keyboard shortcut sequences on these two tabs/menus is fundamental to experiencing major efficiency gains when using bpmToolbox.

bpmToolbox 6.0 – Getting Started
Page 18 of 22 www.bestpracticemodelling.com
2.5. Finalization & Review
After choosing a bpmToolbox theme, determining the appropriate model structure, inserting the required components and building the model content, the bpmToolbox finalization and review tools become an integral part of completing (or reviewing) any spreadsheet model.
The bpmToolbox finalisation and review tools fall within two primary areas:
1) Auditing: Review and interpret formulas, locate and repair errors in a workbook and lock down a work book for secure distribution; and
2) Printing & Viewing: Ensure the use of consistent page setups, panes and splits, print scaling, viewing zoom and group levels within all the sheets in a best practice model.
Each of these areas will be discussed in turn.
bpmToolbox 6.0 – Getting Started
www.bestpracticemodelling.com Page 19 of 22
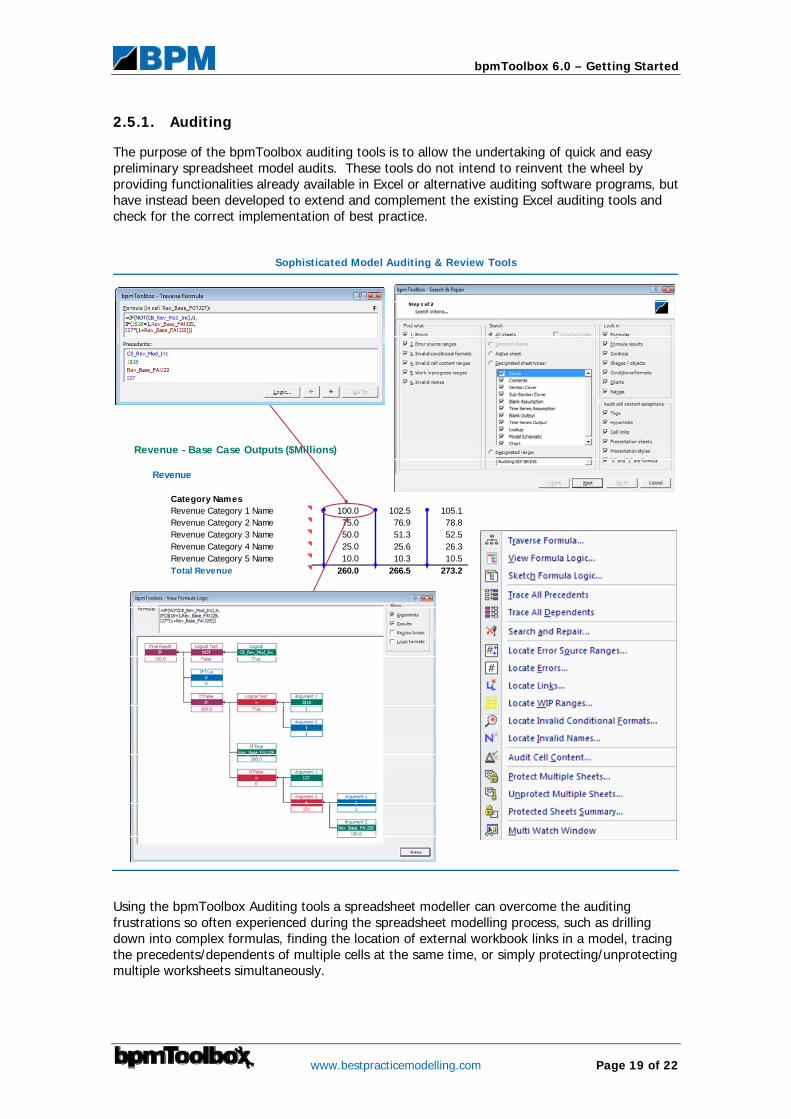
2.5.1. Auditing
The purpose of the bpmToolbox auditing tools is to allow the undertaking of quick and easy preliminary spreadsheet model audits. These tools do not intend to reinvent the wheel by providing functionalities already available in Excel or alternative auditing software programs, but have instead been developed to extend and complement the existing Excel auditing tools and check for the correct implementation of best practice.
Sophisticated Model Auditing & Review Tools
Revenue - Base Case Outputs ($Millions)
Revenue
Category NamesRevenue Category 1 Name 100.0 102.5 105.1Revenue Category 2 Name 75.0 76.9 78.8Revenue Category 3 Name 50.0 51.3 52.5Revenue Category 4 Name 25.0 25.6 26.3Revenue Category 5 Name 10.0 10.3 10.5Total Revenue 260.0 266.5 273.2
Using the bpmToolbox Auditing tools a spreadsheet modeller can overcome the auditing frustrations so often experienced during the spreadsheet modelling process, such as drilling down into complex formulas, finding the location of external workbook links in a model, tracing the precedents/dependents of multiple cells at the same time, or simply protecting/unprotecting multiple worksheets simultaneously.
bpmToolbox 6.0 – Getting Started
Page 20 of 22 www.bestpracticemodelling.com
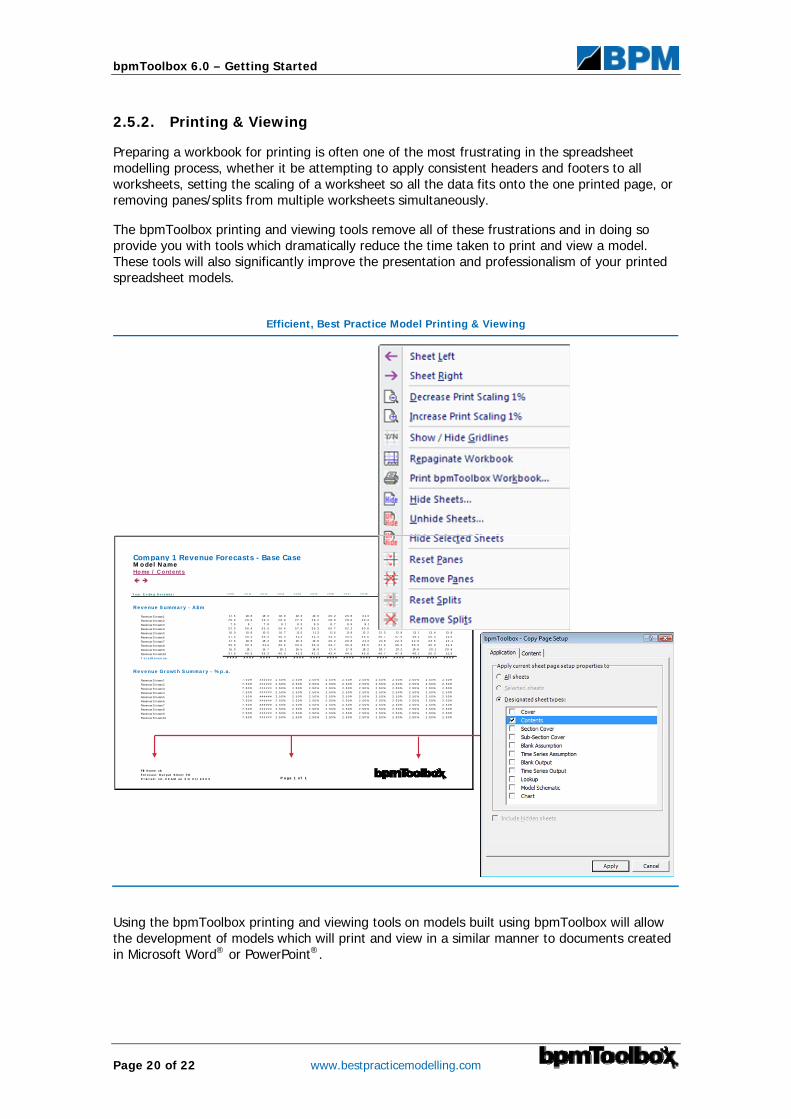
2.5.2. Printing & Viewing
Preparing a workbook for printing is often one of the most frustrating in the spreadsheet modelling process, whether it be attempting to apply consistent headers and footers to all worksheets, setting the scaling of a worksheet so all the data fits onto the one printed page, or removing panes/splits from multiple worksheets simultaneously.
The bpmToolbox printing and viewing tools remove all of these frustrations and in doing so provide you with tools which dramatically reduce the time taken to print and view a model. These tools will also significantly improve the presentation and professionalism of your printed spreadsheet models.
Efficient, Best Practice Model Printing & Viewing
Company 1 Revenue Forecasts - Base CaseM o del N ame
Y e a r E n d in g D e c e mbe r
Re v e nue S umma r y - A$ m
Reven ue St r eam 1
Reven ue St r eam 2
Reven ue St r eam 3
Reven ue St r eam 4
Reven ue St r eam 5
Reven ue St r eam 6
Reven ue St r eam 7
Reven ue St r eam 8
Reven ue St r eam 9
Reven ue St r eam 10
T ot a l R e v e n ue
Re v e nue Gr owt h S umma r y - % p. a .
Reven ue St r eam 1
Reven ue St r eam 2
Reven ue St r eam 3
Reven ue St r eam 4
Reven ue St r eam 5
Reven ue St r eam 6
Reven ue St r eam 7
Reven ue St r eam 8
Reven ue St r eam 9
Reven ue St r eam 10
F ile N a me . x ls
For e c a s t O ut put S he e t FO
P r in t e d : 1 2 . 0 0 A M on 0 1 / 0 1 / 2 0 0 3 P a g e 1 o f 1
2 0 10 2 0 11 2 0 12 2 0 13 2 0 14
Home / C ont ent s
2 0 2 1 2 0 2 2 2 0 2 32 0 17 2 0 18 2 0 19 2 0 2 02 0 15 2 0 16
# # # # # # # # # # # #
17 . 5
2 5 . 0
7 . 5
5 2 . 5
10 . 0
3 7 . 5
17 . 5
3 0 . 0
15 . 0
3 7 . 5
# # # # # # # #
16 . 1
4 0 . 3
18 . 8
2 6 . 9
8 . 1
5 6 . 4
10 . 8
4 0 . 3
18 . 8
3 2 . 3
18 . 3
2 6 . 2
7 . 9
5 5 . 0
10 . 5
3 9 . 3
18 . 3
3 1. 4
15 . 7
3 9 . 3
18 . 8
2 6 . 9
8 . 1
5 6 . 4
10 . 7
4 0 . 3
18 . 8
3 2 . 2
16 . 1
4 0 . 3
19 . 3
2 7 . 5
8 . 3
5 7 . 8
11. 0
4 1. 3
19 . 3
3 3 . 0
16 . 5
4 1. 3
19 . 8
2 8 . 2
8 . 5
5 9 . 3
11. 3
4 2 . 3
19 . 8
3 3 . 9
16 . 9
4 2 . 3
2 0 . 2
2 8 . 9
8 . 7
6 0 . 7
11. 6
4 3 . 4
2 0 . 2
3 4 . 7
17 . 4
4 3 . 4
2 0 . 8
2 9 . 6
8 . 9
6 2 . 3
11. 9
4 4 . 5
2 0 . 8
3 5 . 6
17 . 8
4 4 . 5
2 1. 3
3 0 . 4
9 . 1
6 3 . 8
12 . 2
4 5 . 6
2 1. 3
3 6 . 5
18 . 2
4 5 . 6
2 1. 8
3 1. 1
9 . 3
6 5 . 4
12 . 5
4 6 . 7
2 1. 8
3 7 . 4
18 . 7
4 6 . 7
2 2 . 3
3 1. 9
9 . 6
6 7 . 0
12 . 8
4 7 . 9
2 2 . 3
3 8 . 3
19 . 2
4 7 . 9
2 2 . 9
3 2 . 7
9 . 8
6 8 . 7
13 . 1
4 9 . 1
2 2 . 9
3 9 . 3
19 . 6
4 9 . 1
2 3 . 5
3 3 . 5
10 . 1
7 0 . 4
13 . 4
5 0 . 3
2 3 . 5
4 0 . 3
2 0 . 1
5 0 . 3
2 4 . 1
3 4 . 4
10 . 3
7 2 . 2
13 . 8
5 1. 6
2 4 . 1
4 1. 3
2 0 . 6
5 1. 6
# # # # # # # # # # # # # # # # # # # # # # # # # # # # # # # # # # # #
2 . 5 0 %
2 . 5 0 %
2 . 5 0 %
2 . 5 0 % 2 . 5 0 % 2 . 5 0 %
2 . 5 0 % 2 . 5 0 % 2 . 5 0 %
2 . 5 0 %2 . 5 0 %
2 . 5 0 % 2 . 5 0 % 2 . 5 0 %
2 . 5 0 % 2 . 5 0 % 2 . 5 0 %
7 . 5 0 % # # # # # # 2 . 5 0 % 2 . 5 0 %
7 . 5 0 % # # # # # # 2 . 5 0 % 2 . 5 0 % 2 . 5 0 %
2 . 5 0 %
2 . 5 0 %
2 . 5 0 %
2 . 5 0 % 2 . 5 0 % 2 . 5 0 %7 . 5 0 % # # # # # # 2 . 5 0 % 2 . 5 0 %
2 . 5 0 % 2 . 5 0 % 2 . 5 0 %7 . 5 0 % # # # # # # 2 . 5 0 % 2 . 5 0 %
2 . 5 0 %
2 . 5 0 % 2 . 5 0 % 2 . 5 0 %
2 . 5 0 % 2 . 5 0 %
2 . 5 0 %
2 . 5 0 % 2 . 5 0 % 2 . 5 0 % 2 . 5 0 % 2 . 5 0 % 2 . 5 0 % 2 . 5 0 %2 . 5 0 %
2 . 5 0 %
7 . 5 0 % # # # # # # 2 . 5 0 % 2 . 5 0 %
2 . 5 0 %
2 . 5 0 %
2 . 5 0 %
7 . 5 0 % # # # # # # 2 . 5 0 % 2 . 5 0 % 2 . 5 0 % 2 . 5 0 % 2 . 5 0 %
2 . 5 0 %
2 . 5 0 % 2 . 5 0 % 2 . 5 0 %2 . 5 0 %
2 . 5 0 % 2 . 5 0 %
2 . 5 0 %
2 . 5 0 %7 . 5 0 % # # # # # # 2 . 5 0 % 2 . 5 0 % 2 . 5 0 % 2 . 5 0 % 2 . 5 0 %
2 . 5 0 % 2 . 5 0 % 2 . 5 0 %7 . 5 0 % # # # # # # 2 . 5 0 % 2 . 5 0 % 2 . 5 0 % 2 . 5 0 % 2 . 5 0 %
2 . 5 0 % 2 . 5 0 %
2 . 5 0 %
2 . 5 0 % 2 . 5 0 % 2 . 5 0 % 2 . 5 0 % 2 . 5 0 % 2 . 5 0 % 2 . 5 0 %2 . 5 0 %
2 . 5 0 %
7 . 5 0 % # # # # # # 2 . 5 0 % 2 . 5 0 %
2 . 5 0 %
2 . 5 0 %
7 . 5 0 % # # # # # # 2 . 5 0 % 2 . 5 0 % 2 . 5 0 % 2 . 5 0 % 2 . 5 0 % 2 . 5 0 % 2 . 5 0 % 2 . 5 0 % 2 . 5 0 %2 . 5 0 % 2 . 5 0 %
Using the bpmToolbox printing and viewing tools on models built using bpmToolbox will allow the development of models which will print and view in a similar manner to documents created in Microsoft Word® or PowerPoint®.

bpmToolbox 6.0 – Getting Started
www.bestpracticemodelling.com Page 21 of 22
Chapter 3. Fundamental First Steps…
Follow the instructions provided below for a simple step-by-step guide on how to instantly start using your bpmToolbox to efficiently build your own best practice spreadsheet models.
1) Review the Best Practice Spreadsheet Modelling Standards (from www.ssrb.org).
2) Download and explore some example models built using bpmToolbox (from www.bestpracticemodelling.com).
3) Insert a Base Workbook using the Insert Base Workbook tool ( ) on the bpmToolbox tab/menu.
4) Insert base sheets using the Insert Sheet menu on the bpmToolbox tab/menu. Note that when inserting sheets from the Insert Sheet menu, the new sheet will be inserted to the right of the active worksheet.
5) Update the table of contents using the Update Table of Contents tool ( ) within the Base Sheets menu on the bpmToolbox tab/menu.
6) Apply bpmToolbox styles from within the bpmStyles tab/menu, noting the automatic coloring of constants, formulas and mixed cell content ranges as per the Best Practice Spreadsheet Modelling Standards.
7) Insert a control using the bpmToolbox Controls tools within the Forms menu on the bpmToolbox tab/menu. Insert multiple controls to see the true efficiency savings of these tools.
8) Insert a custom hyperlink using the Custom Hyperlink tool ( ), located on the Hyperlinks menu within the bpmToolbox tab/menu.
9) Insert a list of range names into your workbook using the Names List tool ( ), located on the Names menu within the bpmToolbox tab/menu. Be sure to include a number in the name assigned to the first name in the list.
10) Enter a simple formula into a cell and partially transpose it using the Partially
Transpose Formula tool ( ), located on the Accessories menu within the
bpmToolbox tab/menu. After using this tool, use the Trace All Precedents tool ( ) from within the Auditing menu on the bpmToolbox tab/menu to trace the precedents of the formulas which have been partially transposed.
11) Examine and trace formula logic using the Traverse Formula tool ( ) and the View
Formula Logic tool ( ) from within the Auditing menu on the bpmToolbox tab/menu.

bpmToolbox 6.0 – Getting Started
Page 22 of 22 www.bestpracticemodelling.com
12) View some example dashboards using the Dashboard Examples tool ( ) and insert a
dashboard template using the Create Dashboard Template tool ( ), both located within the Schematics menu on the bpmToolbox tab/menu.
13) Insert a Model Schematic Sheet (via the Insert Sheet menu on the bpmToolbox
tab/menu) and insert multiple shapes into it using the Insert Shape(s) tool ( ), located within the Schematics menu on the bpmToolbox tab/menu.
14) Undertake a search and repair of the active workbook using the Search and Repair tool
( ) located within the Auditing menu on the bpmToolbox tab/menu.
15) View the entire workbook in page break preview mode using the Print Preview tool
( ) from the Workbook View menu on the bpmToolbox tab/menu and use this view to set or update page breaks on worksheets.
For further information or help on using any of the tools listed above, consult the relevant area in the bpmToolbox online help at www.bestpracticemodelling.com.


Best Practice ModellingSydney – MelbournePhone: +613 9244 9800Email: [email protected]