Embed Size (px)
Citation preview

Getting the Most Out of APPA’s FPI Survey and Report Tool
Christina Hills Director of Credentialing & Benchmarking
May 30,2012

Objectives of the Session What is the APPA FPI Program? FPI Survey Framework Benefits of Participating in the Survey New Enhanced Energy Module FPI Report Options

What is APPA’s FPI? Portfolio of the key facilities measures that address the essential questions
every facilities professional must be able to answer in order to effectively perform
their roles. “A major consideration in performance
improvement involves the creation and use of performance measures or indicators.” – Baldrige
criteria for performance excellence

Why Use the FPI? Strategic tool for: Self-Assessment Self-Improvement Peer Comparison Performance Measurement

Balanced Scorecard
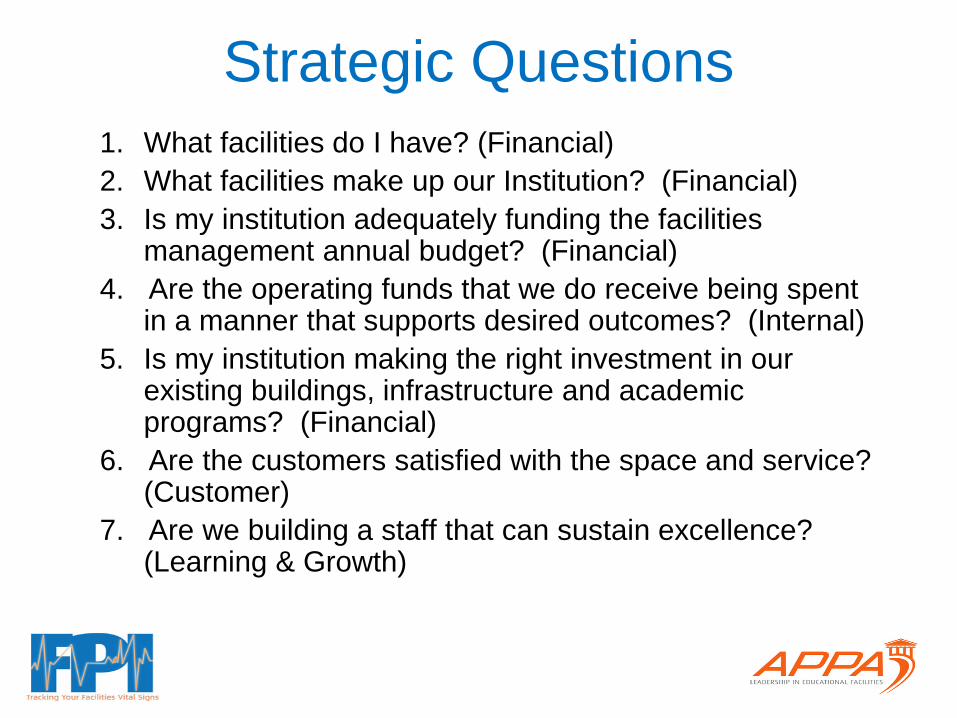
Strategic Questions 1. What facilities do I have? (Financial) 2. What facilities make up our Institution? (Financial) 3. Is my institution adequately funding the facilities
management annual budget? (Financial) 4. Are the operating funds that we do receive being spent
in a manner that supports desired outcomes? (Internal) 5. Is my institution making the right investment in our
existing buildings, infrastructure and academic programs? (Financial)
6. Are the customers satisfied with the space and service? (Customer)
7. Are we building a staff that can sustain excellence? (Learning & Growth)
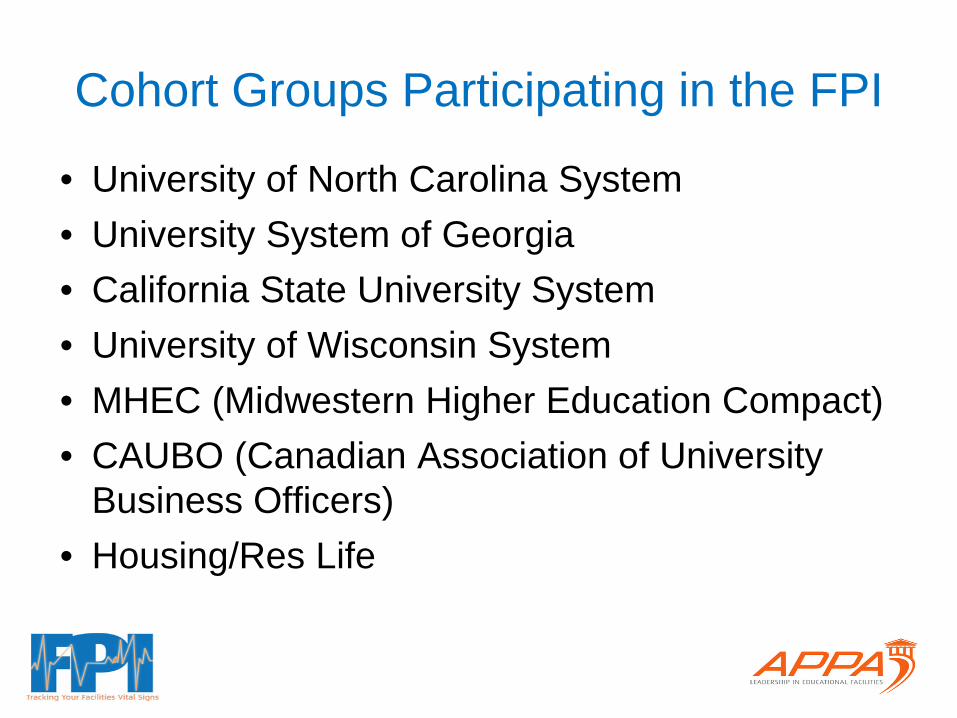
Cohort Groups Participating in the FPI
• University of North Carolina System • University System of Georgia • California State University System • University of Wisconsin System • MHEC (Midwestern Higher Education Compact) • CAUBO (Canadian Association of University
Business Officers) • Housing/Res Life

Green Globes Program • Energy and Environmental Assessment Tool • Facilitates Assessment of Buildings by Owners • Question Based tool Rating:
– Energy – Water – Resources – Emissions – Effluents and hazardous materials – Indoor environment – Environmental Management

Building B (residence) •Physical attributes of the base building •Performance metrics
Building A (residence) •Physical attributes of the base building •Performance metrics
Building C (sports facility) •Physical attributes of the base building •Performance metrics
Building D (classrooms) •Physical attributes of the base building •Performance metrics
Building D (classrooms) •Physical attributes of the base building •Performance metrics
Individual Building Assessments Building
A Building
B Building
C Building
D Building
E
Physical attributes e.g. •HVAC •Lighting •Envelope •Water fixtures •IAQ •Pollution controls
Performance metrics •Energy •Carbon •Waste
Campus Assessment
Site attributes e.g. •Site remediation •Landscaping
Environmental Mgmt e.g. •Policies •Procedures •Training •Communications •Procurement
Occupant activities
Campus Portfolio Assessment
Different building types (e.g. multi-residential, administration, sports, light industrial, labs etc.) Facilities Department
One set of questions for the campus
Different set of questions for each building type
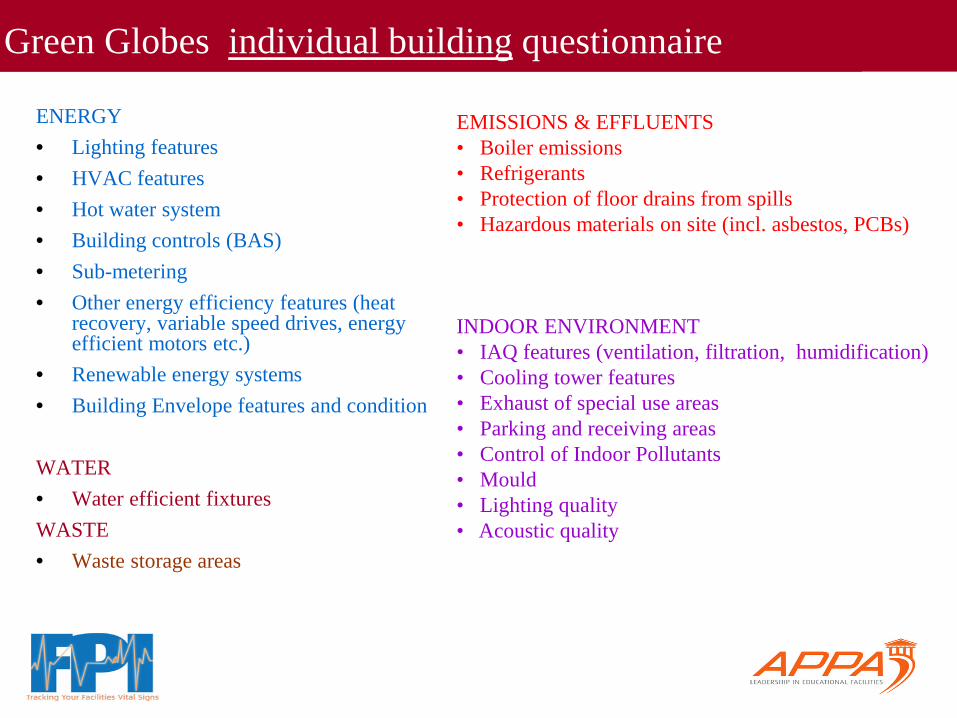
Green Globes individual building questionnaire
ENERGY • Lighting features • HVAC features • Hot water system • Building controls (BAS) • Sub-metering • Other energy efficiency features (heat
recovery, variable speed drives, energy efficient motors etc.)
• Renewable energy systems • Building Envelope features and condition
WATER • Water efficient fixtures WASTE • Waste storage areas
EMISSIONS & EFFLUENTS • Boiler emissions • Refrigerants • Protection of floor drains from spills • Hazardous materials on site (incl. asbestos, PCBs)
INDOOR ENVIRONMENT • IAQ features (ventilation, filtration, humidification) • Cooling tower features • Exhaust of special use areas • Parking and receiving areas • Control of Indoor Pollutants • Mould • Lighting quality • Acoustic quality
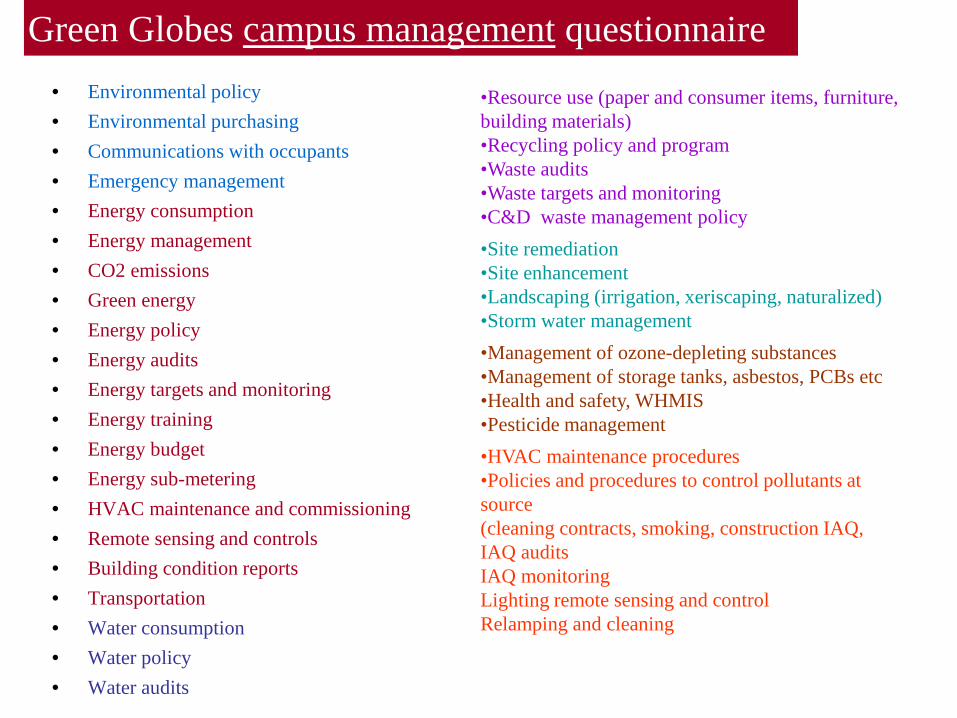
Green Globes campus management questionnaire • Environmental policy • Environmental purchasing • Communications with occupants • Emergency management • Energy consumption • Energy management • CO2 emissions • Green energy • Energy policy • Energy audits • Energy targets and monitoring • Energy training • Energy budget • Energy sub-metering • HVAC maintenance and commissioning • Remote sensing and controls • Building condition reports • Transportation • Water consumption • Water policy • Water audits
•Resource use (paper and consumer items, furniture, building materials) •Recycling policy and program •Waste audits •Waste targets and monitoring •C&D waste management policy
•Site remediation •Site enhancement •Landscaping (irrigation, xeriscaping, naturalized) •Storm water management
•Management of ozone-depleting substances •Management of storage tanks, asbestos, PCBs etc •Health and safety, WHMIS •Pesticide management
•HVAC maintenance procedures •Policies and procedures to control pollutants at source (cleaning contracts, smoking, construction IAQ, IAQ audits IAQ monitoring Lighting remote sensing and control Relamping and cleaning
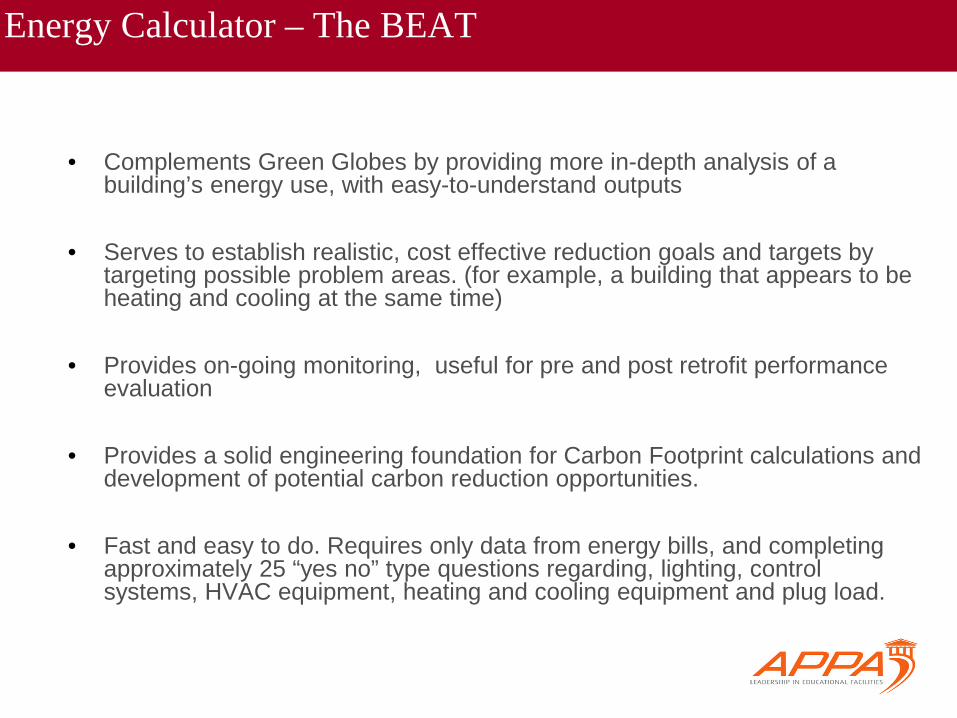
Energy Calculator – The BEAT
• Complements Green Globes by providing more in-depth analysis of a building’s energy use, with easy-to-understand outputs
• Serves to establish realistic, cost effective reduction goals and targets by targeting possible problem areas. (for example, a building that appears to be heating and cooling at the same time)
• Provides on-going monitoring, useful for pre and post retrofit performance evaluation
• Provides a solid engineering foundation for Carbon Footprint calculations and development of potential carbon reduction opportunities.
• Fast and easy to do. Requires only data from energy bills, and completing
approximately 25 “yes no” type questions regarding, lighting, control systems, HVAC equipment, heating and cooling equipment and plug load.

Tory Building 127,581 ft2Electricity 2008 YearAnnual Energy 2,435,151 kWh Sub Meter readingsTotal Utility Cost 213,076$ 0.088$ Unit cost Reduction 11% ProjectedElectricity 19.09 kWh/ft2 739.63 MJ/m2 16.99 kWh/ft2 658.27 MJ/m2
End Use
Calculated End Use
Allocation kWh/ft2 Annual Energy Annual Cost $End Use
Red'n Pot'l
Projected Annual Utility
UseProjected
Utility Savings
Projected Annual Cost
SavingOverall Red'n
Lighting 34% 6.49 827,951 72,446$ 15% 703,759 124,193 10,867$ 5%Plug Load 7% 1.34 170,461 14,915$ 10% 153,415 17,046 1,492$ 1%Process Electricity 7% 1.34 170,461 14,915$ 170,461 - -$ 0%HVAC/ Fans and Pumps 37% 7.06 901,006 78,838$ 10% 810,905 90,101 7,884$ 4%DHW 0% - - -$ - - -$ 0%Cooling 11% 2.10 267,867 23,438$ 10% 241,080 26,787 2,344$ 1%Heating 4% 0.76 97,406 8,523$ 10% 87,665 9,741 852$ 0%Totals 100% 19.09 2,435,151 213,076$ 2,167,284 267,867 23,438$ 11%
16.99 kWh/ft2 658.27 MJ/m2Steam 2008 YearAnnual Energy 2,027 Mlbs Sub Meter readingsTotal Utility Cost 33,437$ 16.500$ Unit cost Reduction 10% ProjectedHeating Fuel 4.66 ekWh/ft2 180.39 MJ/m2 4.19 ekWh/ft2 162.53 MJ/m2
End Use
Calculated End Use
Allocation ekWh/ft2 Annual Energy Annual Cost $End Use
Red'n Pot'l
Projected Annual Utility
UseProjected
Utility Savings
Projected Annual Cost
SavingOverall Red'n
Building Heating 99% 4.61 2,006 33,103$ 10% 1,806 201 3,310$ 10%Heating Process 0% - - -$ - - -$ 0%Baseload/ DHW 1% 0.05 20 334$ 20 - -$ 0%Totals 100% 4.66 2,027 33,437$ 1,826 201 3,310$ 10%
4.19 ekWh/ft2 162.53 MJ/m2Natural Gas 2008 YearAnnual Energy 13,666 m3 Enbridge billingsTotal Utility Cost 6,211$ 0.454$ Unit cost Reduction 10% ProjectedHeating Fuel 1.12 ekWh/ft2 43.58 MJ/m2 1.01 ekWh/ft2 39.27 MJ/m2
End Use
Calculated End Use
Allocation ekWh/ft2 Annual Energy Annual Cost $End Use
Red'n Pot'l
Projected Annual Utility
UseProjected
Utility Savings
Projected Annual Cost
SavingOverall Red'n
Building Heating 99% 1.11 13,529 6,149$ 10% 12,176 1,353 615$ 10%Heating Process 0% - - -$ - - -$ 0%Baseload/ DHW 1% 0.01 137 62$ 137 - -$ 0%Totals 100% 1.12 13,666 6,211$ 12,313 1,353 615$ 10%
1.01 ekWh/ft2 39.27 MJ/m2Water 2008 YearAnnual Consumption 28,049 m3 Sub Meter readingsTotal Utility Cost 60,305$ 2.150$ Unit cost Reduction 30% ProjectedWater 219.85 Litres/ft2 20.43 L/m2 153.90 Litres/ft2 14.30 L/m2
End Use
Calculated End Use
Allocation Litres/ft2 Annual Energy Annual Cost $End Use
Red'n Pot'l
Projected Annual Utility
UseProjected
Utility Savings
Projected Annual Cost
SavingOverall Red'n
DCW 71% 156.10 19,915 42,817$ 30% 13,940 5,974 12,845$ 21%Process 0% - - -$ - - -$ 0%Cooling/ Summer Extra 29% 63.76 8,134 17,488$ 30% 5,694 2,440 5,247$ 9%Totals 100% 219.85 28,049 60,305$ 19,634 8,415 18,092$ 30%
153.90 Litres/ft2 14.30 L/m2
Existing ekWh/ft2
Annual Energy ekWh Annual Cost $
Annual Cost $/ft2
Projected ekWh/ft2
Projected Cost Savings
Overall Red'n
Building Total 24.87 3,172,553 313,029$ 2.45$ 22.20 45,455$ 15%963.60 MJ/m2 860.06 MJ/m2
Building Energy Allocation and Projected Savings
Electricity Use Breakdown
Lighting34%
Plug Load7%
Process Electricity
7%
HVAC/ Fans and Pumps
37%
DHW0%
Cooling11%
Heating4%
Steam Use Breakdown
Building Heating
99%
Baseload/ DHW1%
Heating Process
0%
Water Use Breakdown
DCW71%
Process0%
Cooling/ Summer
Extra29%
Natural Gas Use Breakdown
Building Heating
99%
Heating Process
0%
Baseload/ DHW1%
Building Energy Allocation Tool - BEAT

Tory BuildingEnergy Retrofit Project Cost Estimate
Electricity End Use Y/N Energy Savings Opportunities
Implemen- tation Cost
$/ft2Implemen
tation Cost $Potential Cost
Savings $Simple
Payback YearsLighting - Convert to High Efficiency Lamps/Ballasts -
- Convert Exit Lamps to LED -x Replace Incandescent lamps with CFL 0.01$ 1,000$ x Upgrade/ Replace Existing Controls 0.24$ 30,000$
Total 31,000$ 10,867$ 2.9 Plug Load x High Efficiency Appliances 0.08$ 10,000$
- Remove Unnecessary Loads 0.00$ 0$ - Circuit Control -
Total 10,000$ 1,492$ 6.7 Process Electricity - Remove Unnecessary Loads -
- Circuit Control -Total -$ -$ - HVAC Fan Systems - Major Equipment Replacement -
- Fan Systems Overhaul/Upgrade -- New Building Automation System -x Upgrade/Optimize Fan System Control 0.08$ 10,000$ x Recommissioning/Air Balancing 0.24$ 30,000$ - Exhaust Air Heat Recovery -
Total 40,000$ 8,736$ 4.6 HVAC Pump Systems - Major Equipment Replacement -
- Pump Systems Overhaul/Upgrade -- Upgrade/Optimize Pump Control -- Recommissioning/Water Balancing -
Total -$ -$ - Domestic Hot Water - Boiler Replacement -
- Optimize Control/Delivery Temperature -- Low Flow Fixtures Replacement -
Total -$ -$ - Cooling Plant - Replace R-22 Refrigerant Chiller -
- Retrofit/Overhaul Existing Chillers -x HVAC Controls Optimization 0.08$ 10,000$ - Cooling Tower Control - VFD/Winterize -- Building Envelope/Solar Film/Shading -
Total 10,000$ 2,344$ 4.3 Electricity Total 91,000$ 23,438$ 3.9
Heating Fuel End Use Y/N Energy Savings Opportunities
Implemen- tation Cost
$/ft2Implemen
tation Cost $Potential Cost
Savings $Simple
Payback YearsHeating Plant - Heating Boiler Replacement -
- Retrofit/Overhaul Boilers -- DHW Boiler Replacement -- Summer Boiler/Boiler Control -- Stack Heat Recovery -x HVAC Controls Optimization 0.12$ 15,000$ x Optimize Ventilation Rate 0.08$ 10,000$ - Optimize Humidification -x Building Envelope/Infiltration/Pressurization 0.02$ 3,000$
Heating Fuel Total 28,000$ 3,925$ 7.1
Water End Use Y/N Energy Savings Opportunities
Implemen- tation Cost
$/ft2Implemen
tation Cost $Potential Cost
Savings $Simple
Payback YearsDomestic Cold Water x Low Flow Fixtures/Controls Upgrade 0.12$ 15,000$
- Optimize Cooling Tower Control -- Exterior Use Controls/Optimization -
Water Total 15,000$ 18,092$ 0.8
Implemen tation Cost $
Potential Cost Savings $
Simple Payback Years
Grand Total 134,000$ 45,455$ 2.9
Energy end use Energy-saving measures Cost
per sf Cost Savings Payback
End use e.g. Lighting
Energy saving measures e.g. Complete upgrade to high efficiency lamps. Upgrade/replace lighting controls
Cost to implement e.g. $31K
Potential savings e.g. $10,867
Payback (years) e.g. 2.9
BEAT outputs
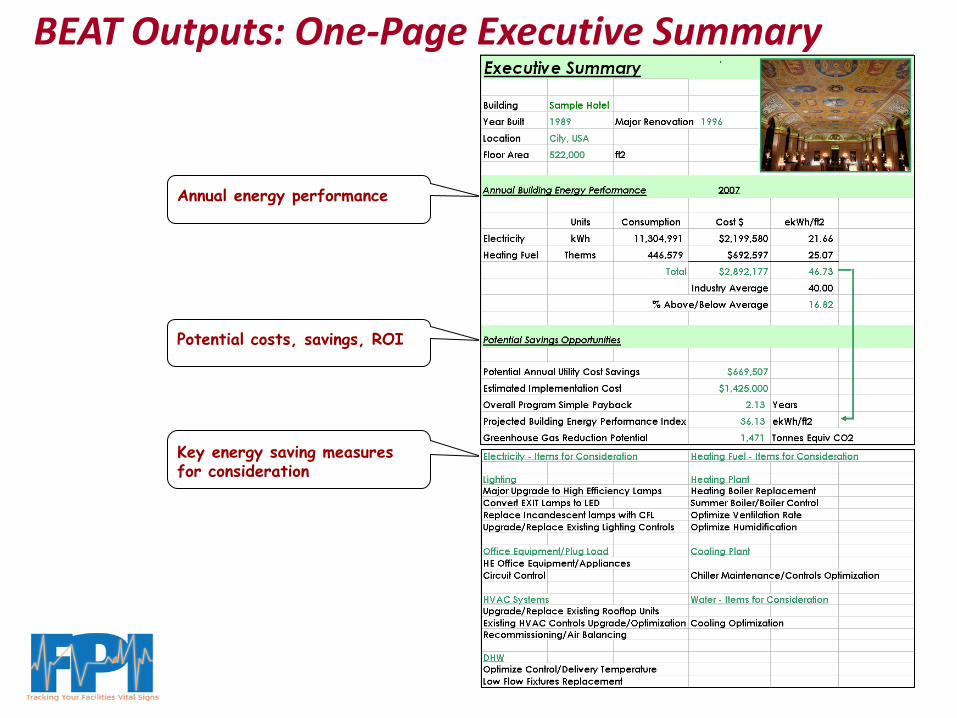
BEAT Outputs: One-Page Executive Summary
Annual energy performance
Potential costs, savings, ROI
Key energy saving measures for consideration

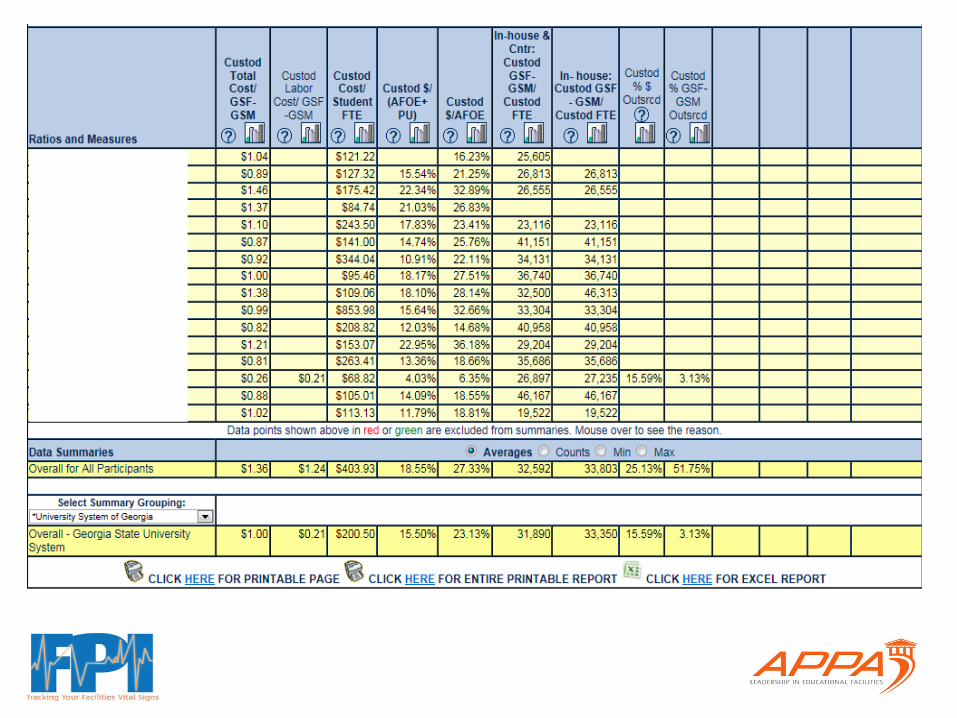
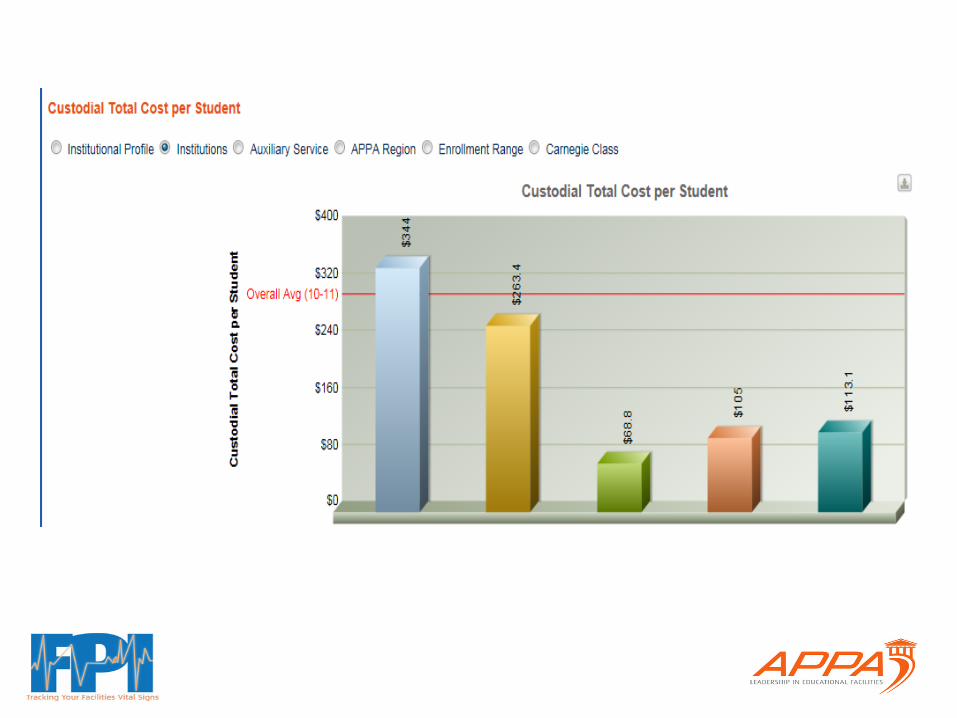
Benefits of Participating – FPI Report
• Access to all areas • Free to participating APPA members • Benchmarking made easy • Immediate, online, year-long access • Trending flexible to 5 years • Access to your cohort average • Beta review period opens early • Multiple reports/graphs to view/print/download

Resources to Assist You
• Visit the APPA FPI website area at http://www.appa.org/research/FPI/index.cfm • Archived webinars on the FPI website will instruct you on how to complete the FPI
survey instrument. http://www.appa.org/research/fpi/webinar.cfm
• Contact Christina Hills to arrange a personalized GoToMeeting webinar.
• Additional information on the FPI Qualified Advisors Program can also be found
on the APPA website @ http://appa.org/research/fpiadvisors.cfm • Questions? Contact Christina Hills, Director of Credentialing & Benchmarking • Tel: 703.542.3844 • Email: [email protected]


![HUD-FPI-MAY2013.PDF [ HUD-FPI-MAY2013.PDF ]](https://img.pdfslide.net/doc/110x75/588c64bd1a28abf9208b7388/hud-fpi-may2013pdf-hud-fpi-may2013pdf-.jpg)