Embed Size (px)
Citation preview

Geysers Caused by the Sudden Release of Pressurized Air Pockets
by
Kathleen Zeaser Muller
A thesis submitted to the Graduate Faculty ofAuburn University
in partial fulfillment of therequirements for the Degree of
Master of Science
Auburn, AlabamaMay 6, 2017
Keywords: geyser, stormwater, physical modeling, stormwater systems, air-water flows,geysering
Copyright 2017 by Kathleen Zeaser Muller
Approved by
Jose Goes Vasconcelos, Associate Professor of Civil EngineeringPrabhakar Clement, Groome Endowed Professor of Environmental Engineering
Xing Fang, Arthur H. Feagin Chair Professor of Civil Engineering

Abstract
Uncontrolled air pockets released from water-filled shafts can lead to geysering in stormwa-
ter systems. Such occurrences are deleterious from public health and environmental stand-
point and can cause property and structural damage. Causes, frequency, magnitude, and
location of geysering events are still poorly understood, and pose practical difficulties to
designers as to how to create drop shafts that are less likely to present this issue. This work
presents results from experimental and numerical investigations on air-related geysers that
aimed to gain insight on the mechanisms of air release and the displacement of water in ver-
tical shafts. A 302mm schedule 40 clear PVC apparatus was constructed with the essential
features of a stormwater tunnel, and was fitted with vertical shafts with diameters ranging
from 0.10m to 0.20m. During these experiments, predetermined air pocket volumes were
released in the horizontal pipe, and eventually reached shafts causing water displacement
and often geysers. Kinematics of the air pocket release were measured along with pressures
at selected points in the apparatus. These results were used in the calibration of a CFD
model based on OpenFOAM, which compared well with the experimental measurements.
The model was subsequently used in a larger geometry that allowed the evaluation of air
pocket release kinematics for a wider range of conditions. Findings of this work provide
further details on the nature and strength of geysering events, and suggestions for future
studies in this topic are also provided.
ii

Acknowledgments
I would like to thank my adviser, Dr. Vasconcelos for his continued support and every-
thing he has done to help me earn my degrees. I would also like to thank LimnoTech for
financially supporting this project and the Alabama Supercomputer Authority for supporting
the CFD model execution.
iii

.
LIST OF ABBREVIATIONS
D = Shaft Diameter (m)
D∗ = Normalized Shaft Diameter
Dt = Tunnel Diameter (m)
g = Gravity acceleration(m/s2)
L = Length of vertical shaft (m)
t = Time(s)
Vair = Air Pocket Volume (L)
V ∗air = Normalized air pocket volume
VInt = Velocity of the air-water interface (m/s)
V ∗Int = Normalized velocity of the air-water interface
VFS = Velocity of the free surface (m/s)
V ∗FS = Normalized velocity of the free surface
YInt = Vertical coordinate of the air-water interface in the vertical shaft (m)
Y ∗Int = Normalized vertical coordinate of the air-water interface in the vertical shaft
YFS = Vertical coordinate of the free surface in the vertical shaft (m)
Y ∗FS = Normalized vertical coordinate of the free surface in the vertical shaft
iv

List of Figures
1.1 Diagram of a combined sewer system from the Huntington Sanitary Board . . . 2
1.2 Map of current progress for Chicago’s TARP from . . . . . . . . . . . . . . . . . 5
2.1 Schematic representation of the common gas-liquid flow regimes [Morgado et al.,
2016] . . . . . . . . . . . . . . . . . . . . . . . . . . . . . . . . . . . . . . . . . . 9
4.1 Top: Picture of apparatus used in experiments. Bottom: Sketch of apparatus
used in experiments. . . . . . . . . . . . . . . . . . . . . . . . . . . . . . . . . . 15
4.2 one MEGGITT-ENDEVCO 8510C-50 rated at 0.34-MPa, and two MEGGITT-
ENDEVCO 8510C-15 rated at 0.103- MPa . . . . . . . . . . . . . . . . . . . . . 17
4.3 National Instruments NI-USB6210 data acquisition board . . . . . . . . . . . . 18
4.4 Extech HD750 differential pressure manometer . . . . . . . . . . . . . . . . . . 19
4.5 Vectrino Acoustic Doppler Velocimeter (ADV) . . . . . . . . . . . . . . . . . . . 20
5.1 Vertical displacement of the free surface (FS) and the air-water interface (Int):
Time evolution of free surface and interface coordinates including all test runs
(R01, R02, R03) for every tested condition without background flows. The filled-
in symbols represent the free surface and the open symbols represent the air-water
interface coordinates. Diameters of 0.10, 0.15, and 0.20m were normalized by
the diameter of the horizontal tunnel, 0.30-m. The elevation of the rim of the
vertical shaft is indicated by the dashed line. . . . . . . . . . . . . . . . . . . . . 27
v

5.2 Normalized displacement of the free surface and the air-water interface: Time
evolution of free surface and interface coordinates including all test runs (R01,
R02, R03) for every tested condition without background flows. The filled-in sym-
bols represent the free surface (FS) and the open symbols represent the air-water
interface (Int) coordinates. Diameters of 0.10, 0.15, and 0.20m were normalized
by the diameter of the horizontal tunnel, 0.30-m. The elevation of the rim is
represented by the Y* value of 1. . . . . . . . . . . . . . . . . . . . . . . . . . . 28
5.3 Effect of varying diameters in YFS and YInt variation over time, in the absence of
background flows (only one repetition for each diameteris presented). . . . . . . 29
5.4 Time evolution of the free surface and the air-water interface coordinates includ-
ing all test runs (R01, R02, R03) for every tested condition without background
flows. The filled-in symbols represent the free surface (FS) and the open symbols
represent the air-water interface (Int) coordinates. . . . . . . . . . . . . . . . . . 33
5.5 Time evolution of the normalized free surface and the air-water interface coordi-
nates including all test runs (R01, R02, R03) for every tested condition without
background flows. The filled-in symbols represent the free surface (FS) and the
open symbols represent the air-water interface (Int) coordinates. . . . . . . . . . 34
5.6 Time evolution of the free surface (FS) and the air-water interface (Int) coor-
dinates including all test runs (R01, R02, R03) for every tested condition with
background flows. The filled-in symbols represent the free surface and the open
symbols represent the air-water interface coordinates. . . . . . . . . . . . . . . . 35
5.7 Time evolution of the normalized free surface and the air-water interface velocities
including all test runs (R01, R02, R03) for every tested condition with background
flows. The filled-in symbols represent the free surface (FS) and the open symbols
represent the air-water interface (Int) coordinates. . . . . . . . . . . . . . . . . . 36
vi

5.8 Sample pressure head date from a 0.20 − m diameter shaft with a 200 − L air
pocket. Captions indicate the progression of the air pocket. . . . . . . . . . . . 37
5.9 Pressure head data from representative test runs of all diameters for the V ∗a air =
7.0 air pocket. Top: P1 located at the air inlet, Middle: P2 located at the invert
of the horizontal tunnel, Bottom: P3 located on the lateral of the vertical shaft.
Time zero corresponds to the time when the air pocket appears in the visible
section of the vertical shaft. . . . . . . . . . . . . . . . . . . . . . . . . . . . . . 39
5.10 Representative pressure head data measured from the bottom of the vertical shaft
(P2) including all three shaft diameters with a 200 − L air-pocket and without
background flows showing that the pressure heads never reach a magnitude large
enough to cause a geyser to occur. . . . . . . . . . . . . . . . . . . . . . . . . . 40
5.11 Progression of the geysering event from an experiment with a shaft diameter
of 0.15-m, a 200-L=a air-pocket and no background flow. The bold line is the
artificially exaggerated interface location. Each horizontal line along the pipe is
0.30-m apart. The simulated air pocket velocity when it reaches the top of the
tower, shown in frame d, is 8.15-m/s. The simulated velocity after the air exits
the shaft is 18.36-m/s . . . . . . . . . . . . . . . . . . . . . . . . . . . . . . . . 42
5.12 Comparison of experimental and CFD model normalized free surface and air-
water interface displacement. . . . . . . . . . . . . . . . . . . . . . . . . . . . . 43
5.13 Comparison of experimental and CFD model normalized pressure head at trans-
ducer P3 on the shaft side. Vertical dashed lines refer to the time in the simu-
lations when a) air pocket leading edge reaches transducer P3 elevation; b) and
air pocket breakthrough at shaft rim. . . . . . . . . . . . . . . . . . . . . . . . . 44
5.14 (a) The original set up with the shaft meeting at the crown of the pipe. (b) The
proposed set up with the shaft extended half way into the cross section of the pipe. 46
vii

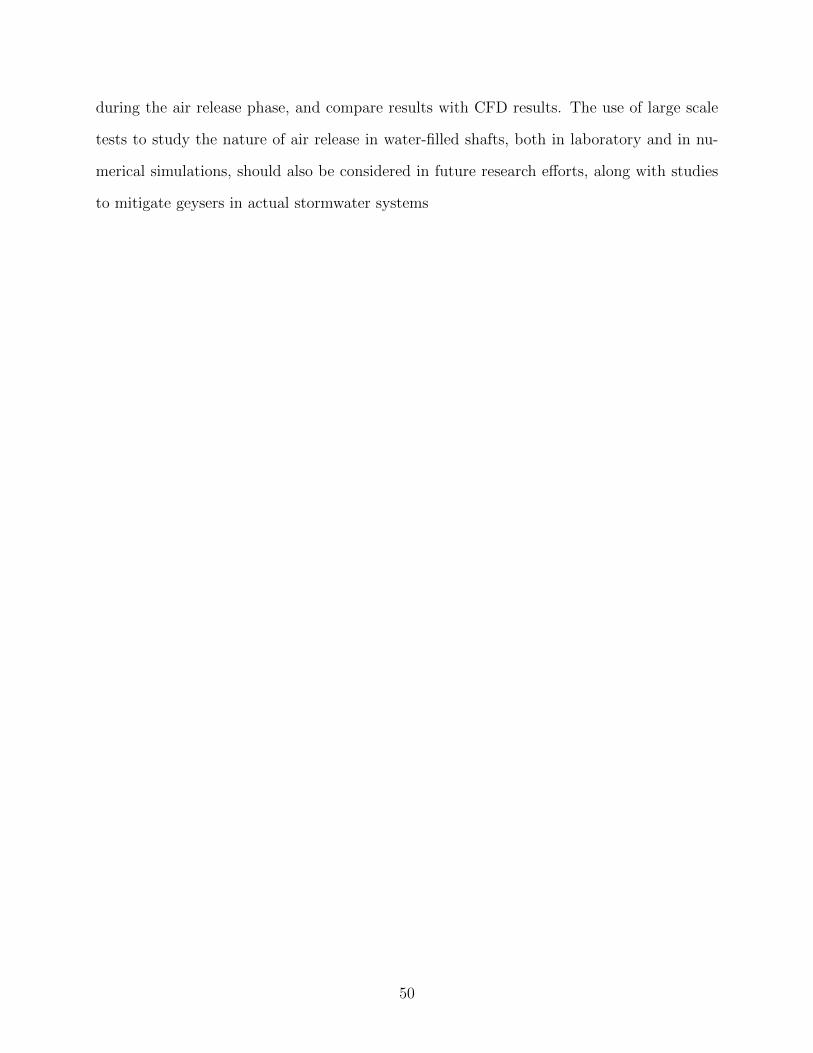
5.15 Displacement results for shafts extended into the horizontal pipe compared with
normal test runs. . . . . . . . . . . . . . . . . . . . . . . . . . . . . . . . . . . . 46
5.16 Velocity results for shafts extended into the horizontal pipe compared with normal
test runs. . . . . . . . . . . . . . . . . . . . . . . . . . . . . . . . . . . . . . . . 47
viii

List of Tables
4.1 Tested Conditions . . . . . . . . . . . . . . . . . . . . . . . . . . . . . . . . . . 23
ix
Table of Contents
Abstract . . . . . . . . . . . . . . . . . . . . . . . . . . . . . . . . . . . . . . . . . . . ii
Acknowledgments . . . . . . . . . . . . . . . . . . . . . . . . . . . . . . . . . . . . . . iii
List of Figures . . . . . . . . . . . . . . . . . . . . . . . . . . . . . . . . . . . . . . . v
List of Tables . . . . . . . . . . . . . . . . . . . . . . . . . . . . . . . . . . . . . . . . ix
1 Introduction . . . . . . . . . . . . . . . . . . . . . . . . . . . . . . . . . . . . . . 1
1.1 Providing Relief to Stormwater Systems . . . . . . . . . . . . . . . . . . . . 3
2 Literature Review . . . . . . . . . . . . . . . . . . . . . . . . . . . . . . . . . . . 6
2.1 Operational Issues Linked to Rapid Filling of Stormwater Tunnels . . . . . . 6
2.2 Life Cycle of Air Phase in Stormwater Tunnels . . . . . . . . . . . . . . . . . 6
2.3 Air Pocket Motion . . . . . . . . . . . . . . . . . . . . . . . . . . . . . . . . 7
2.3.1 Horizontal Motion of Entrapped Air . . . . . . . . . . . . . . . . . . 7
2.3.2 Vertical Two-phase Flows . . . . . . . . . . . . . . . . . . . . . . . . 8
2.4 Uncontrolled Air Pocket Release in Stormwater Systems . . . . . . . . . . . 10
2.5 Knowledge Gaps . . . . . . . . . . . . . . . . . . . . . . . . . . . . . . . . . 12
3 Objectives . . . . . . . . . . . . . . . . . . . . . . . . . . . . . . . . . . . . . . . 13
4 Methodology . . . . . . . . . . . . . . . . . . . . . . . . . . . . . . . . . . . . . 14
4.1 Experimental Apparatus . . . . . . . . . . . . . . . . . . . . . . . . . . . . . 14
4.2 Experimental Procedure . . . . . . . . . . . . . . . . . . . . . . . . . . . . . 21
4.3 Experimental Variables . . . . . . . . . . . . . . . . . . . . . . . . . . . . . . 22
4.4 Procedure for Data Analysis . . . . . . . . . . . . . . . . . . . . . . . . . . . 23
5 Results and analysis . . . . . . . . . . . . . . . . . . . . . . . . . . . . . . . . . 25
5.1 Kinematics . . . . . . . . . . . . . . . . . . . . . . . . . . . . . . . . . . . . 25
5.1.1 Displacement of Air and Water within the Vertical Shaft . . . . . . . 25
x

5.1.2 Velocity . . . . . . . . . . . . . . . . . . . . . . . . . . . . . . . . . . 31
5.1.3 Background Flows . . . . . . . . . . . . . . . . . . . . . . . . . . . . 32
5.2 Pressure Head . . . . . . . . . . . . . . . . . . . . . . . . . . . . . . . . . . . 37
5.3 Geyser Series Snapshots . . . . . . . . . . . . . . . . . . . . . . . . . . . . . 41
5.4 Results Compared to CFD Model . . . . . . . . . . . . . . . . . . . . . . . . 42
5.5 Extended Shaft . . . . . . . . . . . . . . . . . . . . . . . . . . . . . . . . . . 45
5.6 Conclusion . . . . . . . . . . . . . . . . . . . . . . . . . . . . . . . . . . . . . 48
Bibliography . . . . . . . . . . . . . . . . . . . . . . . . . . . . . . . . . . . . . . . . 51
xi

Chapter 1
Introduction
As more people relocate from rural areas to more densely populated areas, urbanization
and land development progresses, leading to changes in land use and hydrological character-
istics of watersheds. The most common changes observed are increased runoff peak, runoff
volume, and reduced time to peak flow [ Goonetilleke et al., 2005]. Where there was once
a pasture, there is now a parking lot or a roadway. Where there was once a baseball field,
there is now a shopping mall. Where rainfall once infiltrated into the ground and became
part of the groundwater, it now creates overland flow. As the land is developed and highly
pervious surfaces like forests and grasslands are replaced with impervious surfaces such as
concrete and pavement, water collection systems with higher capacities are now necessary to
relocate this excess runoff. Even these systems may be overwhelmed by severe rain events,
requiring relief by some type of stormwater storage approach.
Parallel to increased runoff volume issues, there are also other issues related to stormwa-
ter quality. Urban stormwater runoff introduces various types of pollutants to receiving water
bodies [ Goonetilleke et al., 2005]. The result is damage to aquatic habitats caused by alter-
ing the ecosystem, changing the natural state of water bodies, among other problems. This
is particularly the case in combined stormwater/sanitary sewer systems, which are systems
that convey stormwater, domestic sewage, and industrial waste in the same pipe, as shown
in Figure 1.1. During most rain events, stormwater and wastewater in combined sewer sys-
tems is collected and routed to wastewater treatment plants where it is treated to reduce
pollutants before it is discharged into a receiving water body. Intense rain events can exceed
the capacity of the sewer collection system, triggering combined sewer overflow (CSO), de-
fined as spills of untreated discharges into natural water bodies [Shammas and Wang, 2011].
1

Figure 1.1: Diagram of a combined sewer system from the Huntington Sanitary Board
As urbanization increases for areas with combined sewer systems, large runoff volumes can
pressurize the flow in sewers and potentially lead to more frequent overflow episodes.
To counter environmental impacts created by human activities in watersheds, includ-
ing CSO events, the United States Environmental Protection Agency (EPA) has put forth
The Federal Water Pollution Control Act (Clean Water Act) in an effort to protect public
health and the environment. This act prohibits the discharge of pollutants to waters of the
United States from any point source other than those permitted by the National Pollution
Discharge Elimination System (NPDES) [Augustenborg and Duke , 2001]. This means that
any discharge of pollutants into United States water bodies must have a NPDES permit,
including but not limited to: pipes, ditches, channels, tunnels, conduits, or containers [Cook
and DeBell, 2002]. Since this act has gone into effect, billions of pounds of pollutants have
2

been stopped from entering the waterways. Yet forty percent of the nation’s waterbodies are
still unsafe for recreational uses [Cook and DeBell, 2002]. Although point source pollution
sources have been partially eliminated or controlled, there is still pollution caused by non-
point sources such as urban runoff. Some of the most prevalent urban runoff pollutants are
sediments, nutrients, pathogens, heavy metals, organics, and salts which are associated with
various land uses such as construction, agriculture, roadway use, etc. [Shammas and Wang,
2011].
1.1 Providing Relief to Stormwater Systems
As a result, there have been practices proposed to provide relief for stormwater collection
systems and prevent untreated sewage discharge. For lightly urbanized areas, relief for
overwhelmed drainage systems can be provided by grade-level reservoirs (e.g. detention
basins) next to a development. For highly urbanized areas, where there is not available
land to be used for this purpose, there are fewer effective strategies. One is to control the
inflow into the system by storing the water in below-grade reservoirs. Such reservoirs are
constructed with concrete or plastic just below the ground surface. During a major storm
event, excess storm water is stored there until it can be discharged gradually as to not
exceed the capacity of the drainage systems. These underground reservoirs are also useful
for improving the water quality because they act as settling basins. When the velocity of
the water significantly decreases, some of the suspended particles fall to the bottom of the
tank. As a result, there are maintenance requirements, and the tanks need to be accessible
in order to be cleaned.
One dramatic case of issues with stormwater systems was the city of Chicago, which
was having major problems with CSO discharge. The pipes were aged and undersized for
the amount of urbanization that has occurred in the city over the last few decades. When
there was a rain event, it caused the combined system to overflow into the surrounding water
3

bodies in 600 locations for more than 100 days per year (EPA website). This problem was so
severe that when storms were large, the direction of the rivers was reversed (EPA website).
The area became so polluted that sewage would back up into homes, aquatic life van-
ished, and the shoreline along Lake Michigan (the source of drinking water) was frequently
off limits for recreational purposes. In 1972 the city developed the Tunnel and Reservoir Plan
(TARP) in order to conform to the Federal and State water quality standards, to protect
Lake Michigan, and to reduce flooding in the city. Their strategy is as follows: stormwater
is collected in large-dimension below-grade stormwater tunnels. As there is capacity in the
water reclamation plant, the stormwater is pumped from the tunnels to the plant, making
room in the tunnels for the next rain event. This phase has been completed. The phase
in progress is 3 large reservoirs that will together store 20.5 billion gallons (about 775,000
m3) of CSO during stormwater events, saving over $130 million in annual flood damage and
protect $1.5 million structures from flooding (EPA website). Figure 1.2 shows a map of the
current project status of the TARP project in Chicago.
While designated to address CSO issues, the tunnels created other issues. One opera-
tional problem in multiple stormwater systems, including Chicago’s TARP, is the occurrence
of stormwater geysers, defined by Vasconcelos and Wright [2011] as the return of conveyed
water from sewers and storage tunnel systems back to grade in an uncontrolled fashion.
Often times, such occurrences are characterized by jets of air-water mix rising through man-
holes and other vertical structures. With air-water mixtures traveling rapidly and forcefully
through vertical shafts, their occurrence can be very damaging and result in a number of
deleterious impacts such as excessive surging, overflows, large pressures, manhole lid dis-
placements, among others. In such conditions, these systems can contribute to negative
impacts to the environment and public health as well as costs associated with related struc-
tural damage. While relevant, research towards better understanding this phenomenon and
implementing mitigation techniques is very limited.
4

Figure 1.2: Map of current progress for Chicago’s TARP from
5

Chapter 2
Literature Review
This chapter summarizes past research and knowledge related to air pocket formation,
horizontal and vertical air pocket motion, and how this impacts stormwater systems. This
is followed by an introduction to the relevance of these topics to geyser formation and
occurrence as well as knowledge gaps within the subject area.
2.1 Operational Issues Linked to Rapid Filling of Stormwater Tunnels
Stormwater systems can present a variety of operational problems when subjected to
rapid inflow conditions associated with intense rain events. Such operational problems in-
clude excessive surging, overflows, large pressures, manhole lid displacements, among others.
In such conditions, such systems can create negative impacts to the environment and pub-
lic health, as well costs associated with related structural damages. The presence of large,
entrapped air pockets in stormwater systems have the potential of worsening some of these
problems. For instance, if entrapped air accumulates at a high point within the tunnel
system, there will be a partial blockage of flow, reducing the capacity of the system. The
presence of any size air pocket changes the dynamics of the system and changes the flow
characteristics including velocity, pressure, and compressibility [Vasconcelos and Wright,
2011].
2.2 Life Cycle of Air Phase in Stormwater Tunnels
There are two general types of air pocket formation related to stormwater systems.
Ramezani et al. [2016] presents various ways in which air is introduced into a stormwater
6
system including water plunging in trop shafts, dissolved air in saturated water, leaky valves,
rapid infilling and pump inlets.
When small air bubbles enter into the system, they collect in the high points of the
system and combine to form larger air pockets. This process is referred to as air entrainment.
Much research has been done on this problem [Chanson, 1996].
Conversely, when large amounts of air become trapped in the system due to events such
as rapid filling, this is referred to as air pocket entrapment. Air is initially present in stormwa-
ter systems prior to filling process, and in general is displaced by water inflows and released
through available ventilation points. Based on experimental observation, when inflow rates
are gradual, pressurization interfaces are nearly horizontal and air pocket formation is not
observed [Patrick and Vasconcelos, 2015]. However, when rapid inflows are observed, various
air pocket formation mechanisms can take place, as demonstrated in experiments by Li and
McCorquodale [1999], Vasconcelos and Wright [2006], among others.
Following entrapment, air pockets may move, as detailed in the next section. As pockets
move, they may be subject to compression and expansion and at certain locations can be
expelled. This expulsion may lead to displacement of water, which in turn can lead to
geysering problems.
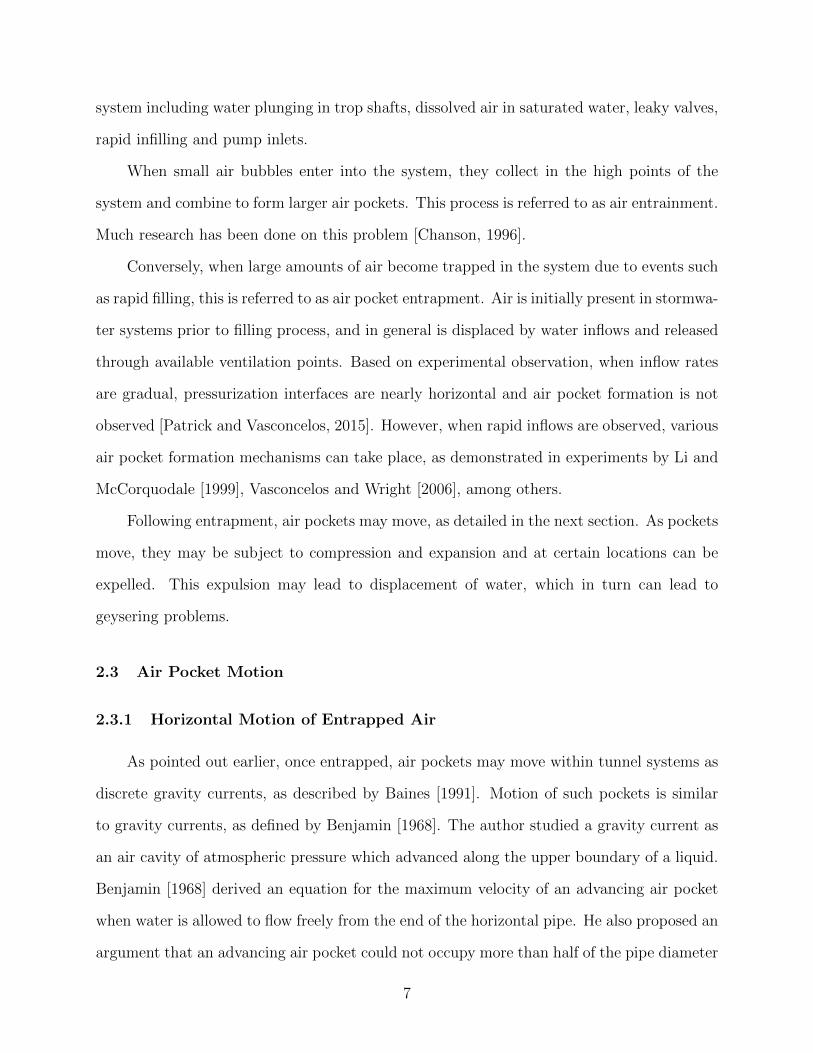
2.3 Air Pocket Motion
2.3.1 Horizontal Motion of Entrapped Air
As pointed out earlier, once entrapped, air pockets may move within tunnel systems as
discrete gravity currents, as described by Baines [1991]. Motion of such pockets is similar
to gravity currents, as defined by Benjamin [1968]. The author studied a gravity current as
an air cavity of atmospheric pressure which advanced along the upper boundary of a liquid.
Benjamin [1968] derived an equation for the maximum velocity of an advancing air pocket
when water is allowed to flow freely from the end of the horizontal pipe. He also proposed an
argument that an advancing air pocket could not occupy more than half of the pipe diameter
7

without the motion being stalled. These findings are useful for general design and for the
prediction of air-pocket behavior, but there are further questions on their application when
considering the behavior of air-pockets when they reach a ventilation point. The pocket
celerity will depend on various factors, such as air pocket volumes, existence of background
flows, opposition between buoyancy and drag forces, etc. [Chosie et al., 2014]. All of this
information can be used when selecting ventilation points because it has been observed in
experiments that when an air pocket of significant volume arrives at the base of a water-filled
ventilation shaft, these pockets will move vertically [Vasconcelos and Wright, 2011; Lewis
and Wright, 2012] and may displace water.
2.3.2 Vertical Two-phase Flows
The rise of gas pockets in vertical liquid columns has been studied in other contexts
to some extent, but not as extensively in the context of unsteady stormwater flows. When
liquid and gas phases are simultaneously flowing through pipes, it is defined as two phase
flow. Various flow patterns can be identified according to the relative flow rate of these phases
in closed conduits. The characterization and prediction of the interaction between the two
fluid phases is relevant for safety purposes. The most common flow regime classifications are
as follows: bubbly, slug, semi-annular, annular, and mist [Morgado et al., 2016], diagrammed
in Figure 2.1.
When gas is introduced at a low flow rate into a liquid flow, discrete gas bubbles form
throughout the liquid, which is classified as bubbly flow [Shaban and Tavoularis, 2014]. As
the flow rate of the gas injection increases, the amount of bubbles increases, causing more
collision among the small bubbles. As a result of the collision, larger bubbles are formed,
leading to the transition from bubbly flow to slug flow. Slug flow is characterized by large
upward moving bubbles occupying most of the cross sectional area of the vertical pipe. These
large bubbles, called Taylor bubbles, are shaped like bullets and are separated by regions of
bubbly flow [McQuillan and Whalley, 1984]. Liquid from the slug of water above the bubble
8
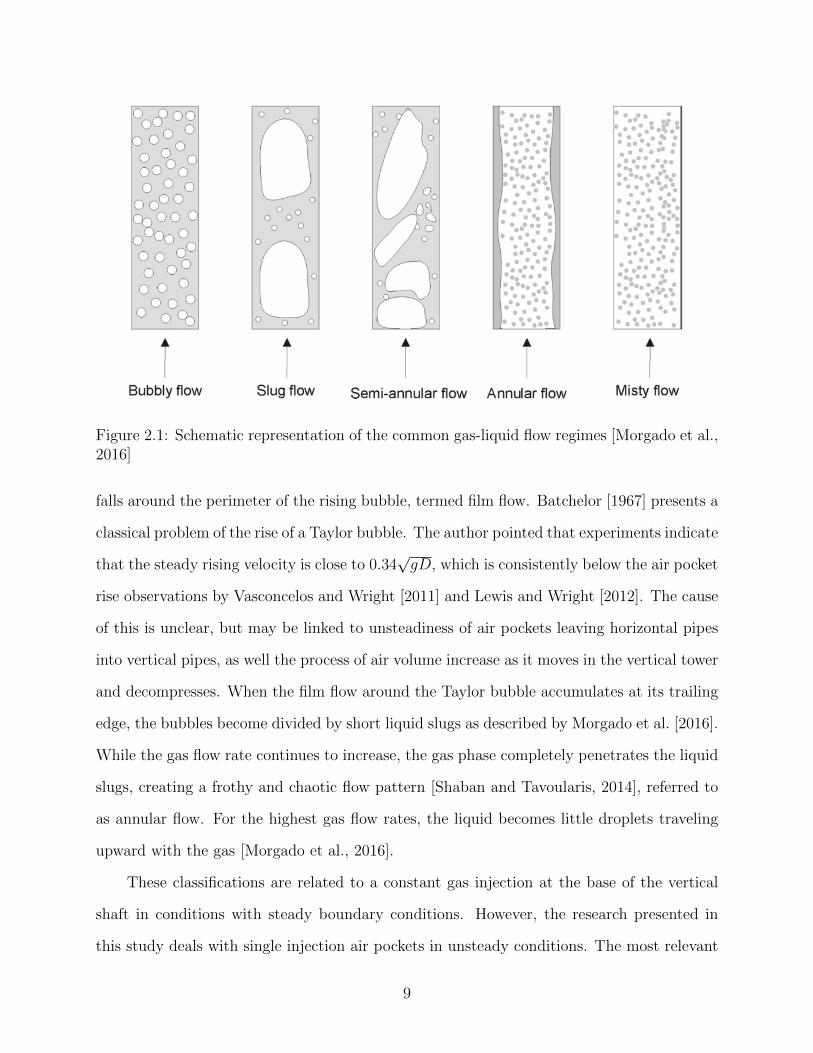
Figure 2.1: Schematic representation of the common gas-liquid flow regimes [Morgado et al.,2016]
falls around the perimeter of the rising bubble, termed film flow. Batchelor [1967] presents a
classical problem of the rise of a Taylor bubble. The author pointed that experiments indicate
that the steady rising velocity is close to 0.34√gD, which is consistently below the air pocket
rise observations by Vasconcelos and Wright [2011] and Lewis and Wright [2012]. The cause
of this is unclear, but may be linked to unsteadiness of air pockets leaving horizontal pipes
into vertical pipes, as well the process of air volume increase as it moves in the vertical tower
and decompresses. When the film flow around the Taylor bubble accumulates at its trailing
edge, the bubbles become divided by short liquid slugs as described by Morgado et al. [2016].
While the gas flow rate continues to increase, the gas phase completely penetrates the liquid
slugs, creating a frothy and chaotic flow pattern [Shaban and Tavoularis, 2014], referred to
as annular flow. For the highest gas flow rates, the liquid becomes little droplets traveling
upward with the gas [Morgado et al., 2016].
These classifications are related to a constant gas injection at the base of the vertical
shaft in conditions with steady boundary conditions. However, the research presented in
this study deals with single injection air pockets in unsteady conditions. The most relevant
9

flow regimes to this study are slug flow and annular flow. The air pocket enters the vertical
shaft as a large bubble, which would be classified as slug flow. As it travels up the shaft
and the film flow accumulates behind the bubble, a wake is created resembling annular flow.
Because there is not another gas injection, the remaining water in the vertical shaft becomes
annular flow as the gas bubble disperse. In some cases, the mist regime occurs after the slug
of water above the air pocket is ejected from the vertical shaft.
2.4 Uncontrolled Air Pocket Release in Stormwater Systems
Vertical air pocket motion may create displacement of water ahead of the pocket, which
in turn can lead to discharges of a mix of air and water from the top of these towers. This
uncontrolled air pocket release phenomenon is referred to as stormwater geyser, often charac-
terized by jets of air-water mix rising through manholes and other vertical structures. Geyser
occurrence may create highly explosive discharges of poor quality conveyed runoff, which can
be very damaging and result in a number of deleterious impacts. While relevant, research
towards better understanding this phenomenon and implementing mitigation techniques is
still limited. Designers for stormwater systems do not have enough guidelines to conceive
drop shaft designs that are safe against the impacts of uncontrolled air pocket release.
An initial investigation on the phenomenon of geysers was presented by Guo and Song
[1991], who were among the first to observe that intense rain events led the rapid filling of
the TARP system in Chicago, which in turn created geysers. The mechanism presented by
the authors did not consider the possibility of two-phase flows, so geysering would be a result
of mass oscillation processes within tunnel reaches. While a feasible mechanism, Wright et al
[2011] pointed out that this mechanism would not be consistent with some of the geysering
episodes that have been observed, which are characterized by large discharges of air. In this
same work, Wright et al [2011] presented field measurements of an actual geysering episode
recorded in Minnesota. While geysers were reported, piezometric pressure heads have not
exceeded grade elevation. This is an important and troublesome characteristic of geysering
10

phenomena since it indicates that even if surge levels do not exceed grade elevation geysers
may occur.
Another interesting experimental study related to the release of air phases in vertical
pipes was presented by Guedes de Carvalho et al. [2000]. The authors describe flood in-
stability as a phenomenon created when liquid film flow moving downward in the vertical
pipes has its interface roughed by a central upward gas flow. As this counter current flow
increases, the gas-liquid interface may show waves and liquid detaches from the downward
flow and travels upward with the gas pocket. They consequently found that this caused a
steep increase in the pressure gradient along the gas pocket. The authors proposed a scal-
ing law relating the onset of flooding instability with the density of the gas phase rising in
vertical tubes. It was shown that slugs of air with larger density rising in vertical pipes can
have an earlier onset of flooding instabilities when compared to conditions where air is in
atmospheric pressure. It is possible that the shearing process created by flooding instability
could explain some of the spray characteristics of stormwater geyser releases, however this
possibility has not been explored as of today.
Other contributions to the understanding of geysering processes have occurred with
respect to the numerical modeling of these episodes. The work by Guo and Song [1991] was
possibly the first one that attempted to describe the geysering phenomenon, albeit in a single-
phase discharge conditions. Alternative approaches were proposed that consider the case of
the water displacement caused by the rise of an air slug. A model based on lumped inertia
analysis was presented in Vasconcelos and Wright [2011] and further developed by Lewis and
Wright [2012] for the case when the air release occurs amid sustained water pressure in the
system. The models were successful in representing the experimental conditions presented by
the authors, but failed in attempting the describe the severity of actual geysering episodes.
Shao [2013] developed a 2-D CFD model that used the volume of fluid to compute gey-
sers. It was determined that small pockets do not create large displacements, whereas larger
air pockets create large displacements of water and significant air phase flows upon pocket
11
breakthrough. Another study that has implemented CFD to study geysers was presented
by Choi et al [2014], which applied results by Vasconcelos and Wright [2011] to describe
the characteristics of geysers created by the release of air pockets in laboratory conditions.
The model was able to qualitatively represent some of the measured flow features during the
experimental geysering episodes. However, large-scale conditions of actual geysering events
pose other modeling challenges (e.g. air phase compressibility) that were not explored in
either one of these CFD investigations. An interesting study by Catano-Lopera et al. [2014]
involved the use of CFD models to simulate operational issues with the TARP system in
Chicago. However, there was not an attempt in that work to systematically evaluate flow
conditions related to uncontrolled air releases for geometry parameters, initial water levels
and varying entrapped air pocket releases.
2.5 Knowledge Gaps
In summary, geysers are a relevant operational issue that may impact the operation of
stormwater systems, but are still not fully understood. Experiments have been performed to
evaluate these conditions and some of these investigations have provided relevant insights on
this issue. There are difficulties in scaling these experiments considering both air and water
phases, so large-scale experiments should be able to offer more details on this phenomenon,
as well as support the development of models. Current multiphase flow literature does not
discuss the unsteady conditions linked to uncontrolled release of air from pressurized systems.
Model developments have been limited, and included simple, lumped inertia approaches as
well more complex alternatives using CFD tools. However, these models have not been
calibrated with larger scale experimental data, and have not been applied in larger scales
that are similar to conditions in actual stormwater systems. This work attempts to address
some of these knowledge gaps that have thus far been identified.
12

Chapter 3
Objectives
This work presents results of experimental and numerical investigations on the geysering
created by the release of air pockets of finite volume from stormwater systems in pressurized
flow conditions. The work has two specific objectives: 1) to perform observations of these
events in large-scale experiments on air pocket release, along with data collection; and 2) to
supply experimental results for the calibration of a CFD modeling tool that describes the
essential features of a geysering event. The methodology for experimental and numerical
investigation is presented next, followed by a section presenting and discussing results of this
research, and finally conclusions and recommendations for future work.
13

Chapter 4
Methodology
4.1 Experimental Apparatus
The experimental apparatus was a scale model of a portion of a stormwater storage
tunnel, shown in Figure 4.1. The apparatus included a 13.7-m long clear PVC pipeline,
with diameter Dt equal to 302-mm. This near-horizontal pipeline has two reservoirs (volume
1.1 -m3) supported by wooden structures connected to both the upstream and downstream
ends, and were used to sustain pressures in the system during the air pocket releases. About
10.7-m from the upstream point of the horizontal pipeline there was a tee connection, in
which vertical shafts (4.7-4.9 m long) of varying diameters (102-mm, 153-mm and 202-mm)
were installed. Most of the experiments involved water in quiescent conditions, with a few
cases performed with background flows.
Attached near the upstream end of the 302-mm horizontal apparatus, there was a 6-
m long, 202-mm diameter clear PVC spur pipeline that served as an air chamber to store
a known volume of air. This air phase was set at preselected pressures values that were
represented the same pressures in the water side of the apparatus prior to the air pocket
release. Halfway within this air chamber, a knife gate valve allowed for volume of air V of
either 100 or 200-L to be stored prior to release.
In order to characterize the release of the air pocket, the following instruments were
used:
• Three piezo-resistive pressure transducers (one MEGGITT-ENDEVCO 8510C-50 rated
at 0.34-MPa, and two MEGGITT-ENDEVCO 8510C-15 rated at 0.103- MPa), shown
14

Figure 4.1: Top: Picture of apparatus used in experiments. Bottom: Sketch of apparatusused in experiments.
15

in Figure 4.2, installed at 0.6-m and 9-m from the upstream end of the horizontal
pipeline and one 1.2-m up the vertical shaft (Figure 4.2);
• National Instruments NI-USB6210 data acquisition board sampling pressures at a fre-
quency of 200-Hz (Figure 4.3);
• Two Extech HD750 differential pressure manometers (Figure 4.4), one immediately
downstream from the air chamber and the other at the base of the vertical shaft(Figure
4.4);
• Vectrino Acoustic Doppler Velocimeter (ADV) sampling at 25-Hz located 7.5-m down-
stream from the isolation valve, (Figure 4.5);
• Digital HD camcorder, recording the advance if the air-water interface at 30 frames
per second;
16

Figure 4.2: one MEGGITT-ENDEVCO 8510C-50 rated at 0.34-MPa, and two MEGGITT-ENDEVCO 8510C-15 rated at 0.103- MPa
17

Figure 4.3: National Instruments NI-USB6210 data acquisition board
18

Figure 4.4: Extech HD750 differential pressure manometer
19
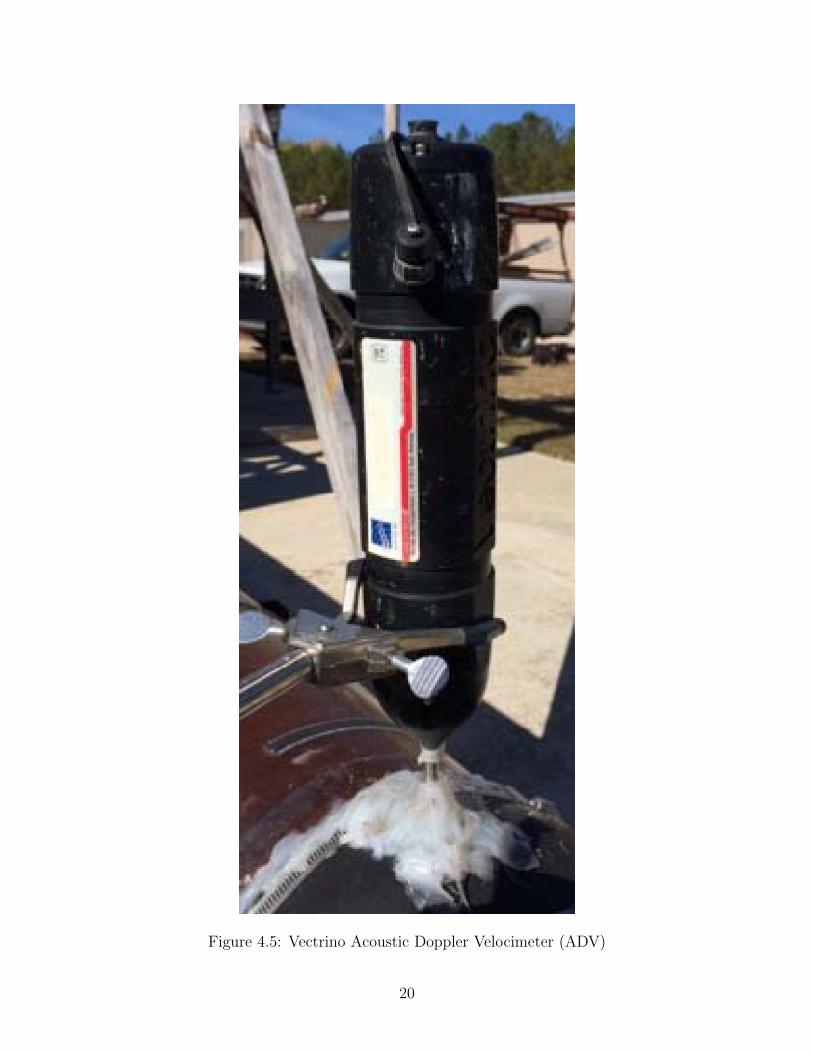
Figure 4.5: Vectrino Acoustic Doppler Velocimeter (ADV)
20
4.2 Experimental Procedure
A brief description of the experimental run is as follows. Initially the apparatus was
filled with water to a intermediate level within the vertical shaft. A known air volume in the
air chamber was pressurized to a level that was similar to the one observed in the vertical
shaft. Upon the opening of the knife-gate valve linking the air chamber to the water-filled
horizontal pipe, the air pocket was released and advanced in the horizontal pipeline until
it reached the base of the vertical shaft. Water levels in the shaft varied during the rise
of the air pocket, as described by Vasconcelos and Wright [2011], and in various cases the
level reached the upper end of the shaft, characterizing a geyser event. A 302-mm knife gate
valve at the upstream end of the horizontal pipeline (302-mm) was partially closed during
experiments. This prevented the released air from returning to the upstream water reservoir.
The experimental procedure was performed as follows:
1. With the air chamber knife gate valve closed, the apparatus was filled with water to a
piezometric head about 2.7-m with respect to the horizontal pipe invert;
2. Water was in quiescent conditions prior to air release. In the cases that background
flows were used, recirculation pumps created a water velocity of about 0.25-m/s in the
pipe;
3. The air compressor was turned on and the air pressure in the chamber was adjusted
to approximately match the water pressure within the horizontal pipe in an attempt
to reduce the amplitude of inertial oscillations in the ventilation tower upon opening
the air chamber valve;
4. Data collection from the pressure transducers, ADV, and video camera was started
and the initial manometer readings were recorded;
5. The gate valve to the air chamber was quickly opened (around 0.5 second) with one
swift motion to allow the sudden release of the air pocket;
21

6. Upon release, the entrapped air pocket advanced in the system toward the vertical
shaft similarly to a cavity described by Baines [1991] and Chosie et al. [2014];
7. After about 10 seconds, the air pocket arrived at the base of the vertical shaft, causing
the displacement of the water present in the shaft;
8. After steady state was reached, final pressure measurements were recorded with manome-
ters and all data recording devices were turned off.
4.3 Experimental Variables
Two main experimental variables were used in the proposed experiments: the ventilation
shaft diameters and the volume of air pockets released. Three diameter values were used:
D∗ = 0.33, 0.50 and 0.67 (ranging from 102-mm to 202-mm). Two air pocket volumes
were used: V ∗air = 3.5 and 7.0 (100 L and 200 L). Some experiments were performed with
background flows (creating velocities around 0.25 m/s) Most experimental conditions were
repeated at least three times in order to ensure consistency of the experimental results.
Table 4.1 outlines the combinations of variables that were tested in this study.
22

Table 4.1: Tested ConditionsTunnel Shaft D*= Vair Vair*= Background
dimension Dt (m) diameter D (m) D/Dt (L) Vair/D3t flows (y/n)
0.30 0.10 0.33 100 3.5 No0.30 0.10 0.33 100 3.5 Yes0.30 0.10 0.33 200 7.0 No0.30 0.10 0.33 200 7.0 Yes0.30 0.15 0.50 100 3.5 No0.30 0.15 0.50 100 3.5 Yes0.30 0.15 0.50 200 7.0 No0.30 0.15 0.50 200 7.0 Yes0.30 0.20 0.67 100 3.5 No0.30 0.20 0.67 100 3.5 Yes0.30 0.20 0.67 200 7.0 No0.30 0.20 0.67 200 7.0 Yes
4.4 Procedure for Data Analysis
Once the experimental runs were complete, the data analysis process was initiated.
Videos were downloaded and visually analyzed to determine the vertical displacement of
both the air pocket (air-water interface, or YInt) and the free surface of the water within the
vertical shaft (referred to as YFS). This was done by progressing frame by frame through
the videos and noting the time at which each surface reached the marks on the vertical shaft
at 0.30-m intervals. Then this data was used to calculate the velocity associated with YInt
and YFS motion by dividing the distance traveled over elapsed times.
Values for vertical displacements and velocities, air pocket volume and vertical tower
diameters were normalized, and starred variables * refer to the normalized versions of the
variables. Vertical displacement measurements were normalized by the length of the vertical
shaft L (Equations 4.1 and 4.2). Velocities of the free surface VFS or the vertical air-water
interfaces VInt were normalized by√gD (Equations 4.3 and 4.4). Air pocket volumes Vair
were normalized by D3t (Equation 4.5), whereas vertical tower diameters D were normalized
by the horizontal pipe diameter Dt (Equation 4.6).
23
Y ∗FS = YFS/L (4.1)
Y ∗Int = YInt/L (4.2)
V ∗FS = VFS/
√gD (4.3)
V ∗Int = VInt/
√gD (4.4)
V ∗air = Vair/D
3t (4.5)
D∗ = D/Dt (4.6)
The testing conditions presented in this study included three vertical shaft diameters
and two air pocket volumes. The three ventilation shaft diameters used were D*=0.33,
0.50 and 0.67, with air-pocket volumes V*= 3.5 and 7.0, with and without the presence
of background flows. Most experimental conditions were repeated three times in order to
ensure consistency of the experimental results.
Pressure transducer data was sampled at 200 Hz frequency. This voltage data was then
converted into pressure head readings based on the linear relationship between voltage and
pressure. The initial and final pressure head values, measured with an accuracy of 0.01 m,
were used for calibration. Considering the 3% error associated with the pressure transducers,
the accuracy of the pressure head readings at the base of the tower and the air-inlet junction
are 0.03 m and the accuracy of the pressure head readings in the tower are 0.10m.
24

Chapter 5
Results and analysis
5.1 Kinematics
As pointed out earlier in the experimental procedure, the tests begin with an initial
water level of about 2 m in the vertical shaft, measured from the base of the visible vertical
tower. The opening of the 202-mm knife gate valve released the air pocket into the system.
Even though the air pressure matched the initial water piezometric pressure in the apparatus,
a few inertial oscillations were observed on the shaft upon the valve opening, which lasted
few seconds. The air pocket travels in the horizontal tunnel toward the vertical shaft with
a celerity of around 0.9-m/s. By the time when the pocket arrived near the base of vertical
shaft, the inertial oscillations were not significant.
5.1.1 Displacement of Air and Water within the Vertical Shaft
In most of the tested cases the water displacement exceeded 2.7 m, which led to geysering
through the top of the shaft. It is important to state that the geysering criteria used in this
study is based on the release of a slug of water ahead of the rising air pocket rather than the
splash of water created in the tower during the release, which is used by some other studies.
However, the releases were characterized by a significant mix of air and water, many times
with an explosive nature. In a few of the tested cases there was more than one discharge
of water through the top of the shaft. Following the air-water discharge, a complex flow
pattern with smaller slugs and bubbles rising was observed in the vertical tower which lasted
for a few seconds. The water level at the top of the shaft also presented inertial oscillations
following the air discharge for various seconds afterwards.
25

The vertical trajectory of the air pocket interface and the free surface as they travel up
the vertical shaft is presented in Figure 5.1. All test runs are presented for each combination
of pocket volume and vertical shaft diameter with no background flows. The error related
to both the time (≈ 0.03 s) and the vertical coordinate measurements (≈ 0.08m) are small
and not represented on the figure. All cases showed a rise of both air-water interface and
free surface, and the curved trajectories observed for D∗ = 0.33 and D∗ = 0.50 indicate
that both free surface and interface velocities increased over time. However, for the single
case were geysers were not reported (D∗ = 0.67, V ∗air = 3.5) the free surface level achieved
a maximum elevation and receded prior to the breakthrough of the air pocket (YFS=YInt).
This type of outcome in air pocket release processes has not been reported in earlier related
investigations and indicate that the trajectory of water is not always monotonic.
When compared to normalized displacement results presented by Vasconcelos and Wright
[2011], the results presented in this study vary when considering the acceleration of both the
leading edge of the air pocket (air-water interface, or interface) and the surface of the water
in the shaft that is open to the atmosphere (free surface). As shown in Figure 5.2, the tra-
jectory of both free surface and air-water interfaces are curved, whereas comparable results
presented by Vasconcelos and Wright [2011] indicated linear trajectories. This is attributed
to the current experimental apparatus sustaining pressures during air release, unlike the
work by Vasconcelos and Wright [2011]. Expansion of the air pocket during the release pro-
cess may also account for this curved trajectory of the free surface and air-water interface.
A difference between the present findings and the results from Wright [2013] is related to
the normalized pocket size after which the normalized height at which the air pocket breaks
through the free surface becomes constant. The previous study by Wright [2013] pointed
out that this volume is V ∗air ≈ 4. The present measurements, however, indicate significant
differences in the outcome of the pocket volume release of V ∗air = 7 through a D∗ = 0.67
shaft, whereas a V ∗air ≈ 3.5 in same conditions did not resulted in a geyser.
26
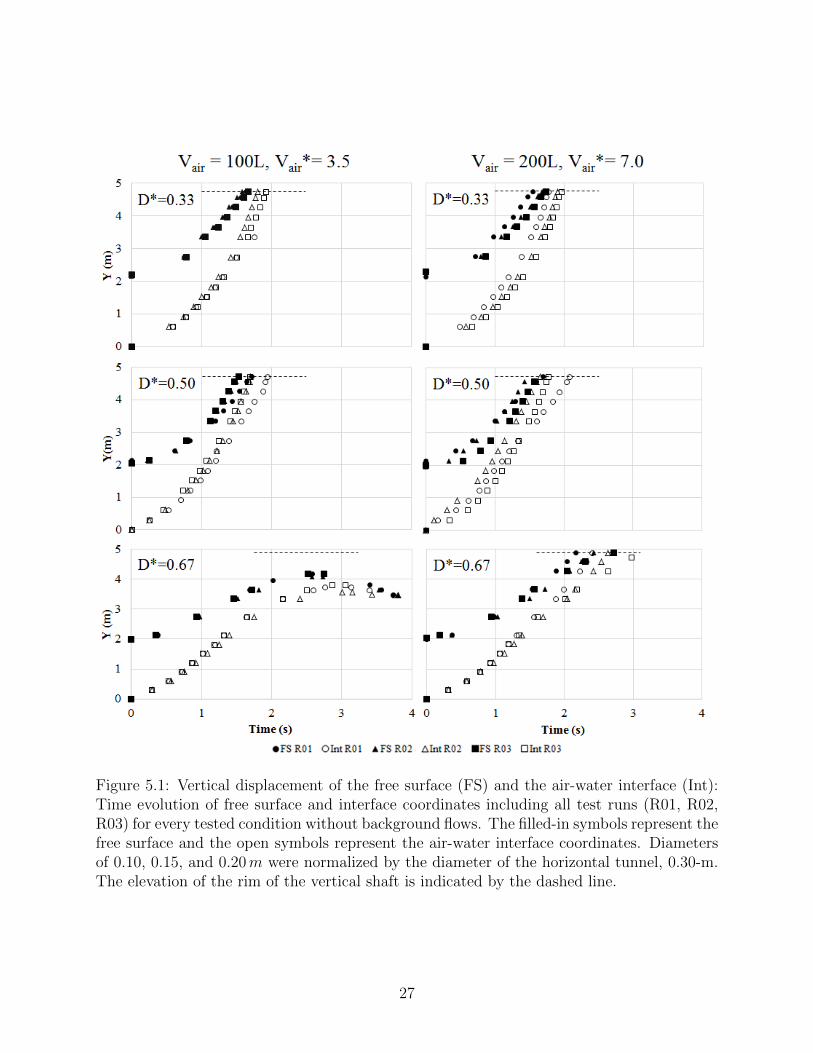
Figure 5.1: Vertical displacement of the free surface (FS) and the air-water interface (Int):Time evolution of free surface and interface coordinates including all test runs (R01, R02,R03) for every tested condition without background flows. The filled-in symbols represent thefree surface and the open symbols represent the air-water interface coordinates. Diametersof 0.10, 0.15, and 0.20m were normalized by the diameter of the horizontal tunnel, 0.30-m.The elevation of the rim of the vertical shaft is indicated by the dashed line.
27

Figure 5.2: Normalized displacement of the free surface and the air-water interface: Timeevolution of free surface and interface coordinates including all test runs (R01, R02, R03)for every tested condition without background flows. The filled-in symbols represent thefree surface (FS) and the open symbols represent the air-water interface (Int) coordinates.Diameters of 0.10, 0.15, and 0.20m were normalized by the diameter of the horizontal tunnel,0.30-m. The elevation of the rim is represented by the Y* value of 1.
28

Figure 5.3: Effect of varying diameters in YFS and YInt variation over time, in the absenceof background flows (only one repetition for each diameteris presented).
Figure 5.3, which compares the displacement over time among different diameters for
both air pocket volumes, indicates that for the D∗=0.33 and D∗=0.50 shafts there is not a
major difference between the progressions of the free surface up the vertical shaft. However,
for both air pocket volumes, the pocket initially travels up the D∗=0.50 shaft at approxi-
mately the same rate until it reaches 1-m. At this point, the pocket in the D∗=0.50 shaft
begins to move more quickly, and reaches the top of the shaft in slightly less time than the
pocket in the D∗=0.33 shaft. This may be caused by a larger imbalance between the down-
ward film flow rate and the displaced volume created by the air pocket rising in the D∗=0.50
shaft. Based on the continuity of the air phase vertical flow [Vasconcelos and Wright, 2011],
if the film flow rate was larger, the free surface would progress more slowly and it would take
more time for the air pocket to reach the rim of the shaft. Figure 5.3 also reveals that the
behavior of the air pocket is changed in the largest tested diameter, rising noticeable more
slowly than the air pockets in the smaller shafts.
When compared to normalized displacement results presented by Vasconcelos and Wright
[2011], the results presented in this study vary in terms of the acceleration of both the air
pocket and the free surface. As shown in Figure 5.2, when considering only the conditions
29

that produced a geyser, the data from this study shows a more parabolic trend whereas the
results presented by Vasconcelos and Wright [2011] show a more linear trajectory of both
air and water, with the free surface and the air-water interface meeting before they reach
the top of the vertical shaft. Even when considering the single case where a geyser does
not occur, the trajectory does not follow this trend. This contradiction can most likely be
attributed to the lack of a reservoir to maintain the pressures in the Vasconcelos and Wright
[2011] study.
For all tested cases, the displacement of the free surface, ∆YFS, reached or exceeded
2.0 m, with most of the cases displacing more than 2.7 m, as seen in Figure 5.1. When
this assumed free surface displacement is normalized by the tunnel diameter, ∆YFS/Dt, the
result is 9 for all cases that resulted in geysers. These results are in general smaller than the
ones presented in Wright [2013]. This could be linked to the difference in air pressure head
between this work (≈2.7 m) and the previous work (≈0.5 m). An important result from
these study is that even with D∗ = 0.67 there was a significant amount of water displaced.
One major difference to be observed between these two works is the effects of the air pocket
size on the displacement. Wright [2013] states that after a certain normalized pocket size
(V*≈4) the height at which the air pocket breaks through the free surface becomes constant
when normalized by the tunnel diameter and approaches a value of about 12. However, the
results in the study do not fully support this conclusion. For example, consider the bottom
row of Figure 5.1 showing the displacement results for the D∗ = 0.67 shaft. The left graph is
for the V ∗air = 3.5 air pocket and the right graph is for the V ∗
air = 7.0 case. As shown, for the
smaller air pocket, the amount of water displaced is about 2 m before the air pocket breaks
through the free surface, making the normalized displacement about 6.67. When compared
with the results for the V ∗air = 7.0 air pocket, with a normalized free surface displacement of
at least 9, limiting the application of Wright’s conclusion the V ∗air = 4 is the limiting value
for air pocket displacement.
30
Discussion on the effects of background flows on displacement can be found in the
following sections.
5.1.2 Velocity
The velocity results for the air-water interface and free surface were calculated from the
measured displacement of the flow features, and are presented in Figure 5.4. These results
indicate a slight decrease between D∗ = 0.33 and D∗ = 0.50, with the exception of two
data points from two different runs, and a more pronounced velocity drop for D∗ = 0.67.
It was noticed that the velocity for D∗ = 0.67 and V ∗air = 3.5 became slightly negative,
consistent with the receding free surface interface observed for this condition. In absolute
terms, velocity of rising air pockets were higher for the D∗ = 0.50 condition, slightly more
than D∗ = 0.33, a result that was not previously reported in related studies. The velocity
results do not present a steady behavior, but rather present a ”wobbling” pattern, which
may be linked to compression and decompression of the air pocket as it moved upward.
A more pronounced wobbling effect was also presented in Vasconcelos and Wright [2011].
Additionally, much faster growth of the air-water interface velocity is noticed when geysering
initiates. It is assumed that once the water is discharged at the top of the vertical shaft there
is a further increase in the pressure gradient experienced in the air phase, leading to even
faster upward motion.
The normalized velocity results for the air-water interface and free surface were calcu-
lated by dividing the calculated velocity by√gD, and are presented in Figure 5.5. Compared
to results presented by Vasconcelos and Wright [2011], these results are 3-4 times higher for
larger diameter shaft (D∗ = 0.607), with normalized velocities averaging in the range of 0.25-
0.5. For the smaller diameter shafts presented, the normalized velocity increased similarly
to the ones in the current study. This can possibly be attributed to the reservoirs in the
current experiment that maintained the pressure in the system during geyser occurrence.
31

5.1.3 Background Flows
Experiments were also performed with background flows in the horizontal pipe, created
by two recirculation pumps that would link the two water reservoirs above the water towers
through two 50-mm flexible hoses. The resulting average flow obtained with these two pumps
was in the order of 0.20 m/s to 0.30 m/s during typical experiments. The rationale for using
recirculation pumps was to create a larger volumetric displacement of the air pocket in the
horizontal pipe, under the assumption that this displacement would increase the amount of
admitted air in the vertical shafts. Indeed, the celerity of the air pocket leading edge in the
horizontal pipe was increased, and the propagation time of the horizontal pocket decreased
from 10 seconds to 8 seconds on average.
However, there were no significant changes in the behavior of the air release in the
vertical shaft. The added velocity has not influenced the amount of the air that entered the
vertical shaft, as the experimental results in the trajectories of the free surface and air-water
interfaces within the shaft indicate. By comparing Figures 5.1 and 5.6, it may be noticed that
the the case with D∗ = 0.67 and V ∗ = 3.5 presented larger displacement of the free surface
(about 15%) for the case with background flows. However, all other cases were very much
similar, both in terms of the trajectories of the free surface and in terms of the velocities of
the flow features.
32

Figure 5.4: Time evolution of the free surface and the air-water interface coordinates in-cluding all test runs (R01, R02, R03) for every tested condition without background flows.The filled-in symbols represent the free surface (FS) and the open symbols represent theair-water interface (Int) coordinates.
33

Figure 5.5: Time evolution of the normalized free surface and the air-water interface coordi-nates including all test runs (R01, R02, R03) for every tested condition without backgroundflows. The filled-in symbols represent the free surface (FS) and the open symbols representthe air-water interface (Int) coordinates.
34

Figure 5.6: Time evolution of the free surface (FS) and the air-water interface (Int) coor-dinates including all test runs (R01, R02, R03) for every tested condition with backgroundflows. The filled-in symbols represent the free surface and the open symbols represent theair-water interface coordinates.
35

Figure 5.7: Time evolution of the normalized free surface and the air-water interface velocitiesincluding all test runs (R01, R02, R03) for every tested condition with background flows.The filled-in symbols represent the free surface (FS) and the open symbols represent theair-water interface (Int) coordinates.
36

5.2 Pressure Head
Figure 5.8 presents pressure results measured from the moment when the air release
occurred for a representative case involving a 202-mm diameter shaft and V ∗air = 7.0, with
pressure recordings at the bottom (P2 transducer) and lateral (P3 transducer) of the vertical
shaft. The initial inertial oscillations are observed in Figure 5.8 approximately 10 seconds
prior to the instant when the air arrives in the vertical shaft. For that specific condition,
this inertial oscillation period (around 3 seconds) is altered when the air reaches the base
of the vertical shaft, as pressure results presented more erratic patterns. While the rise of
the air pocket and free surface interface over time are in general monotonic, as indicated in
Figure 5.1, it is speculated that small changes in air-water interface velocities can lead to
fluctuations in pressure recorded in the shaft.
Figure 5.8: Sample pressure head date from a 0.20 − m diameter shaft with a 200 − L airpocket. Captions indicate the progression of the air pocket.
37

Large swings in pressure read at the vertical shaft continue during the short period
where air-water discharge (geysering) occurred. After the geysering, air continued to mi-
grate upward in the shaft and the complex bubbly flow eventually approached single phase
conditions, with more regular mass oscillations at the end of the pressure hydrograph reflect-
ing this final condition as the reservoirs refilled the vertical shaft. Finally, the amplitude of
the pressure fluctuation observed in P3 was not as large as P2, and neither of the piezometric
pressure head values were large enough to reach the elevation of the vertical shaft rim.
Figure 5.9 presents a set of representative pressure data for the three diameters and both
air pocket volumes studied. The data sets were trimmed to display only the data for period
during the water upward motion in the vertical shaft. The range of pressure fluctuations was
decreased with the shaft diameter D, however the pressures did not exceed levels compatible
with the vertical shaft rim in any tested condition. Geysers occurred in all of these cases
between 2 and 3 seconds, but no clear trend in the pressure values was identified during
these releases. It was noticed that the largest pressure variations were observed in the
junction next to the location where the air phase was introduced in the system. Also it was
noticed that the largest variations in pressure occurred with the two smaller diameters for
the vertical shaft, whereas the cases with D∗=0.67 presented the smallest variation during
air release occurrences at the shaft. This points to the benefit of having large-diameter shafts
in mitigating pressure fluctuations in tunnel systems following uncontrolled air releases.
Figure 5.10 contains data from ”worst-case” tests from each of the shaft diameters with
a V ∗air = 7.0 air-pocket that supports the claim that the pressure heads observed in the
system were not sufficient to cause a geyser occurrence without additional forces such as the
interaction between air and water.
38
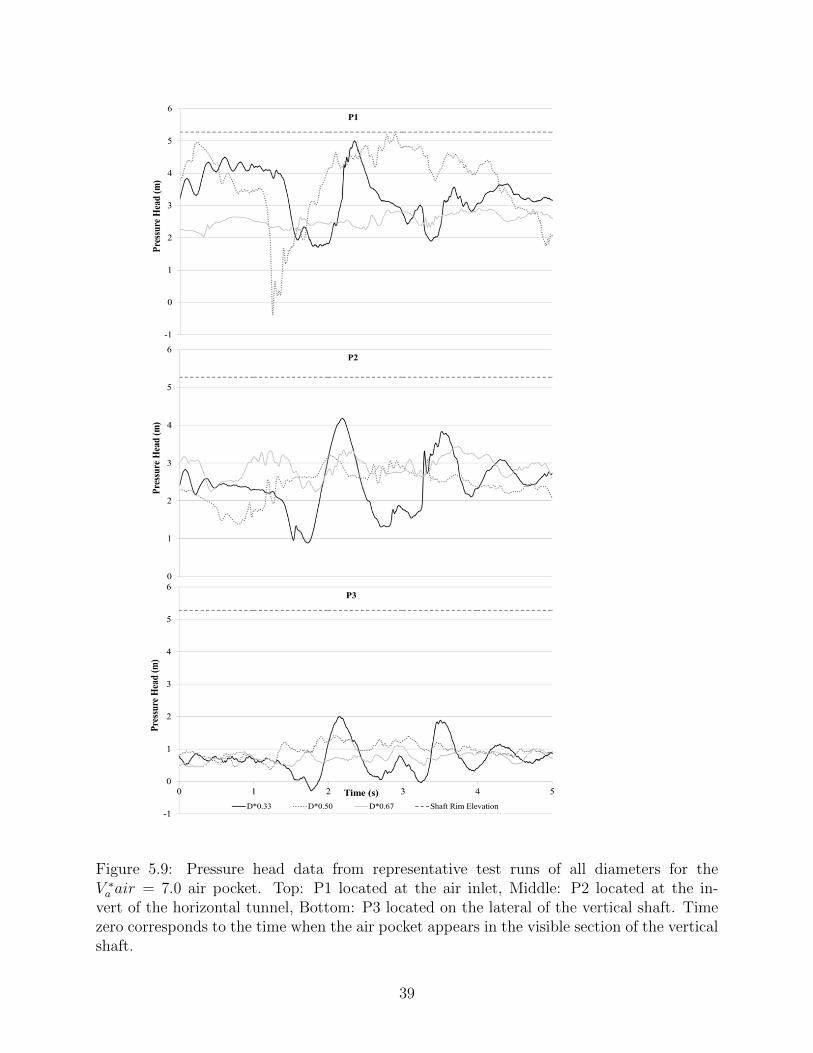
Figure 5.9: Pressure head data from representative test runs of all diameters for theV ∗a air = 7.0 air pocket. Top: P1 located at the air inlet, Middle: P2 located at the in-
vert of the horizontal tunnel, Bottom: P3 located on the lateral of the vertical shaft. Timezero corresponds to the time when the air pocket appears in the visible section of the verticalshaft.
39

Figure 5.10: Representative pressure head data measured from the bottom of the verticalshaft (P2) including all three shaft diameters with a 200− L air-pocket and without back-ground flows showing that the pressure heads never reach a magnitude large enough to causea geyser to occur.
40

5.3 Geyser Series Snapshots
A sequence of photos of the progression of a typical geyser event with relative time
stamps is presented in Figure 5.11, where Trel = 0 s corresponds to the time when the air
reached the visible part of the vertical shaft (Y ∗Int = 0). In the first frame (a), the free
surface was about 0.1m from the rim of the shaft (Y ∗ = 0.94) and the leading edge of the
air pocket was about 1m below at Y ∗ = 0.86. Frame (b) corresponds to the instant where
the free surface was at the rim of the shaft, Y ∗FS = 1 and the air pocket was 0.75m below
(Y ∗int = 0.84). This frame marks the onset of geyser event considered these investigation. As
shown in frame (c), the geysering event progressed as water above the air pocket continued
to be expelled like a slug until the air pocket breakthrough to atmosphere (Y ∗int = 1) about
0.1 s later, as captured in frame (d). While there was no direct measurement of air velocity
in these discharges, the CFD-simulated air pocket velocity in frame d is 8.15m/s, while in
frame (e) is 18.4m/s.
Figure 5.11 frames (e) and (f) shows a very complex interaction between the discharged
water and the air that is being discharged, which include a fragmentation of the water slug
that spread the air pocket several meters in the air. Such air velocities are feasible due to
a short-lived, but strong pressure gradient in the tower as soon as air pocket breakthrough
and escapes the vertical shaft. While it was not easily observed, it was also noticed a type
of ’mist’ following the water slug discharge in different tests. It is assumed that flooding
instability, such as presented in Guedes de Carvalho et al. [2000], could potentially have
occurred between the film flow moving downward along the pipe walls and the air pocket
moving upward. As water moved downward during the air release, a fraction of it could have
detached and entrained with the upward moving air pocket.
41

Figure 5.11: Progression of the geysering event from an experiment with a shaft diameterof 0.15-m, a 200-L=a air-pocket and no background flow. The bold line is the artificiallyexaggerated interface location. Each horizontal line along the pipe is 0.30-m apart. Thesimulated air pocket velocity when it reaches the top of the tower, shown in frame d, is8.15-m/s. The simulated velocity after the air exits the shaft is 18.36-m/s
5.4 Results Compared to CFD Model
A CFD model developed by Jue Wang has been applied for all experimental cases,
including three vertical shaft diameters and both 100L and 200-L air pockets. In general,
the solutions yielded comparatively good agreement with the experimental data, particularly
with respect to the simulated displacement of the rising water free surface and air-water
interface.
Figure 5.12 presents the comparison of the normalized displacement of the water free
surface in the shaft (YFS) and air-water interface of the rising air pocket (YInt). Time is
referenced to the instant when the air pocket leading edge becomes visible in the vertical
42

shaft. It can be noticed that the CFD modeling results match the measured data well,
considering the natural variability among experimental repetitions. This agreement improved
with the discretization, as is noticed comparing results obtained with the coarse mesh with
intermediate and fine mesh results. It is noticed that for both CFD and experimental results
the air pocket and water column above the pocket rising process ends within 2 seconds,
except for the results obtained with the coarse mesh.
Figure 5.12: Comparison of experimental and CFD model normalized free surface and air-water interface displacement.
Pressure head measured by transducer P3 (normalized by the shaft length L) are com-
pared to CFD predictions at that location in Figure 5.13. In this run, water levels at the
shaft were about 1 m above transducer P3 as the air pocket arrived in the shaft. Simulated
pressures presented the general trends observed during the experiments. This includes the
43

sharp pressure drop and rise after the pocket arrival at the shaft and the trend of maximum
and minimum pressure head oscillations. Results with the intermediate and fine meshes
were similar, and in general yielded a closer match to the events observed in the experiments
when compared to the coarse mesh results. Also, CFD-simulated pressure head results never
exceeded the shaft rim elevation, even during geysering occurrence. The CFD results were
not as accurate as the simulation of the YFS and YInt, as there was over-prediction of pressure
oscillations magnitude. There was also a time offset between the CFD prediction of the air
pocket arrival at transducer P3 and air pocket breakthrough at the shaft rim ranging from
0.1 to 0.2 seconds.
Figure 5.13: Comparison of experimental and CFD model normalized pressure head at trans-ducer P3 on the shaft side. Vertical dashed lines refer to the time in the simulations whena) air pocket leading edge reaches transducer P3 elevation; b) and air pocket breakthroughat shaft rim.
44

Results from this evaluation were considered positive, particularly with regard to the
predictions of the free surface and interface coordinates during air pocket release.
5.5 Extended Shaft
The displacement results from the V ∗air = 3.5 air pocket in the D∗ = 0.67 shaft, shown
in Figure 5.1, were the only cases that did not produce geysers. This led to a proposed
solution to mitigate the velocity and magnitude of displacement of both the free surface and
the air water interface. Perhaps, by controlling the volume of air that actually entered the
tower, geyser occurrence could be reduced.
By extending the base of the D∗ = 0.67 vertical shaft into the tee joint, presented in
Figure 5.14, the amount of air that could enter the vertical shaft was reduced. When a
V ∗air = 7.0 air pocket was released into the system, no geysers occurred, a case that showed
geysers in the previous set up. The likely cause of this is the decreased volume of air that
was able to enter the pipe.
This decreased the volume of the upward traveling air pocket, which lost momentum
before it reached the rim of the vertical shaft, as shown in Figure 5.15. In addition to no
geyser occurrence, the velocities also dramatically decreased, displayed in Figure 5.16.
45
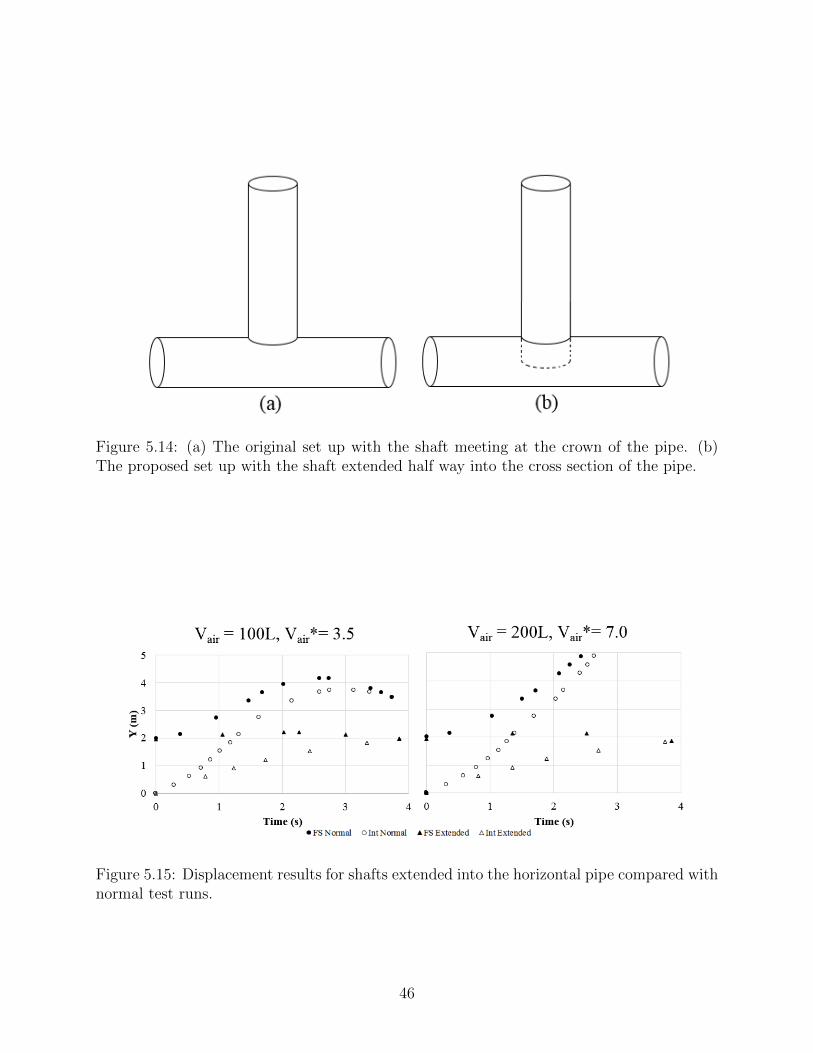
Figure 5.14: (a) The original set up with the shaft meeting at the crown of the pipe. (b)The proposed set up with the shaft extended half way into the cross section of the pipe.
Figure 5.15: Displacement results for shafts extended into the horizontal pipe compared withnormal test runs.
46

Figure 5.16: Velocity results for shafts extended into the horizontal pipe compared withnormal test runs.
47

5.6 Conclusion
The current work presented results from large-scale experimental tests of the release of
large air pocket volumes through water-filled shafts, triggering geysering episodes. While
such occurrences are severe and cause serious concern in actual stormwater systems, much
is still unknown about geysers and research efforts such as this one are still warranted.
Compared to most studies presented to date, the present investigation involved the use of
larger diameters for the horizontal and vertical components of the apparatus. The release
of air enabled the observation, in some cases, of strong discharges that exceeded several
meters in height and had explosive nature. In other cases a mist of very fine water particles
was observed when the water slug discharge was complete. These characteristics were not
reported in previous studies performed on smaller scales, such as Vasconcelos and Wright
[2011].
The understanding of the kinematics of the free surface motion within the shaft and the
air-water interface motion is of paramount importance to designers of stormwater systems
concerned with the possibility of geysers. The experimental tests have indicated significant
displacements of water, even when D∗ = 0.67, which is consistent with Wright [2013] studies.
However, the displacements reported here was larger than the ones measured by Wright
[2013], possibly because of the larger initial water level in the vertical shaft. With a better
understanding of the displacement of water levels created by varying air pocket sizes and
different shaft diameters it will be possible to achieve greater safety in stormwater system
designs.
Pressure head measurements during experiments indicate that levels that are within the
shaft rim during geyser events, which is consistent with previous investigations. Drops in the
pressure measured by transducer P2 at the bottom of the shaft were observed during geyser
occurrences. These drops were not as identifiable through the pressure measurements at the
lateral of the shaft by transducer P3. This result confirms earlier experimental studies that
geysering events can occur when pressure heads are well below grade elevation. Larger swings
48

of pressure were observed with the two smaller diameters tested, but decreased significantly
with the largest D∗. This points to the benefit of having larger diameter shafts in discharging
entrapped air pockets in terms of pressure fluctuations after the release.
A CFD model using compressibleInterFOAM solver was created by Jue Wang to repre-
sent the same geometry as the experimental conditions from the tests. The tests provided
good agreement regarding the kinematic of the water and air-water interface during the
air pocket release. The comparison between measured and simulated pressures was not as
accurate, however the general trends were well represented.
As it would be anticipated, larger shafts had the ability of capturing larger fractions of air
pockets present in horizontal tunnel. CFD results indicated that, for the tested conditions, up
to 70% of the entrapped air pocket volume can be admitted in shafts when D∗=1. However,
larger shafts presented much smaller vertical displacements of the free surface during air
pocket release. Whereas the normalized displacement ∆YFS/YFS,0 could be as large as 3
when D∗ ≤ 0.5, this value dropped to a maximum of 1.3 for D∗=1. However, it is important
to perform careful CFD simulations of such events, since ∆YFS can be problematic depending
on the tunnel geometry. The largest absolute ∆YFS for D∗=1, associated with the largest
air pocket volume, reached 26 m. This could pose geyser problems if the tunnel depth is too
shallow.
Finally, the velocity of free surface motion increased with air pocket volume and smaller
initial water levels in the shaft. These kinematic results of free surface maximum rise and ve-
locity are potentially useful in the context of design of stormwater systems to avoid geysering
episodes. For instance, when D∗=0.5 the maximum velocity of the free surface reached 20
m/s during the air release of large pockets through shallow standing water depths in shafts.
Such velocities can create problems related to manhole displacements, and further research
should investigate this issue with more detail.
There are significant knowledge gaps yet to be addressed in future research. For in-
stance, it would be relevant to measure the pressure within the vertical shaft (i.e. centerline)
49
during the air release phase, and compare results with CFD results. The use of large scale
tests to study the nature of air release in water-filled shafts, both in laboratory and in nu-
merical simulations, should also be considered in future research efforts, along with studies
to mitigate geysers in actual stormwater systems
50
Bibliography
Augustenborg, C.A. and Duke, L.D. (2001). Effectiveness Assessment of NPDES Reg-ulations for Storm Water Discharges. World Water Congress 2001, 2001.
Baines, W.F. (1991). Air cavities as gravity currents on slope. J. Hydr. Eng., 117(12):1600–1615, 1991.
Batchelor, G. K. (1967). Introduction to Fluid Dynamics. Cabridge University Press.Cambridge, U. K.
Baumbach,V. , Hopfinger, E. J. and Cartellier A. (2005). The Transient Behavior of aLarge Bubble in a Vertical Tube. J. Fluid Mech., 524(Vol. A 200): 131–142, 2005.
Benjamin, T.B. (1968). Gravity currents and related phenomena. J. Fluid Mech., 31:209–248, 1968.
Catano-Lopera, Y., Tokyay, T., Martin, J., Schmidt, A., Lanyon, R., Fitzpatrick, K.,Scalise, C., and Garcia, M. (2014) Modeling of a Transient Event in the Tunnel andReservoir Plan System in Chicago, Illinois. J. Hydraul. Eng., 10.1061/(ASCE)HY.1943-7900.0000888, 05014005.
Chanson, H. (1996). Air Bubble Entrainment in Free-Surface Turbulent Shear Flows.Academic Press. London, U. K.
Choi, Y., Leon, A.S., and Apte, S.V. (2014). Three-dimensional numerical modeling ofair-water geyser flows. Proc., 2014 ASCE World EWRI Congress, 2014.
Chosie, C.D., Hatcher, T.M., and Vasconcelos, J.G. (2014). Experimental and numericalinvestigation on the motion of discrete air pockets in pressurized water flows. J. Hydr.Eng., 2014.
Cook, M.B., Debell, K.M. (2002). Improving Water Quality in Urban Watersheds. Linki-ign Stormwater BMP Designs and Performance to Receiving Water Impact Mitigation24–34, 2002.
Cummings, P.D. and Chanson, H. (1997). Air Entrainment in the Developing FlowRegion of Plunging Jets - Part 1: Theoretical Development J Fluids Eng, 119(3):597–602, 1997.
Davies,R. M. and Taylor,G. I. (1950). The Mechanics of Large Bubbles Rising ThroughExtended Liquids and Through Liquids in Tubes. Proc. Royal Soc. London, 1062(Vol.A 200): 375–390, 1950.
51
Goonetilleke, A. Thomas, E., Ginn, S., and Gilbert, D. (2005). Understanding the Roleof Land USe in Urban Stormwater Quality Management. Journal of EnvironmentalManagement, 74:31-42, 2005.
Guedes de Carvalho, J. R. F., Talaia, M. A. R., Ferreira, M. J. F. (2000) Floodinginstability of high-density gas slugs rising in vertical tubes filled with water. Chem.Engrg. Sci., 55: 3785–3802, 2000.
Guo, Q. and Song, C.S.S. (1991). Dropshaft Hydrodynamics under Transient Condi-tions. J. Hydr. Eng., 117(8): 1042–1055, 1991.
Hamam, M.A. and McCorquodale, A. (1982). Transient conditions in the transitionfrom gravity to surcharged sewer flow. Can. J. Civ. Engrg, (9): 189–196, 1982.
Lewis, J. W. (2005). A Physical Investigation of Air/Water Interactions Leading toGeyser Events in Rapid Filling Pipelines. Ph.D. Thesis. University of Michigan, 2011
Lewis, J.W. and Wright, S.J. (2012). Air-Water Interactions that Generate Large WaterLift through Vertical Shafts in Stormwater Conduits. J. Water Mngmt. Modeling, DOI:10.14796/JWMM.R245-02, 2012.
Li, J. and McCorquodale, A. (1999). Modeling Mixed Flow in Storm Sewers. J. Hydr.Eng., 125(11): 1170–1180, 1999.
Morgado, A.O., Miranda, J.M., Araujo, J.D.P., Campos, J.B.L.M. (2016). Review onvertical gas-liquid slug flow. Int. J. Multiph. Flow, 85: 348-368, 2016.
McQuillan, K.W. and Whalley, P.B.(1984). Flow patterns in vertical two-phase flow.Int. J. Multiph. Flow, 11(2): 161-178, 1984.
Patrick, A. and Vasconcelos, J. (2015). Air Entrainment Effects on the Pressure WaveCelerities Following Rapid Filling Pipe Flows. Proc. 2015 ASCE EWRI Congress,Austin, TX. pp. 1638-1647. DOI: 10.1061/9780784479162.159
Ramezani, L., Karney, B., and Malekpour, A. (2016). Encouraging Effective Air Man-agement in Water Pipelines: A Critical Review. J. Water Resour. Plann. Manage.,DOI:10.1061, 2016.
Shaban, H., Tavoularis, S. (2014). Identification of flow regime in vertical upward air-water pipe flow using differential pressure signals and elastic maps. Int. J. Multiph.Flow, 61: 62-72, 2014.
Shammas, N.K., Wang, L.K. (2011) . Water Supply and Wastewater Removal. JohnWiley & Sons, Inc. Hoboken, NJ.
Shao, Z.S. (2013). Two-dimensional hydrodynamic modeling of two-phase flow for un-derstanding geyser phenomena in urban stormwater system. PhD Thesis, University ofKentucky.
52
Svenungsson, J.(2016). Solving electric field using Maxwellas equations and compress-ibleInterFoam solver Material course at Chalmers University of Technology.
Vasconcelos, J.G. and Wright, S.J. (2006). Mechanisms for air pocket entrapment instormwater storage tunnels. Proc., 2006 ASCE EWRI Congress, Omaha, NE, 2006.
Vasconcelos, J.G. and Wright, S.J. (2008). Rapid flow startup in filled horizontalpipelines. J. Hydr. Eng., 134(7): 984–992, 2008.
Vasconcelos, J.G. and Wright, S.J. (2009). Rapid filling of poorly ventilated stormwaterstorage tunnels. J. Hydr. Res., 47(5): 547–558, 2009.
Vasconcelos, J.G. and Wright, S.J. (2011). Geysering generated by large air pocketsreleased through water-filled ventilation shafts. J. Hydr. Eng., 135(5): 543–555, 2011.
Wilkinson, D.L. (1982). Motion of air cavities in long horizontal ducts. J. Fluid Mech.,118: 109–122, 1982.
Wright, S.J., Lewis, J.W. and Vasconcelos, J.G. (2011). Geysering in rapidly fillingstorm-water tunnels. J. Hydr. Eng., 137(5): 543–555, 2011.
Wright, S.J. (2013). Influence of Air Pocket Volume on Manhole Surge. J. WaterMngmt. Modeling, DOI: 10.14796/JWMM.R246-09, 2013.
Hirt, C.W. and Nichols, B.D. (1981). Volume of fluid (VOF) method for the dynamicsof free boundaries. J. Comput. Phys., 39(1): 201–225, 1981.
Weller, H.G., Tabor, G., and Fureby, C. (1998). A tensorial approach to computationalcontinuum mechanics using object-oriented techniques. Comput. Phys., 12(6): 620–631,1998.
53