Embed Size (px)
Citation preview

CONFIDENTIAL AND PROPRIETARY: This presentation and the information contained herein is confidential and proprietary information of USI Insurance Services, LLC ("USI"). Recipient agrees not to copy, reproduce or distribute this document, in whole or in part, without the prior written consent of USI. Estimates are illustrative given data limitation, may not be cumulative and are subject to change based on carrier underwriting. © 2014-2015 USI Insurance Services. All rights reserved.
NEXTGEN WELLNESS: BRIDGING THE GAP TO ACHIEVE RESULTS IN POPULATION HEALTH:
GOVERNMENT FINANCE OFFICERS ASSOCIATION OF CONNECTICUTA
pril
2016
Mark Converse, CEBS, CWWPC
Regional Practice Leader, Population Health Management
www.usi.biz

© 2015 USI Insurance Services. All rights reserved.| 2
Overview
OPULATION- health trends driving cost
EALTH – discovering the disease footprint (data)
ANAGEMENT – solutions, resources & support

© 2015 USI Insurance Services. All rights reserved.| 3
Jumping Off Point Today

© 2015 USI Insurance Services. All rights reserved.| 4
Data Driven Decisions : Your Peers
USI 3D Data Analytics Tool • Data samples used today will be your city,
town, peers from our database of $9 billion
in med/Rx claims
• 19,217 members sample size
• SIC Code 91–Public Administration
including only city, town, county, BOE, etc

© 2015 USI Insurance Services. All rights reserved.| 5
Expenses for a company Cost control Compensation
Cost of goods/service
Healthcare spend
◦ Employee Benefits◦ Workers’ Compensation
Manage Cost: Impact Consumption
15%
85%
Behavior change areas: medical management, lifestyle risk reduction and effective consumerism of healthcare – your trifecta !!
Medical Plan EquationHealthcare Spend = Admin + (Unit Cost x Units Consumed)
Modifiable Behaviors as consumers and health risk factors

© 2015 USI Insurance Services. All rights reserved.| 6
To yield ROI it must be a comprehensive program. It must include strong medical management strategies and traditional lifestyle support.
Why bother doing “Wellness”?
Costs are Modifiable. Enormous amount of scientific evidence that unhealthy behavior and modifiable health risks significantly increase health-care costs in all working populations.
Behavior & Risks Can Be Modified. 500+ well-designed scientific studies - unhealthy behaviors and modify health-risk factors can be changed by wellness
Cost Reduction Documented.70+ peer-reviewed studies of the economic return of work-site wellness - ROI from 1.5:1 to almost 20:1. Average is 3:1
Cost-reduction Potential is Large.Harvard 44 peer-reviewed studies found a 32.7% savings on medical claims and a 27.3% reduction in the cost of sick-leave absenteeism
Traditional “lifestyle” wellness programs add value as this summary of research shows:

© 2015 USI Insurance Services. All rights reserved.| 7
Disease Management ROI
2014 Rand Corporation StudyPepsiCo Disease Management(DM) program - ROI 3.8 : 1
Disease Management programs are the opportunity area for ROI.
CLIENT A : Disease Registry by Care Gap Index (CGI)
2013
‐201
5 All M
embe
rs ConditionsZero Low Medium High
Avg Paid PMPY
Total Members
Avg Paid PMPY
Total Members
Avg Paid PMPY
Total Members
Avg Paid PMPY
Total Members
Diabetes $2,076 146 $8,950 67 $7,005 50 $10,629 305Hyperlipidemia (Cholesterol) $1,871 461 $5,600 386 $6,816 216 $11,633 329Hypertension (Blood Pressure) $1,864 334 $6,222 361 $8,201 267 $11,966 350Coronary Artery Disease (CAD) $2,905 31 $21,721 25 $14,381 34 $21,944 74Asthma $1,857 26 $2,643 176 $4,694 219 $11,867 200COPD $1,499 10 $26,477 15 $9,591 17 $19,207 45
USI’s data analytics warehouse, 3D, has shown the paid amount for a chronic condition that is unmanaged or the individual is non-compliant with recommended care practices leads to significantly higher costs.

POPULATIONHEALTHMANAGEMENTHealth Trends Driving Cost

© 2015 USI Insurance Services. All rights reserved.| 9
2010 Obesity Trends in U.S. Adults
1. Van Nuys et al., American Journal of Health Promotion, May/June 2014.2. http://www.cdc.gov/obesity/data/databases.html
Overweight or obese
employee costs an employer
$2,295 more a year in direct and indirect
medical expenses 1

© 2015 USI Insurance Services. All rights reserved.| 10
New Cases Annually2014 2030
Diabetes 1.9 M 7.9 MChronic heart disease and stroke 1.3 M 6.8 M
http://healthyamericans.org/report/100/
Projected 2030 Obesity Rates

© 2015 USI Insurance Services. All rights reserved.| 11
Correlation of Health Risks & Major Conditions
Risk FactorSmoking(tobacco)
Hypertension
Hypercholesterolemia
Overweight/Obesity
Physical Inactivity
Alcohol Abuse
Low Fruit & Vegetable Intake
Medical ConditionCardiovascular disease
Cancers (lung & related)
Cancers (other)
Alcohol related trauma
Alcohol use disorder
Diabetes
Hypertension
Hypercholesterolemia
COPD
Specific mental and nervous disorders
Osteoarthritis
50% or More Correlation 2012 Actuarial Study: Health Risks & Cause of Major Conditions
≤ 24%24-49%≥ 50%
Source: Bolnick, H., Millard, F., and Dugas, J., Medical Care Savings from Workplace Wellness Programs, JOEM 2012, Jan, 55(1): 4-9.

© 2015 USI Insurance Services. All rights reserved.| 12
Source: CDC
Complex Connections
Metabolic syndrome(METS) is not a disease itself, instead is a cluster (having 3 of 5) metabolic risk factors. 34% of the population has METS.

© 2015 USI Insurance Services. All rights reserved.| 13
Lifestyle Risk Factors Driving Excess Costs
Risk Factor
CDC*Annual Excess Medical Cost
BMI (overweight & obesity) $1,351High Total Cholesterol $892Hypertension (high blood pressure) $447Smoking $579Nutrition (low intake of fruit & vegetables) $656Exercise (physical inactivity) $982
“The published literature shows that a material percentage of deaths are associated primarily with modifiable, lifestyle-related behaviours.”
- World Health Economic Forum
Very High Risk Factors
Cigna** Annual Excess Claims
Cost Per Risk Factor
BMI > 30 $2,460
Cholesterol >240 $1,644
2+ Chronic Conditions $1,300
** 2015 Cigna Study How Incentives Help American Workers Engage in Improving Their Health & Making Their Health care More Affordable, n=200,000.
* Center for Disease Control and Prevention (CDC) Behavioral Risk Factor Surveillance System (BRFSS), 2012
© 2015 USI Insurance Services. All rights reserved.| 14
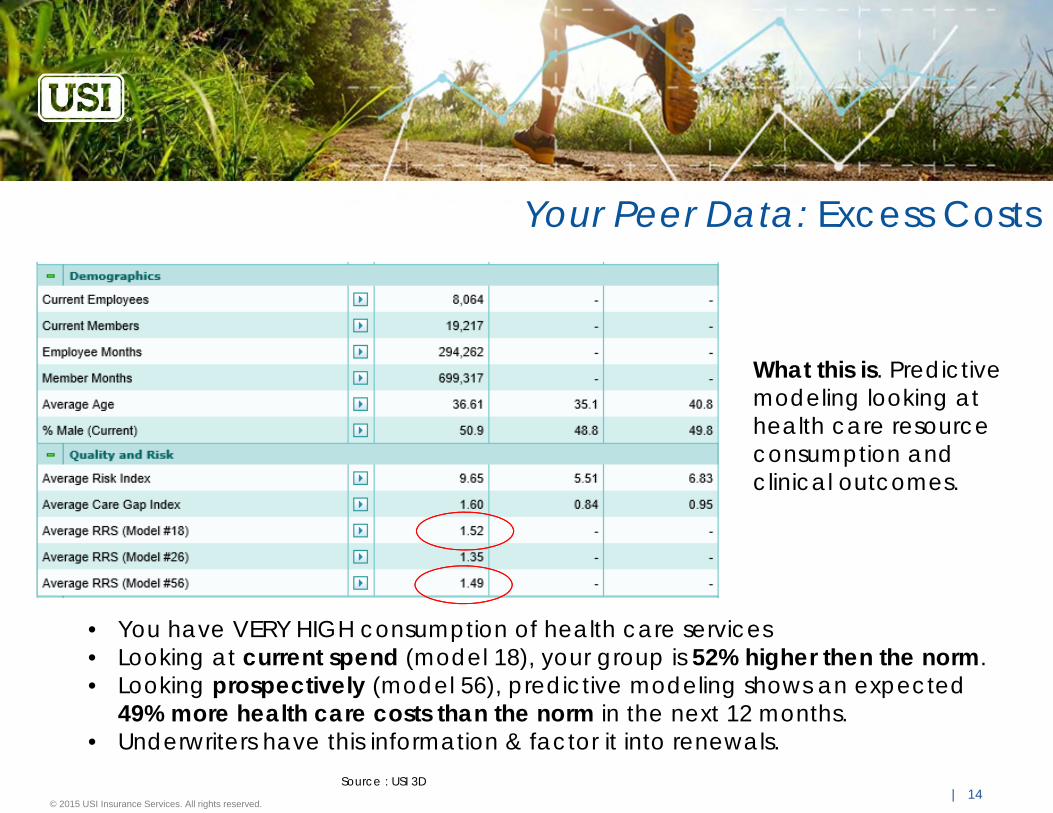
Your Peer Data: Excess Costs
Source : USI 3D
• You have VERY HIGH consumption of health care services• Looking at current spend (model 18), your group is 52% higher then the norm. • Looking prospectively (model 56), predictive modeling shows an expected
49% more health care costs than the norm in the next 12 months. • Underwriters have this information & factor it into renewals.
What this is. Predictive modeling looking at health care resource consumption and clinical outcomes.

POPULATIONHEALTH MANAGEMENTDiscovering the disease footprint (data)

© 2015 USI Insurance Services. All rights reserved.| 16
Your Peers: Higher Gaps in Care Lead to Higher Cost
USI’s data analytics warehouse, 3D, has shown the paid amount for a chronic condition that is unmanaged or the individual is non-compliant with recommended care practices leads to significantly higher costs.
$0
$10,000
$20,000
$30,000
$40,000
$50,000
$60,000
Zero Low (<=2) Medium (3‐4) High (>=5)
Public Administration (City/Town/County)
Care Gap Index (CGI) Range Average Paid
Total Members
Zero $ 7,596 60Low (<=2) $ 30,533 176
Medium (3‐4) $ 31,257 95High (>=5) $ 52,857 383
Significant cost avoidance can be achieved with improved disease management perfrmance.

© 2015 USI Insurance Services. All rights reserved.| 17
Not only are you high consumers of healthcare, many with chronic conditions are non-compliant with care standards leading to more increased consumption & costs.This is an BIG area of opportunity for you to achieve cost avoidance:
Gap in Care Description Diabetes
Peer Group Actual Norm
% Variance To Norm
Patients with renal failure. 8.96% 5.06% 77.1%Patients without HbA1c test in the last 12 months. 36.25% 16.23% 123.4%Patients without long office visit in the last 12 months. 8.76% 7.81% 12.2%Patients without micro or macroalbumin screening test in the last 12 months. 47.01% 32.76% 43.5%Patients without claims for home glucose testing supplies in the last 12 months. 59.06% 46.86% 26.0%Patients without LDL-C test in the last 12 months. 35.52% 27.42% 29.5%
Your Peers: Higher Gaps in Care Lead to Higher Cost
Gap in Care DescriptionCoronary Artery Disease (CAD)
Peer Group Actual Norm
% Variance To Norm
Patients without lipid profile test in the last 12 months. 52.51% 25.02% 109.9%Patients without long office visit in the last 12 months. 6.89% 6.04% 14.1%Patients without antihyperlipidemic drugs in the last 12 months. 38.02% 23.74% 60.2%
Individuals without established primary care relationships……have fragmented care for chronic conditions**.
** Gallup Serious Chronic Illness Survey, 2002 ; and Chronic Illness and Care giving, a survey conducted by Harris Interactive, Inc. 2000, National Chronic Care Consortium, Washington, D.C.

© 2015 USI Insurance Services. All rights reserved.| 18
Many members are non-compliant with recommended age/ gender screenings.
Note: the norm is not a reflection of good.
Your Peers: Preventive Screenings
Condition Description
Peer Group Actual Norm
% Variance To Norm
>=50 years old (E) Patients without any colorectal cancer screening in the last 24 months. 68.20% 68.12% 0.1%Men >50 years old (E) Men without PSA level in the last 2 years (controversial test). 48.77% 45.13% 8.1%All individuals (E) Individuals without any claim in the last 12 months. 8.50% 12.31% -31.0%Women >=49 y/o Women without mammogram in last 12 months. 48.79% 47.48% 2.8%Women (21 and 65 y/o) Women without pap smear in the last 24 months. 44.66% 42.93% 4.0%Women (49 and 69 y/o) Women without mammogram in the last 18 months. 34.70% 37.14% -6.6%
Individuals without established primary care relationships delay preventive care.

POPULATIONHEALTHMANAGEMENTComplex Problems Require Comprehensive Solutions to Be Successful

© 2015 USI Insurance Services. All rights reserved.| 20
Know Your Numbers
On Site Biometric Screening
Current Solution ModelDo they move the needle?

© 2015 USI Insurance Services. All rights reserved.| 21
Next Gen: Physician Engagement ModelThe goal of Physician Engagement is to create a member/physician relationship to identifyand address solutions and take action of potential health problems and health conditions.
Physician Engagement
Preventive Cancer Screenings
Disease Management
Specialist
Pharmacy – Maintenance Medications

© 2015 USI Insurance Services. All rights reserved.| 22
1. Connect all members to the Primary Care (PCP)
2. Meaningful incentives
3. Integrated disease management
4. Evaluate data
Four Key Pillars To Success

© 2015 USI Insurance Services. All rights reserved.| 23
Creates the most cost efficient entry point to the health care system
Immediate care management for individuals who are outliers for cholesterol, diabetes and high blood pressure
Preventive care to identify early stages of cancer
Identify & manage the “pre-DM” sliding toward a chronic condition
Address other lifestyle issues in a confidential and non-threatening manner
Connected to resources for:◦ Weight loss (Nutrition and physical activity)◦ Tobacco cessation◦ Stress◦ Substance abuse
Why Primary Care (PCP) Engagement

| 24
PCP: Identify the Undiagnosed
Unaware?• 66% of adults are overweight or obese, but only 18% realize it and are trying to lose weight
The Unknown and its Cost Impact • 20% + family history and may be unaware• 25% of people with diabetes are undiagnosed• 40% of people with Type II Diabetes are first diagnosed in the Emergency Room because
they have gone into a Diabetic Coma• 30% of Heart Attack Patients had no idea that they had Coronary Disease• 20% of stroke victims didn’t know that they had hypertension• 6.3% of have undiagnosed Chronic Obstructive Pulmonary Disease (COPD)• 15% have one or more of these undiagnosed: High blood pressure, cholesterol, diabetes
References:National Business Group on Health. http://www.businessgrouphealth.org/preventive/topics/hypertension.cfm#4American Diabetes AssociationCenter For Disease Control and Prevention (CDC) 2012CDC : http://www.cdc.gov/diabetes/data/statistics/2014statisticsreport.htmlCIGNA Healthcare

| 25
Connect Members to a Physician
Emergency Room Visits Decline
40,000 Members in over 200 Groups Have Connected to a Physician as the First Step in Improving Health, Managing Disease, and Reducing Healthcare Costs.
Increase Preventive Care Visits
USI recommends a multi-phase strategy that improves member health status and manages healthcare spending.
200
400
600
800
1000
1200
1400
1600
Y1 Q1 Y1 Q2 Y1 Q3 Y1 Q4 Y2 Q1 Y2 Q2 Y2 Q3 Y2 Q4 Y3 Q1 Y3 Q2 Y3 Q3 Y3 Q4
A (617 EEs) B (307 EEs) C (846 EEs) D (1,108 EEs)
0
50
100
150
200
250
300
350
Y1 Q1 Y1 Q2 Y1 Q3 Y1 Q4 Y2 Q1 Y2 Q2 Y2 Q3 Y2 Q4 Y3 Q1 Y3 Q2 Y3 Q3 Y3 Q4
A (617 EEs) B (307 EEs) C (846 EEs) D (1,108 EEs)

© 2015 USI Insurance Services. All rights reserved.| 26
Target All MembersWhy Target All?Based upon USI database:• Spouses make up approximately 30% of the members• Spouses cost over 53% more than employees1
• Spouses and dependents account for nearly 60% of the total healthcare costs.
Spouses equal a 68% improvement in cost trend compared to 37% when not included 2
References:1 USI 3D Database2 Health Enhancement Research Organization (HERO)
Your Peer Data: Spouses account for 30% of spend.

© 2015 USI Insurance Services. All rights reserved.| 27
Meaningful Incentives
Using a Plan-Based Financial Incentive: Drives participation higher than other types of incentives Can create a cost neutral program
Through premium differentials & surcharges, HSA contributions Ease of administration
ACA reform increased allowed amount to 30% You cannot afford the amount needed on a per person basis in your budget Larger incentive, less self-reported actions
40% typically use a plan-based incentive.

© 2015 USI Insurance Services. All rights reserved.| 28
Integrated Disease Management• Manage current conditions• Enhances coordination of care with incented PCP program• Target potentially catastrophic claimants
• Strategic disease management initiatives to target closure of gaps in care (i.e. diabetes )
• Cost avoidance when engaged
Why Disease Management:Members with properly managed conditions:• Decreased annual healthcare costs• Medical complications• Healthier lives• Reduced repeat events
Disease Management Incentives Examples:• Complete DM care plan, co-pay/waivers• Diabetic supplies no cost• Biometrics out of range, require coaching• Alternate plan for non-engaged
Self-funded has most option for design

© 2015 USI Insurance Services. All rights reserved.| 29
CDHP & Wellness
Greater Participation. 2014 Employee Benefit Research Institute (EBRI) survey: CDHPenrollees more engaged in wellness programs.
Savings Accounts. 2013 EBRI survey: health savings account (HSA) individuals more likely todo health-risk assessments, health promotion program, or biometric screening program.
Strategies that engage consumers in healthcare have also seen a positive impact onwellness participation.
© 2015 USI Insurance Services. All rights reserved.| 30
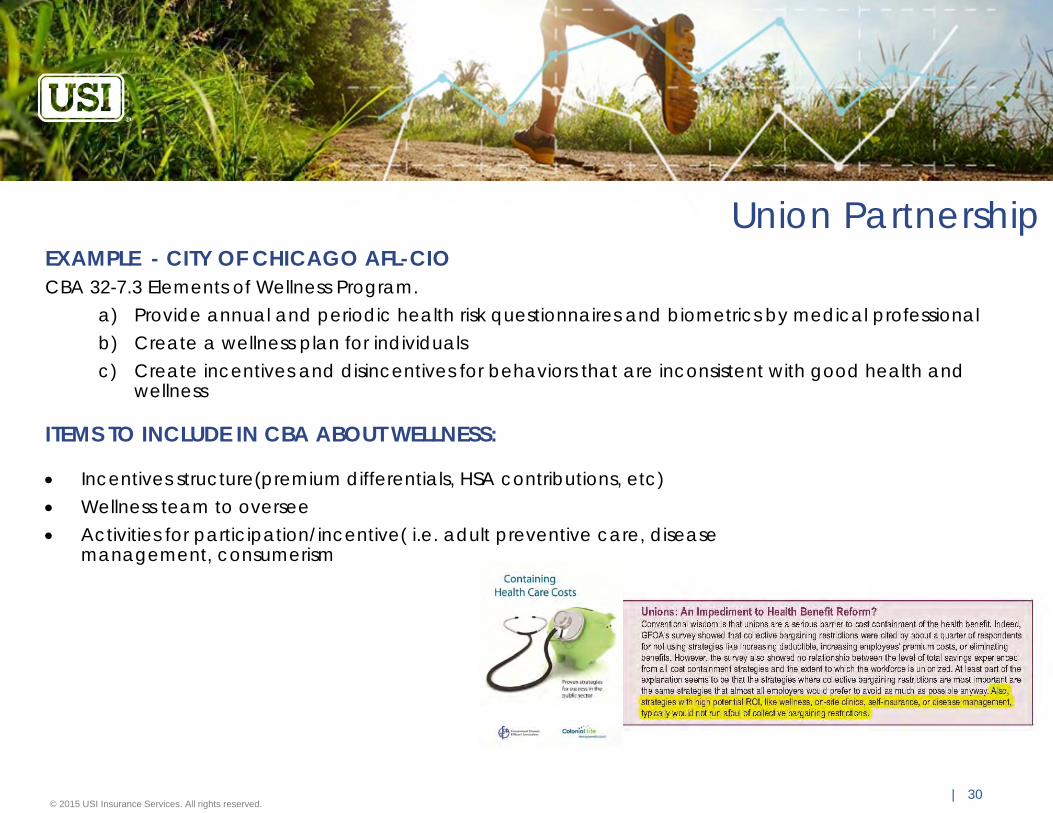
Union Partnership
ITEMS TO INCLUDE IN CBA ABOUT WELLNESS:
Incentives structure(premium differentials, HSA contributions, etc) Wellness team to oversee Activities for participation/incentive( i.e. adult preventive care, disease
management, consumerism
EXAMPLE - CITY OF CHICAGO AFL-CIOCBA 32-7.3 Elements of Wellness Program.
a) Provide annual and periodic health risk questionnaires and biometrics by medical professionalb) Create a wellness plan for individualsc) Create incentives and disincentives for behaviors that are inconsistent with good health and
wellness

POPULATIONHEALTHMANAGEMENTPath Forward

© 2015 USI Insurance Services. All rights reserved.| 32
Potential 5-Year Road Map/Strategy
2016 2017 2018 2019 2020Launch Q3 HR Memo Leadership Launch Memo TBD TBD TBD
Health Actions
1. Annual Physical Exam (w/ biometrics captured)
1. Annual Physical Exam (w/ biometrics captured)
2. Health Assessment
1. Annual Physical Exam
2. Preventive care affidavit or Tobacco-free Affidavit
3. Health Assessment
1. Carrier Health Assessment
2. Annual Physical Exam (Tobacco-free Affidavit or smoker complete program
Required (gatekeeper)PCP VisitTobacco affidavitPick OneCarrier health assessment, Dental affidavit, age-gender screening,
Target Population EmployeeNon-union
Employee Non-union
Employee & SpouseUnion and non-union
Employee & Spouse Employee & Spouse
Health Action Period 11/1/2015 – 10/31/2016 11/1/2016 – 10/31/2017 11/1/2017 – 10/31/2018 11/1/2018 – 10/31/2019 11/1/2019 – 10/31/2020
Incentive Cash reward 5% premium differential 5% differential 10% differential or H.S.A
account contribution for participation
15% differential or H.S.A account contribution for participation
Incentive Effective Date 1/1/2017 1/1/2018 1/1/2019 1/1/2020 1/1/2021
Evaluation & Monitoring of Progress
Carrier claims
Carrier present disease management (DM) reports.Onboard to consultant data analytics warehouse
Establish DM engagement goal of 30% and aggressively manage performance with carrier
Budget Vendor collect PCP forms at $6.50 PEPY. Collect biometric
Vendor collect PCP forms and aggregate biometric
Vendor increase for added form capture TBD TBD
Goals50% participation in well visit. 70% adult preventive visits 80% adult preventive visits
(both EE & SP)80% participation 80-90% participation
Funding StructureFully insured Fully insured Self-funded Self-funded
HDHP with HSA Self-funded
Union PartnershipReview wellness wording for Collective Bargaining Agreement (CBA)
Discuss wellness wording for CBA
CBA approved with wellness included
Disease ManagementEvaluate chronic condition claims.
Evaluate carrier or vendor based options. Evaluate plan designs to incent participation in DM
Diabetes DM program
Implement plan designs to incent participation in DM
Diabetes and Cardiovascular DM program
TBD

© 2015 USI Insurance Services. All rights reserved.| 33
Summary / Actions You Can Take
1. Impact Consumption:1. Improve preventive care spend
a) utilization of preventive care (annual preventive well visits, age/gender specific screenings,
2. Improve disease management performance. a) Pressure vendor/carrier for improved engagement
3. Foster culture of consumerism ( CDHP, plan design to direct POS decisions, HC consumer education
2. Impact lifestyle risk factors by PCP engagement with resulting urgency to change behavior
3. Advocate for wellness in the CBA
To stem the tide of avoidable illness that are driving the costs of healthcare burdening the cities/towns:

© 2014 USI Insurance Services. All rights reserved.
Q&A

CONFIDENTIAL AND PROPRIETARY: This presentation and the information contained herein is confidential and proprietary information of USI Insurance Services, LLC ("USI"). Recipient agrees not to copy, reproduce or distribute this document, in whole or in part, without the prior written consent of USI. Estimates are illustrative given data limitation, may not be cumulative and are subject to change based on carrier underwriting. © 2014-2016 USI Insurance Services. All rights reserved.
WellnessCompliance
Update

© 2016 USI Insurance Services. All rights reserved. | 36
Status of Wellness Incentives HIPAAWellness incentives under HIPAA for health contingent programs increase to 30%
determined based on the total cost of coverage (50% for tobacco-related programs)
Health contingent program – activity or outcomes based Must satisfy the 5 factor test
1. Opportunity to qualify once per year2. Reward cannot exceed 30% total cost of coverage (50%
tobacco related programs)3. Reasonably designed to promote health and prevent disease4. Available to similarly situated individuals and a reasonable
alternative available5. Disclosure
© 2016 USI Insurance Services. All rights reserved. | 37
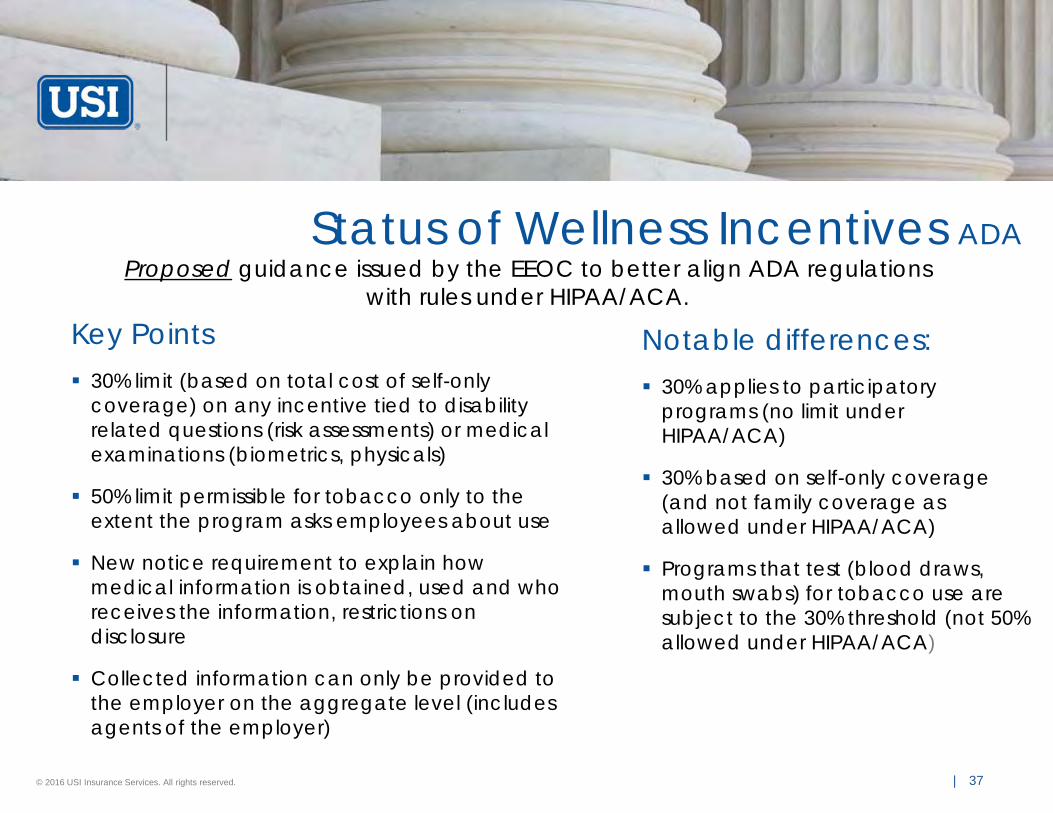
Status of Wellness Incentives ADAProposed guidance issued by the EEOC to better align ADA regulations
with rules under HIPAA/ACA.Key Points 30% limit (based on total cost of self-only
coverage) on any incentive tied to disability related questions (risk assessments) or medical examinations (biometrics, physicals)
50% limit permissible for tobacco only to the extent the program asks employees about use
New notice requirement to explain how medical information is obtained, used and who receives the information, restrictions on disclosure
Collected information can only be provided to the employer on the aggregate level (includes agents of the employer)
Notable differences: 30% applies to participatory
programs (no limit under HIPAA/ACA)
30% based on self-only coverage (and not family coverage as allowed under HIPAA/ACA)
Programs that test (blood draws, mouth swabs) for tobacco use are subject to the 30% threshold (not 50% allowed under HIPAA/ACA)

© 2016 USI Insurance Services. All rights reserved. | 38
Status of Wellness Incentives GINA
EEOC Proposed Rule GINA Title II
Title II of GINA permits the use of incentives with respect to a spousal HRA (“Health Risk Assessment”) when all of the following are satisfied:
• Spouse is enrolled in the employer’s group health plan;• Wellness program is reasonably designed to promote health or prevent
disease;• Total incentives for an employee and spouse may not exceed 30% of the
total cost of the plan in which the employee and dependents are enrolled • Maximum portion of an incentive that may be offered to an employee alone
does not exceed 30% of the total cost of self-only coverage; and • The spouse provides written authorization for collection of genetic information
Employers may not offer incentives for information about the current or past health status of an employee’s child