Embed Size (px)
Citation preview
university ofgroningen
groningen growth anddevelopment centre
GGDC RESEARCH MEMORANDUM 180
Formerly Assembled, But Now Designed in China?Assessing the Domestic Value-Added of Activities
in Gross Exports
Quanrun Chen, Yuning Gao, Jiansuo Pei, Gaaitzen de Vries, and Fei Wang
August 2018
1
Formerly Assembled, But Now Designed in China?
Assessing the Domestic Value-Added of Activities in Gross Exports
Quanrun Chena, Yuning Gaob, Jiansuo Peia, Gaaitzen de Vriesa,c, Fei Wanga
a University of International Business and Economics, Beijing
b Tsinghua University, Beijing
c University of Groningen, Groningen
Abstract
China has managed to increase the domestic value added content of its exports in recent years. But
what is the nature of the global value chain activities that it performs? This paper measures the
value added of China’s activities embodied in its exports. We combine information on the activities
of workers by industry and across China’s 31 provinces from population censuses, with newly
estimated inter-provincial input-output tables using value-added tax transactions data for 2002 and
2012. Our findings suggest the increase in China’s domestic value-added in exports arises from an
expansion of fabrication activities. This aggregate trend is driven by provinces like Guangdong,
Jiangsu, and Zhejiang. Richer provinces such as Beijing, Tianjin, and Shanghai increasingly
specialize in R&D and sales and marketing activities.
Keywords: China; Domestic value-added in exports; Activities; International trade
JEL: F14, F60, O19, R11
Acknowledgements
We thank Bo Meng, Heiwai Tang, Zhi Wang, Viktor Stolzenburg, and conference participants at
the Pre-conference of the China Development Forum (Beijing, March 2018) for helpful comments
and discussions.
2
1. Introduction
During past decades, the development of global production networks has allowed firms to rely less
on domestic inputs for products they sell on the world market. As a result, a common pattern across
countries has emerged, whereby the domestic content of exports declines (Johnson and Noguera,
2017). This pattern is observed for almost all developed and developing countries from the 1970s
onwards (Johnson and Noguera, 2017).
China defied this declining trend in the domestic content of exports. That is, China’s domestic
value added content in exports increased during the 2000s (Koopman et al. 2012; Kee and Tang,
2016).1 What underlies the increase in China’s domestic value added in gross exports?
The aim of this paper is to analyze China’s domestic value added from activities in exports. Current
studies trace the international flows of domestic value added in exports, but do not provide
information on the nature of the activities that are performed. Yet, this is crucial in appraising the
potential for development under global value chain integration (Timmer et al. 2018). That is,
activities differ in their potential for productivity growth as well as in generating knowledge and
other spillovers.
The iconic example that motivates our approach is the iPhone. On the back of the iPhone it reads
‘designed by Apple in California, assembled in China’. It reflects the global configuration of
production whereby activities are undertaken at different locations. China’s exports of iPhones
thus embody domestic value added from its fabrication activities. But this case study may not be
representative of China’s electronics exports. Indeed, China’s export of smartphones is a diverse
bundle of brands and models, including smartphones from China’s own brand manufacturers, such
as Huawei and Xiaomi. These firms do design, marketing, and after-sales services activities. In a
nutshell, does the increase in China’s domestic value added during the 2000s reflect a movement
towards higher value-adding activities?
1 Johnson and Noguera (2017) document a long run decline in the domestic value added in exports for the majority of
developed and developing countries. Their analysis reveals that during the 1970s to 2010s, China’s domestic content
in exports fell. We focus on the period from 2002 to 2012 for which scholars document an increase in the domestic
value added of China’s exports (Koopman et al. 2012; Kee and Tang, 2016).
3
In our empirical analysis, we will distinguish between four possible business activities: R&D,
fabrication, marketing, and other support services. We measure the contribution of an activity as
the wage income of workers that perform it, based on their occupation. To implement the approach,
we create a rich new dataset. It includes detailed data on the occupations of workers in forty-two
industries in thirty-one provinces of China from the 2000 and 2010 population census. It is
combined with information on inter-industry and inter-provincial flows of intermediate inputs
build up from value-added tax invoice data.
We first document China’s domestic value added in exports. Using the inter-provincial input-
output tables, we find that the domestic content increased from 70 to 72 percent between 2002 and
2012. This increase is consistent with findings in previous studies (Koopman et al. 2012; Kee and
Tang, 2016).2 Domestic value added in exports (hereafter VAX_D)3 is the sum of income accruing
to the production factors capital and labor. We identify domestic value added exports of a particular
function by the labor income of workers that perform the function following Timmer et al. 2018.
This allows us to examine the nature of activities that are performed. For China, we find that the
increase in VAX_D arises from an expansion of fabrication activities.
The finding appears to contrast with findings in the international business literature and in firm
case studies that indicate a strong expansion of knowledge-intensive activities in the pre-
fabrication (R&D, innovation, engineering, etcera) and the post-fabrication stage (sales and
marketing, logistics, etcetera) in China.4 We show it can be reconciled by analyzing the sub-
national domestic value added of activities in exports. China’s economy and workforce is vast and
there are huge differences in levels of economic development and global value chain specialization
patterns across China’s provinces (Meng et al. 2013). For example, income per capita in Shanghai
(the richest province in China) is almost six times higher compared to Guizhou (the poorest
province).5 Many headquarter locations are in cities like Beijing and Shanghai. The aggregate
2 Although there is broad agreement among scholars about the rising trend in the domestic content of exports by China,
there are differences in estimates of the domestic content of exports discussed in section 2. 3 We follow notation introduced by Los and Timmer (2018). VAX_D is domestic value added embodied in exports
as in Koopman et al. (2014). 4 See e.g. Lewin et al. (2009), Frederick and Gereffi (2011), Assche and van Biesebroeck (2018). Further discussed in
section 2. 5 Provincial GDP per capita in 2010 in current prices is 76,074 yuan in Shanghai and 13,119 yuan in Guizhou (NBS
SY, 2011).
4
increase in VAX_D from fabrication activities is driven by provinces like Guangdong, Jiangsu,
and Zhejiang. But richer provinces like Beijing, Tianjin, and Shanghai have started to specialize
in R&D and sales and marketing activities.
The set-up of our study is related to studies of the factor content of trade as in Reimer (2006) and
Trefler and Zhu (2010) and factor distributions in global value chains as in Timmer et al. (2014).
Rather than analyzing different types of factor inputs such as capital and labor distinguished by
educational attainment levels, we focus on the type of activity that workers carry out as in de
Timmer et al. (2018). Activities do not correspond clearly to a particular sector or industry. For
example, in many statistical systems, firms are classified based on their primary business activity.
But firms often perform and combine many activities in-house including both production and
various types of support services, making it often hard to establish their primary activity. Studying
the sector distribution of value-added in trade as in Johnson and Noguera (2012) and modelled by
Bridgman (2012) will therefore not reveal functional specialization patterns.
Studying the subnational domestic value added from activities in exports is important as it helps
to reconcile findings in the international trade literature with studies in international business.
Regional assets interact with local institutions. Together it determines the potential for economic
upgrading. Much depends on the type of activities carried out as they differ in their potential for
productivity growth as well as in generation of knowledge and other spillovers. Activities also
differ in their likelihood to be affected by relocation: functional unbundling has to be studied in
conjunction with geographic unbundling. For example, agglomeration forces are likely to induce
spatial inertia in research and development activities, yet are much less relevant for assembly,
testing or packaging activities. Better understanding of the viscidity of current activities in a region
is therefore also key in policy making (Baldwin and Evenett, 2012).
The remainder of this paper is as follows. Section 2 provides a selected review of the literature on
the domestic content of exports in China and international business and case studies of functional
upgrading by Chinese firms. Section 3 describes the collection and approach for constructing a
unique data set to examine functional specialization patterns in China. Section 4 outlines the
measurement of domestic value added in exports by business function. Section 5 first documents

5
the increase in China’s VAX_D, examines changes in the functional specialization shares in
VAX_D, and finally examines functional specialization patterns across China’s provinces. Section
6 concludes.
2. Domestic value added in exports: a selected review of the literature
We first review the literature on China’s domestic value-added in exports in section 2.1. There is
mounting evidence that the domestic content in exports increased since the 2000s. So far, this
strand of literature has not informed on the nature of activities carried out in production. We then
review the international business literature and case studies on functional upgrading in China in
section 2.2. These studies suggest that China is undertaking an increasing range of knowledge-
intensive activities in production networks. It suggests that the aggregate increase in domestic
value-added in exports originates from functional upgrading. This hypothesis is examined in the
sections thereafter.
2.1 China’s domestic value added in gross exports
Due to international production fragmentation, what countries export can be very different from
what they actually contribute to the production process. To capture this, Hummels et al. (2001)
proposed a new measure of vertical specialization in trade: the share of domestic value added
(VAX-D) in gross exports.6 This share is one when all activities needed to produce the exported
good are performed within the exporting country. Put otherwise, all stages of production take place
domestically. The share is declining in the amount of intermediates imported by the country in any
stage of production. A country with a low share is thus said to be vertically specialized in trade,
carrying out a limited number of production stages. Using input-output tables for fourteen
countries compiled by the OECD, they found that the domestic value added share in exports (VAX-
D ratio) decreased for every country (but Japan) between 1970 and 1990. China was not included
in their analysis.
6 In fact, Hummels et al. (2001) derived the import content of exports, and referred to these as VS. Koopman et al.
(2014) defined domestic value added in exports and showed that it is equal to gross exports minus VS (see also Los
et al., 2016).
6
In an influential study of China’s exports, Koopman et al. (2012) argued for the need for detailed
data to measure specialization in case processing trade is pervasive. Export processing firms
import parts and components, typically with tariff exemptions and other tax preferences, and, after
assembling, export the finished products. Koopman et al. (2012) generalize Hummels et al. (2001)
to take account of the much higher use of imported inputs by processing relative to standard
exporters. Overall, they found that VAX-D in China’s manufacturing exports was about 50% in
1997 and 2002, increasing to 60% in 2007. Export from sectors that are typically labelled as
relatively sophisticated such as computers and telecommunication equipment had a particularly
low ratio (45% or less in 2007). It confirmed casual observations that what China was contributing
to production is very different from what they export. In addition, these findings led to a more
general recognition of the importance to account for heterogeneity across firms in import use when
analyzing specialization in trade.
Kee and Tang (2016) embrace firm heterogeneity by measuring China’s VAX_D as a weighted
average of the firms’ VAX_Ds. Their VAX_D estimates confirm that China’s VAX_D has been
rising. They find that China’s VAX_D increased from 65% in 2000 to 70% in 2007. This is higher
than what is reported by Koopman et al. (2012). The Input-Output tables that Koopman et al.
(2012) used are estimated based on samples of large firms. Typically, larger firms have a higher
import-to-sales ratio and therefore a lower VAX_D compared to small firms. Kee and Tang (2016)
show that if they measure VAX_D as a weighted average of only VAX_Ds of the large firms’, the
estimates are not different from Koopman et al. (2012).
Meng et al. (2017) measure VAX_D across China’s provinces using inter-provincial input-output
tables for 1997 and 2007. They find that China’s inland provinces have tended to produce more
value added by joining the domestic portion of coastal regions’ global supply chains instead of
relying on increasing its direct exports to the world market.
What underlies the increase in China’s VAX_D? Kee and Tang (2016) find that it is mainly driven
by individual processing exporters substituting domestic for imported materials, both in terms of
volume and varieties. This suggests that the increase in VAX_D is driven by an expansion of
domestic fabrication activities.
This aggregate pattern, however, may obscure important differences across China’s provinces.
Indeed, Meng et al. (2013, 2017) point out that with falling domestic transport and ICT costs, firms
7
have been outsourcing part of their production to other provinces. This allows them to focus more
on their core competencies, namely pre- and post-fabrication activities. We will examine the
domestic value-added of activities in gross exports for China and the distribution of domestic
activities across its provinces.
2.2 Activities in Global Value Chains
One way to examine a shift towards more value-adding activities is to study the integration or the
move into more sophisticated business functions or skill-intensive activities in GVCs (Humphrey
and Schmitz, 2002). For example, the shift from doing mainly assembly activities to own-
equipment manufacturing to ultimately own-brand manufacturing (Gereffi, 1999). This will be
reflected in changes in the share of domestic value-added from activities in exports.
Until recently, the offshoring of knowledge-intensive activities by MNEs from high-income
countries was pioneered by only a few companies and was primarily between a limited set of high-
income countries. But Dossani and Kenney (2007) argue that offshoring of knowledge intensive
services has become a routine business decision. MNEs increasingly resort to offshoring
knowledge-intensive activities in order to cope with the need to integrate dispersed sources of
knowledge and implement a faster and cheaper innovation process (Castellani and Pieri, 2013). In
particular, Dossani and Kenney (2007) argue that since 2004 we have entered a new phase in which
high-skilled services jobs are offshored to emerging countries. Cheap but educated workforces in
China and other emerging countries provide enormous opportunities for firms to offshore entire
functions such as marketing, human resources and customer services. High-technology US startups
nowadays establish offshore subsidiaries to undertake for example high-end semiconductor design
activities and software algorithm development (Dixit, 2007; Shah, 2005). Indeed, there is now a
rich literature that studies the expansion of knowledge activities in emerging countries (Dossani
and Kenney 2007; Di Gregorio et al. 2009; Lewin et al. 2009; Nieto and Rodríguez 2011;
Castellani et al. 2013, Kenney et al. 2009).
There are also insightful case studies that examine the movement into higher value adding
activities in China. Frederick and Gereffi (2011) compare the apparel industry in China to that in
Mexico. They find that growing domestic apparel demand and an integrated Asian production
network allowed Chinese apparel firms to functionally upgrade in GVCs. The state provided active
8
support by investing in textile-processing equipment and logistics. This contrasts to Mexican
apparel firms whose exports heavily rely on the US consumer market and which have not
developed a production network in Central America.
Assche and van Biesebroeck (2018) measure functional upgrading in China by analyzing changes
in the relative prevalence of two types of export processing trade, namely pure-assembly and
import-assembly. In contrast to pure-assembly, with import-assembly the export processing firm
imports inputs of its own accord and retains control over their use during the production process.
This requires the selection and governance of relations with suppliers as they need to manage
inventories and logistics as well as being responsible for quality. Assche and van Biesebroeck
(2018) find that import-assembly export processing firms have become more prevalent both
overall and within product categories since 2000.
These studies suggest an upgrading in functional capabilities. We provide a complementary macro-
economic perspective and examine this hypothesis in section 5. First we discuss data and methods.
3. Data
Section 3.1 describes the occupations data to measure labor income from business functions by
province-industry pairs. Section 3.2 discusses the estimation of inter-provincial input-output tables
based on firm level transactions data. Both datasets are combined in the sections hereafter to
examine the domestic value added of activities in exports between 2002 and 2012.
3.1 Estimating domestic value added in activities
Our identification strategy follows Timmer et al. (2018) and infers value added by business
function from data on the occupational structure of the work force. Occupation data is mapped into
functions. For guidance on the mapping we used the list of business functions proposed by
Sturgeon and Gereffi (2009), which itself is derived from a list of generic business functions first
proposed by Porter (1985). A well-known distinction is between fabrication and headquarter
activities (Markusen, 2002). We start from that distinction, further splitting headquarter into R&D
and technology development (abbreviated R&D), sales and distribution (Marketing), and other
support activities (Other support). In choosing the number of functions we have to strike a balance
9
between the level of detail and maintaining comparability across provinces and over time.
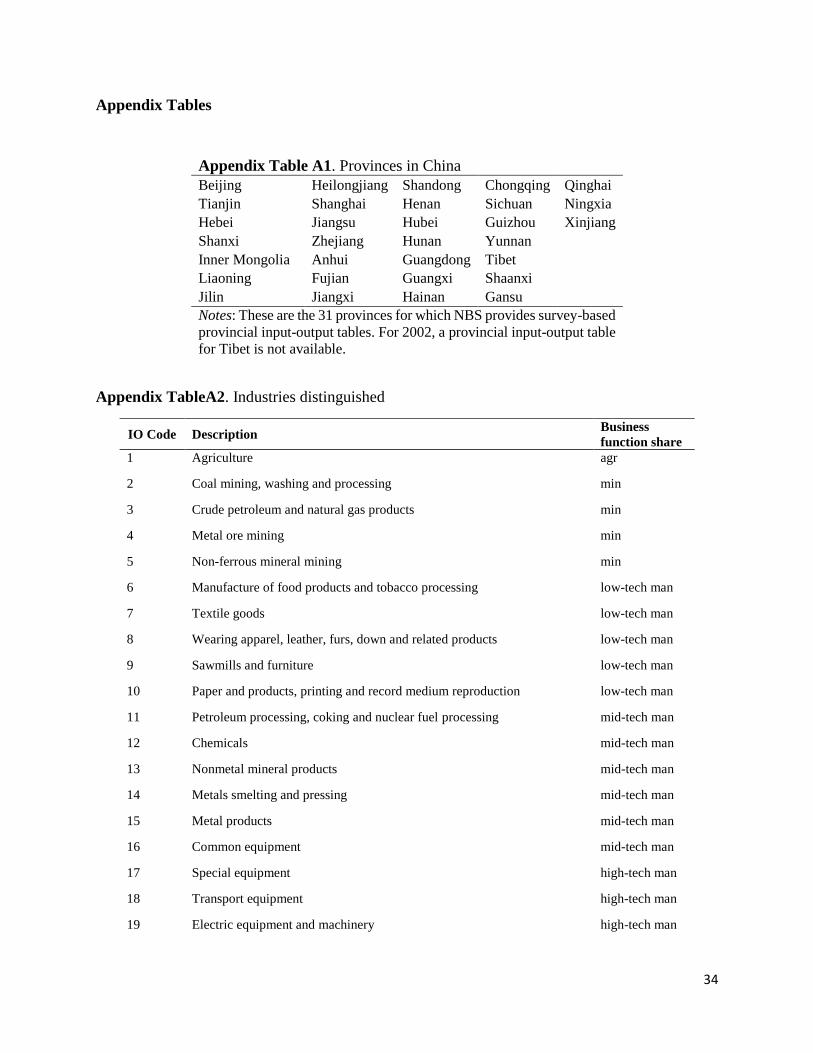
Our primary data sources for occupations data are the 2000 and 2010 China Population Census.
We collect and harmonize occupations data for 31 Chinese provinces (see Appendix Table A1 for
the provinces distinguished) and in each of these provinces distinguish 42 sectors (see Appendix
Table A2 for the sectors distinguished). We use the 0.1 percent samples, with approximately 1.3
million (1.2 million) observations for 2010 (2000).7 Business function employment shares are
estimated at an aggregate 9 sector level and shares are assumed equal for more disaggregated sub-
sectors (see the final column in Appendix Table A2). The procedure to estimate more aggregated
shares is a common and more robust approach when using micro data (see e.g. O’Mahony and
Timmer, 2008).
The population census provides information on occupational employment cross-classified by
industry and province. To measure wages by occupation, we use the 2002 and 2013 China
Household Income Project (CHIP) survey. These surveys provide relative wages by broad (1 digit)
occupation group and we assume the relative wage can be used for more disaggregated occupations
within each broad occupational group. We combine the business function shares with labor shares
in each province-industry, which are available at the detailed 42 sector level (further discussed in
section 3.2).8
We map occupations to business functions (see appendix Table A3 for the concordance). This new
and detailed dataset on activities at the province-industry level is combined with information on
inter-industry and inter-provincial trade flows from Inter-Provincial Input-Output Tables (IPIOs)
for 2002 and 2012, described next.
3.2 New Inter-Provincial Input-Output tables for China
7 Sampling weights are not provided. This may introduce bias in the business function shares. From NBS, China’s
statistical office, we obtained industry by occupation data for China (not by province), which NBS tabulated on the
basis of 10 percent samples of the population censuses 2000 and 2010. We compared the business function shares
from the data provided to NBS to the shares based on the 0.1 percent sample. The business function shares for China
as a whole are very similar and also the correlation at the industry-business function level is high, ranging from 0.73
(employment share in other support activities by industry in 2010) to 0.995 (employment share in marketing activities
by industry in 2000). 8 Note that we use the business function employment shares from the 2000 population census in combination with
relative wages from the 2002 CHIP survey and the 2002 Inter-Provincial Input-Output (IPIO) table. We use the 2010
population census in combination with the relative wages from the 2013 CHIP survey and the 2012 IPIO.
10
Our approach to estimate inter-provincial input-output tables consists of three steps. In a first step,
we use as initial tables the inter-provincial input-output tables from Zhang and Qi (2012).9 Second,
we adjust the row and column totals as well as the GDP factor income shares using the survey-
based provincial input-output tables provided by China’s statistical bureau. We benchmark
China’s GDP in the IPIO to that published in the national accounts. Third, we improve upon the
estimated trade flows between industries and provinces (the internal structure of the IPIOs) using
aggregated firm-level transactions data. We discuss each step in turn.
3.2.1 Initial estimates of inter-provincial input-output tables
Inter-provincial input-output (IPIO) tables for 2002 and 2012 have been compiled by Zhang and
Qi (2012). These IPIOs show how the output of a given industry in a given province is divided
between final consumption and intermediate use by all other province-industries in China and the
rest of the world. Provinces are an administrative division, which does not align well with the
regional spread of economic activities in China. But this is the type of data we have to work with.
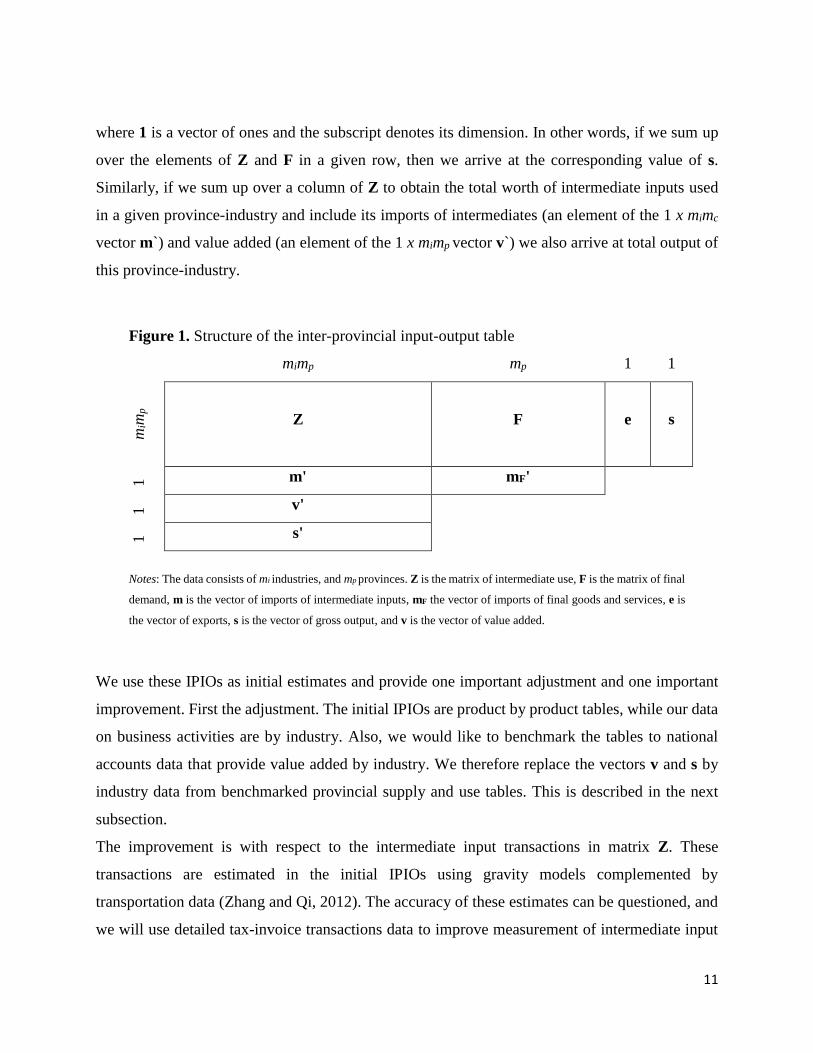
The IPIO provides data on mi = 42 industries and mp = 31 provinces, and a column with exports to
`the rest of the world'.10 The basic structure of the IPIO for a given year is given in Figure 1. The
units of observations are the mimp = 1,302 unique province-industry pairs. The mimp x mimp matrix
Z records the flows of output for intermediate use between industries. The entry in row a and
column b equals the use (in Yuan) by industry-province b of intermediate inputs provided by a.
The mimp x mp matrix F contains for each province-industry the output for final use in every
province plus a mimp x 1 vector e with exports to the rest of the world. Gross output for each
province-industry pair is given by the mimp x 1 supply vector s. Because total supply is by necessity
equal to total intermediate and final use, the following equation has to hold:
s = Z𝟏𝑚𝑖𝑚𝑝 + (F+e)𝟏𝑚𝑖𝑚𝑝
, (1)
9 China’s multi-regional input-output table with eight regions for 2002 is from Zhang and Qi (2012). The authors
provided us with a new inter-provincial input-output table for 2012. 10 The IPIO for 2002 provides data on 29 industries and 30 provinces instead of the 42 industries and 31 provinces in
the IPIO for 2012. The lower number of industries is because the services industries in the IPIO 2012 are collapsed
into a single services industry in the IPIO 2002. The lower number of provinces in the IPIO for 2002 is because Tibet
did not compile an input-output table in 2002. We adjust both dimensions in the 2002 IPIO, further described below.
11
where 1 is a vector of ones and the subscript denotes its dimension. In other words, if we sum up
over the elements of Z and F in a given row, then we arrive at the corresponding value of s.
Similarly, if we sum up over a column of Z to obtain the total worth of intermediate inputs used
in a given province-industry and include its imports of intermediates (an element of the 1 x mimc
vector m`) and value added (an element of the 1 x mimp vector v`) we also arrive at total output of
this province-industry.
Figure 1. Structure of the inter-provincial input-output table
mimp mp 1 1
mim
p
Z
F
e
s
1 m' mF'
1 v'
1 s'
Notes: The data consists of mi industries, and mp provinces. Z is the matrix of intermediate use, F is the matrix of final
demand, m is the vector of imports of intermediate inputs, mF the vector of imports of final goods and services, e is
the vector of exports, s is the vector of gross output, and v is the vector of value added.
We use these IPIOs as initial estimates and provide one important adjustment and one important
improvement. First the adjustment. The initial IPIOs are product by product tables, while our data
on business activities are by industry. Also, we would like to benchmark the tables to national
accounts data that provide value added by industry. We therefore replace the vectors v and s by
industry data from benchmarked provincial supply and use tables. This is described in the next
subsection.
The improvement is with respect to the intermediate input transactions in matrix Z. These
transactions are estimated in the initial IPIOs using gravity models complemented by
transportation data (Zhang and Qi, 2012). The accuracy of these estimates can be questioned, and
we will use detailed tax-invoice transactions data to improve measurement of intermediate input
12
flows. This is described in subsection 3.2.3.
The revised IPIOs that we develop here are an improvement upon existing approaches. It is not
without limitations however. In particular, section 2 discussed the importance of allowing for firm
heterogeneity when measuring the domestic value added in exports. Our province-industry
analysis aggregates over heterogeneous firms and this may bias the results. The direction of the
bias is not clear a priori. It could be overestimated for some province-industry pairs and
underestimated for others. For example, if processing trade is pervasive in a particular province-
industry, the domestic value added in exports is likely to be over-estimated and vice versa.
3.2.2 Adjustments to the initial IPIO
The adjustment of the initial IPIO is to create an industry-by-industry IPIO consistent with China’s
GDP as reported in the national accounts.
First, we transformed the provincial IOTs for 2002 and 2012 to product-by-industry SUTs using
the ‘product technology’ assumption (Miller and Blair, 2009). Among others, this results in a
vector of province-industry value added. A well-known issue about China’s statistics is that
provincial GDP does not sum to China’s GDP reported in national accounts. The values we obtain
for value added by industry in each of the mp = 31 provinces are made consistent to that reported
in the national accounts. The adjustment factor x is as follows:
𝑥 = 𝑁𝐴
∑ ∑ 𝑣𝑖𝑝𝑝𝑖, (2)
where NA is GDP reported in the national accounts, vip the value added of industry i in province p,
obtained from the provincial SUTs. The value added and gross outputs are adjusted by the same
proportion x.11 We do this for the years 2002 and 2012 using the national accounts data reported
in the China Statistical Yearbook 2017 (NBS SY, 2017).
Similarly, values of final expenditure for 2002 and 2012 are made consistent to the national
accounts by using the adjustment factor r:
11 We also adjust gross output by the same proportion, this keeps the value added to gross output ratio from the
provincial SUTs intact. This is relevant for measuring the domestic value-added in exports (see next section).
13
𝑟 =𝑁𝐴−𝑛𝑒
∑ 𝑓𝑝𝑝, (3)
where ne are the net exports from China’s national accounts, and fp the final expenditure (excluding
net exports) of province p in the provincial SUTs. The adjustment factor excludes net exports. This
is because China does not include imports and exports that do not change ownership in its national
accounts (consistent with the SNA 2008 guidelines). The regional input-output data, however,
include imports and exports that do not change ownership. Hence the exports and imports by pure-
assembly export-processing firms are included. In our analysis we prefer to include this type of
trade and therefore do not adjust the total exports and imports reported in the provincial SUTs.
After these adjustments, we replace the vectors v and s (adjusted by the x factor) and the matrix
F (adjusted by the factor r) in the initial IPIO. To achieve consistency between row and columns
sums, the IPIO is then updated using a bi-proportional updating method for IOTs known as the
Generalized RAS-technique (Miller and Blair, 2009).
Labor shares in value added, which we split by business activity using the shares derived in section
3.1, are the labor compensation by industry as provided in the provincial input-output tables.
Before the first Economic Census in 2004, the income of self-employed and their employees are
included in labor compensation but not thereafter (NBS, 2003). While profits related to owners
(informal entrepreneurs) should be part of gross operating surplus, we consider the labor
compensation in the input-output tables before 2004 closest to the definition of labor compensation
in value added. After the economic census, two changes in the income GDP accounting method
introduce a break in the labor share time series by industry (Bai and Qian, 2010). First, profits of
state-owned and collective-owned farms are included in labor compensation, introducing an
upward break in the agricultural labor shares. Second, income of self-employed owners is
subsequently included in gross operating surplus. We use the adjustment factors for both changes
at the province-sector level in Bai and Qian (2010) to arrive at consistent time series following the
definition of labor shares before the 2004 Economic Census.
3.2.3 Transaction data at the firm level
14
Declarations of deliveries by business customers are reported to the China State Administration of
Taxation. It records for every VAT-registered business the annual value of its deliveries to any
other VAT affiliate, as long as this amount is greater than or equal to 500 million yuan per year
for merchandise producers or taxable labor service vendors or greater or equal to 800 million yuan
for other businesses (general tax payers). This annual value of sales from firm i to firm j is called
a transaction. This transaction is not split between the potentially multiple goods and services
traded between firms i and j. It only represents the total value of goods and services traded between
those two firms. However, we may observe bilateral trade between those two firms. In this case,
we observe both the transaction between i (as a seller) and j (as a buyer) and its reverse transaction
between j (as a seller) and i (as a buyer). If the two firms are registered in different provinces, it is
recorded as inter-provincial trade. If they are located in the same province, it is intra-provincial
trade.
This dataset therefore provides a good coverage of the trade linkages between Chinese firms. The
China State Tax Administration office provides us these linkages at a detailed industry and
province level from 2003 onwards using the firm transactions data. The dataset is most complete
for firms producing agricultural and manufacturing products, while the coverage for service firms
is better for later years. 12 It enables us to characterize the local production network.
The province-industry to province-industry transaction data can be viewed as a type of input-
output matrix where each row and each column is a province-industry. In that respect, it is therefore
a very suitable tool for analyzing the organization of production chains at the national level.
However, it departs from input-output data in three ways. First, we have no information of what is
traded between two firms. We are therefore not able to distinguish between intermediate inputs
and investment inputs. Second, the manner in which wholesale and retail trade intermediaries are
recorded is fundamentally different from that of standard IOTs. In standard IOTs, the contribution
of the wholesalers and retailers to the economy and their intermediate deliveries to other sectors is
measured in terms of the value added generated by wholesalers and retailers. In our transaction
data, we observe gross transactions to or from trade intermediaries. The contribution of
wholesalers and retailers in the network is therefore much larger than in standard IOTs. Third,
12 From 2012 onwards, services firms from some sectors and regions started to pay VAT and all sectors and
provinces are covered since 2017. Before that, services firms paid business taxes.
15
there is no intra-firm trade in our dataset.13
Using VAT invoice data to measure trade flows carries some well-known limitations (Keen and
Smith, 2006). For example, there can be invalid or lost invoices, fake invoices, fraud, and small
transaction values are typically not included. These issues affect the quality of the data, although
Xing et al. (2015) argue that the centralized and rigorous administrative system in China help to
improve the reliability of the data.
Previous attempts to estimate inter-provincial transactions proofed to be very difficult, simply
because there is no statistical agency that records transactions between provinces like customs
records transactions between nations. The firm level VAT transaction data that we use is consistent
with the input-output table from China’s national statistics while at the same time we are able to
use detail to reveal domestic value chains. By using the VAT data, we are able to improve the
inter-regional transaction matrices of the IPIO through the interconnection of aggregated firm level
value chains.
We calculated the industry specific sale structure across provinces for each province based on the
aggregated firm-level transaction data. This sale structure matrix is then multiplied by the industry
specific total sale of each province, which results in an initial update of the inter-province
intermediate delivery matrix Z (see figure 1). This matrix is then further balanced by using the
RAS procedure.
4. Method
This section proceeds in two steps. First, we trace domestic value added in gross exports
(VAX_D).14 VAX_D contains value that is added by the exporting industry, as well as the value
added contributions of other industries that contribute indirectly through the delivery of
intermediate inputs. To account for these indirect contributions, one needs to use information from
input-output tables in a procedure that was originally developed by Leontief (1949). Second, we
13 There is no data for the intra-firm trade for general tax payers. However, inside each enterprise group trade is
recorded anytime a VAT invoice is issued. Thus this issue may not be that influential. Moreover, along with the
improvement of the legal persons’ general taxpayer qualification process in recent years, the “headquarters effect”
(Xing, Whalley and Li, 2015) caused by the separation of the invoice issuing entities and the actual transaction entities
has been weakening, even with the transaction volume structure anomalies that usually occur in Beijing and Shanghai
where many firms’ headquarters are at. 14 See Hummels et al. (2001) and Koopman et al. (2014).
16
follow Timmer et al. (2018) who extend VAX_D by tracing what type of activities contributed to
this value added. We write the method here in terms of tracing the domestic value added of
activities across Chinese province-industries. The VAX_D of China is defined as the aggregation
of VAX_D over all province-industries.
As before, let e be a vector of exports (of dimension mimp x 1). Let A the mimp x mimp intermediate
input coefficient matrix with typical element ast indicating the amount of product s used in
production of one unit of t (see Figure 1, imported intermediate inputs are not included in A).15
We can then derive a vector y (mimp x 1) which represents the total gross output needed in each
province-industry to produce exports as:
y = (𝐈 − 𝐀)−1𝐞, (3)
where I is a mimp x mimp identity matrix with ones on the diagonal and zeros elsewhere. (𝐈 − 𝐀)−1
is the well-known Leontief inverse matrix which ensures that all output related to exports, direct
and indirect, are taken into account.
Let vector d (mimp x 1) be the amount of domestic value added needed for exports. It can be derived
by pre-multiplying y as given in equation (3):
𝐝 = 𝐕𝐲, (4)
where V is the matrix (mimp x mimp) with diagonal element vgg representing the value added to
gross output ratios for industries i in province p and zeroes on the off-diagonal elements. Note that
vector d contains value added generated in industries that export as well as in non-exporting
industries through the delivery of intermediate inputs.
For the purpose of this paper, this approach is extended as follows. Let B be a matrix of dimension
b x mimp, where b is the number of different business functions. A typical element of this matrix,
bbip, denotes the income of all workers performing business function b in industry i of province p,
expressed as a share of value added in i of province p. Then
G = 𝐁 diag(𝐝), (5)
15 𝐀 = 𝐙 ∗ diag(𝐬)−𝟏. In the set-up of models of value added trade, each product is associated with an industry.
17
where matix G is of dimension b x mimp and the typical element gbip represents value added by
function b in industry i of province p in gross exports.
Substituting (5) and (4) in (3), we derive
G = 𝐁𝐕(𝐈 − 𝐀)−1diag(𝐞). (6)
This is our key equation to measure the domestic value added by function in a provinces’ exports.
China’s domestic value added from activities in exports is then given by
𝑉𝐴𝑋_𝐷𝑏 = ∑ ∑ 𝐆𝑝𝑖 / ∑ ∑ 𝐞𝑝𝑖 (7)
It should be noted that the value added by a function is measured by the costs of workers that carry
it out. The sum across all functions (all elements of G) is thus equal to the overall wage bill in
gross exports. We assume factor price equalization such that differences in labor productivity are
reflected in wages.
The domestic value-added from activities in gross exports is labor income that accrues to the
provinces’ workers. This is our preferred unit of analysis because workers live, work and
participate in a geographical area. Capital income, which is the remainder when wages are
subtracted from value added, is analyzed separately.16
4.2 Measuring functional specialization in trade
The standard tool to analyze specialization patterns is by means of the Balassa index, after Balassa
(1965), which originally refers to the relative trade performance of countries. It compares a
country’s share in world exports of a particular product group to its share in overall exports.
However, a province that looks like a dominant exporter in a particular product may in fact
contribute little value to those exports. Koopman et al. (2014) argue therefore that this analysis
16 One reason is the increasing divergence between the location of the assets (where they are used in production) and
the location of their owners. The emergence of global production chains involved sizable flows of cross-border
investment, and part of the generated value-added will accrue as capital income to multinational firms. The residence
of the ultimate recipients is notoriously hard to track, not least because of the notional relocation of profits for tax
accounting purposes (Lipsey, 2010). Analyses of labor income potentially suffer from the same problem due to
immigrant and inter-provincial labor flows, but arguably this discrepancy is much smaller. Another reason is that
capital assets cannot be straightforwardly allocated to functions, in contrast to workers. For example, a computer can
be used in many business functions and we have no information on its particular use apart from the industry that is
using it.
18
should be performed on the basis of VAX_D instead. We continue this line of reasoning. As before,
let subscript p be a province, and define gbp the domestic value added from business function b in
province p’s exports. These are calculated according to equation (6) using appropriation
summation. We then define the functional specialization (FS) index for function b in province p
as
FS𝑏𝑝 =(𝑔𝑏𝑝 ∑ 𝑔𝑏𝑝𝑏⁄ )
∑ 𝑔𝑏𝑝𝑝 ∑ ∑ 𝑔𝑏𝑝𝑏𝑝⁄ . (8)
The numerator measures the share of function b in overall functional income from province p that
is embodied in exports. The denominator calculates the income share of this function in exports of
all Chinese provinces. If the index is above one, the province is said to be specialized in that
function.
The FS has a degree of intuitive appeal as a measure of specialization, but should not be
straightforwardly interpreted as a measured of (revealed) comparative advantage. This awaits
further grounding in models of international trade that include a full structure of input-output
linkages across countries.
5. Results
Section 5.1 presents results on the domestic value added content of exports in China and measures
the contribution by province to these aggregate trends in domestic value added. Section 5.2
examines changes in the income share from pre-fabrication, fabrication, and post-fabrication
activities and provides suggestive evidence of a smile curve. Section 5.3 examines functional
specialization in trade across provinces in China.
5.1 China’s domestic value-added in gross exports
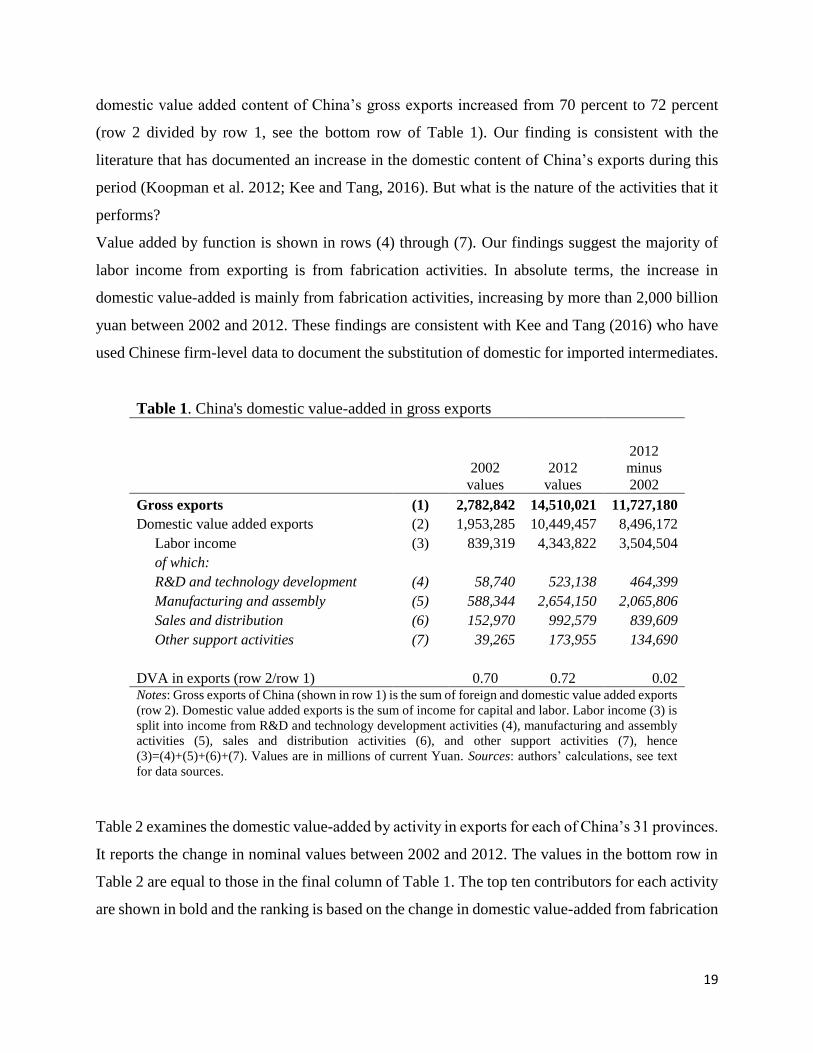
Table 1 examines domestic value added in gross exports of China. The first row shows the
phenomenal increase in nominal gross exports, which increased more than fivefold from 2,783
billion to 14,510 billion yuan between 2002 and 2012. Domestic value added also increased. In
fact, it increased at a faster pace compared to gross exports (see row 2). As a consequence, the
19
domestic value added content of China’s gross exports increased from 70 percent to 72 percent
(row 2 divided by row 1, see the bottom row of Table 1). Our finding is consistent with the
literature that has documented an increase in the domestic content of China’s exports during this
period (Koopman et al. 2012; Kee and Tang, 2016). But what is the nature of the activities that it
performs?
Value added by function is shown in rows (4) through (7). Our findings suggest the majority of
labor income from exporting is from fabrication activities. In absolute terms, the increase in
domestic value-added is mainly from fabrication activities, increasing by more than 2,000 billion
yuan between 2002 and 2012. These findings are consistent with Kee and Tang (2016) who have
used Chinese firm-level data to document the substitution of domestic for imported intermediates.
Table 1. China's domestic value-added in gross exports
2002 2012
2012
minus
2002 values values
Gross exports (1) 2,782,842 14,510,021 11,727,180
Domestic value added exports (2) 1,953,285 10,449,457 8,496,172
Labor income (3) 839,319 4,343,822 3,504,504
of which:
R&D and technology development (4) 58,740 523,138 464,399
Manufacturing and assembly (5) 588,344 2,654,150 2,065,806
Sales and distribution (6) 152,970 992,579 839,609
Other support activities (7) 39,265 173,955 134,690
DVA in exports (row 2/row 1) 0.70 0.72 0.02 Notes: Gross exports of China (shown in row 1) is the sum of foreign and domestic value added exports
(row 2). Domestic value added exports is the sum of income for capital and labor. Labor income (3) is
split into income from R&D and technology development activities (4), manufacturing and assembly
activities (5), sales and distribution activities (6), and other support activities (7), hence
(3)=(4)+(5)+(6)+(7). Values are in millions of current Yuan. Sources: authors’ calculations, see text
for data sources.
Table 2 examines the domestic value-added by activity in exports for each of China’s 31 provinces.
It reports the change in nominal values between 2002 and 2012. The values in the bottom row in
Table 2 are equal to those in the final column of Table 1. The top ten contributors for each activity
are shown in bold and the ranking is based on the change in domestic value-added from fabrication
20
activities.17
The top ten contributors to the increase in domestic value-added are Guangdong, Jiangsu,
Zhejiang, Shanghai, Beijing, Fujian, Shandong, Hebei, Liaoning and Henan respectively. Most of
these provinces are also in the top ten contributors of value added from fabrication activities, but
there are some interesting differences, which we will discuss below. The top ten contributors from
fabrication activities account are Guangdong, Jiangsu, Zhejiang, Shanghai, Fujian, Shandong,
Hebei, Henan, Liaoning, and Shaanxi respectively. Together these ten provinces account for about
75 percent of the increase in domestic value added from fabrication activities in exports.
Guangdong alone accounts for almost one third of the change in value added from fabrication
activities.
Guangdong is also a top ten contributor to the increase in domestic value-added from pre- and
post-fabrication activities. However, a top ten contributor in terms of fabrication activities is not
necessarily a top ten contributor for other activities, and vice versa. For example, Henan is a top
ten (ranked #8) contributor to the increase in value from fabrication activities. But it is not a top
ten contributor in terms of R&D activities (#12) or sales and marketing activities (also ranked
#12).
Other interesting cases are Beijing and Tianjin. Beijing is one of the main contributors to the
increase in value added from R&D activities (ranked #3) and from sales and marketing activities
(#2). However, it is not an important contributor to the increase in fabrication activities (#14). This
is also the case for Tianjin. Tianjin is a top ten contributor to the increase in domestic value-added
in exports from R&D and sales and marketing activities, but not from fabrication activities.
Hence, the increase in domestic value-added from fabrication activities in exports appears driven
by several provinces, most notably Guangdong, Jiangsu, and Zhejiang. Other provinces appear
major contributors to the increase in domestic value-added from pre- and post-fabrication activities
in exports, most notably Beijing and Tianjin.
Table 2. Change in domestic value-added from activities in exports, by province.
# Province Total RD FAB SAL OTH
1 Guangdong 907,688 81,034 593,947 188,613 44,094
17 For some provinces, e.g. Hainan, we observe a decline in domestic value-added by activity in exports between 2002
and 2012. These changes are mainly driven by a reduction in labor income, whereas capital income substantially
increased.
21
2 Jiangsu 547,719 85,123 326,604 116,318 19,673
3 Zhejiang 296,537 43,948 155,979 79,833 16,777
4 Shanghai 283,137 42,532 129,593 100,047 10,965
5 Fujian 205,614 25,888 128,032 44,631 7,064
6 Shandong 162,641 16,971 109,632 33,755 2,284
7 Hebei 130,315 11,798 96,575 18,347 3,595
8 Henan 115,180 9,050 82,948 16,977 6,205
9 Liaoning 117,329 9,625 81,386 24,478 1,841
10 Shaanxi 91,013 7,275 67,783 13,760 2,195
11 Guangxi 70,028 3,616 57,144 7,472 1,795
12 Sichuan 82,352 8,959 56,534 14,336 2,523
13 Anhui 82,237 9,564 53,631 16,672 2,370
14 Beijing 259,372 72,177 49,561 126,772 10,862
15 Hubei 64,665 6,025 47,982 8,491 2,167
16 Hunan 58,111 5,156 41,155 9,926 1,874
17 Xinjiang 45,300 1,639 35,734 7,361 566
18 Shanxi 44,573 3,909 32,453 7,057 1,155
19 Heilongjiang 39,569 3,162 32,066 3,768 573
20 Tianjin 70,898 16,383 28,382 21,005 5,129
21 Inner Mongolia 55,657 8,202 27,651 18,855 949
22 Yunnan 23,163 1,095 17,844 3,879 345
23 Huizhou 24,237 3,173 15,769 4,649 645
24 Chongqing 14,946 2,061 6,008 5,863 1,014
25 Tibet 4,886 660 2,829 1,159 238
26 Qinghai 1,499 -126 2,246 -447 -173
27 Jilin -487 -352 1,728 -1,476 -387
28 Ningxia -9,740 -408 -8,462 -379 -492
29 Jiangxi -25,490 654 -16,788 -8,638 -718
30 Gansu -53,390 -2,867 -42,369 -6,060 -2,094
31 Hainan -205,054 -11,528 -147,771 -37,413 -8,342
Total 464,399 2,065,806 839,609 134,690 Notes: Nominal values of the change in domestic value added by activity in exports between 2002 and
2012. OTH refers to other support activities; RD to R&D; SAL to sales and marketing; FAB to
fabrication activities. Provinces are ranked by change in nominal value of fabrication activities.
Numbers in bold are the top ten contributors to domestic value-added in exports for each activity.
5.2 China’s smile curve
In the previous section we examined absolute changes in the domestic value-added by activity in
exports. Here we documented that the main increase in income originates from fabrication
activities. However, the findings documented in Table 1 also suggest the income from pre- and
post-fabrication activities increased relatively faster compared to fabrication activities for China
22
as a whole. Income from R&D activities increased almost nine fold (523,138/58,740=8.9), sales
and marketing more than six fold, which compares to a fourfold increase in income from
fabrication activities. This suggests a change in the relative income from business functions.
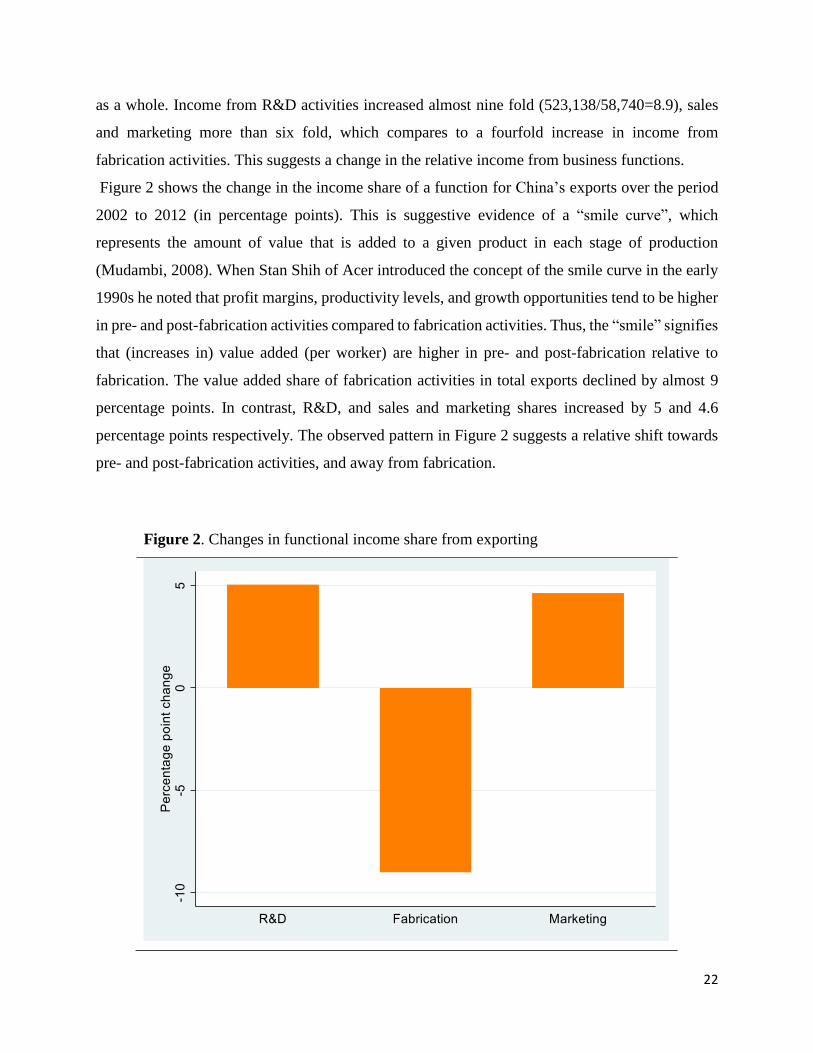
Figure 2 shows the change in the income share of a function for China’s exports over the period
2002 to 2012 (in percentage points). This is suggestive evidence of a “smile curve”, which
represents the amount of value that is added to a given product in each stage of production
(Mudambi, 2008). When Stan Shih of Acer introduced the concept of the smile curve in the early
1990s he noted that profit margins, productivity levels, and growth opportunities tend to be higher
in pre- and post-fabrication activities compared to fabrication activities. Thus, the “smile” signifies
that (increases in) value added (per worker) are higher in pre- and post-fabrication relative to
fabrication. The value added share of fabrication activities in total exports declined by almost 9
percentage points. In contrast, R&D, and sales and marketing shares increased by 5 and 4.6
percentage points respectively. The observed pattern in Figure 2 suggests a relative shift towards
pre- and post-fabrication activities, and away from fabrication.
Figure 2. Changes in functional income share from exporting
23
Notes: Percentage point change in the distribution of domestic value added in China’s
exports by function between 2002 and 2012. Source: Authors’ calculations, see main text.
In Table 3 we show the percentage point change in the income share of a function for China’s
exports by province over the period 2002 to 2012. Provinces in bold shows a similar ‘smile curve’
pattern as for China as whole.
For 16 out of 30 provinces we observe a smile curve. Most of these are also the provinces that
provide the majority of domestic value added in China’s exports (the ordering of provinces is the
same as in Table 2). Interestingly, the strength of the smile curve differs across provinces. In
addition, for 14 out of 30 provinces we observe a stronger increase in income from fabrication
activities compared to pre- and post-fabrication activities. This suggests differences in functional
specialization in trade across provinces, to which we turn next.
Table 3. Changes in functional income share from exporting,
by province.
# Province RD FAB SAL
1 Guangdong 4.2 -12.6 6.6
2 Jiangsu 8.6 -7.8 1.2
3 Zhejiang 3.5 -8.3 5.5
4 Shanghai 5.3 -23.8 20.2
5 Fujian 2.6 -4.3 3.8
6 Shandong 2.7 -3.2 3.1
7 Hebei 1.7 1.2 -0.5
8 Henan -2.0 13.0 -11.4
9 Liaoning -1.4 5.3 -1.4
10 Shaanxi 0.8 4.3 -3.8
11 Guangxi -1.3 7.8 -5.4
12 Sichuan -0.6 11.0 -8.4
13 Anhui 3.6 -7.5 4.7
14 Beijing 14.6 -15.2 6.7
15 Hubei 0.6 7.9 -8.0
16 Hunan 5.9 -17.0 9.2
17 Xinjiang -4.4 7.8 -1.4
18 Shanxi 0.9 4.7 -3.6
19 Heilongjiang 0.8 12.2 -9.5
20 Tianjin 8.7 -12.6 4.4
21 Inner Mongolia 5.7 -21.6 16.3
22 Yunnan 0.0 1.9 -0.3
24
23 Huizhou 3.8 -2.0 0.8
24 Chongqing 4.3 -17.4 11.4
25 Tibet - - -
26 Qinghai -4.2 19.4 -11.7
27 Jilin -1.7 11.5 -7.7
28 Ningxia 2.4 -7.8 6.6
29 Jiangxi 10.0 -10.0 -2.3
30 Gansu 2.9 -7.2 4.5
31 Hainan -1.0 10.1 -7.0
Total 5.0 -9.0 4.6 Notes: Percentage point change in the distribution of domestic value added
exports by function between 2002 and 2012. RD refers to R&D activities;
SAL to sales and marketing; FAB to fabrication activities. Source:
Authors’ calculations, see main text.
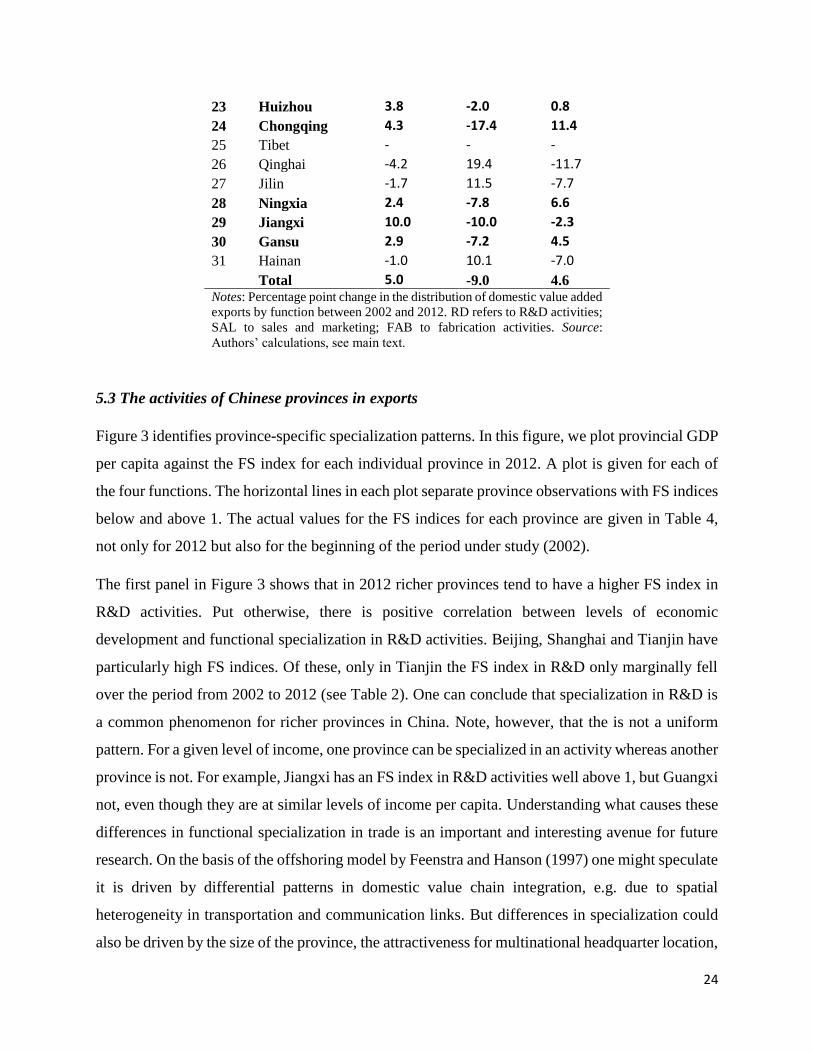
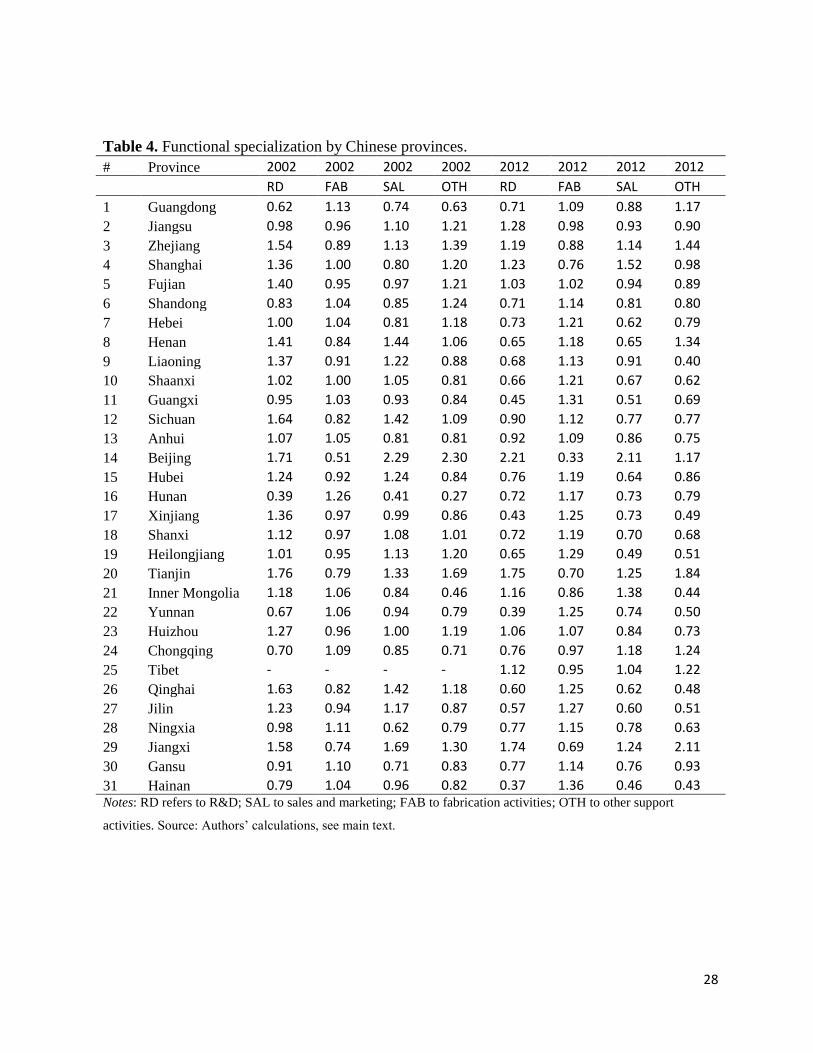
5.3 The activities of Chinese provinces in exports
Figure 3 identifies province-specific specialization patterns. In this figure, we plot provincial GDP
per capita against the FS index for each individual province in 2012. A plot is given for each of
the four functions. The horizontal lines in each plot separate province observations with FS indices
below and above 1. The actual values for the FS indices for each province are given in Table 4,
not only for 2012 but also for the beginning of the period under study (2002).
The first panel in Figure 3 shows that in 2012 richer provinces tend to have a higher FS index in
R&D activities. Put otherwise, there is positive correlation between levels of economic
development and functional specialization in R&D activities. Beijing, Shanghai and Tianjin have
particularly high FS indices. Of these, only in Tianjin the FS index in R&D only marginally fell
over the period from 2002 to 2012 (see Table 2). One can conclude that specialization in R&D is
a common phenomenon for richer provinces in China. Note, however, that the is not a uniform
pattern. For a given level of income, one province can be specialized in an activity whereas another
province is not. For example, Jiangxi has an FS index in R&D activities well above 1, but Guangxi
not, even though they are at similar levels of income per capita. Understanding what causes these
differences in functional specialization in trade is an important and interesting avenue for future
research. On the basis of the offshoring model by Feenstra and Hanson (1997) one might speculate
it is driven by differential patterns in domestic value chain integration, e.g. due to spatial
heterogeneity in transportation and communication links. But differences in specialization could
also be driven by the size of the province, the attractiveness for multinational headquarter location,
25
geographical characteristics and infrastructure, as well as historical built up of capabilities and
networks.
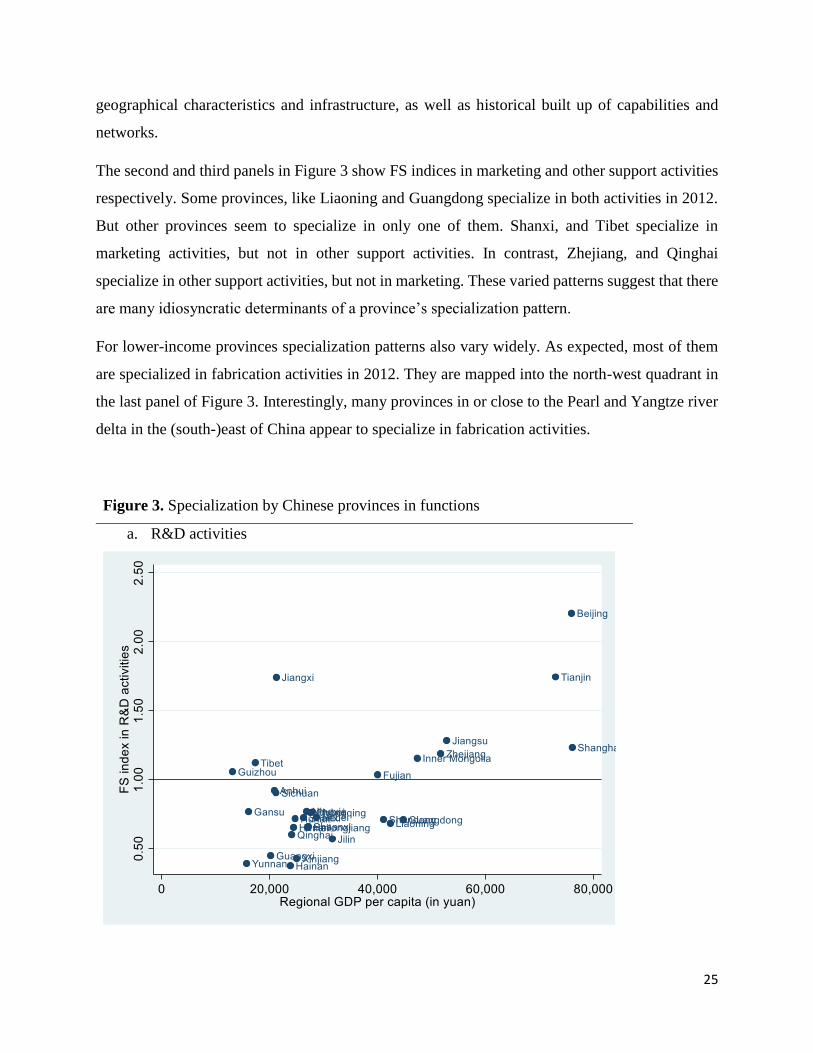
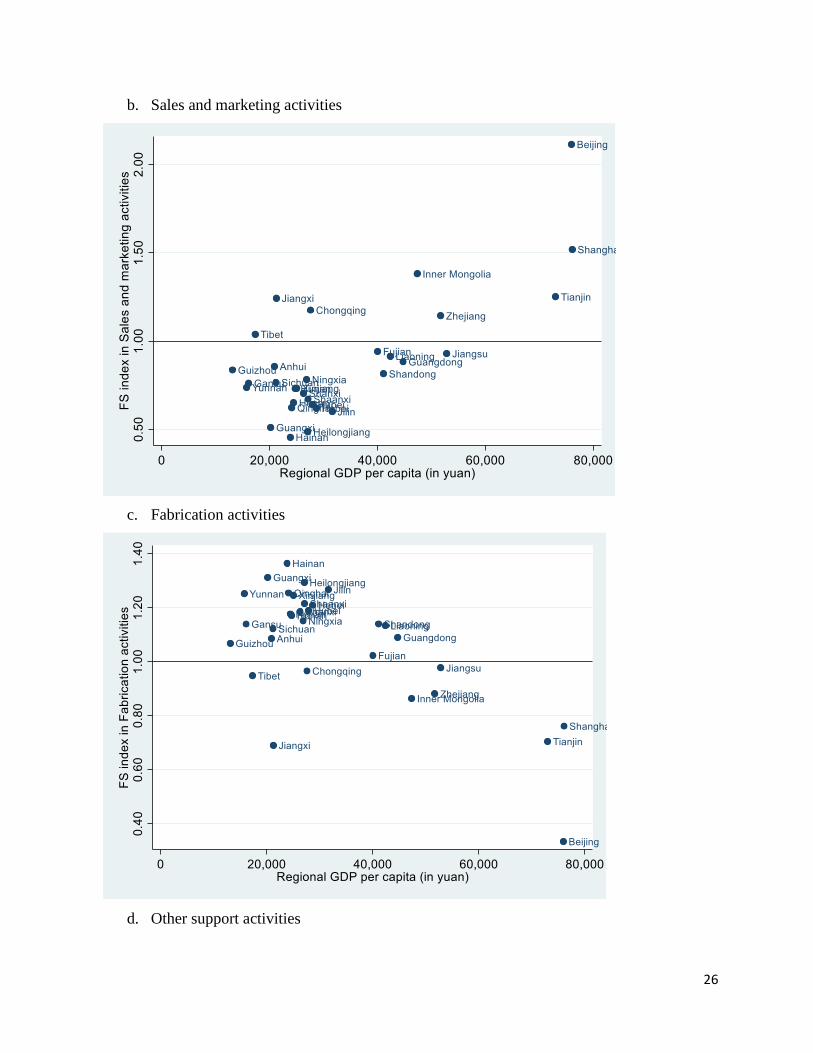
The second and third panels in Figure 3 show FS indices in marketing and other support activities
respectively. Some provinces, like Liaoning and Guangdong specialize in both activities in 2012.
But other provinces seem to specialize in only one of them. Shanxi, and Tibet specialize in
marketing activities, but not in other support activities. In contrast, Zhejiang, and Qinghai
specialize in other support activities, but not in marketing. These varied patterns suggest that there
are many idiosyncratic determinants of a province’s specialization pattern.
For lower-income provinces specialization patterns also vary widely. As expected, most of them
are specialized in fabrication activities in 2012. They are mapped into the north-west quadrant in
the last panel of Figure 3. Interestingly, many provinces in or close to the Pearl and Yangtze river
delta in the (south-)east of China appear to specialize in fabrication activities.
Figure 3. Specialization by Chinese provinces in functions
a. R&D activities
26
b. Sales and marketing activities
c. Fabrication activities
d. Other support activities
27
Notes: Provinces above the horizontal line indicate specialization in a function (FS≥1).
Sources: Authors’ calculations.
28
Table 4. Functional specialization by Chinese provinces.
# Province 2002 2002 2002 2002 2012 2012 2012 2012
RD FAB SAL OTH RD FAB SAL OTH
1 Guangdong 0.62 1.13 0.74 0.63 0.71 1.09 0.88 1.17
2 Jiangsu 0.98 0.96 1.10 1.21 1.28 0.98 0.93 0.90
3 Zhejiang 1.54 0.89 1.13 1.39 1.19 0.88 1.14 1.44
4 Shanghai 1.36 1.00 0.80 1.20 1.23 0.76 1.52 0.98
5 Fujian 1.40 0.95 0.97 1.21 1.03 1.02 0.94 0.89
6 Shandong 0.83 1.04 0.85 1.24 0.71 1.14 0.81 0.80
7 Hebei 1.00 1.04 0.81 1.18 0.73 1.21 0.62 0.79
8 Henan 1.41 0.84 1.44 1.06 0.65 1.18 0.65 1.34
9 Liaoning 1.37 0.91 1.22 0.88 0.68 1.13 0.91 0.40
10 Shaanxi 1.02 1.00 1.05 0.81 0.66 1.21 0.67 0.62
11 Guangxi 0.95 1.03 0.93 0.84 0.45 1.31 0.51 0.69
12 Sichuan 1.64 0.82 1.42 1.09 0.90 1.12 0.77 0.77
13 Anhui 1.07 1.05 0.81 0.81 0.92 1.09 0.86 0.75
14 Beijing 1.71 0.51 2.29 2.30 2.21 0.33 2.11 1.17
15 Hubei 1.24 0.92 1.24 0.84 0.76 1.19 0.64 0.86
16 Hunan 0.39 1.26 0.41 0.27 0.72 1.17 0.73 0.79
17 Xinjiang 1.36 0.97 0.99 0.86 0.43 1.25 0.73 0.49
18 Shanxi 1.12 0.97 1.08 1.01 0.72 1.19 0.70 0.68
19 Heilongjiang 1.01 0.95 1.13 1.20 0.65 1.29 0.49 0.51
20 Tianjin 1.76 0.79 1.33 1.69 1.75 0.70 1.25 1.84
21 Inner Mongolia 1.18 1.06 0.84 0.46 1.16 0.86 1.38 0.44
22 Yunnan 0.67 1.06 0.94 0.79 0.39 1.25 0.74 0.50
23 Huizhou 1.27 0.96 1.00 1.19 1.06 1.07 0.84 0.73
24 Chongqing 0.70 1.09 0.85 0.71 0.76 0.97 1.18 1.24
25 Tibet - - - - 1.12 0.95 1.04 1.22
26 Qinghai 1.63 0.82 1.42 1.18 0.60 1.25 0.62 0.48
27 Jilin 1.23 0.94 1.17 0.87 0.57 1.27 0.60 0.51
28 Ningxia 0.98 1.11 0.62 0.79 0.77 1.15 0.78 0.63
29 Jiangxi 1.58 0.74 1.69 1.30 1.74 0.69 1.24 2.11
30 Gansu 0.91 1.10 0.71 0.83 0.77 1.14 0.76 0.93
31 Hainan 0.79 1.04 0.96 0.82 0.37 1.36 0.46 0.43
Notes: RD refers to R&D; SAL to sales and marketing; FAB to fabrication activities; OTH to other support
activities. Source: Authors’ calculations, see main text.
29
6. Concluding remarks
In this paper we measured the contribution of provinces to China’s gross exports. To implement
our analysis, we collected rich data on the occupational structure of the labor force in combination
with detailed information on the flow of intermediate inputs between province-industry pairs. We
find that China’s domestic value added in exports increased between 2002 and 2012. Our analysis
suggests this is from an expansion of fabrication activities, mainly driven by provinces like
Guangdong, Jiangsu, and Zhejiang.
However, there is clearly sub-national variation in domestic value added from activities in
exports. To analyze this variation, we used an index of functional specialization in exports. This
index reflects the new reality that most goods and an increasing number of services are “made in
the world”, and emphasizes competition in particular tasks within production networks, rather than
on products. Our findings suggest that several provinces in China, most notably Beijing, Shanghai
and Tianjin, have started to specialize in R&D and sales and marketing activities.
The results on functional specialization can inform, and complement, more qualitative
research. It offers a useful macro-economic setting, charting patterns and trends that ground more
detailed case and provincial level analyses. The results may also guide and motivate the choice of
a particular sector or region for in-depth analysis which subsequently provides the needed full
institutional and historical detail.
The data and approaches put forth in this paper provide a fertile ground to study the
evolution of value chains in China building upon the pioneering work by Meng et al. (2013). This
paper has documented trends and patterns in functional specialization. Understanding what is
causing and providing a theory-based interpretation is an important next step.
30
References
Assche, A. van, Van Biesebroeck, J. (2018). “Functional Upgrading in China's Export
Processing Sector.” China Economic Review, vol. 47, pp. 245-262.
Bai, Chong-En, and Zhenjie Qian (2010). The Factor Income Distribution in China: 1978-2007.
China Economic Review, vol. 21(4), p. 650-670.
Assche, A. van, Van Biesebroeck, J. (2018). “Functional Upgrading in China's Export
Processing Sector.” China Economic Review, vol. 47, pp. 245-262.
Balassa, B. (1965). “Trade Liberalisation and ‘Revealed’ Comparative Advantage.” The
Manchester School, vol. 33(2), pp. 99-123.
Baldwin, R. E. and S. J. Evenett (2012). "Beggar-thy-neighbour policies during the crisis era:
causes, constraints, and lessons for maintaining open borders." Oxford Review of
Economic Policy, vol. 28(2), pp. 211-234.
Bridgman, B. (2012), “The rise of vertical specialization trade”, Journal of International
Economics, vol. 86(1), pp. 133-140.
Castellani, D., and F. Pieri (2013). "R&D offshoring and the productivity growth of European
regions," Research Policy, vol. 42(9), pp 1581-1594.
Castellani, D., A. Jimenez, and A. Zanfei (2013). "How remote are R&D labs? Distance factors
and international innovative activities," Journal of International Business Studies, vol.
44(7), pp. 649-675.
Di Gregorio, D., M. Musteen, and D. Thomas (2009). “Offshoring as a Source of International
Competitiveness for SMEs.” Journal of International Business Studies, vol. 40(6), pp.
969-988.
Dixit, A. (2007). The Transfer Stage of Build-Operate-Transfer: Tensilica’s Experience.
Available at http://www.sourcingmag.com/the-transfer-stage-of-build-operate-
transfer-tensilicas-experience/
Dossani, R. and M. Kenney (2007). “The Next Wave of Globalization: Relocating Service
Provision to India.” World Development, vol. 35, pp. 772-791.
Gereffi, G. (1999). “International Trade and Industrial Upgrading in the Apparel Commodity Chain.”
Journal of International Economics vol. 48(1), pp. 37-70.
Feenstra, R. and G. H. Hanson (1997). “Foreign Direct Investment and Relative Wages:
Evidence from Mexico’s Maquiladoras.” Journal of International Economics, vol. 42(3),
pp. 371-393.
Frederick, S. and Gereffi, G., 2011. Upgrading and restructuring in the global apparel value

31
chain: why China and Asia are outperforming Mexico and Central America. International
Journal of Technological Learning, Innovation and Development, 4(1-3), pp.67-95.
Hummels, D., J. Ishii and K.-M. Yi (2001). “The nature and growth of vertical specialization in
world trade.” Journal of International Economics, vol. 54(1), pp. 75–96.
Humphrey, J. and Schmitz, H., 2002. How does insertion in global value chains affect upgrading
in industrial clusters?. Regional studies, 36(9), pp.1017-1027.
Johnson, R. C. and G. Noguera (2012). “Accounting for intermediates: Production sharing and
trade in value added.” Journal of International Economics, vol. 86(2), pp. 224-236.
Johnson, R. C. and G. Noguera (2017). “A Portrait of Trade in Value Added over Four
Decades.” The Review of Economics and Statistics, vol. 99(5), pp. 896-911.
Kee, H. L. and H. Tang (2016). “Domestic Value Added in Exports: Theory and Firm Evidence
from China.” American Economic Review, vol. 106(6), pp. 1402-1436.
Keen, M. and S. Smith (2006). “VAT fraud and evasion: What do we know and what can be done,”
National Tax Journal, Vol. 59, No. 4, pp. 861–87.
Kenney, M., S. Massini, T. P. Murtha (2009). “Offshoring administrative and technical
work: New fields for understanding the global enterprise” Journal of International
Business Studies, vol. 40, pp. 887-900.
Koopman, Robert, Zhi Wang, Shang-Jin Wei (2012), “Estimating domestic content in exports
when processing trade is pervasive”, Journal of Development Economics, vol. 99(1), pp.
178-189.
Koopman, R., Z. Wang and S.-J. Wei (2014). “Tracing Value-Added and Double Counting in
Gross Exports.” American Economic Review, vol. 104(2), pp. 459–494.
Leontief, W. (1949). “Recent Developments in the Study of Interindustrial Relationships.”
American Economic Review, vol. 39(3), Papers and Proceedings of the Sixty-first Annual
Meeting of the American Economic Association, pp. 211-225.
Lewin, A. Y., S. Massini, C. Peeters (2009). “Why are companies offshoring innovation? The
emerging global race for talent” Journal of International Business Studies, vol. 40, pp.
901- 925.
Lipsey, R. E. (2010). “Measuring the Location of Production in a World of Intangible Productive
Assets, FDI and Intrafirm Trade.” Review of Income and Wealth, vol. 56(S1), pp S99-
S110.
Los, B., M. P. Timmer and G. J. de Vries (2016). “Tracing Value-Added and Double Counting in
Gross Exports: Comment.” American Economic Review, vol. 106(7), pp. 1958-1966.
Los, B. and M. P. Timmer (2018). “Measuring Bilateral Exports of Value Added: A Unified

32
Framework.” NBER Working paper 24896.
O'Mahony, M. and Timmer, M.P., 2009. Output, input and productivity measures at the industry
level: the EU KLEMS database. The economic journal, 119(538), pp.F374-F403.
Markusen, J. R. (2002). Multinational Firms and the Theory of International Trade. MIT Press,
Cambridge.
Meng, B., Z. Wang, R. Koopman (2013). “How are Global Value Chains Fragmented and
Extended in China’s Domestic Production Networks? IDE Discussion Paper No. 424.
Meng, B., Y. Fang, J. Guo, Y. Zhang (2017). “Measuring China’s domestic production networks
through trade in value-added perspectives.” Economic Systems Research, vol. 29(1), pp.
48-65.
Miller, R.E. and P.D. Blair (2009). Input–output Analysis: Foundations and Extensions,
Cambridge University Press, Cambridge.
Mudambi, R. (2008). “Location, control and innovation in knowledge-intensive Industries”
Journal of Economic Geography, vol. 8(5), pp. 699–725.
NBS SY. National Bureau of Statistics of China (various issues). China Statistical Yearbook
(Zhongguo tongli nianjian). Beijing: China Statistical Publishing House.
Nieto, M. J., and A. Rodríguez (2011). “Offshoring of R&D: Looking abroad to improve
innovation performance” Journal of International Business Studies, vol. 42, pp. 345-
361.
Reimer, J. (2006) "Global production sharing and trade in the services of factors," Journal of
International Economics, Elsevier, vol. 68(2), pages 384-408.
Shah, R. (2005) Offshoring to India: A Case Study about Ketera Technologies. Available at
http://www.sourcingmag.com/the-transfer-stage-of-build-operate-transfer-
tensilicas-experience/
Sturgeon, T. and G. Gereffi (2009). “Measuring Success in the Global Economy: International
Trade, Industrial Upgrading, and Business Function Outsourcing in Global Value
Chains.” Transnational Corporations, vol. 18(2), pp. 1-35.
Timmer A. A. Erumban, B. Los, R. Stehrer, G. J. de Vries (2014) "Slicing Up Global Value
Chains" Journal of Economic Perspectives, vol. 28(2), pp. 99-118.
Trefler, D. and S. Zhu (2010). ‘The structure of factor content predictions’, Journal of
International Economics, 82(2), 195–207.
Timmer, M. P., S. Miroudot, G. J. de Vries (2018). “Functional Specialization in Trade” mimeo
University of Groningen.
Xing, W., Whalley, J. and Li, S. (2015) “Value, structure and spatial distribution of

33
interprovincial trade in China.” China & World Economy, 23(4), pp.84-103.
Zhang Y. and Qi S. (2012). China’s Multi-Regional Input-Output Models for 2002 and 2007.
Beijing: China Statistics Press. (in Chinese)
34
Appendix Tables
Appendix Table A1. Provinces in China
Beijing Heilongjiang Shandong Chongqing Qinghai
Tianjin Shanghai Henan Sichuan Ningxia
Hebei Jiangsu Hubei Guizhou Xinjiang
Shanxi Zhejiang Hunan Yunnan
Inner Mongolia Anhui Guangdong Tibet
Liaoning Fujian Guangxi Shaanxi
Jilin Jiangxi Hainan Gansu
Notes: These are the 31 provinces for which NBS provides survey-based
provincial input-output tables. For 2002, a provincial input-output table
for Tibet is not available.
Appendix TableA2. Industries distinguished
IO Code Description Business
function share
1 Agriculture agr
2 Coal mining, washing and processing min
3 Crude petroleum and natural gas products min
4 Metal ore mining min
5 Non-ferrous mineral mining min
6 Manufacture of food products and tobacco processing low-tech man
7 Textile goods low-tech man
8 Wearing apparel, leather, furs, down and related products low-tech man
9 Sawmills and furniture low-tech man
10 Paper and products, printing and record medium reproduction low-tech man
11 Petroleum processing, coking and nuclear fuel processing mid-tech man
12 Chemicals mid-tech man
13 Nonmetal mineral products mid-tech man
14 Metals smelting and pressing mid-tech man
15 Metal products mid-tech man
16 Common equipment mid-tech man
17 Special equipment high-tech man
18 Transport equipment high-tech man
19 Electric equipment and machinery high-tech man
35
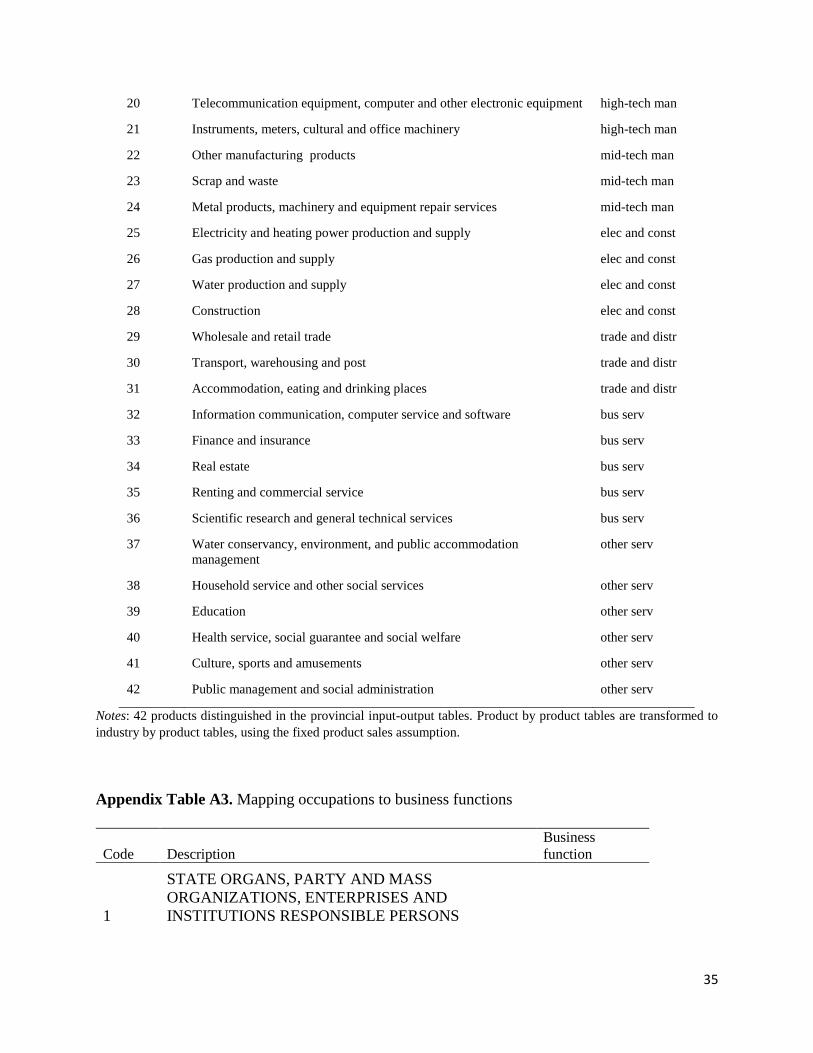
20 Telecommunication equipment, computer and other electronic equipment high-tech man
21 Instruments, meters, cultural and office machinery high-tech man
22 Other manufacturing products mid-tech man
23 Scrap and waste mid-tech man
24 Metal products, machinery and equipment repair services mid-tech man
25 Electricity and heating power production and supply elec and const
26 Gas production and supply elec and const
27 Water production and supply elec and const
28 Construction elec and const
29 Wholesale and retail trade trade and distr
30 Transport, warehousing and post trade and distr
31 Accommodation, eating and drinking places trade and distr
32 Information communication, computer service and software bus serv
33 Finance and insurance bus serv
34 Real estate bus serv
35 Renting and commercial service bus serv
36 Scientific research and general technical services bus serv
37 Water conservancy, environment, and public accommodation
management
other serv
38 Household service and other social services other serv
39 Education other serv
40 Health service, social guarantee and social welfare other serv
41 Culture, sports and amusements other serv
42 Public management and social administration other serv
Notes: 42 products distinguished in the provincial input-output tables. Product by product tables are transformed to
industry by product tables, using the fixed product sales assumption.
Appendix Table A3. Mapping occupations to business functions
Code Description
Business
function
1
STATE ORGANS, PARTY AND MASS
ORGANIZATIONS, ENTERPRISES AND
INSTITUTIONS RESPONSIBLE PERSONS
36
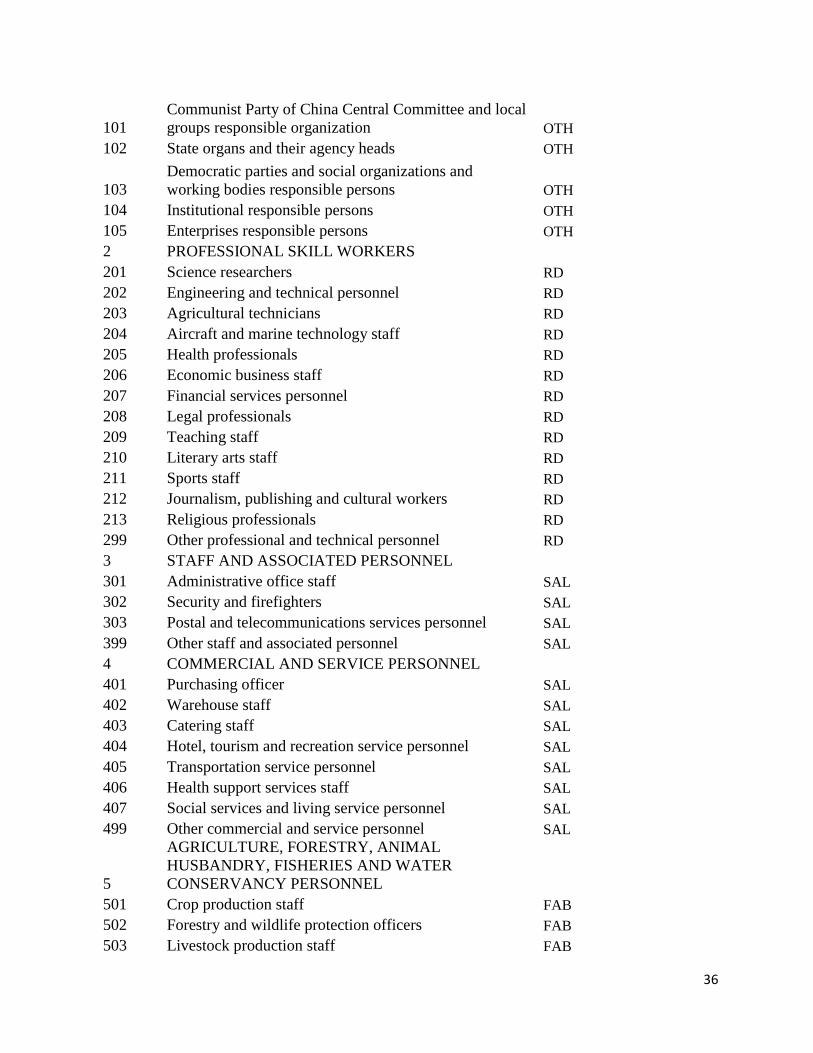
101
Communist Party of China Central Committee and local
groups responsible organization OTH
102 State organs and their agency heads OTH
103
Democratic parties and social organizations and
working bodies responsible persons OTH
104 Institutional responsible persons OTH
105 Enterprises responsible persons OTH
2 PROFESSIONAL SKILL WORKERS 201 Science researchers RD
202 Engineering and technical personnel RD
203 Agricultural technicians RD
204 Aircraft and marine technology staff RD
205 Health professionals RD
206 Economic business staff RD
207 Financial services personnel RD
208 Legal professionals RD
209 Teaching staff RD
210 Literary arts staff RD
211 Sports staff RD
212 Journalism, publishing and cultural workers RD
213 Religious professionals RD
299 Other professional and technical personnel RD
3 STAFF AND ASSOCIATED PERSONNEL 301 Administrative office staff SAL
302 Security and firefighters SAL
303 Postal and telecommunications services personnel SAL
399 Other staff and associated personnel SAL
4 COMMERCIAL AND SERVICE PERSONNEL 401 Purchasing officer SAL
402 Warehouse staff SAL
403 Catering staff SAL
404 Hotel, tourism and recreation service personnel SAL
405 Transportation service personnel SAL
406 Health support services staff SAL
407 Social services and living service personnel SAL
499 Other commercial and service personnel SAL
5
AGRICULTURE, FORESTRY, ANIMAL
HUSBANDRY, FISHERIES AND WATER
CONSERVANCY PERSONNEL 501 Crop production staff FAB
502 Forestry and wildlife protection officers FAB
503 Livestock production staff FAB
37
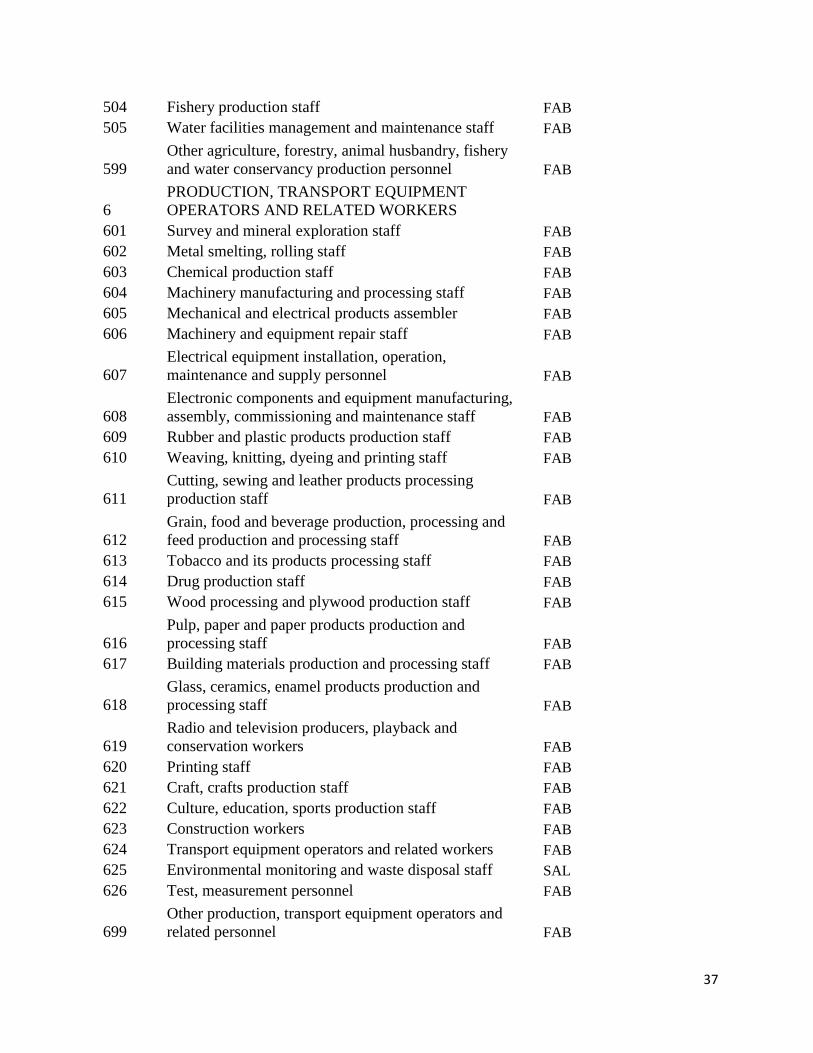
504 Fishery production staff FAB
505 Water facilities management and maintenance staff FAB
599
Other agriculture, forestry, animal husbandry, fishery
and water conservancy production personnel FAB
6
PRODUCTION, TRANSPORT EQUIPMENT
OPERATORS AND RELATED WORKERS 601 Survey and mineral exploration staff FAB
602 Metal smelting, rolling staff FAB
603 Chemical production staff FAB
604 Machinery manufacturing and processing staff FAB
605 Mechanical and electrical products assembler FAB
606 Machinery and equipment repair staff FAB
607
Electrical equipment installation, operation,
maintenance and supply personnel FAB
608
Electronic components and equipment manufacturing,
assembly, commissioning and maintenance staff FAB
609 Rubber and plastic products production staff FAB
610 Weaving, knitting, dyeing and printing staff FAB
611
Cutting, sewing and leather products processing
production staff FAB
612
Grain, food and beverage production, processing and
feed production and processing staff FAB
613 Tobacco and its products processing staff FAB
614 Drug production staff FAB
615 Wood processing and plywood production staff FAB
616
Pulp, paper and paper products production and
processing staff FAB
617 Building materials production and processing staff FAB
618
Glass, ceramics, enamel products production and
processing staff FAB
619
Radio and television producers, playback and
conservation workers FAB
620 Printing staff FAB
621 Craft, crafts production staff FAB
622 Culture, education, sports production staff FAB
623 Construction workers FAB
624 Transport equipment operators and related workers FAB
625 Environmental monitoring and waste disposal staff SAL
626 Test, measurement personnel FAB
699
Other production, transport equipment operators and
related personnel FAB

38
7 SOLDIER 700 Soldier excluded
8 OTHER 800 Other practitioners inconvenience classification FAB Notes: occupations distinguished in the China population census 2000 and 2010. Mapped into business
functions. OTH refers to other support activities; RD to R&D; SAL to sales and marketing; FAB to
fabrication activities.