Embed Size (px)
Citation preview

This Bulletin covers major developments in the Wholesale Electricity Market (WEM) of Ghana from 1 April 2017 to 30 April 2017. It st th
analyses the performance of the key WEM indicators against their benchmarks, and examines the likely implications of any discernable trends in the market.
The Energy Commission (EC) would very much appreciate and welcome comments from readers on the Bulletin. Reasonable care has been taken to ensure that the information contained in this Bulletin is accurate at the time of publication, nevertheless, any errors, omissions or inaccuracies therein are regretted.
HIGHLIGHTS OF THE MONTH Overview of the Month
The significant event in April 2017 was the first time full month operation of the AKSA Plant which started commissioning procedure in March 2017. The AKSA Power Plant generated at an average of 3.09 GWh per day in April 2017 which is over 5 folds of its generation in March 2017 (0.58 GWh per day). Low availability of LCO at the Tema Power Enclave caused TT1PP to reduce its generation by 62% and CENIT Plant did not operate at all in April 2017. This notwithstanding, the operation of AKSA plant coupled with further improved generation from TICO Plant and sustained high generation levels of Ameri Plant and Karpowership Plant in April 2017 ensured demand was met while at the same time reducing the level of generation from the hydro generation sources in an effort to slow down the drop rate of the water level. The average generation of TICO increased by 24.7% from 3.07 GWh per day recorded in March 2017 to 3.83 GWh per day in April 2017. Ameri and Karpowership Power Plants also supplied an average of 5.21 GWh per day and 5.35 GWh per day in March 2017.
Supply from the Akosombo GS reduced by 11.4% from an average generation of 17.07 GWh per day in March 2017 to 15.13 GWh per day in April 2017, Kpong GS reduced by 3.6% from an average generation of 2.51 GWh per day in March 2017 to 2.42 GWh per day in April 2017 and the Bui GS reduced by 29.2% from an average generation of 2.09 GWh per day in March 2017 to 1.48 GWh per day in April 2017. These reductions in electricity supply from the hydro power plants helped in reducing the rate of drop in the water level of the hydro power plants strategically to prevent them from generating below their minimum operating water levels. Akosombo GS water level dropped by an average of 0.072 feet per day in
GHANA WHOLESALE ELECTRICITYMARKET BULLETIN
MARKET WATCHMonthly Market Data Analysis
ISSUE NO. 16: April 2017 to April 2017st th
1 30
Compiled by Electricity Market Oversight Panel Secretariat 01
Table 1 Projected and Actual Outturn of electricity demand and supply in April 2017
April 2017, which was 6.5% lower than the average drop rate of 0.077 feet per day recorded in March 2017. Similarly, the Bui GS recorded a significant reduction in its water level drop rate by 32.2% from 0.121 feet per day in March 2017 to 0.082 feet per day in April 2017.
Import from CIE increased marginally from 0.53 GWh per day in March 2017 to 0.6 GWh per day in April 2017 while export to CEB decreased from 1.2 GWh per day in March 2017 to 0.64 GWh per day in April 2017. The average total electricity supply decreased to 39.41 GWh per day in April 2017 from an average of 41.8 GWh per day recorded in March 2017. There was adequate supply available in reserve (especially from the hydro sources and KTPP which did not generate due to availability of cheaper sources of generation) to meet demand hence the decrease in supply can be attributed to decrease in demand in April 2017 due to cold weather associated with the on set of the raining season. This caused the reduced use of air conditioners and fans in household hence the reduced demand.
There was a significant reduction in the System Marginal Cost (SMC) of electricity in April 2017 due to the operation of the AKSA Plant which was a cheaper source of generation than TT1PP, KTPP and CENIT which all operated in March 2017. The SMC reduced by 67.6% in April 2017 (US$ 92.11 per MWh) compared to the SMC recorded in March 2017 (US$ 136.26 per MWh), affirming the need to secure cheaper sources of thermal electricity generation in Ghana.
Electricity Demand and Supply
Electricity Demand
The System Peak Load (Ghana Peak Load plus Import) increased marginally from 2,152.8 MW in March 2017 to 2,160.8 MW in April 2017. Similarly the Ghana Peak Load (Domestic Peak Load including VALCo minus Export) increased marginally from 2,105.8 MW in March 2017 to 2,108.8 MW in April 2017. The System Peak Load in April 2017 was lower (3.4%) than the projected System Peak load of 2,235 MW under the 2017 ESP, while the Ghana Peak Load was marginally lower (0.3%) than the projected Ghana Peak Load of 2,102 MW for April 2017 under the 2017 ESP.
Electricity supply
The average daily electricity supplied to meet Ghana’s requirement decreased marginally to 40.7 GWh per day in April 2017 from 41.8 GWh per day recorded in March 2017. The total electricity supply in April 2017 was 1,221.8 GWh consisting of 1,203.83 GWh from domestic generation and 17.98 GWh of imports from La Cote D’Ivoire. The total supply of electricity in April 2017 was 116.3 GWh lower than the 1,338.1 GWh projected under the Electricity Supply Plan (ESP) developed for the year 2017. This represents an 8.7% deviation between the outturn and the projection. The deviation was due to the lower than expected imports from CIE and lower supply from the hydro power plants.
Hydro Dam Levels
Akosombo Dam Water Level dropped in April 2017 but at a reduced rate
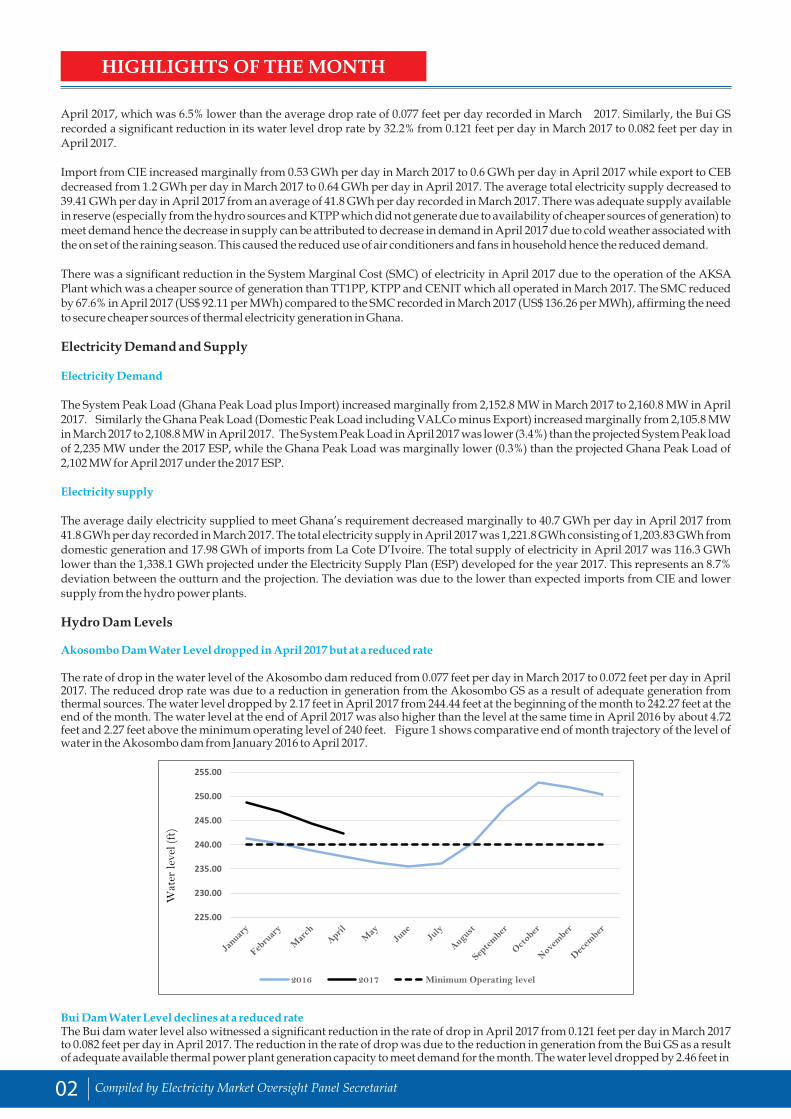
The rate of drop in the water level of the Akosombo dam reduced from 0.077 feet per day in March 2017 to 0.072 feet per day in April 2017. The reduced drop rate was due to a reduction in generation from the Akosombo GS as a result of adequate generation from thermal sources. The water level dropped by 2.17 feet in April 2017 from 244.44 feet at the beginning of the month to 242.27 feet at the end of the month. The water level at the end of April 2017 was also higher than the level at the same time in April 2016 by about 4.72 feet and 2.27 feet above the minimum operating level of 240 feet. Figure 1 shows comparative end of month trajectory of the level of water in the Akosombo dam from January 2016 to April 2017.
Figure 1: Month-End Water Level for Akosombo Dam from January 2016 to April 2017
Bui Dam Water Level declines at a reduced rateThe Bui dam water level also witnessed a significant reduction in the rate of drop in April 2017 from 0.121 feet per day in March 2017 to 0.082 feet per day in April 2017. The reduction in the rate of drop was due to the reduction in generation from the Bui GS as a result of adequate available thermal power plant generation capacity to meet demand for the month. The water level dropped by 2.46 feet in
HIGHLIGHTS OF THE MONTH
Compiled by Electricity Market Oversight Panel Secretariat02

HIGHLIGHTS OF THE MONTH
Compiled by Electricity Market Oversight Panel Secretariat 03
April 2017 from 3.74 feet in March 2017. The water level dropped from 572.82 feet level at the beginning of the month to 565.21 feet at end of the month. For the first time in 2017, the water level at the end of the month for Bui GS (559.01 feet) was above the level of the dam at the same period in April 2016 (554.39 feet) by 4.62 feet due to the reduced generation from the Power Plant. Figure 2 shows comparative end of month trajectory of the level of water in the Bui dam from January 2016 to April 2017.
Figure 2: Month-End Water Level for Bui Dam from January 2016 to April 2017
Fuel Supply for Power Generation
Liquid fuel continued to dominate the fuel supply mix in April 2017 but its shares in the fuel supply mix reduced from 55.2% in March 2017 to 52% in April 2017 with natural gas accounting for the rest. Shares of DFO reduced from 4% of the total fuel mix in March 2017 to 2% in April 2017 whiles the share of LCO reduced from 27% to 13% in March 2017 and April 2017 respectively. There was however an increase in the shares of HFO from 23% in March 2017 of the total fuel mix to 37% in April 2017 due to the increase generation from the AKSA Power Plant.
On the individual fuel level, natural gas continued to dominate the fuel supply mix. Natural gas constituted 48% of the total fuel supply mix in April 2017, which was 3% higher than the 45% recorded in March 2017. Natural gas supply from the WAGPCo increased from 7.6% of the share of the total fuel supplied in March 2017 to 9.1% in April 2017. Correspondingly, natural gas supply from the AGPP increased from 37.1% of the total fuel supplied in March 2017 to 39.1% in April 2017.
Figure 3a and Figure 3b shows the shares of sources of fuel and fuel type in the generation fuel mix for electricity generation respectively.
Figure 3a: Shares of sources of fuel in total fuel mix for power generation Figure 3b: Shares of fuel type in the generation fuel mix power generation
Natural gas supplies from WAGPCo increased marginallyNatural gas flow rate from Nigeria through the WAGP to Tema and Kpone increased marginally to 16.8 MMSCF per day in April 2017 from the 13.7 MMSCF per day recorded in March 2017. Total supply increased to 484 MMSCF (19.4%) in April 2017 from 405.9 MMSCF in March 2017. Natural gas supply from the WAGP accounted for 18.8% of the total natural gas supply in April 2017. As in March 2017, there was a steady supply of natural gas from the WAGP for electricity generation by the Sunon Asogli Power Plant in April 2017.
Natural gas supply from GNCC increased marginally Natural gas flow rate from the AGPP to the Aboadze Power Enclave increased from 64.7 MMSF per day in March 2017 to 69.87 MMSCF per day in April 207. Total gas supply from the Atuabo Gas Processing plant to the Aboadze Power Enclave of 1,906.3 MMSCF in April 2017 was 5% higher than the 1,815.59 MMSCF supplied in March 2017. Natural gas supply from the AGPP accounted for 81.2% of the total natural gas supply in April 2017. Of the total natural gas supplied in April 2017, 72.3% was used by the Ameri Power Plant for electricity generation whiles the remaining 27.7% was used by the TICO Power plant.

Compiled by Electricity Market Oversight Panel Secretariat04
Figure 4a: Contribution of Gas Supply by sources Figure 4b: Contribution of individual fuel in the liquid fuel supply
Liquid Fuel
A total of 499,183 bbls of liquid fuel was used by thermal power plants in April 2017. This total comprised of 24% LCO, 4% DFO and 72% of HFO. LCO has lost its dominance in the liquid fuel supply mix as its share of the total liquid fuel supply reduced to 24% in April 2017 from 49.9% in March 2017. Share of HFO in the Liquid fuel supply mix increased from 37.6% in March 2017 to 72% in April 2017. The increase in HFO usage is attributed to the full commercial operation of the AKSA Power Plant in April 2017. Share of DFO in the total liquid fuel supply mix dropped further to 4% in April 2017 from 7% in March 2017.
A total of 133,319 bbls of LCO was used for electricity generation in April 2017, which was 55.1% lower than the 296,906 bbls used in March 2017. Of this total, 55% was used by power plants in the Tema and Kpone whiles 45% was used in the Aboadze Power Enclave.
DFO consumption decreased further in April 2017 by 42.6% from 40,889 bbls in March 2017 to 23,550 bbls in April 2017, primarily due to the shutdown of KTPP as a result of the availability of cheaper sources of electricity. Of the total of 23,550 bbls of DFO used in April 2017, 97.9% was used by Trojan Power Plants in Tema and Kumasi.
HFO consumption increased significantly in April 2017 by 52.4% from 224,777 bbls in March 2017 to 342,513 bbls in April 2017. Of this total, 62.1% was used by the Karpowership power plant and 37.9% was used by the newly constructed AKSA power plant.
Plant by Plant Highlights
Electricity Generation at the Akosombo Generation Station (GS) dropped further in April 2017The Akosombo GS operated for the entire month of April 2017, generating 454.02 GWh of electricity which was 75.27 GWh lower than it generated in March 2017 of 529.29 GWh. Average generation from the Akosombo GS decreased from 17.07 GWh per day in March 2017 to15.13 GWh per day in April 2017 due to increased supply of electricity from thermal sources. The Akosombo GS share of the total electricity supply continued to decline in April 2017 from 40.8% in March 2017 to 37.2% in April 2017. A drop in the share of Akosombo GS in the total electricity supply mix was anticipated in the 2017 Electricity Supply Plan (ESP) but the actual percentage outturn differed from the projection. The 2017 ESP projected supply from the Akosombo GS to drop from 26.7% in March 2017 and 22.9% in April 2017. The Akosombo GS generated 47.9% higher than the 307 GWh projected under the 2017 ESP. The Akosombo GS contributed 857 MW (39.7%) to meet the System Peak Load which is marginally higher than the 714 MW (33.2%) it contributed in March 2017. Similarly, the Akosombo GS contributed 854.5 MW (40.5%) to the Ghana Peak Load of 2,108.8 MW in April 2017, higher than the 714 MW (33.9%) recorded in March 2017.
Electricity supply by Kpong Generation Station (GS) continued to declineThe Kpong GS generated a total of 72.7 GWh in April 2017 lower than the 77.92 GWh it generated in March 2017. The Kpong GS generated an average of 2.42 GWh a day in April 2017 which was 3.6% lower than in March 2017. The generation from the Kpong GS was 19.2% higher than the 61 GWh projected for April 2017 under the 2017 ESP. The Kpong GS contributed 114 MW (5.28%) to meet System Peak Load in April 2017, higher than the 105 MW (4.88%) recorded in March 2017. Similarly, the Kpong GS contributed 110.1 MW (5.2%) to the Ghana Peak Load in April 2017, which was higher than the 105 MW (4.99%) recorded in March 2017.
Electricity supply by the Bui Generation Station (GS) continued to decline significantly Electricity production from the Bui Power Plant decreased significantly in April 2017 to 44.39 GWh (1.48 GWh per day) from 115.36 GWh (4.12 GWh per day) in February 2017 and 64.65 GWh (2.09 GWh per day) in March 2017. This represents a decrease of 64.1% between February 2017 and April 2017 and 29.2% between March 2017 and April 2017, based on the daily average production of the months. The daily average generation suggests that the Bui GS operated largely with two units at peak in April 2017. The Bui GS supplied 3.6% of the total electricity supplied in April 2017, lower than the 5% it supplied in March 2017. The total electricity generated in April 2017 from the Bui Power Plant was 22.6% lower than the 59 GWh projected to be generated under the 2017 Electricity Supply Plan (ESP). The Bui power plant contributed 199 MW to meet both the System Peak Load (2,160.8 MW) and Ghana Peak Loads (2,108.8 MW), which represents 9.2% and 9.4% respectively.
Generation by the Sunon Asogli Power Plant (SAPP) continued to declineThe Sunon Asogli Power Plant (SAPP) operated for the whole of April 2017 and generated a total of 75.26 GWh of electricity (2.51 GWh per day), a marginal drop from the 80.57 GWh (2.6 GWh per day) generated in March 2017. The Power Plant contributed 6.2% of the total electricity supplied in April 2017, which was the same amount contributed in March 2017 but lower than the 14.3% projected under the 2017 ESP for April 2017. The SAPP contributed 139.7 MW (6.5%) to meet the System Peak Load of 2,160.8 MW which was lower than the 211.4 MW (9.8%) contributed in March 2017. Likewise, the SAPP contributed 94.8 MW (4.5%) to meet the Ghana Peak
HIGHLIGHTS OF THE MONTH

Compiled by Electricity Market Oversight Panel Secretariat 05
MMSCF of natural gas and 21,408 bbls of LCO at an estimated heat rate of 8,327.75 Btu/kWh, a marginal drop in fuel efficiency as compared 8,270.2 Btu/KWh recorded in March 2017.
CENIT Power Plant did not operate in April 2017The CENIT Power Plant was offline for the whole of April 2017 due to low levels of Light Crude Oil (LCO) stocks to power the plant. The Power Plant was correctly projected to be offline in April 2017 under the 2017 ESP.
Ameri Energy Power Plant generation increased marginallyElectricity generation from the Ameri Energy Power Plant increased marginally from 5.09 GWh per day in March 2017 to 5.21 GWh per day in April 2017. However, the total electricity generation of 156.26 GWh was marginally lower than the 157.67 GWh supplied in March 2017 due to the greater number of days in March than in April 2017. The Ameri Power Plant generated 11.6% higher than the 140 GWh projected under the 2017 ESP. The total of electricity generated by Ameri Power Plant in April 2017 represented 12.8% of total electricity supplied in the month which was higher than the 12.2% recorded in March 2017. The Ameri Power Plant consumed 1,377.59 MMSCF of natural gas to generate the 156.26 GWh of electricity at an estimated average heat rate of 10,234.72 Btu/kWh a marginal reduction from the 10,207.55 Btu/kWh recorded in March 2017. The Ameri Power Plant contributed 233.1 MW (10.8%) to meet the System Peak Load in April 2017 which was lower than the 238.4 MW (11.1%) recorded in March 2017. Similarly, the Ameri Power Plant contributed 228.4 MW (10.8%) to meet the Ghana Peak Load in April 2017 which was lower than the 238.4 MW (11.3%) recorded in March 2017.
Kpone Thermal Power Plant (KTPP) did not operate in April 2017The Kpone Power Plant was offline for the whole of April 2017 due to availability of cheaper sources of electricity. The Power Plant was correctly projected to be offline in April 2017 under the 2017 ESP.
Karpowership Power Plant generation reduced marginallyThe Karpowership Power Plant generated every day in the month of April 2017, generating an average of 5.35 GWh per day which was lower than the average generation of 5.38 GWh per day recorded in March 2017. Total electricity supplied by Karpowership in April 2017 was 160.55 GWh which was 3.7% lower than the 166.73 GWh supplied in March 2017 and 7.8% higher than the 148 GWh projected under the 2017 ESP. The Power Plant contributed 13.1% of the total electricity supplied in April 2017, which is marginally higher than its contribution of 12.9% in March 2017 and 11.1% projected under the 2017 ESP. The Karpowership also contributed 10.1% and 10.8% to meet the System Peak Load and Ghana Peak Load respectively in April 2017 compared to the 10.5% and 10.8% of the System Peak Load and Ghana Peak Load respectively in March 2017. The Karpowership Power Plant consumed 212,669 barrels of Heavy Fuel oil (HFO) to generate the 160.55 GWh in April 2017 at an average heat rate of 8,000.83 Btu/kWh which is a marginal improvement on the 8,024.16 Btu/kWh recorded in March 2017.
AKSA Power Plant declares partial Commercial Operation Date (COD) in April 2017 thThe AKSA Power Plant declared partial COD (160 MW) on 13 April 2017 with 11 units installed. A total of 250 MW is scheduled to be
declared by the end of June 2017 and 320 MW by mid-August. The AKSA Power Plant generated 92.85 GWh in April 2017 significantly higher than the 2.33 GWh generated in March 2017 and the 69 GWh projected under the 2017 ESP. The Power Plant supplied 7.6% of the total electricity supplied in April 2017, which is significantly higher than the marginal 0.2% supplied in March 2017. The Power Plant contributed 149.9 MW (6.9%) to meet the System Peak Load and 150.6 MW (7.1%) to meet the Ghana Peak Load in April 2017. A total of 129,845 bbls of HFO was consumed by the AKSA Power Plant at an average heat rate of 8,496.58 Btu/kWh a marginal increase from the 8,481.92 Btu/kWh recorded in March 2017.
Takoradi International Company (TICO) continued to increase its generationThe TICO Power plant operated throughout the month of April 2017 and generated a total of 114.83 GWh of electricity (average of 3.83 GWh per day) representing 9.4% of total electricity supplied in April 2017. The supply from the TICO Power Plant was 19.8% higher than it supplied in March 2017 and constituted the same 9.4% of the total supply. The Power Plant generated at half capacity due to technical challenges to one of its gas turbines. The TICO Power Plant in April 2017 contributed 161 MW (7.5%) and 155.5 MW (7.4%) to meet the System Peak Load and Ghana Peak Load respectively. Likewise, the TICO Power plant contributed 158 MW (7.3%) and 158 (7.5%) to System Peak Load and Ghana Peak Load respectively in March 2017. The Power Plant operated on both light crude oil (LCO) and natural gas consuming about 136,877 barrels of LCO and 528.71 MMSCF of natural gas to produce the 114.83 GWh of electricity at an estimated average heat rate of 8,107.22 Btu/kWh, an improvement over the 8,677.6 Btu/kWh recorded in March 2017.
Takoradi Power Company (TAPCO) Plant remained offlineThe TAPCO Power Plant was offline throughout the month of April 2017. The power plant was offline in April 2017 because works on Gas Turbine 1 (rotor ground fault) and major inspection on Gas Turbine 2 were not completed. The Power Plant was however not projected to be offline in April 2017 under the 2017 ESP.
Tema Thermal 1 Power Plant (TT1PP) generation dropped significantly in April 2017The Tema Thermal 1 Power Plant, (TT1PP) operated for only 13 days in April 2017 due to low level of LCO stocks and generated a total of 24.4 GWh of electricity which was 62.3% lower than the 64.65 GWh of electricity it generated in March 2017. It was however not projected to generate electricity in April 2017 under the 2017 ESP. The TT1PP made no contribution in meeting either the System Peak Load or Ghana Peak Load in April 2017. The power plant operated solely on LCO consuming about 51,966 barrels of LCO to generate 24.4 GWh of electricity at an average heat rate of 11,329.2 Btu/kWh, a marginal improvement over the 11,350.17 Btu/kWh recorded in March 2017.
Trojan Power Plant generation dropped marginallyThe Trojan Power Plant generated a total of 8.57 GWh of electricity in April 2017, which was 15.6% lower than the 10.15 GWh of electricity it generated in March 2017. Of the total generation of 8.57 GWh, Trojan Power Plant in Kumasi accounted for14.1% whiles Trojan Power Plant in Tema accounted for 85.9%. A total of 22,864 bbls of DFO was used by Trojan power plant for electricity generation, 18,870 bbls was used in the Tema power Load of 2,038.30 MW which was also lower than the 211.4 MW (10%) contributed
HIGHLIGHTS OF THE MONTH

Compiled by Electricity Market Oversight Panel Secretariat06
in March 2017. The SAPP consumed a total of 484.43 enclave to generate 7.37 GWh of electricity at an average heat rate of 13,764.63 Btu/kWh while 3,994 bbls was used to generate 1.21 GWh of electricity at Kumasi at an average heat rate of 16,913.32 Btu/kWh. The Power Plant was however projected to be offline under the 2017 ESP.
Electricity Exchange – Imports increased marginally while export decreased yet Ghana remained a net exporter
Electricity imports from La Cote D’Ivoire increased marginally to 17.98 GWh (0.6 GWh per day) in April 2017 from 16.46 GWh (0.53 GWh per day) in March 2017. Total import in April 2017 was significantly lower than the 91 GWh projected under the 2017 ESP. Electricity import contributed 1.5% of the total electricity supplied in April 2017. Daily peak import in April 2017 reached a maximum of 88 MW and contributed 4.2% and 1.3% to meet the System Peak Load and Ghana Peak Load respectively in April 2017.
Electricity export to CEB decreased significantly from 37.19 GWh (1.2 GWh per day) in March 2017 to 19.10 GWh (0.64 GWh per day) in April 2017 and was significantly lower than the 77 GWh projected under 2017 ESP. Ghana was a net exporter of electricity in April 2017 similar to March 2017.
HIGHLIGHTS OF THE MONTH

Compiled by Electricity Market Oversight Panel Secretariat 07
OPERATIONAL FACT SHEET
Apr-17
Maximum System Peak Load MW 2,160.8
Minimum System Peak Load MW 1,873.1
Average Peak Generation MW 1,956.1
System Base Load MW 1,242.6
Total Electricity GWh 1,221.8
Load Factor (LF) % 76.0
Ghana Electricity Demand

Compiled by Electricity Market Oversight Panel Secretariat08
OPERATIONAL FACT SHEET

Compiled by Electricity Market Oversight Panel Secretariat 09
ECONOMIC FACT SHEET
92.11
173.02 165.16
0 50 100 150
DecemberNovemeber
OctoberSeptember
AugustJulyJuneMay
AprilMarch
FebruaryJanuary
Spot Market Price from April 2017
Cost (US$/MWh)
-
5.00
10.00
15.00
20.00
25.00
US
cen
t/K
Wh
Average Fuel Cost of Generation of Thermal Power Plants
Power Plants
Apr-17
Fuel Type Unit Delivered Cost
Natural Gas US$/MMBtu 8.73
LCO US$/BBL 63.00
HFO (Karpowership) US$/Tonne 350.79
HFO (Tema) US$/Tonne 370.79
DFO US$/Tonne 600.66
Average Fuel Prices
Akosombo92%
Kpong8%
Contribution to Legacy Hydro windfall revenue - April 2017
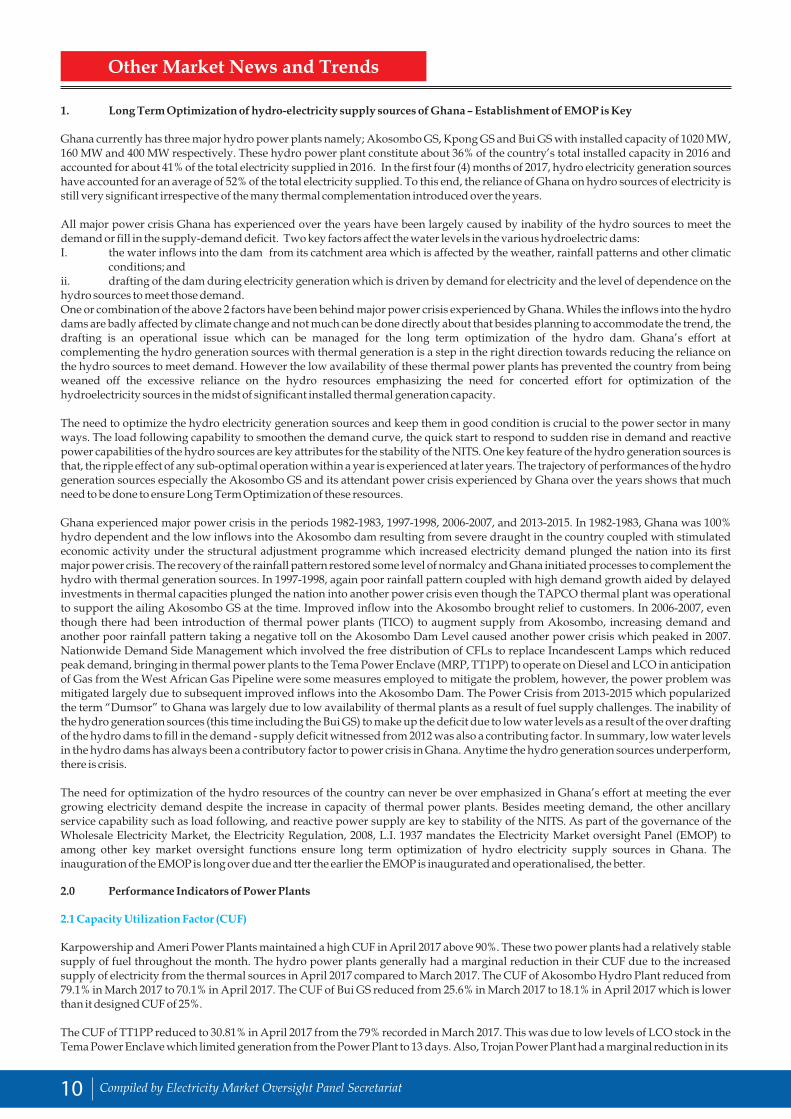
1. Long Term Optimization of hydro-electricity supply sources of Ghana – Establishment of EMOP is Key
Ghana currently has three major hydro power plants namely; Akosombo GS, Kpong GS and Bui GS with installed capacity of 1020 MW, 160 MW and 400 MW respectively. These hydro power plant constitute about 36% of the country’s total installed capacity in 2016 and accounted for about 41% of the total electricity supplied in 2016. In the first four (4) months of 2017, hydro electricity generation sources have accounted for an average of 52% of the total electricity supplied. To this end, the reliance of Ghana on hydro sources of electricity is still very significant irrespective of the many thermal complementation introduced over the years.
All major power crisis Ghana has experienced over the years have been largely caused by inability of the hydro sources to meet the demand or fill in the supply-demand deficit. Two key factors affect the water levels in the various hydroelectric dams:I. the water inflows into the dam from its catchment area which is affected by the weather, rainfall patterns and other climatic conditions; and ii. drafting of the dam during electricity generation which is driven by demand for electricity and the level of dependence on the hydro sources to meet those demand.One or combination of the above 2 factors have been behind major power crisis experienced by Ghana. Whiles the inflows into the hydro dams are badly affected by climate change and not much can be done directly about that besides planning to accommodate the trend, the drafting is an operational issue which can be managed for the long term optimization of the hydro dam. Ghana’s effort at complementing the hydro generation sources with thermal generation is a step in the right direction towards reducing the reliance on the hydro sources to meet demand. However the low availability of these thermal power plants has prevented the country from being weaned off the excessive reliance on the hydro resources emphasizing the need for concerted effort for optimization of the hydroelectricity sources in the midst of significant installed thermal generation capacity.
The need to optimize the hydro electricity generation sources and keep them in good condition is crucial to the power sector in many ways. The load following capability to smoothen the demand curve, the quick start to respond to sudden rise in demand and reactive power capabilities of the hydro sources are key attributes for the stability of the NITS. One key feature of the hydro generation sources is that, the ripple effect of any sub-optimal operation within a year is experienced at later years. The trajectory of performances of the hydro generation sources especially the Akosombo GS and its attendant power crisis experienced by Ghana over the years shows that much need to be done to ensure Long Term Optimization of these resources.
Ghana experienced major power crisis in the periods 1982-1983, 1997-1998, 2006-2007, and 2013-2015. In 1982-1983, Ghana was 100% hydro dependent and the low inflows into the Akosombo dam resulting from severe draught in the country coupled with stimulated economic activity under the structural adjustment programme which increased electricity demand plunged the nation into its first major power crisis. The recovery of the rainfall pattern restored some level of normalcy and Ghana initiated processes to complement the hydro with thermal generation sources. In 1997-1998, again poor rainfall pattern coupled with high demand growth aided by delayed investments in thermal capacities plunged the nation into another power crisis even though the TAPCO thermal plant was operational to support the ailing Akosombo GS at the time. Improved inflow into the Akosombo brought relief to customers. In 2006-2007, even though there had been introduction of thermal power plants (TICO) to augment supply from Akosombo, increasing demand and another poor rainfall pattern taking a negative toll on the Akosombo Dam Level caused another power crisis which peaked in 2007. Nationwide Demand Side Management which involved the free distribution of CFLs to replace Incandescent Lamps which reduced peak demand, bringing in thermal power plants to the Tema Power Enclave (MRP, TT1PP) to operate on Diesel and LCO in anticipation of Gas from the West African Gas Pipeline were some measures employed to mitigate the problem, however, the power problem was mitigated largely due to subsequent improved inflows into the Akosombo Dam. The Power Crisis from 2013-2015 which popularized the term “Dumsor” to Ghana was largely due to low availability of thermal plants as a result of fuel supply challenges. The inability of the hydro generation sources (this time including the Bui GS) to make up the deficit due to low water levels as a result of the over drafting of the hydro dams to fill in the demand - supply deficit witnessed from 2012 was also a contributing factor. In summary, low water levels in the hydro dams has always been a contributory factor to power crisis in Ghana. Anytime the hydro generation sources underperform, there is crisis.
The need for optimization of the hydro resources of the country can never be over emphasized in Ghana’s effort at meeting the ever growing electricity demand despite the increase in capacity of thermal power plants. Besides meeting demand, the other ancillary service capability such as load following, and reactive power supply are key to stability of the NITS. As part of the governance of the Wholesale Electricity Market, the Electricity Regulation, 2008, L.I. 1937 mandates the Electricity Market oversight Panel (EMOP) to among other key market oversight functions ensure long term optimization of hydro electricity supply sources in Ghana. The inauguration of the EMOP is long over due and tter the earlier the EMOP is inaugurated and operationalised, the better.
2.0 Performance Indicators of Power Plants
2.1 Capacity Utilization Factor (CUF)
Karpowership and Ameri Power Plants maintained a high CUF in April 2017 above 90%. These two power plants had a relatively stable supply of fuel throughout the month. The hydro power plants generally had a marginal reduction in their CUF due to the increased supply of electricity from the thermal sources in April 2017 compared to March 2017. The CUF of Akosombo Hydro Plant reduced from 79.1% in March 2017 to 70.1% in April 2017. The CUF of Bui GS reduced from 25.6% in March 2017 to 18.1% in April 2017 which is lower than it designed CUF of 25%.
The CUF of TT1PP reduced to 30.81% in April 2017 from the 79% recorded in March 2017. This was due to low levels of LCO stock in the Tema Power Enclave which limited generation from the Power Plant to 13 days. Also, Trojan Power Plant had a marginal reduction in its
Other Market News and Trends
Compiled by Electricity Market Oversight Panel Secretariat10

CUF from 24.4% in April 2017 to 21.3% in March 2017. The SAPP had a stable CUF of 21.7% in March 2017 and 20.9% in April 2017. AKSA Power Plant operated throughout April 2017 and had an increase in its CUF from 2% in March 2017 to 80.6% in April 2017 as it declared
thpartial COD on 13 April 2017.
The System Load Factor (LF) reached its maximum since the beginning of 2017 in March 2017 at 80.9%. Load factor in April 2017 was 76%, marginally lower than the 80.9% recorded in March 2017.
The Plant utilisation factors of the various plants is contained in table 2.1.
Table 2.1.1: Power Plant Capacity Utilization, Average heat rate and Average Fuel Cost of Generation
2.2 Heat Rate (Fuel Efficiency)TICO Power Plant overtook Karpowership Power Plant to be the most efficient power plant in April 2017.TICO Power Plant had a heat rate of 7,679.6 Btu/kWh in April 2017 as it generated predominantly on combined cycle mode. Karpowership had heat rate of 8,000.5 Btu/kWh, a marginal improvement over the 8,023.8 Btu/kWh recorded in March 2017. Karpowership Power Plant was the second most fuel efficient power plant in April 2017. The Trojan Power Plant had a heat rate of 14,330.4 Btu/kWh and was the least efficient power plant in April 2017.
Figure 2.1 shows the ranking of the thermal power plants based on their efficiency levels with their corresponding fuel cost of electricity generation. The chart indicates the effect of fuel prices on the cost of generation of the thermal power plants.
Figure 2.1: Fuel efficiency ranking of thermal power plants with their respective fuel cost of generation.
2.3 Average Fuel Cost of Electricity GenerationTrojan Power Plant which had the lowest heat rate in April 2017 recorded the highest fuel cost of generation. Aside it being the least fuel efficient power plant in April 2017, it also operated on a more expensive fuel, DFO, for electricity generation. DFO cost in April 2017 was relatively higher than all the other fuels types used in April 2017.
TICO Power Plant which was the most efficient power plant in April had a higher fuel cost of generation that Karpowership and SAPP which were the second and third most efficient power plant respectively in April 2017 due to the relative higher cost of fuel for generation by TICO (US$ 10.05/MMBtu) compared to HFO (US$ 9.1/MMBtu) for Karpowership and cost of fuel for SAPP (US$ 9.09/MMBtu)
Other Market News and Trends
Compiled by Electricity Market Oversight Panel Secretariat 11

For any enquiries please contact the: EMOP Administrator, EMOP Secretariat, Energy Commission, Accra.
Telephone: +233-302813756/7/9; Or email: [email protected]