Embed Size (px)
DESCRIPTION
Molecular genetic
Citation preview

T2DM GWAS in the Lebanesepopulation confirms the role of TCF7L2and CDKAL1 in disease susceptibilityMichella Ghassibe-Sabbagh1, Marc Haber1, Angelique K. Salloum1, Yasser Al-Sarraj2, Yasmine Akle3,Kamal Hirbli1,4, Jihane Romanos1, Francis Mouzaya1, Dominique Gauguier5, Daniel E. Platt6,Hatem El-Shanti2,7 & Pierre A. Zalloua1,8
1Lebanese American University, School of Medicine, Beirut 1102 2801, Lebanon, 2Shafallah Medical Genetics Center, Doha,Qatar, 3Centre Hospitalier du Nord-CHN, Zgharta, Lebanon, 4University Medical Center - Rizk Hospital (UMC-RH), Lebanon,5INSERM, UMRS872, Centre de Recherche des Cordeliers, Paris, France, 6Bioinformatics and Pattern Discovery, IBM T. J. WatsonResearch Centre, Yorktown Hgts, NY 10598, USA, 7University of Iowa Carver College of Medicine, Iowa City, 8Harvard School ofPublic Health, Boston MA 02215, USA.
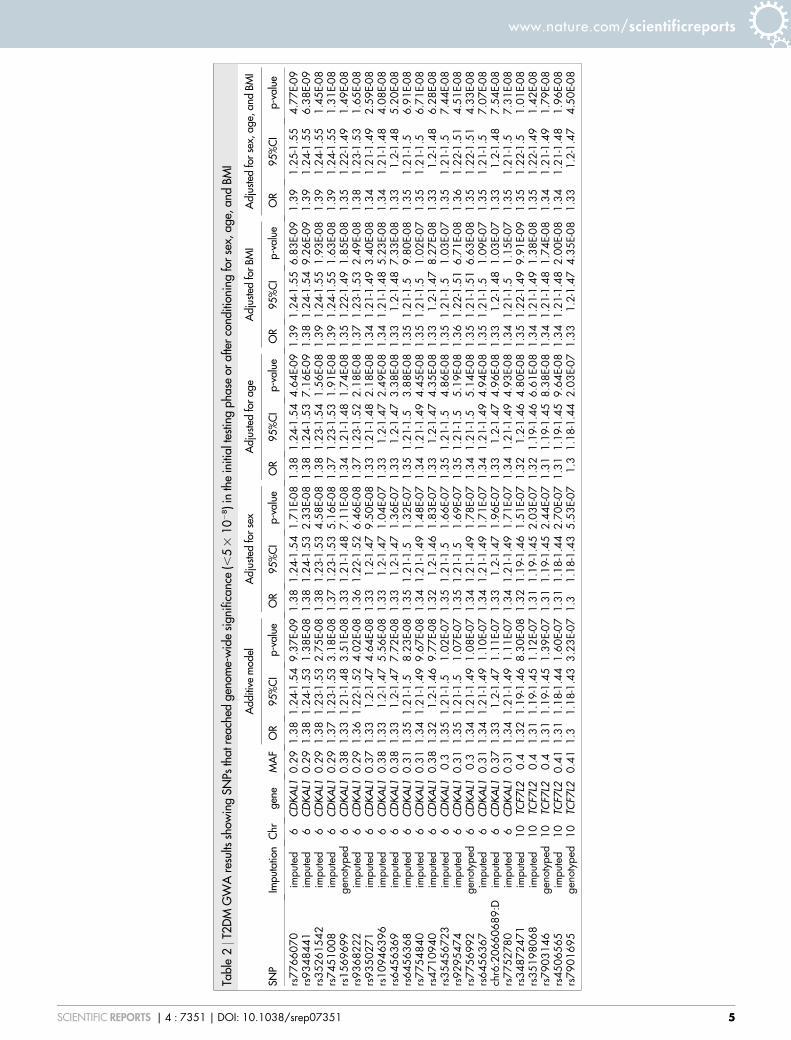
Genome-wide association studies (GWAS) of multiple populations with distinctive genetic and lifestylebackgrounds are crucial to the understanding of Type 2 Diabetes Mellitus (T2DM) pathophysiology. Wereport a GWAS on the genetic basis of T2DM in a 3,286 Lebanese participants. More than 5,000,000 SNPswere directly genotyped or imputed using the 1000 Genomes Project reference panels. We identifygenome-wide significant variants in two loci CDKAL1 and TCF7L2, independent of sex, age and BMI, withleading variants rs7766070 (OR 5 1.39, P 5 4.77 3 1029) and rs34872471 (OR 5 1.35, P 5 1.01 3 1028)respectively. The current study is the first GWAS to find genomic regions implicated in T2DM in theLebanese population. The results support a central role of CDKAL1 and TCF7L2 in T2DM susceptibility inSouthwest Asian populations and provide a plausible component for understanding molecular mechanismsinvolved in the disease.
Type 2 diabetes mellitus (T2DM) is a chronic metabolic disease with a complex pathogenesis defined bygenetic predisposition and environmental factors1. In Lebanon, T2DM was evaluated on 8,050 Lebanesecases in 1990. Its prevalence and incidence, similar to the international averages, were 5.0% and 1.5 to 1.7%
respectively2. In 1992, a study on 436 cases from all over the Lebanese territory gave prevalence of 7 to 8% forT2DM and 10 to 11% for impaired glucose tolerance3. In 2005, a study on 3,000 exclusively Lebanese individualsfrom Greater Beirut showed a prevalence of 11.3% which increased with older age4. The combined prevalence ofpreviously and newly diagnosed T2DM was 15.8%. At that time, in the U.S., 6.3% of the population had T2DM:4.5% diagnosed and 1.8% undiagnosed according to the 2004 National Diabetes Fact Sheet. These results suggestthat the prevalence of T2DM in Greater Beirut is relatively high and is increasing among the Lebanese population.
Furthermore, according to the latest figures in the American National Diabetes Statistics Report, 29.1 millionchildren and adults in the United States have diabetes, and 86 million people have prediabetes5. The pathogenesisof T2DM is closely associated with a positive family history, male gender, age over 45 years, overweight, hyper-tension, and abnormal lipid levels. In addition, the genetic contribution to T2DM is well recognized with a total of91 established associated susceptibility loci6–17. The common variants in the reported loci however account for onlya small proportion of the heritability of T2DM and the functional role of most of these variants remains far fromclear. It is possible that a large number of highly-penetrant but rare T2DM susceptibility genetic variants remain tobe identified. Additional genome-wide explorations including whole genome and exome sequencing in well-established groups of patients and controls may unravel these additional important genetic disease contributorswhich will undoubtedly help us understand the complex mechanisms involved in the development of T2DM.
The prevalence of T2DM is distinctly variable across populations and this variability adds to the diseasecomplexity. This variability could be due to differences in lifestyle factors such as dietary habits, as well asbehavioral patterns among populations. Multiple established T2DM susceptibility genetic loci have been iden-tified from previous Genome Wide Association Studies (GWAS) in populations of European and Asian ethni-cities17–19. It is however, equally important to replicate the behavior of these previously discovered associated
OPEN
SUBJECT AREAS:DISEASES
GENOME-WIDE ASSOCIATIONSTUDIES
Received7 January 2014
Accepted14 November 2014
Published8 December 2014
Correspondence andrequests for materials
should be addressed toP.A.Z. (pierre.
SCIENTIFIC REPORTS | 4 : 7351 | DOI: 10.1038/srep07351 1

variants in ethnically different populations and to identify novelpredisposing genetic factors that may be stronger in their associationthan in previously studied populations.
To identify T2DM susceptibility loci in the Lebanese population,we performed a GWAS of more than 5,000,000 SNPs, which weredirectly genotyped or imputed using the 1000 Genomes Project ref-erence panels. Our study enrolled 1,388 patients and 1,902 non-diabetic subjects with detailed cross-sectional demographic andclinical information. Previously, targeted T2DM susceptibility SNPreplication studies have been conducted in the Lebanese population.However, this study seeks to establish a baseline association forT2DM in the Lebanese population and thus it is the first genome-wide scan to find genomic regions implicated in T2DM. We alsomake use of recent reference data from the 1000 Genomes Project,which was previously shown to identify novel and refined associa-tions for type 2 diabetes mellitus20,21.
ResultsThe study population has a mean age of 62.9 (611.1) (Table 1). Thehealthy control group has a mean age of 62.40 (611.82), compared to63.62 6 (9.98) for the T2DM patients. Sixty-three percent of the
individuals were males with 40.05 percent suffering from T2DM.The mean BMI was of 28.1 (64.6) according to standard measures.52 samples that failed genotype call rate (,95%)27 and that showedrelatedness (kinship coefficient range . 0.0442)28, were removed.
Imputation. 37995922 sites were imputed. The final set included5891794 SNPs kept after QC (MAF . 0.05, AIMs removal). Theaccuracy of the genotype imputation depends on the array SNPcoverage and the similarity of haplotypes between the studydataset and the reference panels. The Lebanese population waspreviously shown to be genetically very close to Europeans29 thatare well represented in the 1000 Genomes Project references. Thisresulted in high imputation accuracy as shown by Impute2 certaintymetric (Figure 1). Figure 1 shows biased imputation confidencedepending on chip with the HumanOmniExpress (,700,000SNPs) having better imputation accuracy compared to the QuadBeadChips (,550,000 SNPs). However, leading principal compo-nents reveals no bias regarding population coverage or stratifi-cation between chips (FigureS1).
Association with T2DM. To map genetic loci associated withT2DM, genotyped and imputed data in 3,286 Lebanese individuals
Table 1 | Distribution in the surveyed population of age, gender, BMI, and coronary artery disease by T2DM diagnostic status
Healthy controls T2DM patients Total
Sample size 1,902 1,384 3,286Age (SD) 62.40 (11.82) 63.62 (9.98) 62.92 (11.1)Gender (%)
Female 597 (54) 510 (46) 1107Male 1305 (60) 874 (40) 2179
BMI (SD) 28.07 (4.54) 28.21 (4.74) 28.13 (4.63)Coronary artery disease (%) 1300 (56) 1022 (44) 2,322
Figure 1 | Imputation accuracy. Per-sample imputation confidence scores between true genotypes and genotypes predicted by imputation, averaged over
imputation chunks. Accuracy increases with increased array SNP coverage.
www.nature.com/scientificreports
SCIENTIFIC REPORTS | 4 : 7351 | DOI: 10.1038/srep07351 2

were tested for association with the disease (Figure 2). We identifyvariations located on chromosomes 4, 6, 9, 10, 12, and 18 that showtrends of association with T2DM reaching P , 1025 under anadditive model (Supplementary Table 1). Seven variants located inCDKAL1 (cyclin-dependent kinase 5 regulatory subunit associatedprotein 1-like 1) reached genome-wide significance (P , 5 3 1028)with lead signal rs7766070 (OR 5 1.38, P 5 9.37 3 1029) (Figure 3,Table 2).
Adjustment for sex, age, and BMI (Table 2) identified 16 addi-tional genome-wide significant variants in CDKAL1 and TCF7L2(Transcription factor 7-like 2) and showed that association of thesetwo loci with T2DM appear to be independent from age and BMI.These variants are also added to Table S1 along with imputationscores.
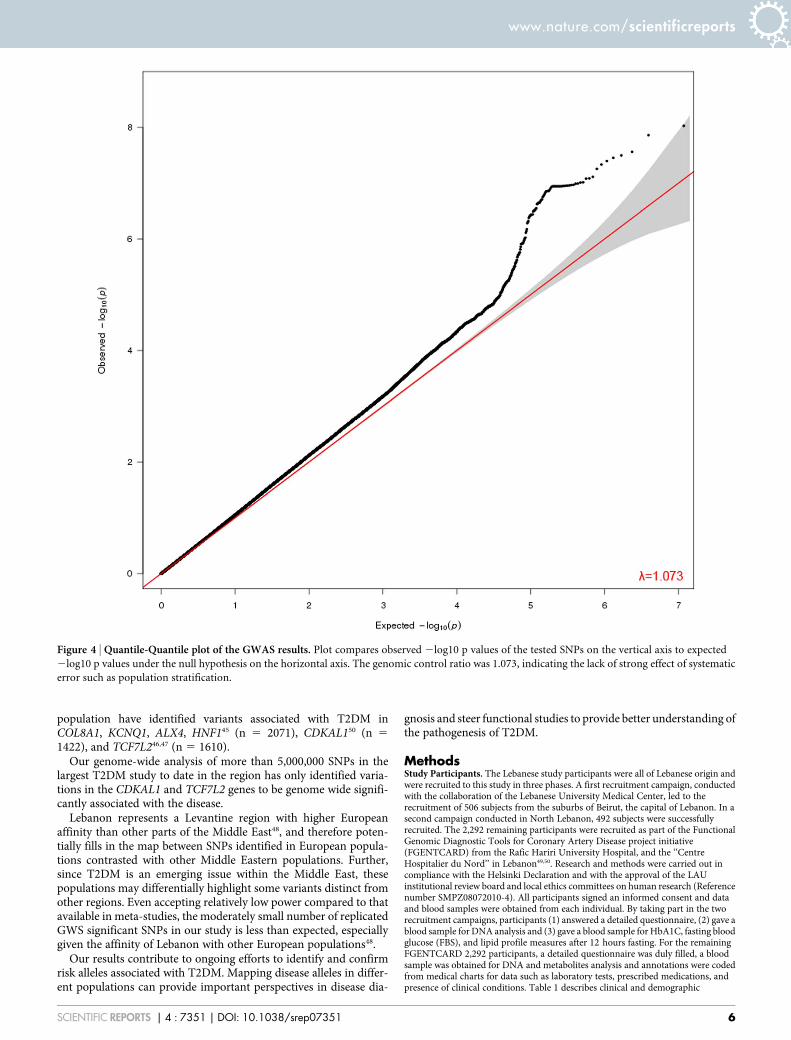
The genomic control inflation factor (l) which compares observedassociation statistics against the expected distribution, was 1.073suggesting possible but marginal over-dispersion of the associationstatistics (Figure 4)30.
SNPs of interest that showed trend of association but did not reachgenome-wide significance were 12 variants on chromosome 9(Supplementary Table 1), overlapping a region with microRNA3910-1 and 3910-2 downstream the gene ROR2 (receptor tyrosinekinase-like orphan receptor 2).
Three of the SNPs, rs7766070, rs9368222, and rs34872471, iden-tified in Table 2 were significant in DIAGRAM consortium6,7,9–11,15,17.One other, rs1044083315, was identified but not genome wide signifi-cant (Table S2), but which may be of particular interest in MiddleEastern populations31. Table S2 lists DIAGRAM consortium studySNPs along with comparisons with our results and imputation con-fidence scores.
DiscussionT2DM global prevalence has been steadily increasing over the past 50years and is today considered a major international health concern.In addition to environmental factors such as diet and lifestyle, geneticsusceptibility appears to have substantial role in the etiology ofT2DM. Furthermore, T2DM risk alleles show significant disparityin frequencies across worldwide populations. Studies analyzing dis-tribution patterns of genetic diseases found that T2DM risk allelesdemonstrated the most extreme differentiation32, with populationfrequencies decreasing from Sub-Saharan Africa, and throughEurope to East Asia32,33.
The current work contributes to the ongoing worldwide effort toidentify the genetic factors that affect the risk of T2DM. We provideanalysis in a novel population that is highly admixed with ancestralcomponents from the Middle East, Europe, Central Asia, andsub-Saharan Africa29. The risk alleles identified in the Lebanesepopulation could assist in understanding the disparity in T2DMprevalence across worldwide populations.
We report the first genome-wide scan for genetic susceptibility toT2DM in Lebanese subjects. We demonstrate strong association ofT2DM with CDKAL1 and TCF7L2 genes previously shown to pre-dispose to this condition15,18,19,24,26,34–37. A large number of geneticvariants have recently been identified to be associated with T2DMin GWASs in Europeans6,10,15,17,19,25. The elucidation of the geneticmechanisms responsible for the heterogeneous condition of T2DMin different ethnicities may give important contributions to betterunderstand the complexity of this disease. While some associationsare consistent across different ethnic groups38,39, some, like theTCF7L2 variants, have been found to be heterogeneous6,25. Our studyconfirmed genome-wide association of 23 different variants acrossthe CDKAL1 and TCF7L2 genes previously reported to play a role inT2DM in different populations23,40,41. This association remained sig-nificant after adjustment for sex, age, and BMI, suggesting that theserisk factors are not likely to be major contributors to the observedassociation.
After adjusting for age and BMI, most variants in CDKAL1 andTCF7L2 showed stronger association to T2DM, indicating that thesegenes confer susceptibility to T2DM independently from the classicalclinical risks. Functional studies of these two genes show theirimplication in down-regulating blood glucose level. CDKAL1encodes a 65 kD protein of unknown function expressed in pancre-atic islet and skeletal muscle26. CDKAL1 shows homology with CDK5regulatory subunit associated protein 1 (CDK5RAP1), an inhibitor ofCDK5 activation. CDK5 plays a role in the regulation of pancreaticbeta cell function by down-regulating insulin expression42,43. TheTCL7L2 gene product is a high mobility group (HMG) box-contain-ing transcription factor implicated in blood glucose homeostasis.TCL7L2 acts through regulation of proglucagon through repressionof the proglucagon gene in enteroendocrine cells via the Wnt signal-ing pathway44.
T2DM is a socio-economic burden in Lebanon and genetic studiesaim at posing important public health questions in regard to strat-egies for diagnosis, treatment, and prevention of the disease. Previousreplication studies examining a total of 29 SNPs in the Lebanese
Figure 2 | Manhattan plot. Plot shows results of T2DM GWA analysis assuming additive impact in 3286 Lebanese using .5,000,000 genotyped or
imputed SNPs. The Y-axis corresponds to the significance of the association (2log10 p-values). The X-axis represents the physical location of the variant
colored by chromosome.
www.nature.com/scientificreports
SCIENTIFIC REPORTS | 4 : 7351 | DOI: 10.1038/srep07351 3

Figure 3 | Regional association plots for the TCF7L2 (A) and CDKAL1 (B) genes. Each regional plot shows the chromosomal position (hg 19) of SNPs in
the specific region against 2log10 p values estimated assuming additive impact. The SNP with the highest association signal at each locus is shown as a
purple star; the other SNPs are colored according to the extent of LD with that SNP. Estimated recombination rates from the 1000 Genomes Project
European population (release March 2012) are shown as light blue lines.
www.nature.com/scientificreports
SCIENTIFIC REPORTS | 4 : 7351 | DOI: 10.1038/srep07351 4
Tabl
e2
|T2D
MG
WA
resu
ltssh
owin
gSN
Psth
atre
ache
dge
nom
e-w
ide
sign
ifica
nce
(,5
310
28)i
nth
ein
itial
test
ing
phas
eor
afte
rco
nditi
onin
gfo
rse
x,ag
e,an
dBM
I
Add
itive
mod
elA
djus
ted
for
sex
Adj
uste
dfo
rag
eA
djus
ted
for
BMI
Adj
uste
dfo
rse
x,ag
e,an
dBM
I
SNP
Impu
tatio
nC
hrge
neM
AF
OR
95%
CI
p-va
lue
OR
95%
CI
p-va
lue
OR
95%
CI
p-va
lue
OR
95%
CI
p-va
lue
OR
95%
CI
p-va
lue
rs77
6607
0im
pute
d6
CD
KA
L10.
291.
381.
24-1
.54
9.37
E-09
1.38
1.24
-1.5
41.
71E-
081.
381.
24-1
.54
4.64
E-09
1.39
1.24
-1.5
56.
83E-
091.
391.
25-1
.55
4.77
E-09
rs93
4844
1im
pute
d6
CD
KA
L10.
291.
381.
24-1
.53
1.38
E-08
1.38
1.24
-1.5
32.
33E-
081.
381.
24-1
.53
7.16
E-09
1.38
1.24
-1.5
49.
26E-
091.
391.
24-1
.55
6.38
E-09
rs35
2615
42im
pute
d6
CD
KA
L10.
291.
381.
23-1
.53
2.75
E-08
1.38
1.23
-1.5
34.
58E-
081.
381.
23-1
.54
1.56
E-08
1.39
1.24
-1.5
51.
93E-
081.
391.
24-1
.55
1.45
E-08
rs74
5100
8im
pute
d6
CD
KA
L10.
291.
371.
23-1
.53
3.18
E-08
1.37
1.23
-1.5
35.
16E-
081.
371.
23-1
.53
1.91
E-08
1.39
1.24
-1.5
51.
63E-
081.
391.
24-1
.55
1.31
E-08
rs15
6969
9ge
noty
ped
6C
DK
AL1
0.38
1.33
1.21
-1.4
83.
51E-
081.
331.
21-1
.48
7.11
E-08
1.34
1.21
-1.4
81.
74E-
081.
351.
22-1
.49
1.85
E-08
1.35
1.22
-1.4
91.
49E-
08rs
9368
222
impu
ted
6C
DK
AL1
0.29
1.36
1.22
-1.5
24.
02E-
081.
361.
22-1
.52
6.46
E-08
1.37
1.23
-1.5
22.
18E-
081.
371.
23-1
.53
2.49
E-08
1.38
1.23
-1.5
31.
65E-
08rs
9350
271
impu
ted
6C
DK
AL1
0.37
1.33
1.2-
1.47
4.64
E-08
1.33
1.2-
1.47
9.50
E-08
1.33
1.21
-1.4
82.
18E-
081.
341.
21-1
.49
3.40
E-08
1.34
1.21
-1.4
92.
59E-
08rs
1094
6396
impu
ted
6C
DK
AL1
0.38
1.33
1.2-
1.47
5.56
E-08
1.33
1.2-
1.47
1.04
E-07
1.33
1.2-
1.47
2.49
E-08
1.34
1.21
-1.4
85.
23E-
081.
341.
21-1
.48
4.08
E-08
rs64
5636
9im
pute
d6
CD
KA
L10.
381.
331.
2-1.
477.
72E-
081.
331.
2-1.
471.
36E-
071.
331.
2-1.
473.
38E-
081.
331.
2-1.
487.
33E-
081.
331.
2-1.
485.
20E-
08rs
6456
368
impu
ted
6C
DK
AL1
0.31
1.35
1.21
-1.5
8.23
E-08
1.35
1.21
-1.5
1.32
E-07
1.35
1.21
-1.5
3.88
E-08
1.35
1.21
-1.5
9.80
E-08
1.35
1.21
-1.5
6.91
E-08
rs77
5484
0im
pute
d6
CD
KA
L10.
311.
341.
21-1
.49
9.67
E-08
1.34
1.21
-1.4
91.
48E-
071.
341.
21-1
.49
4.45
E-08
1.35
1.21
-1.5
1.02
E-07
1.35
1.21
-1.5
6.71
E-08
rs47
1094
0im
pute
d6
CD
KA
L10.
381.
321.
2-1.
469.
77E-
081.
321.
2-1.
461.
83E-
071.
331.
2-1.
474.
35E-
081.
331.
2-1.
478.
27E-
081.
331.
2-1.
486.
28E-
08rs
3545
6723
impu
ted
6C
DK
AL1
0.3
1.35
1.21
-1.5
1.02
E-07
1.35
1.21
-1.5
1.66
E-07
1.35
1.21
-1.5
4.86
E-08
1.35
1.21
-1.5
1.03
E-07
1.35
1.21
-1.5
7.44
E-08
rs92
9547
4im
pute
d6
CD
KA
L10.
311.
351.
21-1
.51.
07E-
071.
351.
21-1
.51.
69E-
071.
351.
21-1
.55.
19E-
081.
361.
22-1
.51
6.71
E-08
1.36
1.22
-1.5
14.
51E-
08rs
7756
992
geno
type
d6
CD
KA
L10.
31.
341.
21-1
.49
1.08
E-07
1.34
1.21
-1.4
91.
78E-
071.
341.
21-1
.55.
14E-
081.
351.
21-1
.51
6.63
E-08
1.35
1.22
-1.5
14.
33E-
08rs
6456
367
impu
ted
6C
DK
AL1
0.31
1.34
1.21
-1.4
91.
10E-
071.
341.
21-1
.49
1.71
E-07
1.34
1.21
-1.4
94.
94E-
081.
351.
21-1
.51.
09E-
071.
351.
21-1
.57.
07E-
08ch
r6:2
0660
689:
Dim
pute
d6
CD
KA
L10.
371.
331.
2-1.
471.
11E-
071.
331.
2-1.
471.
96E-
071.
331.
2-1.
474.
96E-
081.
331.
2-1.
481.
03E-
071.
331.
2-1.
487.
54E-
08rs
7752
780
impu
ted
6C
DK
AL1
0.31
1.34
1.21
-1.4
91.
11E-
071.
341.
21-1
.49
1.71
E-07
1.34
1.21
-1.4
94.
93E-
081.
341.
21-1
.51.
15E-
071.
351.
21-1
.57.
31E-
08rs
3487
2471
impu
ted
10TC
F7L2
0.4
1.32
1.19
-1.4
68.
30E-
081.
321.
19-1
.46
1.51
E-07
1.32
1.2-
1.46
4.80
E-08
1.35
1.22
-1.4
99.
91E-
091.
351.
22-1
.51.
01E-
08rs
3519
8068
impu
ted
10TC
F7L2
0.4
1.31
1.19
-1.4
51.
12E-
071.
311.
19-1
.45
2.03
E-07
1.32
1.19
-1.4
66.
61E-
081.
341.
21-1
.49
1.38
E-08
1.35
1.22
-1.4
91.
42E-
08rs
7903
146
geno
type
d10
TCF7
L20.
41.
311.
19-1
.45
1.39
E-07
1.31
1.19
-1.4
52.
44E-
071.
311.
19-1
.45
8.38
E-08
1.34
1.21
-1.4
81.
74E-
081.
341.
21-1
.49
1.79
E-08
rs45
0656
5im
pute
d10
TCF7
L20.
411.
311.
18-1
.44
1.60
E-07
1.31
1.18
-1.4
42.
70E-
071.
311.
19-1
.45
9.64
E-08
1.34
1.21
-1.4
82.
00E-
081.
341.
21-1
.48
1.96
E-08
rs79
0169
5ge
noty
ped
10TC
F7L2
0.41
1.3
1.18
-1.4
33.
23E-
071.
31.
18-1
.43
5.53
E-07
1.3
1.18
-1.4
42.
03E-
071.
331.
2-1.
474.
35E-
081.
331.
2-1.
474.
50E-
08
www.nature.com/scientificreports
SCIENTIFIC REPORTS | 4 : 7351 | DOI: 10.1038/srep07351 5
population have identified variants associated with T2DM inCOL8A1, KCNQ1, ALX4, HNF145 (n 5 2071), CDKAL150 (n 5
1422), and TCF7L246,47 (n 5 1610).Our genome-wide analysis of more than 5,000,000 SNPs in the
largest T2DM study to date in the region has only identified varia-tions in the CDKAL1 and TCF7L2 genes to be genome wide signifi-cantly associated with the disease.
Lebanon represents a Levantine region with higher Europeanaffinity than other parts of the Middle East48, and therefore poten-tially fills in the map between SNPs identified in European popula-tions contrasted with other Middle Eastern populations. Further,since T2DM is an emerging issue within the Middle East, thesepopulations may differentially highlight some variants distinct fromother regions. Even accepting relatively low power compared to thatavailable in meta-studies, the moderately small number of replicatedGWS significant SNPs in our study is less than expected, especiallygiven the affinity of Lebanon with other European populations48.
Our results contribute to ongoing efforts to identify and confirmrisk alleles associated with T2DM. Mapping disease alleles in differ-ent populations can provide important perspectives in disease dia-
gnosis and steer functional studies to provide better understanding ofthe pathogenesis of T2DM.
MethodsStudy Participants. The Lebanese study participants were all of Lebanese origin andwere recruited to this study in three phases. A first recruitment campaign, conductedwith the collaboration of the Lebanese University Medical Center, led to therecruitment of 506 subjects from the suburbs of Beirut, the capital of Lebanon. In asecond campaign conducted in North Lebanon, 492 subjects were successfullyrecruited. The 2,292 remaining participants were recruited as part of the FunctionalGenomic Diagnostic Tools for Coronary Artery Disease project initiative(FGENTCARD) from the Rafic Hariri University Hospital, and the ‘‘CentreHospitalier du Nord’’ in Lebanon49,50. Research and methods were carried out incompliance with the Helsinki Declaration and with the approval of the LAUinstitutional review board and local ethics committees on human research (Referencenumber SMPZ08072010-4). All participants signed an informed consent and dataand blood samples were obtained from each individual. By taking part in the tworecruitment campaigns, participants (1) answered a detailed questionnaire, (2) gave ablood sample for DNA analysis and (3) gave a blood sample for HbA1C, fasting bloodglucose (FBS), and lipid profile measures after 12 hours fasting. For the remainingFGENTCARD 2,292 participants, a detailed questionnaire was duly filled, a bloodsample was obtained for DNA and metabolites analysis and annotations were codedfrom medical charts for data such as laboratory tests, prescribed medications, andpresence of clinical conditions. Table 1 describes clinical and demographic
Figure 4 | Quantile-Quantile plot of the GWAS results. Plot compares observed 2log10 p values of the tested SNPs on the vertical axis to expected
2log10 p values under the null hypothesis on the horizontal axis. The genomic control ratio was 1.073, indicating the lack of strong effect of systematic
error such as population stratification.
www.nature.com/scientificreports
SCIENTIFIC REPORTS | 4 : 7351 | DOI: 10.1038/srep07351 6
characteristics of the study participants49. Previously reported51 analysis of thesesubjects showed association with recruitment for questionnaire variables, such as‘‘exercise level,’’ ‘‘smoking usage’’. However, blood panel associations showed veryconsistent odds ratios for T2DM and coronary artery disease risk independently ofrecruitment.
Selection of Patients and Controls. For the 998 participants selected through the tworecruitment campaigns, an HbA1C of 48 mmol/mol (6.5%) was used as the cut-offpoint for diagnosing T2DM in line with the World Health Organization definition oftype 2 diabetes mellitus diagnosis52. For the 2,292 participants from theFGENTCARD project, T2DM was diagnosed by an ascertained physician supportedby subjects HbA1C levels and or their two-hour plasma glucose concentration afteran oral glucose tolerance test as documented in their medical records. For the controldataset, 85.23% of the participants were $50 years old and have no history of T2DM.Body mass index (BMI) was calculated according to standard measurements.Selection criteria for DNA analysis were based on the complete availability of thegenotyping data and the T2DM-relevant characteristics, resulting in the selection of3,286 subjects.
Genotyping and imputation. DNA was extracted using a standard phenol-chloroform extraction procedure. Samples were genotyped using IlluminaHumanOmniExpress-12V1-1 Multi-use (623 controls, 839 cases, ,700,000 SNPs)and Illumina Human610-660W Quad BeadChips (1279 controls, 545 cases,,550,000 SNPs). Plink27 was used for data management and quality control keeping3,286 samples with call rate $95%, SNPs call rate $98%, Hardy-Weinberg p . 1026,MAF $ 1%. Genotype data was converted to NCBI genome build 37 using LiftOver(http://genome.ucsc.edu/cgi-bin/hgLiftOver). Chromosomes were phased withSHAPEIT53 using the 1000 Genomes Phase I haplotypes54 provided on the IMPUTE2website (1000 Genomes Phase I integrated haplotypes (produced using SHAPEIT2),September 2013) based on sequence data for 1,092 TGP samples from release20110521. IMPUTE255 was employed to impute genotypes in blocks of ,5 Mb usingall populations in the 1000 Genomes Phase I data. Accuracy of imputation wasmeasured using IMPUTE2’s information metric ‘‘info’’.
Statistical analysis. GWAS can be confounded by population stratification. The mostcommon approach to correct for population stratification is to include the principalcomponents from the PCA as covariates. However, there is no solid method todetermine how many components to include and selection is usually subjective withinconclusive results. Correction for stratification becomes even more complicated inpopulations like the Lebanese where genetic structure is recent and not driven by the
usual factors of distance and geography29. Furthermore, previous studies have shownthat historical migrations to Lebanon have potentially created disease-associatedpopulation structures that are similar to those in the source populations22,56. In thisstudy, we use insights from our previous studies on population stratifications in theLebanese to avoid type 1 errors in the GWAS.
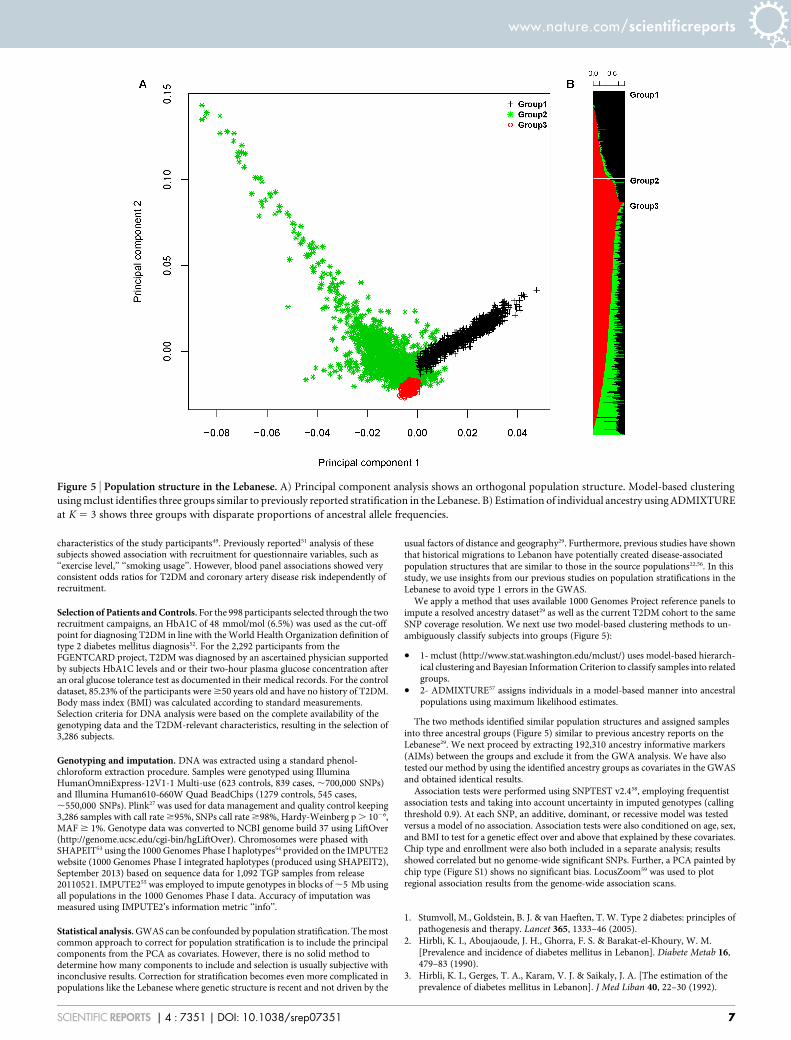
We apply a method that uses available 1000 Genomes Project reference panels toimpute a resolved ancestry dataset29 as well as the current T2DM cohort to the sameSNP coverage resolution. We next use two model-based clustering methods to un-ambiguously classify subjects into groups (Figure 5):
. 1- mclust (http://www.stat.washington.edu/mclust/) uses model-based hierarch-ical clustering and Bayesian Information Criterion to classify samples into relatedgroups.
. 2- ADMIXTURE57 assigns individuals in a model-based manner into ancestralpopulations using maximum likelihood estimates.
The two methods identified similar population structures and assigned samplesinto three ancestral groups (Figure 5) similar to previous ancestry reports on theLebanese29. We next proceed by extracting 192,310 ancestry informative markers(AIMs) between the groups and exclude it from the GWA analysis. We have alsotested our method by using the identified ancestry groups as covariates in the GWASand obtained identical results.
Association tests were performed using SNPTEST v2.458, employing frequentistassociation tests and taking into account uncertainty in imputed genotypes (callingthreshold 0.9). At each SNP, an additive, dominant, or recessive model was testedversus a model of no association. Association tests were also conditioned on age, sex,and BMI to test for a genetic effect over and above that explained by these covariates.Chip type and enrollment were also both included in a separate analysis; resultsshowed correlated but no genome-wide significant SNPs. Further, a PCA painted bychip type (Figure S1) shows no significant bias. LocusZoom59 was used to plotregional association results from the genome-wide association scans.
1. Stumvoll, M., Goldstein, B. J. & van Haeften, T. W. Type 2 diabetes: principles ofpathogenesis and therapy. Lancet 365, 1333–46 (2005).
2. Hirbli, K. I., Aboujaoude, J. H., Ghorra, F. S. & Barakat-el-Khoury, W. M.[Prevalence and incidence of diabetes mellitus in Lebanon]. Diabete Metab 16,479–83 (1990).
3. Hirbli, K. I., Gerges, T. A., Karam, V. J. & Saikaly, J. A. [The estimation of theprevalence of diabetes mellitus in Lebanon]. J Med Liban 40, 22–30 (1992).
Figure 5 | Population structure in the Lebanese. A) Principal component analysis shows an orthogonal population structure. Model-based clustering
using mclust identifies three groups similar to previously reported stratification in the Lebanese. B) Estimation of individual ancestry using ADMIXTURE
at K 5 3 shows three groups with disparate proportions of ancestral allele frequencies.
www.nature.com/scientificreports
SCIENTIFIC REPORTS | 4 : 7351 | DOI: 10.1038/srep07351 7

4. Hirbli, K. I. et al. Prevalence of diabetes in greater Beirut. Diabetes Care 28, 1262(2005).
5. Centers for Disease Control and Prevention. National Diabetes Statistics Report:Estimates of Diabetes and Its Burden in the United States, 2014. Atlanta, GA: USDepartment of Health and Human Services (2014) (Date of access:03/10/2014).Available from: http://www.cdc.gov/diabetes/pubs/statsreport14/national-diabetes-report-web.pdf.
6. Cho, Y. S. et al. Meta-analysis of genome-wide association studies identifies eightnew loci for type 2 diabetes in east Asians. Nat Genet 44, 67–72 (2012).
7. Dupuis, J. et al. New genetic loci implicated in fasting glucose homeostasis andtheir impact on type 2 diabetes risk. Nat Genet 42, 105–16 (2010).
8. Kong, A. et al. Parental origin of sequence variants associated with complexdiseases. Nature 462, 868–74 (2009).
9. Kooner, J. S. et al. Genome-wide association study in individuals of South Asianancestry identifies six new type 2 diabetes susceptibility loci. Nat Genet 43, 984–9(2011).
10. Morris, A. P. et al. Large-scale association analysis provides insights into thegenetic architecture and pathophysiology of type 2 diabetes. Nat Genet 44,981–990 (2012).
11. Qi, L. et al. Genetic variants at 2q24 are associated with susceptibility to type 2diabetes. Hum Mol Genet 19, 2706–15 (2010).
12. Scott, R. A. et al. Large-scale association analyses identify new loci influencingglycemic traits and provide insight into the underlying biological pathways. NatGenet 44, 991–1005 (2012).
13. Shu, X. O. et al. Identification of new genetic risk variants for type 2 diabetes. PLoSGenet 6, e1001127 (2010).
14. Tsai, F. J. et al. A genome-wide association study identifies susceptibility variantsfor type 2 diabetes in Han Chinese. PLoS Genet 6, e1000847 (2010).
15. Voight, B. F. et al. Twelve type 2 diabetes susceptibility loci identified throughlarge-scale association analysis. Nat Genet 42, 579–89 (2010).
16. Yamauchi, T. et al. A genome-wide association study in the Japanese populationidentifies susceptibility loci for type 2 diabetes at UBE2E2 and C2CD4A-C2CD4B. Nat Genet 42, 864–8 (2010).
17. Zeggini, E. et al. Meta-analysis of genome-wide association data and large-scalereplication identifies additional susceptibility loci for type 2 diabetes. Nat Genet40, 638–45 (2008).
18. Scott, L. J. et al. A genome-wide association study of type 2 diabetes in Finnsdetects multiple susceptibility variants. Science 316, 1341–5 (2007).
19. Unoki, H. et al. SNPs in KCNQ1 are associated with susceptibility to type 2diabetes in East Asian and European populations. Nat Genet 40, 1098–102 (2008).
20. Hara, K. et al. Genome-wide association study identifies three novel loci for type 2diabetes. Hum Mol Genet 23, 239–46 (2013).
21. Huang, J., Ellinghaus, D., Franke, A., Howie, B. & Li, Y. 1000 Genomes-basedimputation identifies novel and refined associations for the Wellcome Trust CaseControl Consortium phase 1 Data. Eur J Hum Genet 20, 801–5 (2012).
22. Haber, M. et al. Y-chromosome R-M343 African lineages and sickle cell diseasereveal structured assimilation in Lebanon. J Hum Genet 56, 29–33 (2011).
23. Peng, S. et al. TCF7L2 gene polymorphisms and type 2 diabetes risk: acomprehensive and updated meta-analysis involving 121, 174 subjects.Mutagenesis 28, 25–37 (2013).
24. Saxena, R. et al. Large-scale gene-centric meta-analysis across 39 studies identifiestype 2 diabetes loci. Am J Hum Genet 90, 410–25 (2012).
25. Saxena, R. et al. Genome-wide association study identifies a novel locuscontributing to type 2 diabetes susceptibility in Sikhs of Punjabi origin from India.Diabetes 62, 1746–55 (2013).
26. Zeggini, E. et al. Replication of genome-wide association signals in UK samplesreveals risk loci for type 2 diabetes. Science 316, 1336–41 (2007).
27. Purcell, S. et al. PLINK: a tool set for whole-genome association and population-based linkage analyses. Am J Hum Genet 81, 559–75 (2007).
28. Manichaikul, A. et al. Robust relationship inference in genome-wide associationstudies. Bioinformatics 26, 2867–73 (2010).
29. Haber, M. et al. Genome-wide diversity in the levant reveals recent structuring byculture. PLoS Genet 9, e1003316 (2013).
30. Devlin, B., Roeder, K. & Wasserman, L. Genomic control, a new approach togenetic-based association studies. Theor Popul Biol 60, 155–66 (2001).
31. Al-Daghri, N. M. et al. Association between type 2 diabetes mellitus-related SNPvariants and obesity traits in a Saudi population. Mol Biol Rep 41, 1731–40 (2014).
32. Chen, R. et al. Type 2 diabetes risk alleles demonstrate extreme directionaldifferentiation among human populations, compared to other diseases. PLoSGenet 8, e1002621 (2012).
33. Corona, E. et al. Analysis of the genetic basis of disease in the context of worldwidehuman relationships and migration. PLoS Genet 9, e1003447 (2013).
34. Consortium, T. W. T. C. C. Genome-wide association study of 14,000 cases ofseven common diseases and 3,000 shared controls. Nature 447, 661–78 (2007).
35. Okada, Y. et al. Common variants at CDKAL1 and KLF9 are associated with bodymass index in east Asian populations. Nat Genet 44, 302–6 (2012).
36. Perry, J. R. et al. Stratifying type 2 diabetes cases by BMI identifies genetic riskvariants in LAMA1 and enrichment for risk variants in lean compared to obesecases. PLoS Genet 8, e1002741 (2012).
37. Stancakova, A. et al. Single-nucleotide polymorphism rs7754840 of CDKAL1 isassociated with impaired insulin secretion in nondiabetic offspring of type 2
diabetic subjects and in a large sample of men with normal glucose tolerance.J Clin Endocrinol Metab 93, 1924–30 (2008).
38. Haiman, C. A. et al. Consistent directions of effect for established type 2 diabetesrisk variants across populations: the population architecture using Genomics andEpidemiology (PAGE) Consortium. Diabetes 61, 1642–7 (2012).
39. Rong, R. et al. Association analysis of variation in/near FTO, CDKAL1, SLC30A8,HHEX, EXT2, IGF2BP2, LOC387761, and CDKN2B with type 2 diabetes andrelated quantitative traits in Pima Indians. Diabetes 58, 478–88 (2009).
40. Horikawa, Y. et al. Replication of genome-wide association studies of type 2diabetes susceptibility in Japan. J Clin Endocrinol Metab 93, 3136–41 (2008).
41. Palmer, N. D. et al. Resequencing and analysis of variation in the TCF7L2 gene inAfrican Americans suggests that SNP rs7903146 is the causal diabetessusceptibility variant. Diabetes 60, 662–8 (2011).
42. Ubeda, M., Rukstalis, J. M. & Habener, J. F. Inhibition of cyclin-dependent kinase5 activity protects pancreatic beta cells from glucotoxicity. J Biol Chem 281,28858–64 (2006).
43. Wei, F. Y. et al. Cdk5-dependent regulation of glucose-stimulated insulinsecretion. Nat Med 11, 1104–8 (2005).
44. Yi, F., Brubaker, P. L. & Jin, T. TCF-4 mediates cell type-specific regulation ofproglucagon gene expression by beta-catenin and glycogen synthase kinase-3beta.J Biol Chem 280, 1457–64 (2005).
45. Almawi, W. Y. et al. A replication study of 19 GWAS-validated type 2 diabetes at-risk variants in the Lebanese population. Diabetes Res Clin Pract 102, 117–22(2013).
46. Nemr, R. et al. Replication study of common variants in CDKAL1 and CDKN2A/2B genes associated with type 2 diabetes in Lebanese Arab population. DiabetesRes Clin Pract 95, e37–40 (2012).
47. Nemr, R. et al. Transcription factor-7-like 2 gene variants are strongly associatedwith type 2 diabetes in Lebanese subjects. Diabetes Res Clin Pract 98, e23–7 (2012).
48. Badro, D. A. et al. Y-chromosome and mtDNA genetics reveal significantcontrasts in affinities of modern Middle Eastern populations with European andAfrican populations. PLoS One 8, e54616 (2013).
49. Saade, S. et al. Large scale association analysis identifies three susceptibility loci forcoronary artery disease. PLoS One 6, e29427 (2011).
50. Youhanna, S. et al. Parental consanguinity and family history of coronary arterydisease strongly predict early stenosis. Atherosclerosis 212, 559–63 (2010).
51. Platt, D. E. et al. Circulating lipid levels and risk of coronary artery disease in alarge group of patients undergoing coronary angiography. J Thromb Thrombolysis(2014) Advance online publication. DOI 10.1007/s11239-014-1069-2
52. Colagiuri, S. Glycated haemoglobin (HbA1c) for the diagnosis of diabetesmellitus--practical implications. Diabetes Res Clin Pract 93, 312–3 (2011).
53. Delaneau, O., Zagury, J. F. & Marchini, J. Improved whole-chromosome phasingfor disease and population genetic studies. Nat Methods 10, 5–6 (2013).
54. Abecasis, G. R. et al. An integrated map of genetic variation from 1,092 humangenomes. Nature 491, 56–65 (2012).
55. Howie, B. N., Donnelly, P. & Marchini, J. A flexible and accurate genotypeimputation method for the next generation of genome-wide association studies.PLoS Genet 5, e1000529 (2009).
56. Haber, M. et al. mtDNA lineages reveal coronary artery disease-associatedstructures in the Lebanese population. Ann Hum Genet 76, 1–8 (2012).
57. Alexander, D. H., Novembre, J. & Lange, K. Fast model-based estimation ofancestry in unrelated individuals. Genome Res 19, 1655–64 (2009).
58. Marchini, J. & Howie, B. Genotype imputation for genome-wide associationstudies. Nat Rev Genet 11, 499–511 (2010).
59. Pruim, R. J. et al. LocusZoom: regional visualization of genome-wide associationscan results. Bioinformatics 26, 2336–7 (2010).
AcknowledgmentsWe thank the patients for agreeing to participate in the study. We thank Dr. BouchraDouaihy and Mrs. Hana Sbeite for helping in the campaigns. We thank the dispensaire de lamaison maronite de soins et d’hebergement- Ain El Remmaneh, Ehden GovernmentalHospital - Ehden, Caritas Liban - Dahr el Ain, Lebanese Red Cross - Amioun, Saint Josephdispensary - Zgharta, and dispensary of Kfarhabou –Donnieh for hosting the campaigns.This publication was made possible by a grant from the Qatar National Research Fundunder its National Priorities Research program (NPRP) award number NPRP09-215-3-049. Its contents are solely the responsibility of the authors and do not necessarilyrepresent the official views of the Qatar National Research Fund.
Author contributionsConceived and designed the experiments: M.G.S., M.H., H.E.S., D.E.P. and P.A.Z.Performed the statistical analysis: M.H. Analyzed the data: M.G.S., M.H., A.K.S., D.E.P.,H.E.S. and P.A.Z. Contributed reagents/materials/genotyping: Y.A.S., Y.A., K.H., J.R., F.M.,D.G. and H.E.S. Wrote the paper: M.G.S., M.H., D.E.P. and P.A.Z. with help from allco-authors.
Additional informationSupplementary information accompanies this paper at http://www.nature.com/scientificreports
www.nature.com/scientificreports
SCIENTIFIC REPORTS | 4 : 7351 | DOI: 10.1038/srep07351 8

Competing financial interests: The authors declare no competing financial interests.
How to cite this article: Ghassibe-Sabbagh, M. et al. T2DM GWAS in the Lebanesepopulation confirms the role of TCF7L2 and CDKAL1 in disease susceptibility. Sci. Rep. 4,7351; DOI:10.1038/srep07351 (2014).
This work is licensed under a Creative Commons Attribution-NonCommercial-NoDerivs 4.0 International License. The images or other third party material inthis article are included in the article’s Creative Commons license, unless indicatedotherwise in the credit line; if the material is not included under the CreativeCommons license, users will need to obtain permission from the license holderin order to reproduce the material. To view a copy of this license, visit http://creativecommons.org/licenses/by-nc-nd/4.0/
www.nature.com/scientificreports
SCIENTIFIC REPORTS | 4 : 7351 | DOI: 10.1038/srep07351 9