Embed Size (px)
Citation preview
GHG EMISSIONS FROM AGRICULTURE
Climate Change WorkshopDecember 12, 2000
2
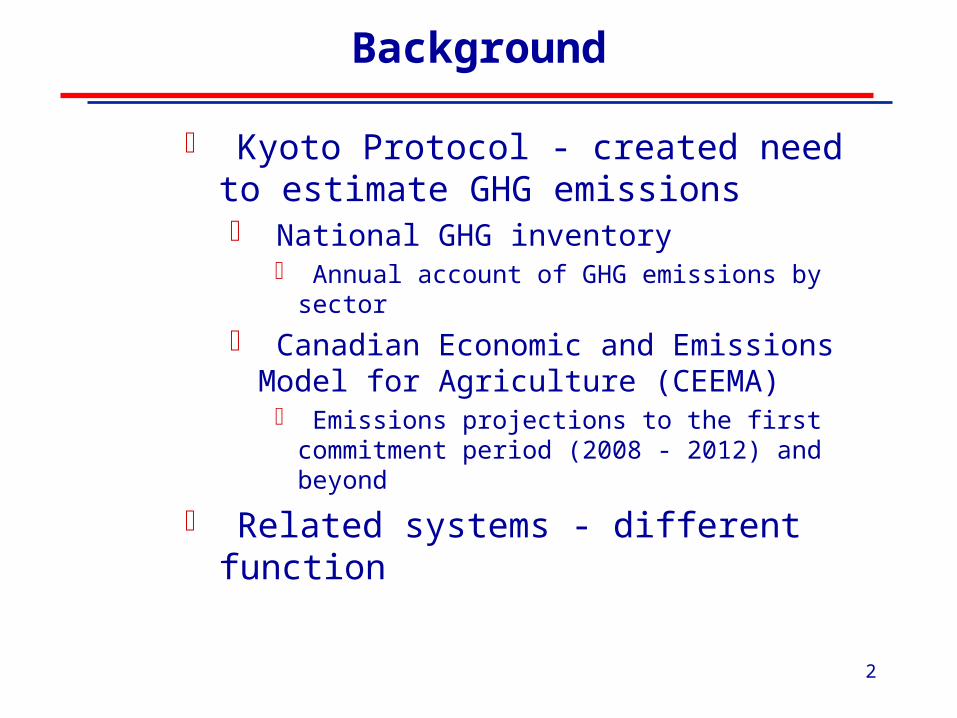
Background
Kyoto Protocol - created need to estimate GHG emissions National GHG inventory
Annual account of GHG emissions by sector
Canadian Economic and Emissions Model for Agriculture (CEEMA) Emissions projections to the first commitment
period (2008 - 2012) and beyond
Related systems - different function
3
Modelling Framework
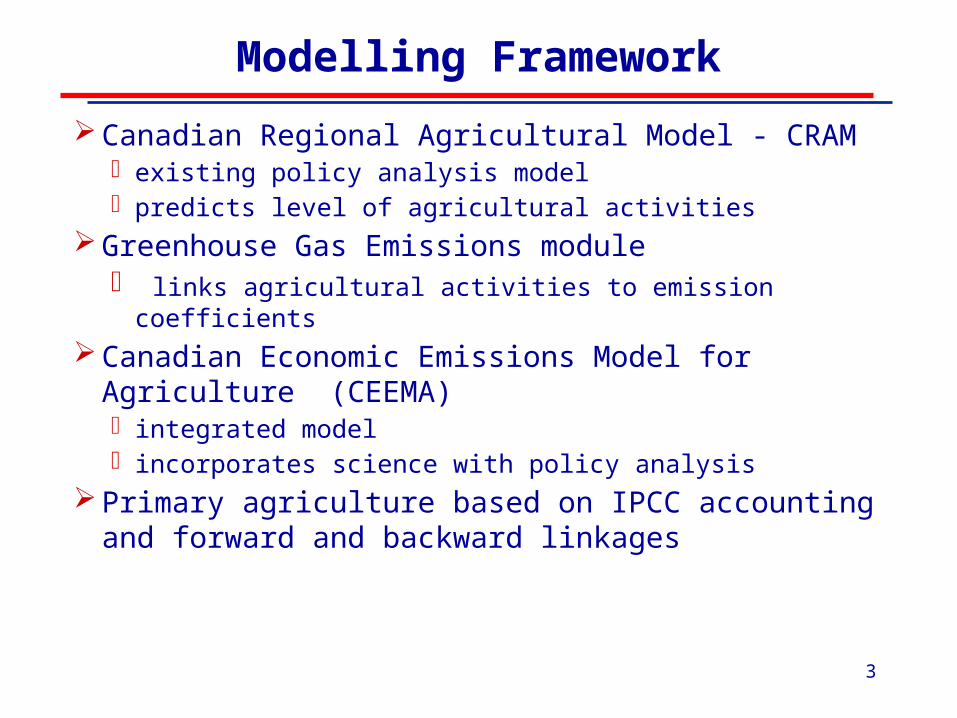
Canadian Regional Agricultural Model - CRAMexisting policy analysis model predicts level of agricultural activities
Greenhouse Gas Emissions module links agricultural activities to emission coefficients
Canadian Economic Emissions Model for Agriculture (CEEMA) integrated model incorporates science with policy analysis
Primary agriculture based on IPCC accounting and forward and backward linkages
5
Greenhouse Gas Emissions Module
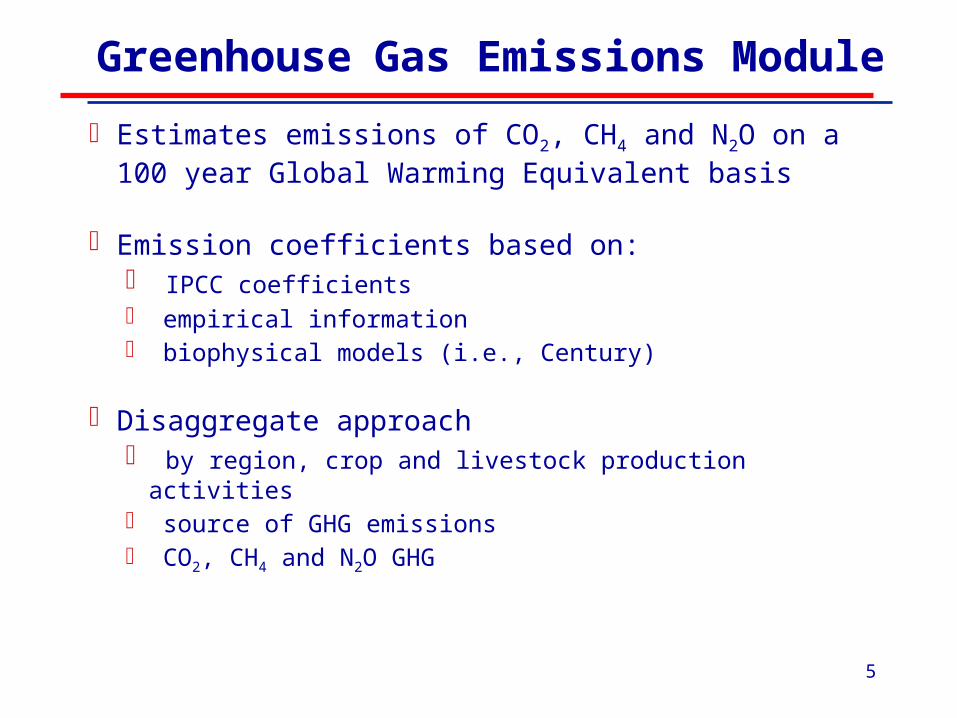
Estimates emissions of CO2, CH4 and N2O on a 100 year Global Warming Equivalent basis
Emission coefficients based on: IPCC coefficients empirical information biophysical models (i.e., Century)
Disaggregate approach by region, crop and livestock production activities source of GHG emissions CO2, CH4 and N2O GHG
6
Greenhouse Gas Emissions Module
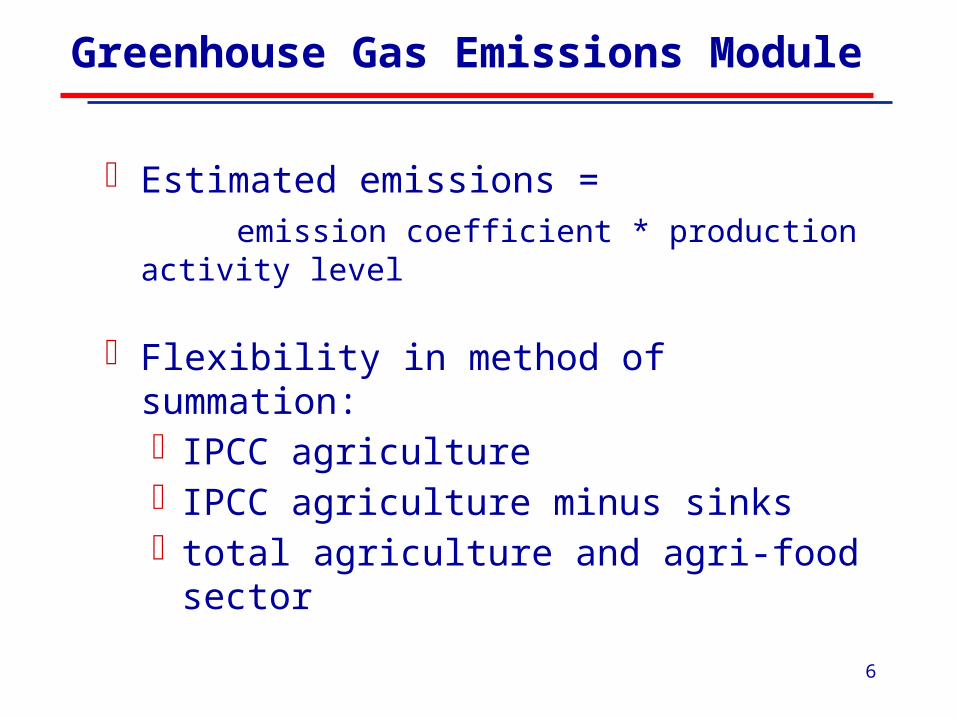
Estimated emissions = emission coefficient * production activity level
Flexibility in method of summation:IPCC agricultureIPCC agriculture minus sinkstotal agriculture and agri-food sector
7
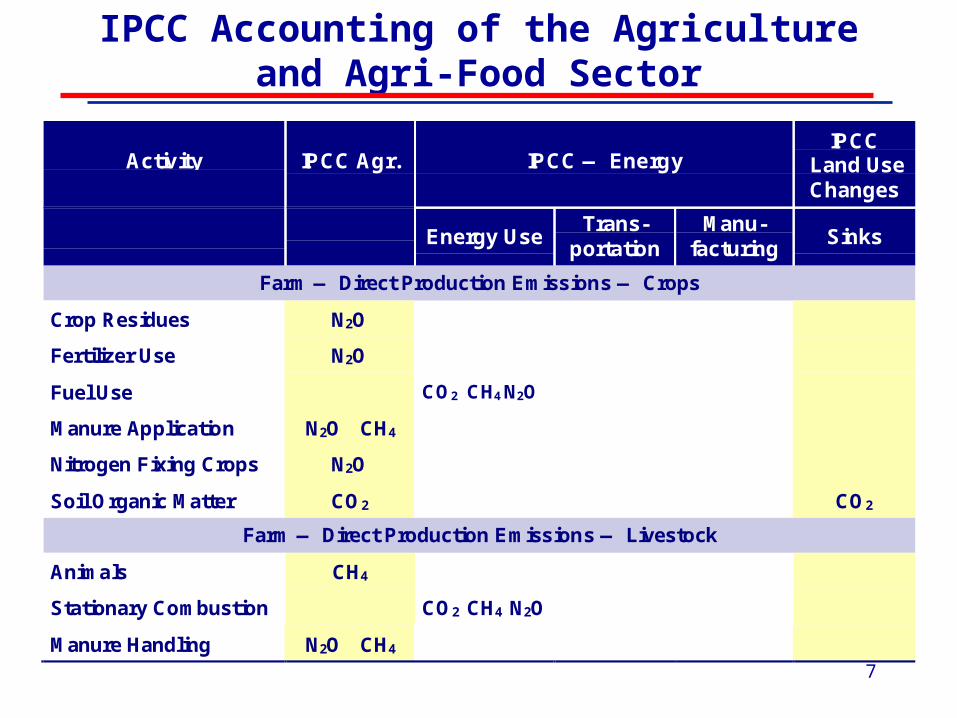
Activity IPCC Agr. IPCC — EnergyIPCC
Land UseChanges
Energy UseTrans-
portationManu-
facturingSinks
Farm — Direct Production Emissions — Crops
Crop Residues N2O
Fertilizer Use N2O
Fuel Use CO2 CH4 N2O
Manure Application N2O CH4
Nitrogen Fixing Crops N2O
Soil Organic Matter CO2 CO2
Farm — Direct Production Emissions — Livestock
Animals CH4
Stationary Combustion CO2 CH4 N2O
Manure Handling N2O CH4
IPCC Accounting of the Agricultureand Agri-Food Sector
8
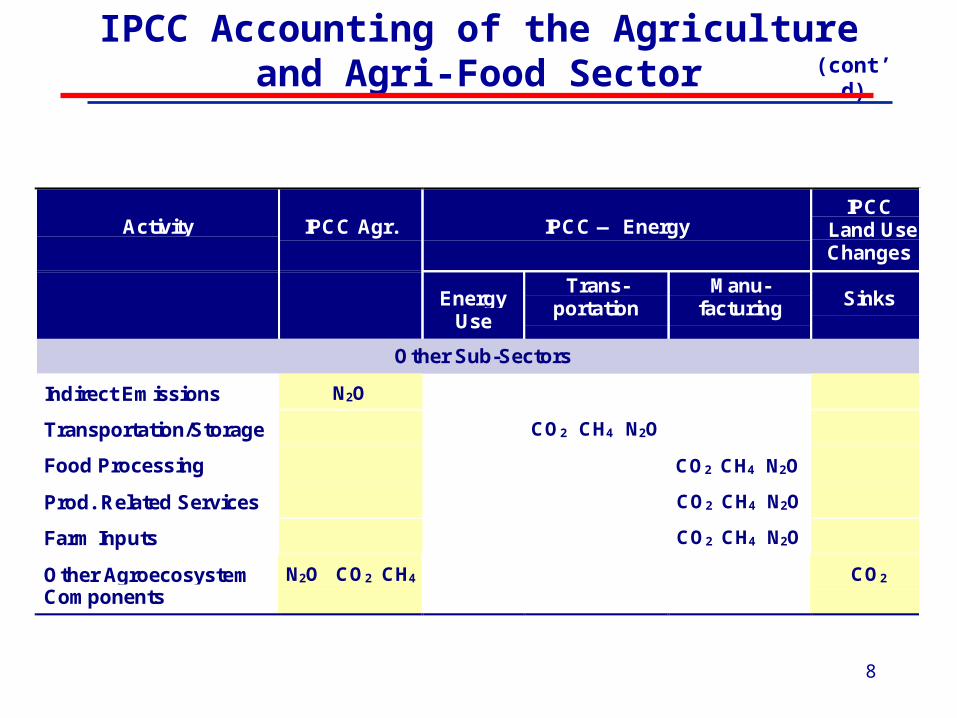
Activity IPCC Agr. IPCC — EnergyIPCC
Land UseChanges
EnergyUse
Trans-portation
Manu-facturing Sinks
Other Sub-Sectors
Indirect Emissions N2O
Transportation/Storage CO2 CH4 N2O
Food Processing CO2 CH4 N2O
Prod. Related Services CO2 CH4 N2O
Farm Inputs CO2 CH4 N2O
Other AgroecosystemComponents
N2O CO2 CH4 CO2
IPCC Accounting of the Agricultureand Agri-Food Sector (cont’d)
10
Canadian Submission to the UNFCCCProposals related to Kyoto Protocol Articles 3.3 & 3.4
Estimate scale of sink potential 1990 - assigned amount (94%) 1996 1999 2008 to 2012 (1st commitment period)
11
Canadian Submission to the UNFCCC(continued)
Land based accounting cropland management
frequency of zero tillage frequency of summerfallow
grazing land managementconversion of cropland to permanent cover intensity of pasture and grazing land management
shelterbelts
Low, medium, and high adoption rates
12
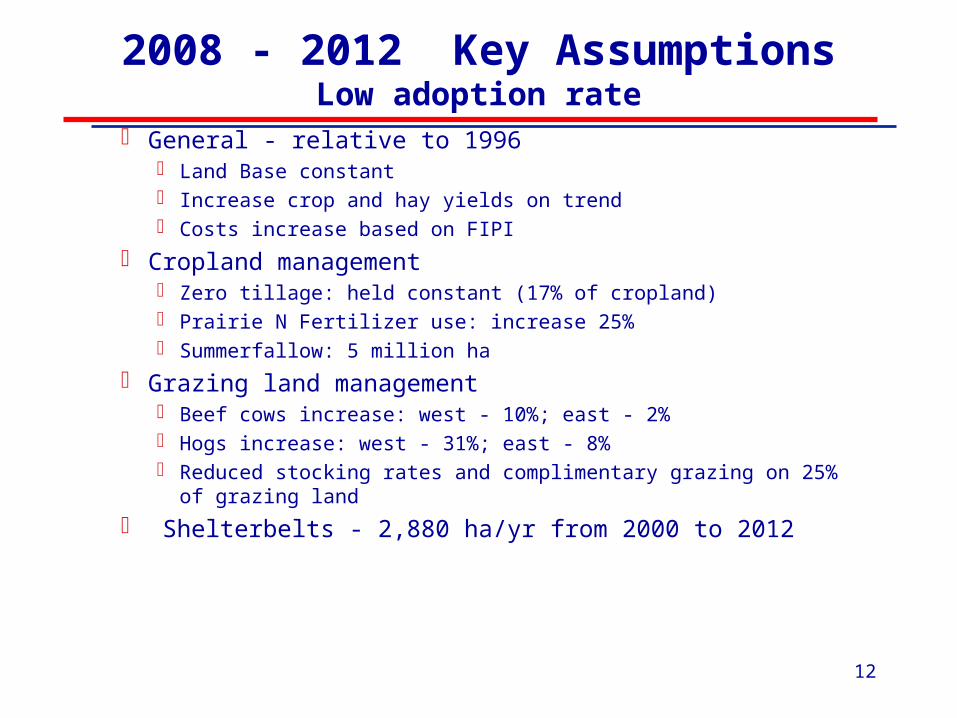
2008 - 2012 Key AssumptionsLow adoption rate
General - relative to 1996 Land Base constant Increase crop and hay yields on trend Costs increase based on FIPI
Cropland management Zero tillage: held constant (17% of cropland) Prairie N Fertilizer use: increase 25% Summerfallow: 5 million ha
Grazing land management Beef cows increase: west - 10%; east - 2% Hogs increase: west - 31%; east - 8% Reduced stocking rates and complimentary grazing on 25% of grazing
land
Shelterbelts - 2,880 ha/yr from 2000 to 2012
13
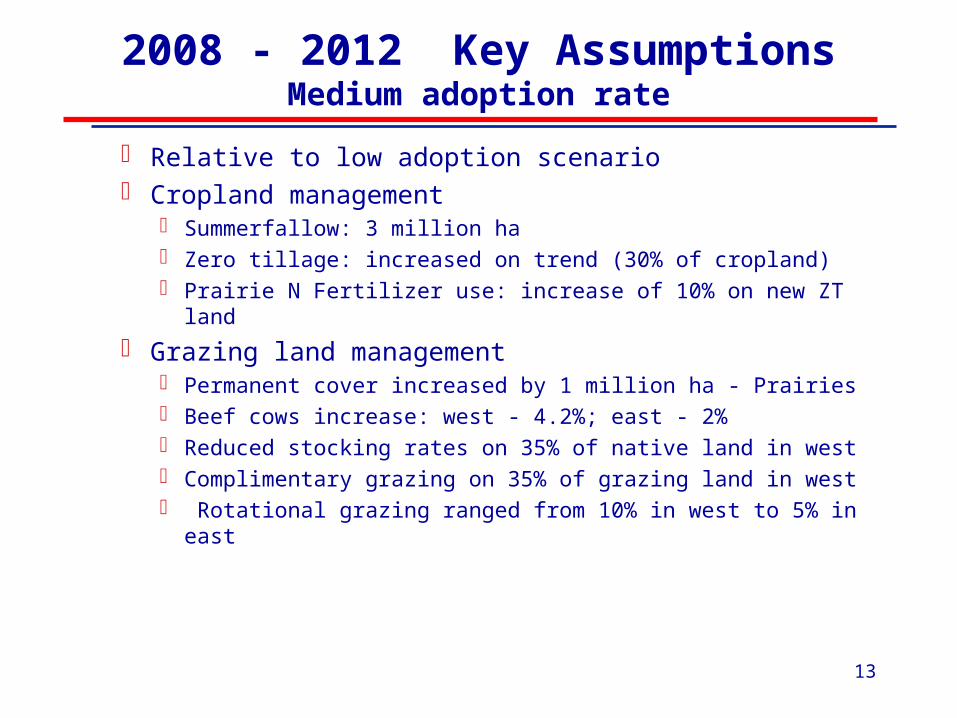
2008 - 2012 Key AssumptionsMedium adoption rate
Relative to low adoption scenario Cropland management
Summerfallow: 3 million ha Zero tillage: increased on trend (30% of cropland) Prairie N Fertilizer use: increase of 10% on new ZT land
Grazing land management Permanent cover increased by 1 million ha - Prairies Beef cows increase: west - 4.2%; east - 2% Reduced stocking rates on 35% of native land in west Complimentary grazing on 35% of grazing land in west Rotational grazing ranged from 10% in west to 5% in east
14
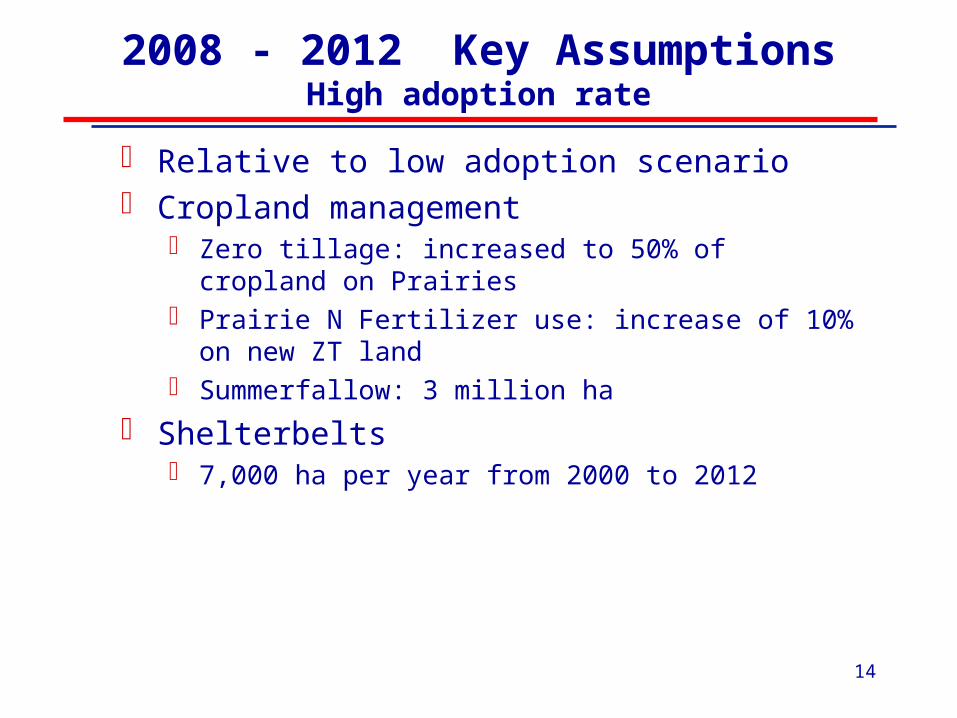
2008 - 2012 Key AssumptionsHigh adoption rate
Relative to low adoption scenario Cropland management
Zero tillage: increased to 50% of cropland on Prairies Prairie N Fertilizer use: increase of 10% on new ZT land Summerfallow: 3 million ha
Shelterbelts 7,000 ha per year from 2000 to 2012
15
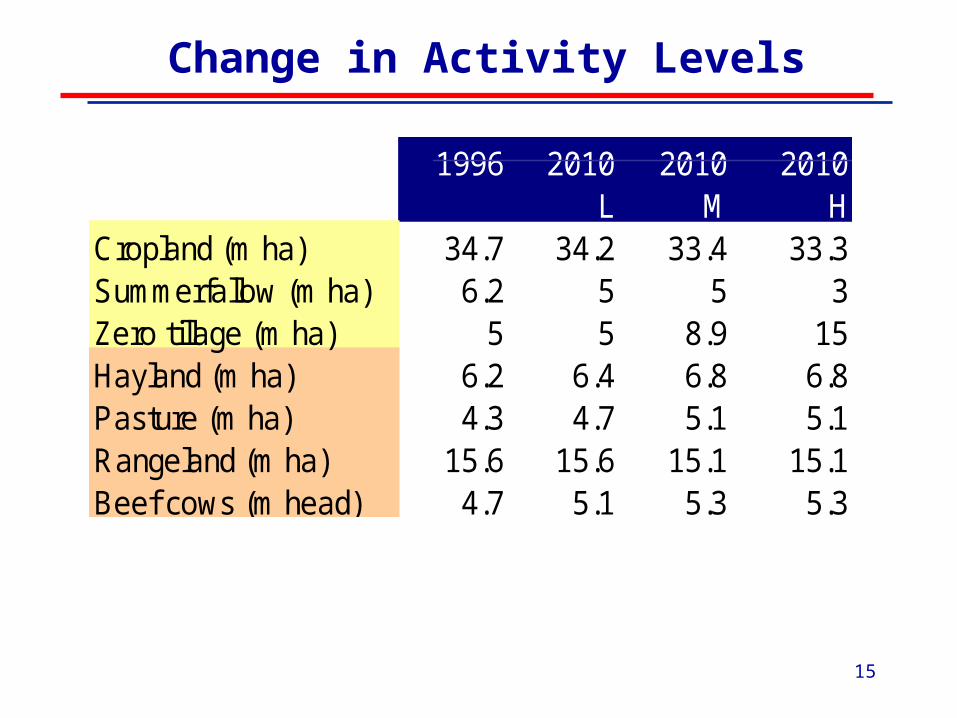
Change in Activity Levels
1996 2010 2010 2010L M H
Cropland (m ha) 34.7 34.2 33.4 33.3Summerfallow (m ha) 6.2 5 5 3Zero tillage (m ha) 5 5 8.9 15Hayland (m ha) 6.2 6.4 6.8 6.8Pasture (m ha) 4.3 4.7 5.1 5.1Rangeland (m ha) 15.6 15.6 15.1 15.1Beef cows (m head) 4.7 5.1 5.3 5.3
16
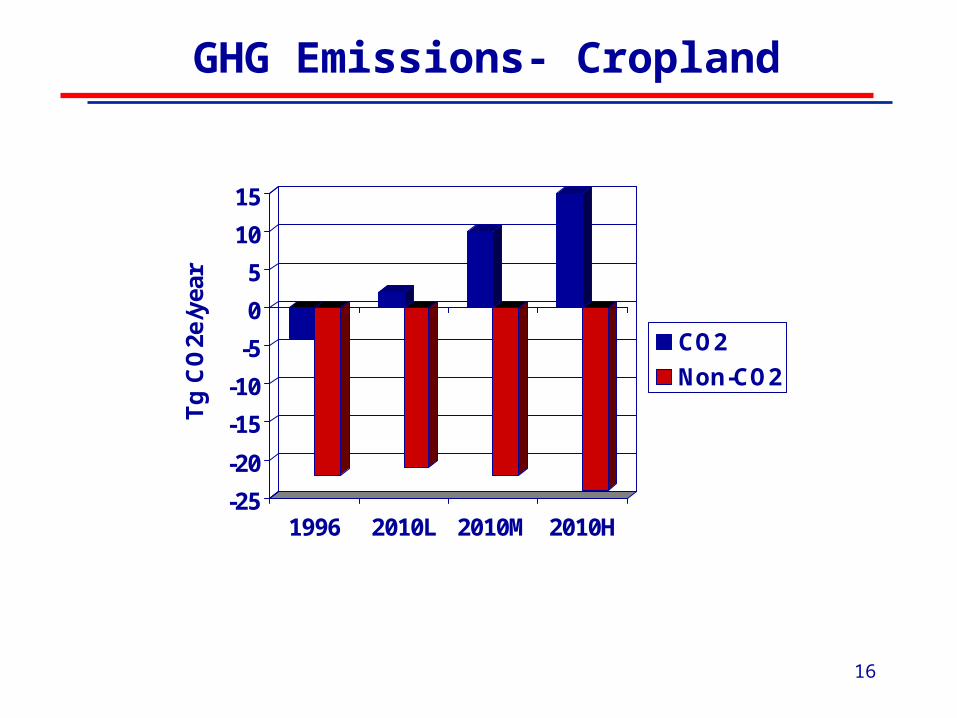
GHG Emissions- Cropland
-25
-20
-15
-10
-5
0
5
10
15T
g C
O2e
/yea
r
1996 2010L 2010M 2010H
CO2
Non-CO2
17
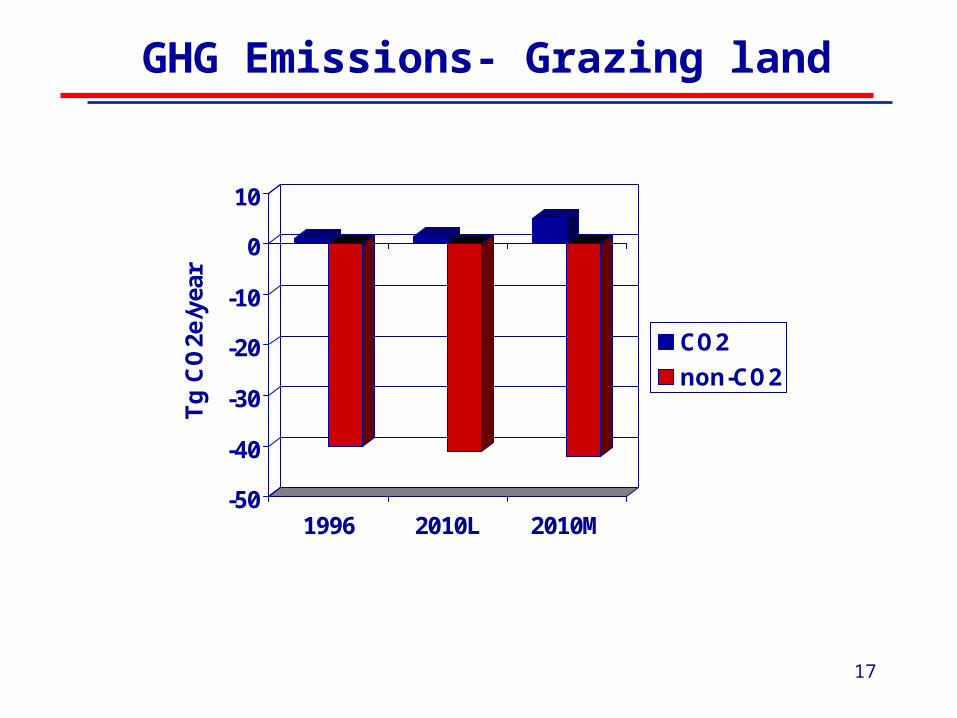
GHG Emissions- Grazing land
-50
-40
-30
-20
-10
0
10T
g C
O2e
/yea
r
1996 2010L 2010M
CO2
non-CO2
18
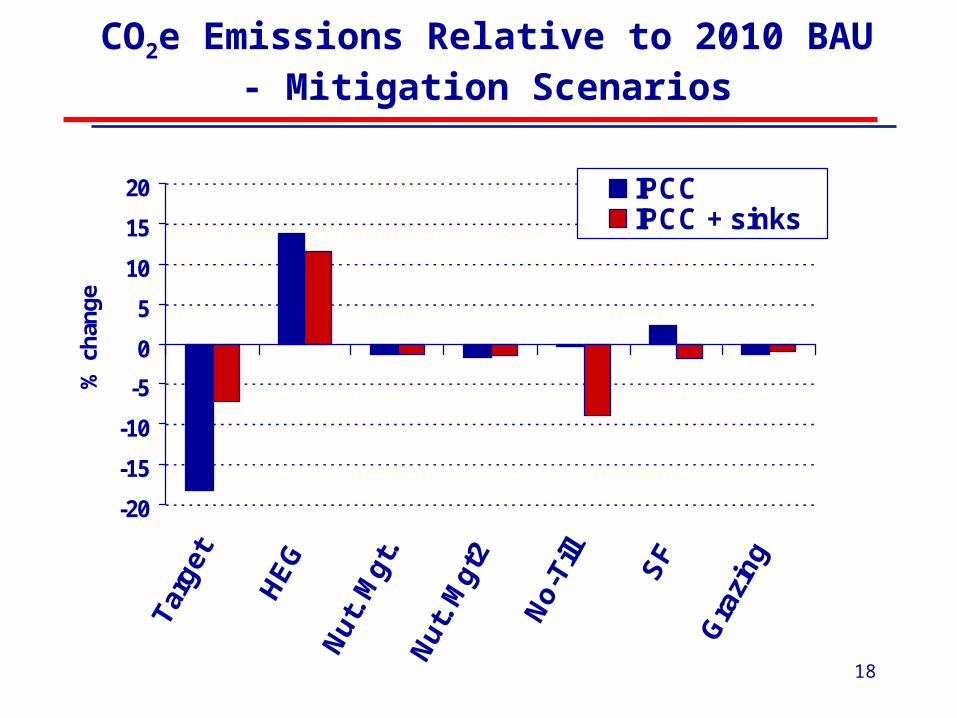
CO2e Emissions Relative to 2010 BAU - Mitigation Scenarios
-20
-15
-10
-5
0
5
10
15
20
% c
hang
e
IPCCIPCC + sinks
19
Key Messages
Importance of soil sinks GHG reduction targets may be achievable
through a series of actions based on existing technology
Trade-off between GHG reduction scenarios Measures to promote adoption of mitigation
practices Uncertainty of GHG coefficients
20
Acknowledgements
Suren Kulshreshtha, Department of Agricultural Economics, U. of S.
Bruce Junkins, Policy Branch, AAFC Ray Desjardins, Brian McConkey, Research
Branch, AAFC
21
GHG Modeling Workshop
December 9-10, 2000 Hosted by Centre for Studies in Agriculture, Law
and the Environment, U. of S Sponsored by Prairie Adaptation Cooperative ~90 participants
22
GHG Modeling Workshop
GHG/climate change modeling in agriculturegreat deal of activity important because agriculture is biologically
based - does not fit general energy-based models of most other sectors (Hanly - AMG work)
inventory work (Desjardins)Policy Branch - recognized early the need for
predictive capability, mitigation studies

23
GHG Modeling Workshop
Take-home messages Current focus - need to continue work on
emission measurement reduce uncertainty better coefficients
scaling-up from point/site measures to landscape and region
refinement of process models
24
GHG Modeling Workshop
Road ahead
Link mitigation and adaptation scenarios to emission research Link climate change scenarios to mitigation research
Develop measurement, verification and monitoring protocols for regional and national assessments Quantify uncertainty