Embed Size (px)
Citation preview
GIANT TO DWARF GIANT TO DWARF RATIO OF RED-RATIO OF RED-
SEQUENCE GALAXY SEQUENCE GALAXY CLUSTERSCLUSTERS
Abhishesh N AdhikariAbhishesh N AdhikariMentor-Jim AnnisMentor-Jim Annis
Fermilab IPM / SDSSFermilab IPM / SDSSAugust 8, 2007August 8, 2007
OUTLINE OF TALKOUTLINE OF TALK Introduction to SDSSIntroduction to SDSS
The physics of my project: Giant to Dwarf Ratio in The physics of my project: Giant to Dwarf Ratio in Red Galaxy ClustersRed Galaxy Clusters
MaxBCG: A cluster detection algorithmMaxBCG: A cluster detection algorithm
My procedure and programmingMy procedure and programming
Initial Results for the ratio and issues I had with itInitial Results for the ratio and issues I had with it
Latest Results: Explanation and ConclusionLatest Results: Explanation and Conclusion
Comparing my results with the rest of the scientific Comparing my results with the rest of the scientific communitycommunity
Further StepsFurther Steps
INTRODUCTION TO INTRODUCTION TO SDSSSDSS
Sloan Digital Sky Survey is one of the Sloan Digital Sky Survey is one of the most ambitious astronomical surveys ever most ambitious astronomical surveys ever undertakenundertaken
When complete, it will have mapped more When complete, it will have mapped more than a 100 million objects and 25 percent than a 100 million objects and 25 percent of the skyof the sky
The SDSS red-shift limit for galaxies is The SDSS red-shift limit for galaxies is 0.4 (a distance of a few billion light years)0.4 (a distance of a few billion light years)
The survey releases all its data on the The survey releases all its data on the internet and constantly updates itinternet and constantly updates it

GIANT TO DWARF RATIO GIANT TO DWARF RATIO OF RED GALAXY CLUSTERSOF RED GALAXY CLUSTERS GalaxyGalaxy Cluster: A group of galaxies that are Cluster: A group of galaxies that are
gravitationally boundedgravitationally bounded Field Galaxies: Galaxies that are not a part Field Galaxies: Galaxies that are not a part
of any clusterof any cluster Blue Galaxies: Blue, Star forming galaxiesBlue Galaxies: Blue, Star forming galaxies Red Galaxies: Red, Very little star Red Galaxies: Red, Very little star
formation, biggerformation, bigger Giant Galaxies: Bright galaxiesGiant Galaxies: Bright galaxies Dwarf Galaxies: Faint galaxiesDwarf Galaxies: Faint galaxies

GIANT TO DWARF RATIO GIANT TO DWARF RATIO OF RED GALAXY CLUSTERSOF RED GALAXY CLUSTERS Luminosity Function of present day Red Luminosity Function of present day Red
galaxy clusters (take note of the curve galaxy clusters (take note of the curve shape only)shape only)
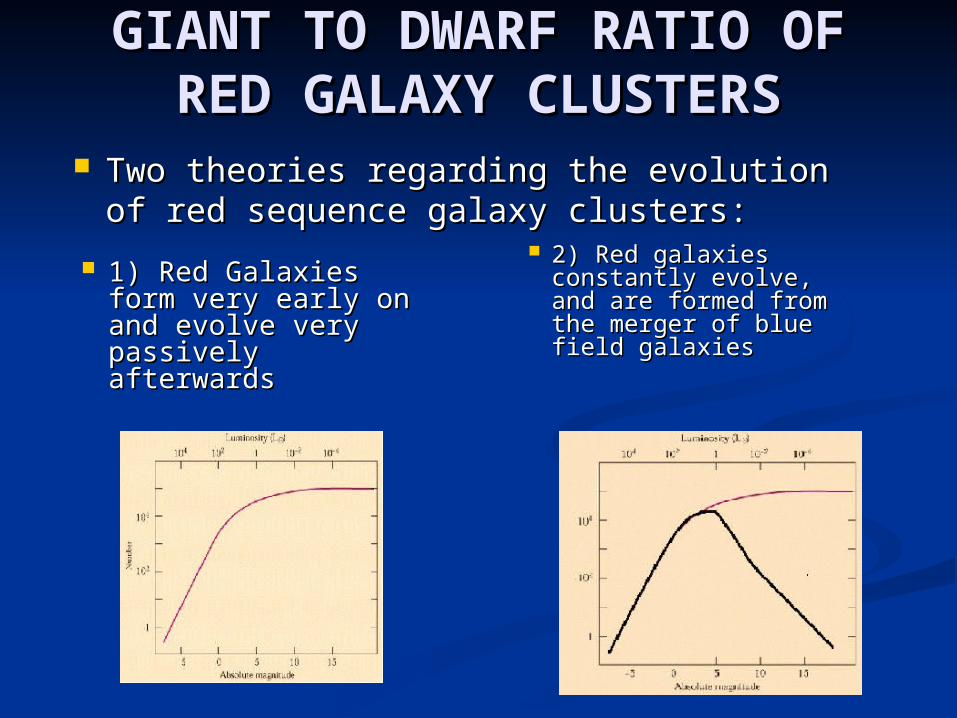
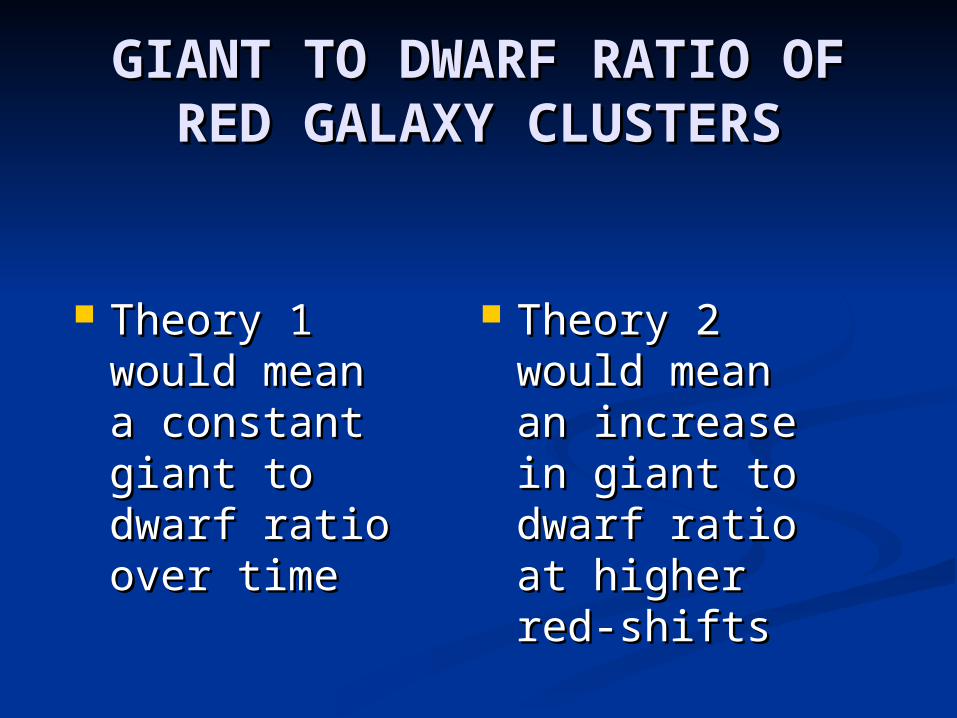
GIANT TO DWARF RATIO GIANT TO DWARF RATIO OF RED GALAXY CLUSTERSOF RED GALAXY CLUSTERS Two theories regarding the evolution Two theories regarding the evolution
of red sequence galaxy clusters:of red sequence galaxy clusters: 1) Red Galaxies form 1) Red Galaxies form
very early on and very early on and evolve very passively evolve very passively afterwardsafterwards
2) Red galaxies 2) Red galaxies constantly evolve, and constantly evolve, and are formed from the are formed from the merger of blue field merger of blue field galaxiesgalaxies
GIANT TO DWARF RATIO GIANT TO DWARF RATIO OF RED GALAXY CLUSTERSOF RED GALAXY CLUSTERS
Theory 2 Theory 2 would mean would mean an increase an increase in giant to in giant to dwarf ratio dwarf ratio at higher at higher red-shiftsred-shifts
Theory 1 Theory 1 would mean would mean a constant a constant giant to giant to dwarf ratio dwarf ratio over timeover time

GIANT TO DWARF RATIO GIANT TO DWARF RATIO OF RED GALAXY CLUSTERSOF RED GALAXY CLUSTERS Why is this important:Why is this important:
Theory of evolution of galaxiesTheory of evolution of galaxies
Cosmological Parameters and the Large Cosmological Parameters and the Large Scale StructureScale Structure
Useful for other surveysUseful for other surveys
GIANT TO DWARF RATIO GIANT TO DWARF RATIO OF RED GALAXIESOF RED GALAXIES
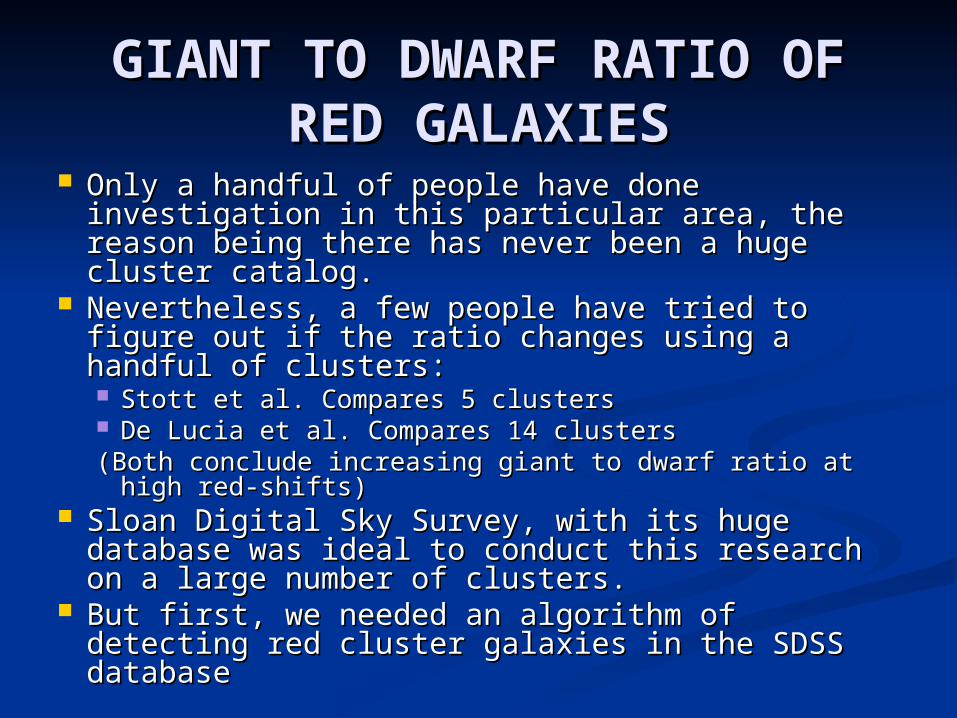
Only a handful of people have done investigation Only a handful of people have done investigation in this particular area, the reason being there in this particular area, the reason being there has never been a huge cluster catalog.has never been a huge cluster catalog.
Nevertheless, a few people have tried to figure Nevertheless, a few people have tried to figure out if the ratio changes using a handful of out if the ratio changes using a handful of clusters:clusters: Stott et al. Compares 5 clustersStott et al. Compares 5 clusters De Lucia et al. Compares 14 clustersDe Lucia et al. Compares 14 clusters(Both conclude increasing giant to dwarf ratio at high (Both conclude increasing giant to dwarf ratio at high
red-shifts)red-shifts) Sloan Digital Sky Survey, with its huge database Sloan Digital Sky Survey, with its huge database
was ideal to conduct this research on a large was ideal to conduct this research on a large number of clusters.number of clusters.
But first, we needed an algorithm of detecting But first, we needed an algorithm of detecting red cluster galaxies in the SDSS databasered cluster galaxies in the SDSS database
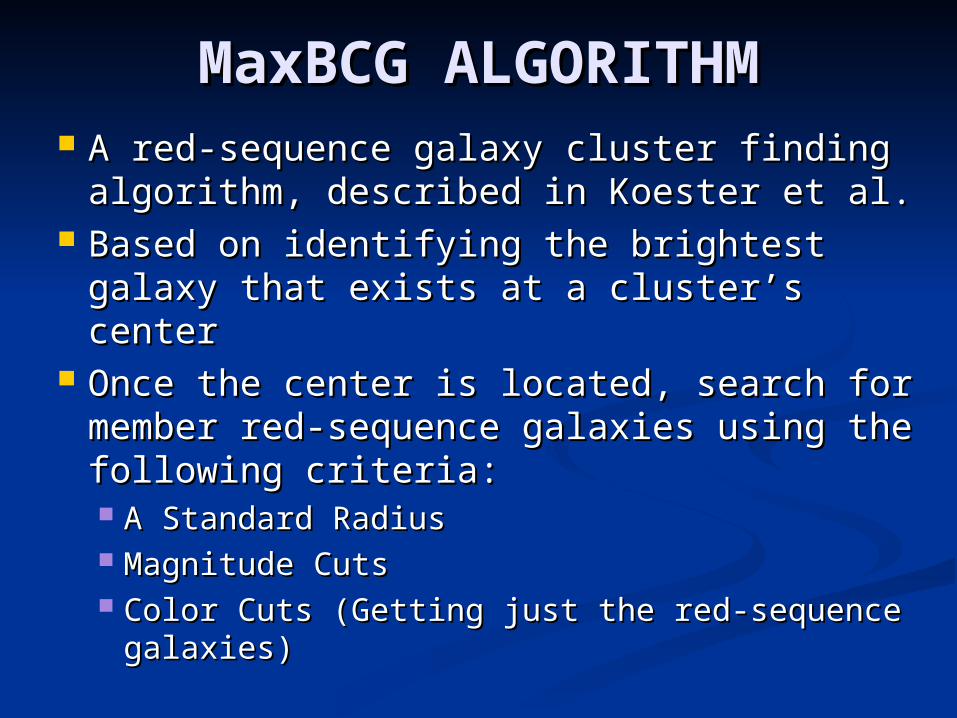
MaxBCG ALGORITHMMaxBCG ALGORITHM A red-sequence galaxy cluster finding A red-sequence galaxy cluster finding
algorithm, described in Koester et al.algorithm, described in Koester et al. Based on identifying the brightest Based on identifying the brightest
galaxy that exists at a cluster’s centergalaxy that exists at a cluster’s center Once the center is located, search for Once the center is located, search for
member red-sequence galaxies using member red-sequence galaxies using the following criteria:the following criteria: A Standard RadiusA Standard Radius Magnitude CutsMagnitude Cuts Color Cuts (Getting just the red-Color Cuts (Getting just the red-
sequence galaxies)sequence galaxies)

MaxBCG ALGORITHM: MaxBCG ALGORITHM: Color CutsColor Cuts
It has been observed It has been observed that red sequence that red sequence cluster galaxies inhabit cluster galaxies inhabit a tight sequence in the a tight sequence in the color-magnitude color-magnitude diagram. This is called diagram. This is called the E/S0 ridgeline.the E/S0 ridgeline.
In MaxBCG color cuts, you select galaxies whose In MaxBCG color cuts, you select galaxies whose colors are within 2 sigma of the central color colors are within 2 sigma of the central color value of the ridgeline, where sigma is: value of the ridgeline, where sigma is:
MaxBCG ALGORITHMMaxBCG ALGORITHM
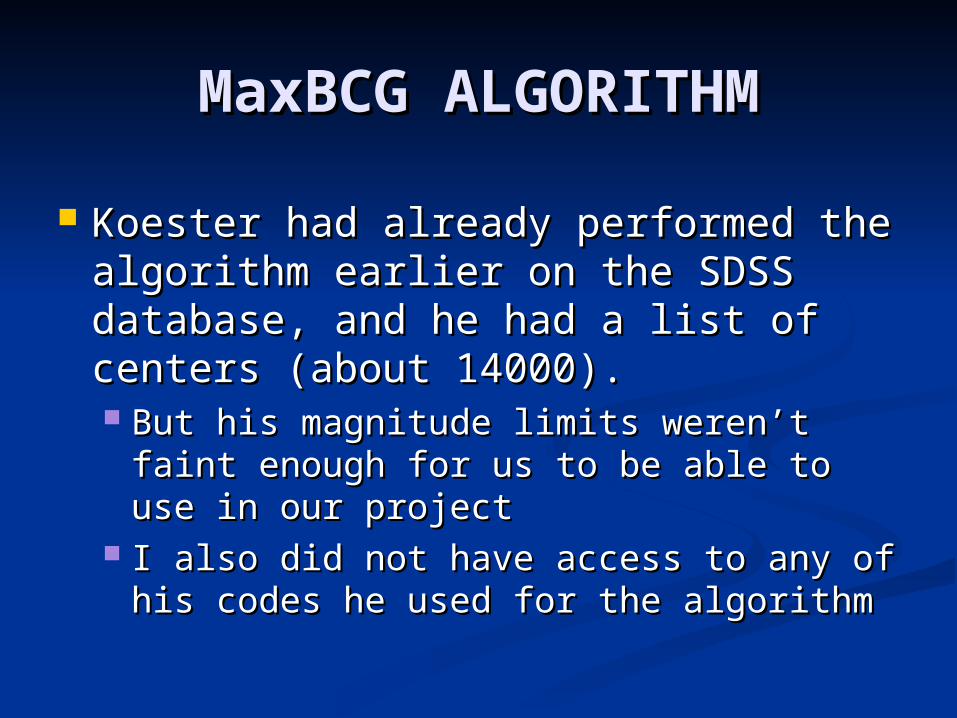
Koester had already performed the Koester had already performed the algorithm earlier on the SDSS algorithm earlier on the SDSS database, and he had a list of database, and he had a list of centers (about 14000).centers (about 14000). But his magnitude limits weren’t faint But his magnitude limits weren’t faint
enough for us to be able to use in our enough for us to be able to use in our projectproject
I also did not have access to any of his I also did not have access to any of his codes he used for the algorithmcodes he used for the algorithm

MY PROCEDUREMY PROCEDURE Study the theory behind the algorithm to Study the theory behind the algorithm to
understand how exactly it is supposed to work. understand how exactly it is supposed to work. Then convert the algorithm to programming Then convert the algorithm to programming
codes so that I could do something useful with codes so that I could do something useful with it.it. Extract all the cluster centers from the MaxBCG Extract all the cluster centers from the MaxBCG
catalog (using TCL)catalog (using TCL) Use those centers and the required cuts to do a Use those centers and the required cuts to do a
search in the SDSS database ( using SQL) to get a search in the SDSS database ( using SQL) to get a members catalog for the clustersmembers catalog for the clusters
Count the number of galaxies in each of the Count the number of galaxies in each of the clusters, find the required ratios and analyzeclusters, find the required ratios and analyze
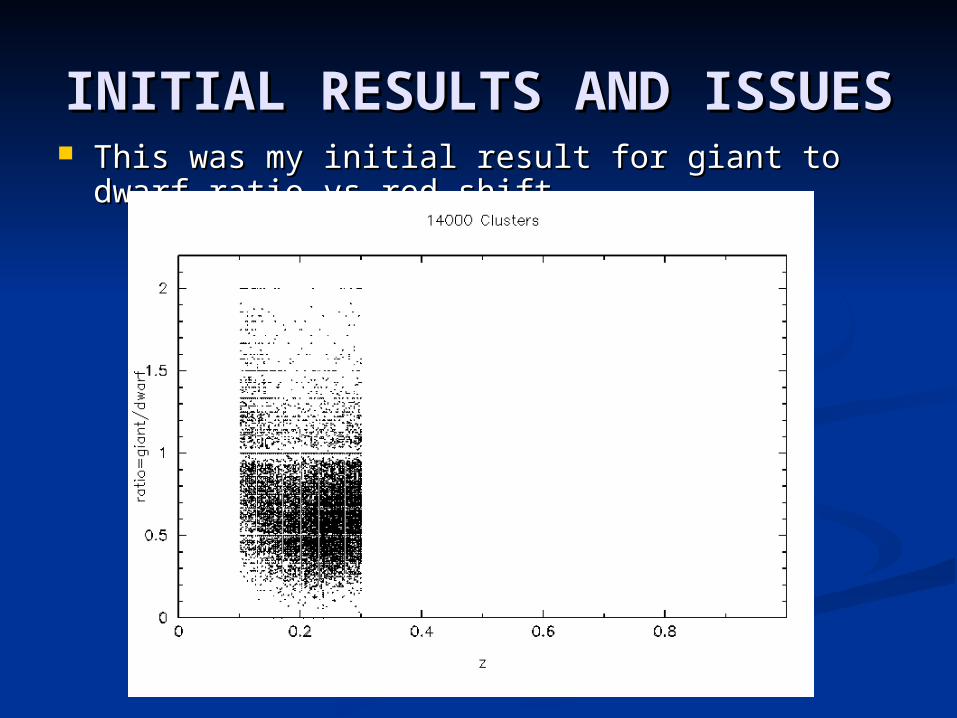
INITIAL RESULTS AND INITIAL RESULTS AND ISSUESISSUES
This was my initial result for giant to dwarf ratio This was my initial result for giant to dwarf ratio vs red-shiftvs red-shift

INITIAL RESULTS AND INITIAL RESULTS AND ISSUESISSUES
This was quite an unexpected result, and it seemed that something was going wrongThis was quite an unexpected result, and it seemed that something was going wrong
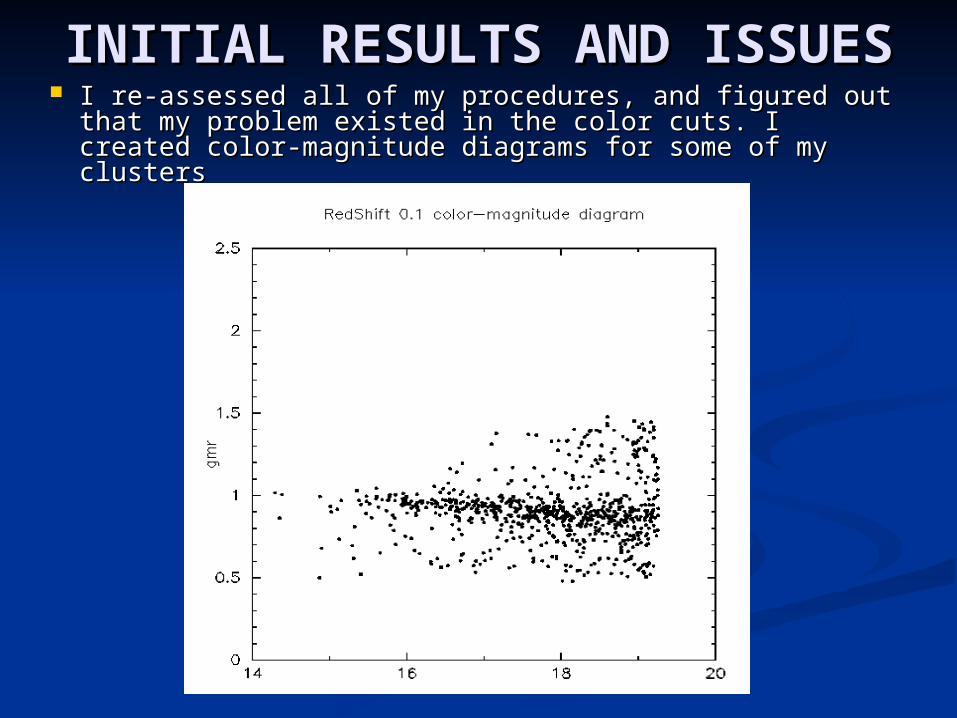
INITIAL RESULTS AND INITIAL RESULTS AND ISSUESISSUES I re-assessed all of my procedures, and figured out I re-assessed all of my procedures, and figured out
that my problem existed in the color cuts. I created that my problem existed in the color cuts. I created color-magnitude diagrams for some of my clusterscolor-magnitude diagrams for some of my clusters
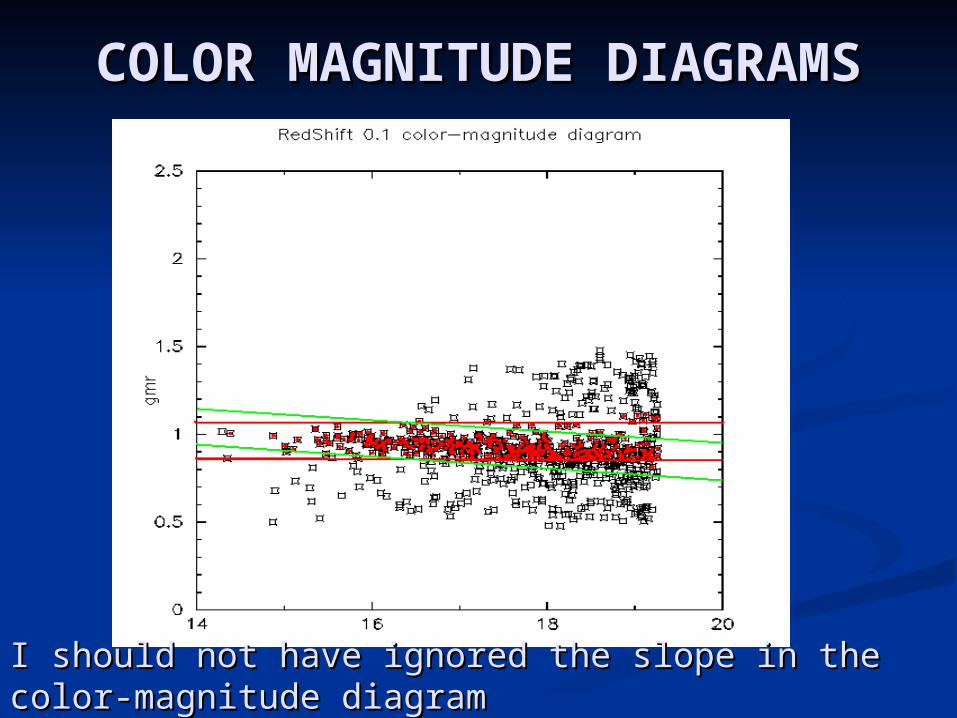
COLOR MAGNITUDE COLOR MAGNITUDE DIAGRAMSDIAGRAMS
I should not have ignored the slope in the color-I should not have ignored the slope in the color-magnitude diagrammagnitude diagram
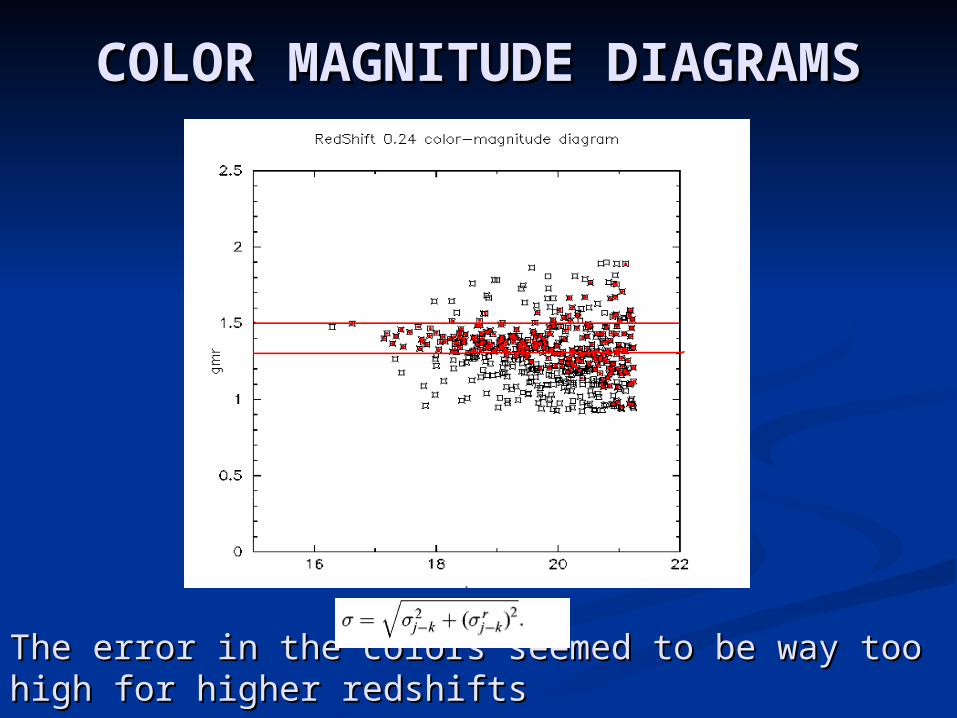
COLOR MAGNITUDE COLOR MAGNITUDE DIAGRAMSDIAGRAMS
The error in the colors seemed to be way too high The error in the colors seemed to be way too high for higher redshiftsfor higher redshifts

COLOR MAGNITUDE COLOR MAGNITUDE DIAGRAMSDIAGRAMS

COLOR MAGNITUDE COLOR MAGNITUDE DIAGRAMSDIAGRAMS At higher red-shifts, objects are further away, and hence they At higher red-shifts, objects are further away, and hence they
appear fainterappear fainter The fainter the object appears on the telescope, its The fainter the object appears on the telescope, its
photometric precision gets less accuratephotometric precision gets less accurate
Looking at the graph, we can’t trust the data for Looking at the graph, we can’t trust the data for red-shift more than about 0.2red-shift more than about 0.2
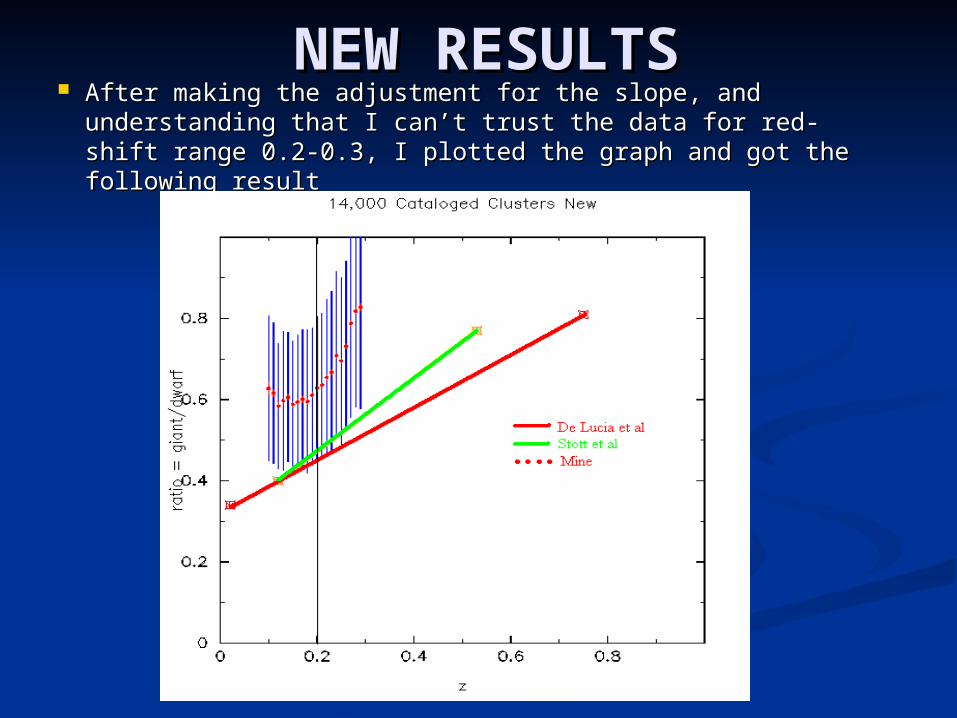
NEW RESULTSNEW RESULTS After making the adjustment for the slope, and After making the adjustment for the slope, and
understanding that I can’t trust the data for red-shift range understanding that I can’t trust the data for red-shift range 0.2-0.3, I plotted the graph and got the following result0.2-0.3, I plotted the graph and got the following result
MY CONCLUSIONMY CONCLUSION
So ignoring data for red-shift range So ignoring data for red-shift range 0.2-0.3, and only looking at the 0.2-0.3, and only looking at the range of 0.1 to 0.2, I came to the range of 0.1 to 0.2, I came to the conclusion that there is conclusion that there is no no significant change in the giant to significant change in the giant to dwarf ratiodwarf ratio of red galaxies in of red galaxies in clusters at different red-shifts.clusters at different red-shifts.

COMPARING MY RESULTS COMPARING MY RESULTS WITH OTHER PEOPLEWITH OTHER PEOPLE
StrengthStrength My data is very My data is very
precise. I use precise. I use 14000 clusters 14000 clusters as opposed to as opposed to 10 or 20 by 10 or 20 by othersothers
WeaknessWeakness My red-shift My red-shift
range is small range is small (0.1 to 0.2) (0.1 to 0.2) compared to compared to De Lucia De Lucia whose clusters whose clusters range from range from 0.02 to 0.70.02 to 0.7
FURTHER STEPSFURTHER STEPS
Background subtractionBackground subtraction Modifying MaxBCG algorithm to Modifying MaxBCG algorithm to
make it more efficient for my projectmake it more efficient for my project A better way of selecting galaxies at A better way of selecting galaxies at
higher red-shifts ( 0.2 to 0.3)higher red-shifts ( 0.2 to 0.3) Analyzing clusters with red-shifts Analyzing clusters with red-shifts
higher than the SDSS range ( >0.4 )higher than the SDSS range ( >0.4 ) Extensive theoretical analysis of the Extensive theoretical analysis of the
explanation and consequences of my explanation and consequences of my resultsresults

QUESTIONS???QUESTIONS???