Embed Size (px)
Citation preview
Gibson Ridge 2 Analyst Program for Dummies!!!
(like me)
Updated for GR2A 2.20 December 4, 2014
Produced by Kevin Skow, NWS WFO Des Moines [email protected]
Introduction This is intended to be an introduction or refresher to
the GR2A program. It doesn’t cover every single feature, but hits on those that are the most useful. This manual was made for GR2A 2.20; GR2/GR2A 1.x work similarly, but the interface is very different and many features are missing. GR3 2.x has a similar interface, but does not function like GR2A and is not covered here.
Hopefully all of you can glean some new information and tricks on using GR2A from this presentation. With the right setup, GR can be a very powerful program.
Update Log • 12/4/2014: Added in historical warning and LSR viewing as
well as setting storm motion from warnings (v. 2.20). Also added notes for changing MDA settings and pasting old sounding data into the program.
• 2/13/2014: New customizable UI, changes in how the arrow keys work, and new mouse sampling option (v. 2.10).
• 10/25/2013: Addition of toggling on/off high resolution background imagery (v. 2.02).
• 10/1/2013: Major overhaul for version 2.0. Dual-pol products now baseline in program, changes in warning colors, new method for changing color tables, the option to have a satellite imagery background and changed cross section products/features.
Table of Contents
• Upgrading from GR2A 1.x to 2.x
• Layout of the Program
• Site Selection
• Loading Radar Imagery
• Loading Additional Overlays
• Navigating through the Radar Data
• Viewing Options
• Editing Settings
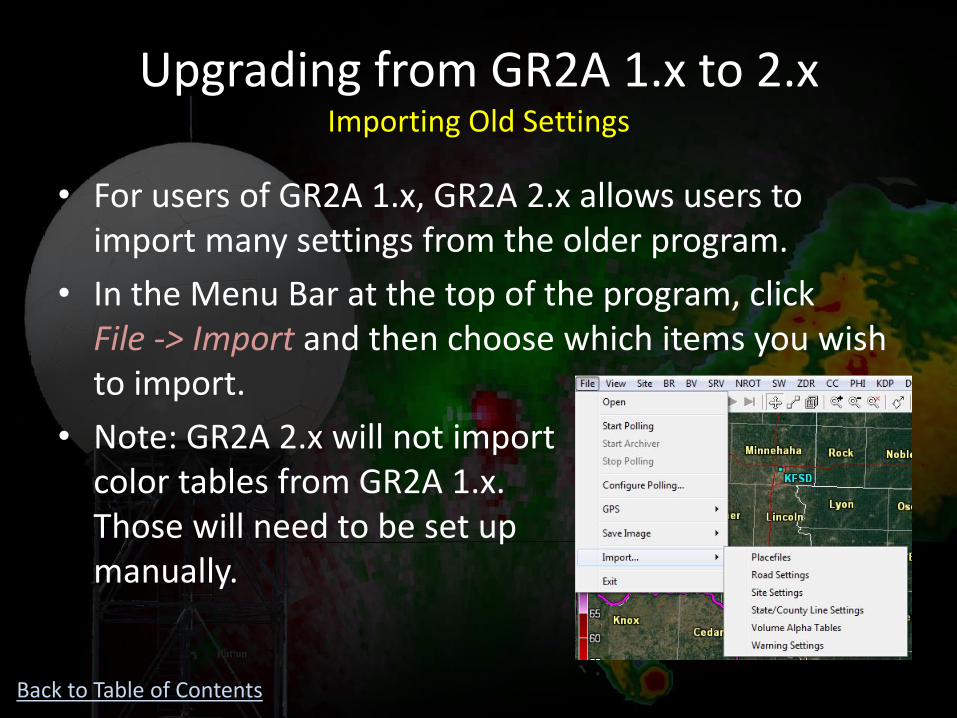
Upgrading from GR2A 1.x to 2.x Importing Old Settings
• For users of GR2A 1.x, GR2A 2.x allows users to import many settings from the older program.
• In the Menu Bar at the top of the program, click File -> Import and then choose which items you wish to import.
• Note: GR2A 2.x will not import color tables from GR2A 1.x. Those will need to be set up manually.
Back to Table of Contents
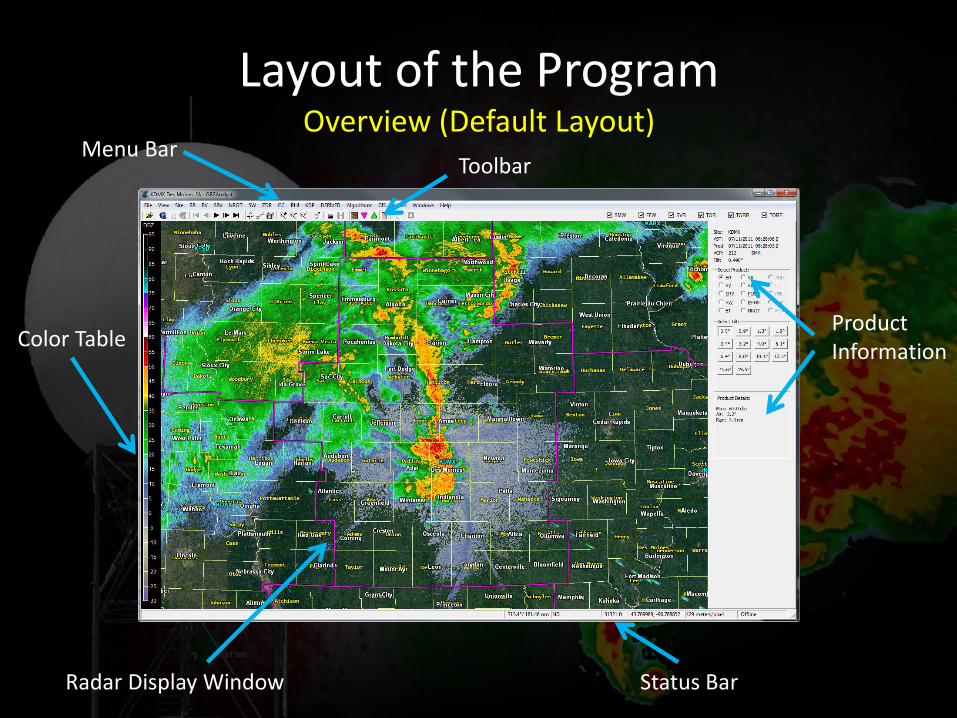
Layout of the Program Overview (Default Layout)
Menu Bar Toolbar
Color Table Product Information
Radar Display Window Status Bar
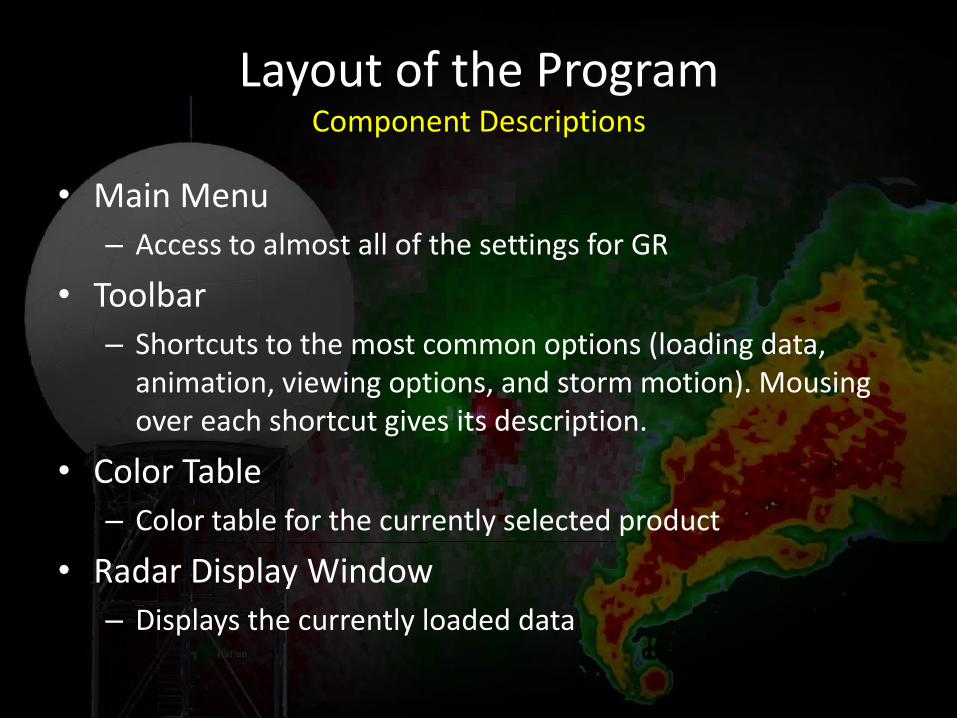
Layout of the Program Component Descriptions
• Main Menu
– Access to almost all of the settings for GR
• Toolbar
– Shortcuts to the most common options (loading data, animation, viewing options, and storm motion). Mousing over each shortcut gives its description.
• Color Table
– Color table for the currently selected product
• Radar Display Window
– Displays the currently loaded data
Layout of the Program Component Descriptions
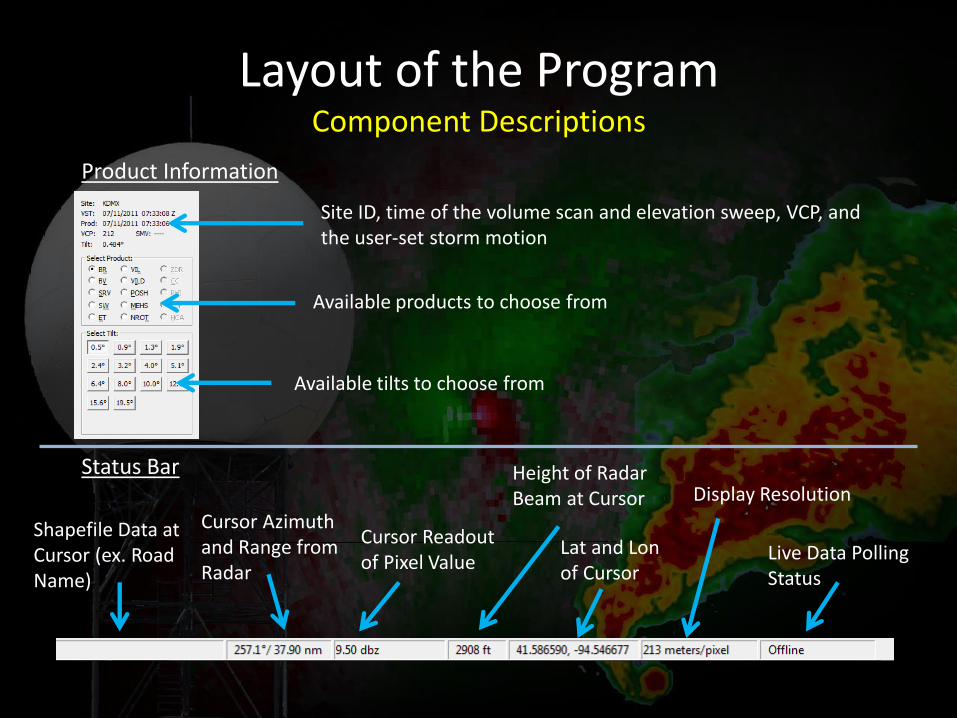
Status Bar
Shapefile Data at Cursor (ex. Road Name)
Cursor Azimuth and Range from Radar
Cursor Readout of Pixel Value
Lat and Lon of Cursor
Height of Radar Beam at Cursor
Live Data Polling Status
Product Information
Site ID, time of the volume scan and elevation sweep, VCP, and the user-set storm motion
Available products to choose from
Available tilts to choose from
Display Resolution
Layout of the Program Customization
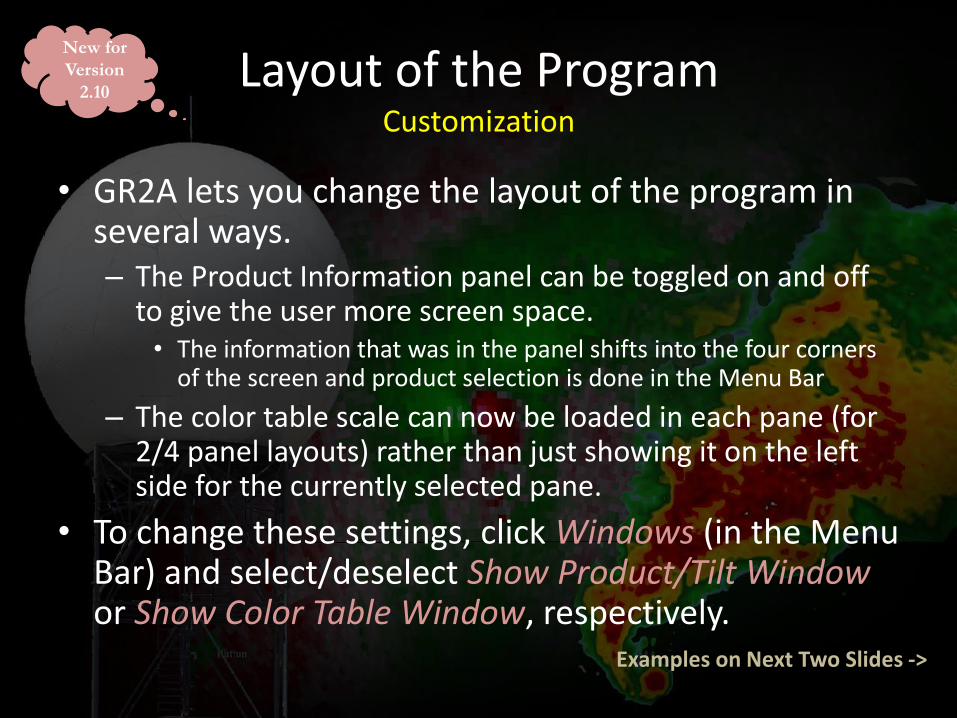
• GR2A lets you change the layout of the program in several ways. – The Product Information panel can be toggled on and off
to give the user more screen space. • The information that was in the panel shifts into the four corners
of the screen and product selection is done in the Menu Bar
– The color table scale can now be loaded in each pane (for 2/4 panel layouts) rather than just showing it on the left side for the currently selected pane.
• To change these settings, click Windows (in the Menu Bar) and select/deselect Show Product/Tilt Window or Show Color Table Window, respectively.
Examples on Next Two Slides ->
New for
Version
2.10
Layout of the Program Customization Examples
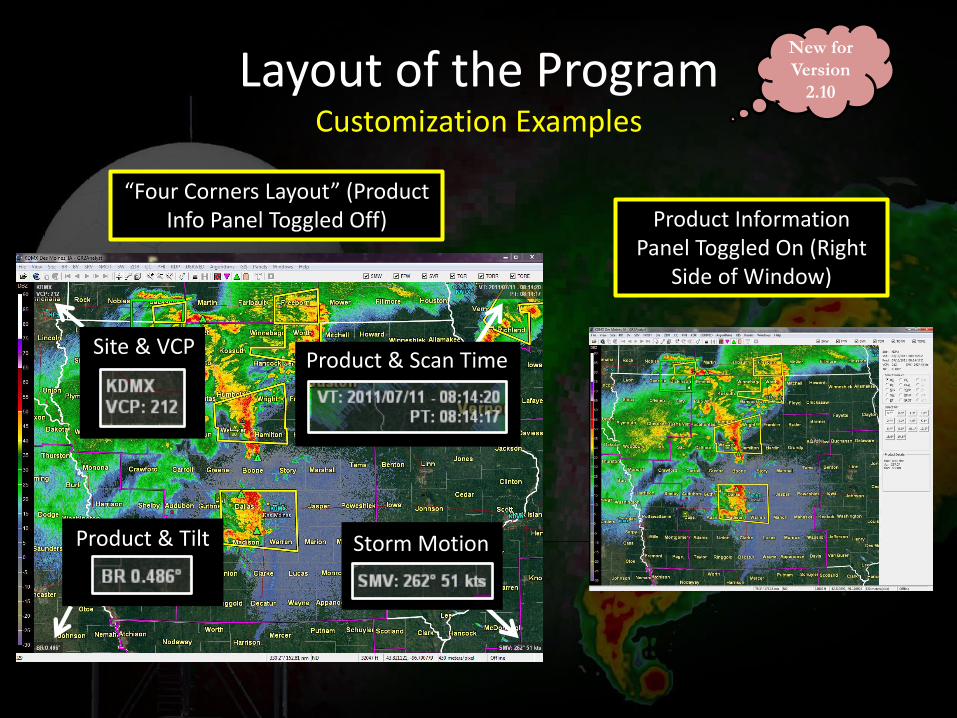
“Four Corners Layout” (Product Info Panel Toggled Off) Product Information
Panel Toggled On (Right Side of Window)
New for
Version
2.10
Site & VCP
Product & Tilt Storm Motion
Product & Scan Time
Layout of the Program Customization Examples
Back to Table of Contents
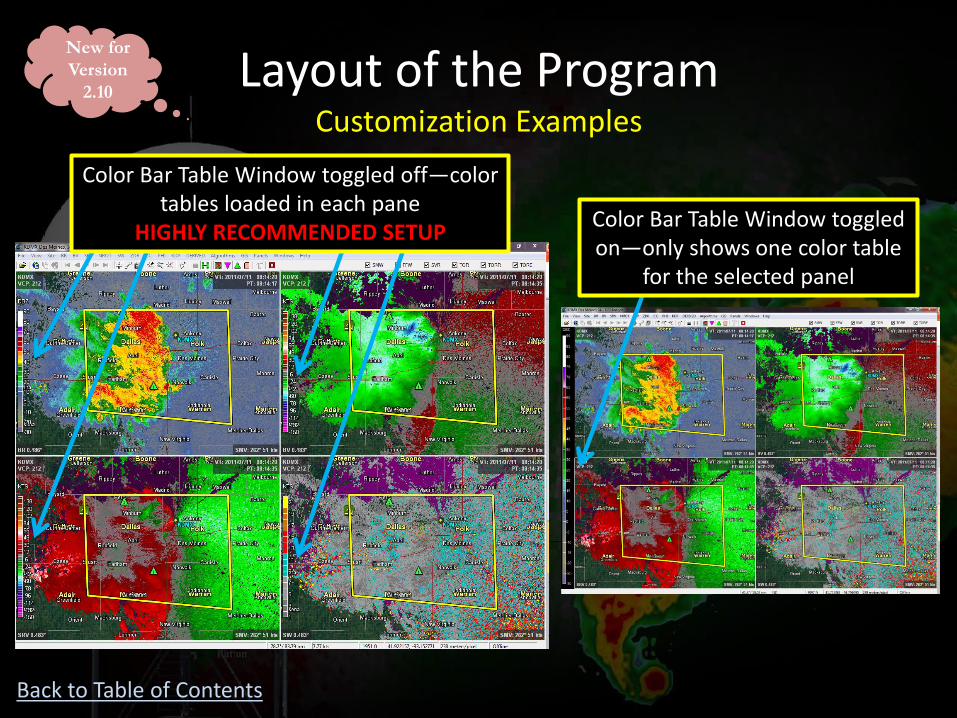
Color Bar Table Window toggled off—color tables loaded in each pane
HIGHLY RECOMMENDED SETUP Color Bar Table Window toggled on—only shows one color table
for the selected panel
New for
Version
2.10
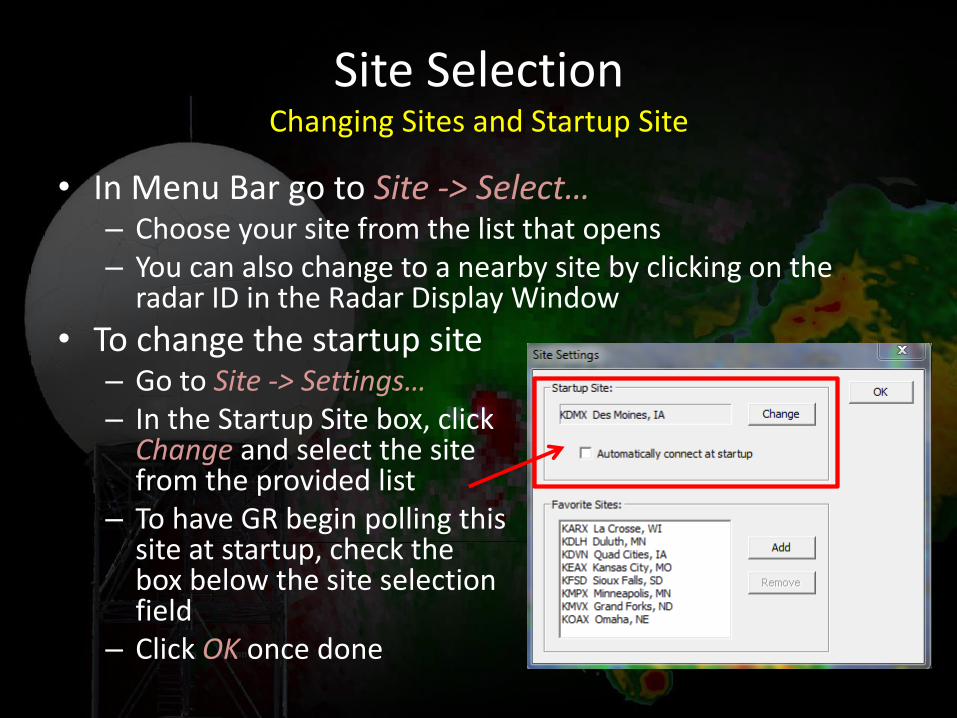
Site Selection Changing Sites and Startup Site
• In Menu Bar go to Site -> Select… – Choose your site from the list that opens – You can also change to a nearby site by clicking on the
radar ID in the Radar Display Window
• To change the startup site – Go to Site -> Settings… – In the Startup Site box, click
Change and select the site from the provided list
– To have GR begin polling this site at startup, check the box below the site selection field
– Click OK once done
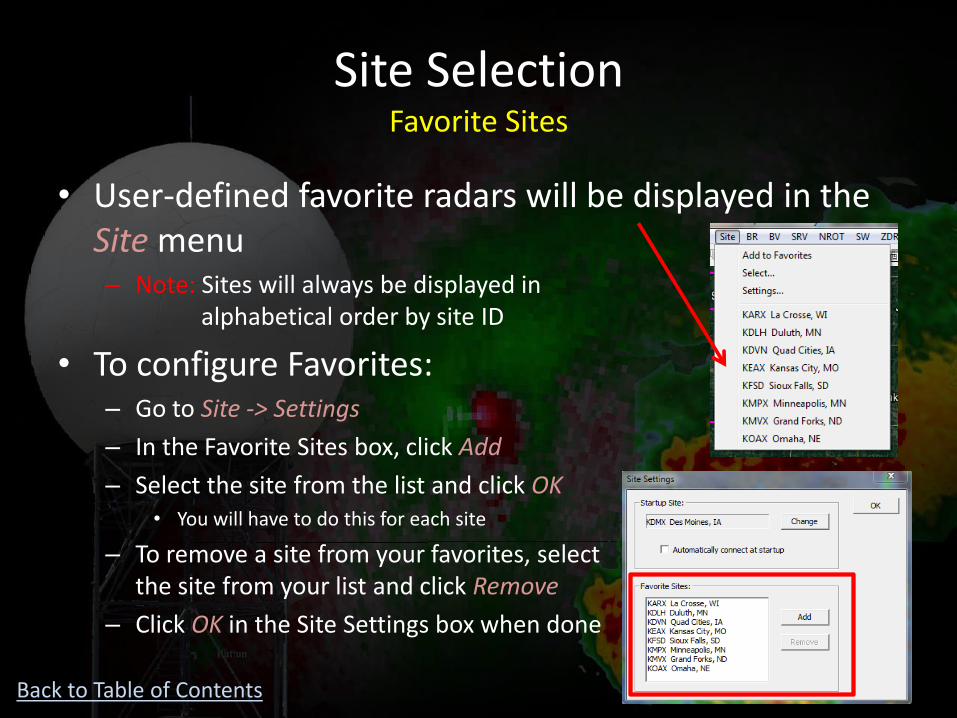
• User-defined favorite radars will be displayed in the Site menu – Note: Sites will always be displayed in
alphabetical order by site ID
• To configure Favorites: – Go to Site -> Settings
– In the Favorite Sites box, click Add
– Select the site from the list and click OK • You will have to do this for each site
– To remove a site from your favorites, select the site from your list and click Remove
– Click OK in the Site Settings box when done
Site Selection Favorite Sites
Back to Table of Contents

Loading Radar Imagery Loading Archived Data
• In Menu Bar go to File -> Open
OR
• Click the icon on the Toolbar – Navigate to the folder containing the data, use the shift key to
highlight the desired time range, then click open
• You can also drag and drop the radar files you wish to load directly from the Windows Explorer into GR.
• Note: If you are polling live data, you must turn off polling to load archived data.
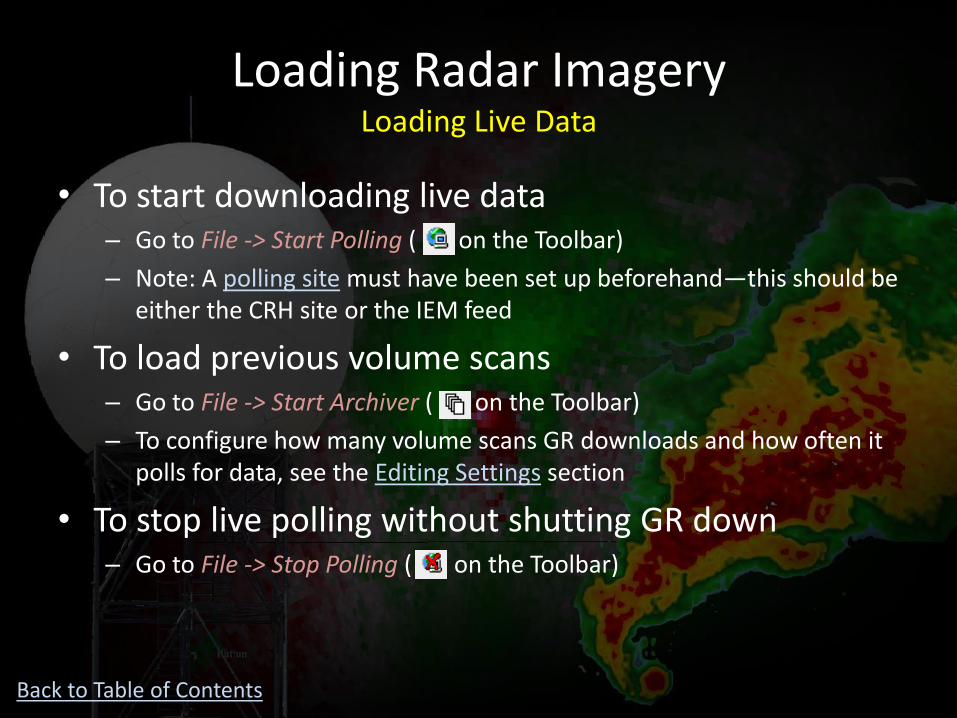
Loading Radar Imagery Loading Live Data
• To start downloading live data – Go to File -> Start Polling ( on the Toolbar)
– Note: A polling site must have been set up beforehand—this should be either the CRH site or the IEM feed
• To load previous volume scans – Go to File -> Start Archiver ( on the Toolbar)
– To configure how many volume scans GR downloads and how often it polls for data, see the Editing Settings section
• To stop live polling without shutting GR down – Go to File -> Stop Polling ( on the Toolbar)
Back to Table of Contents
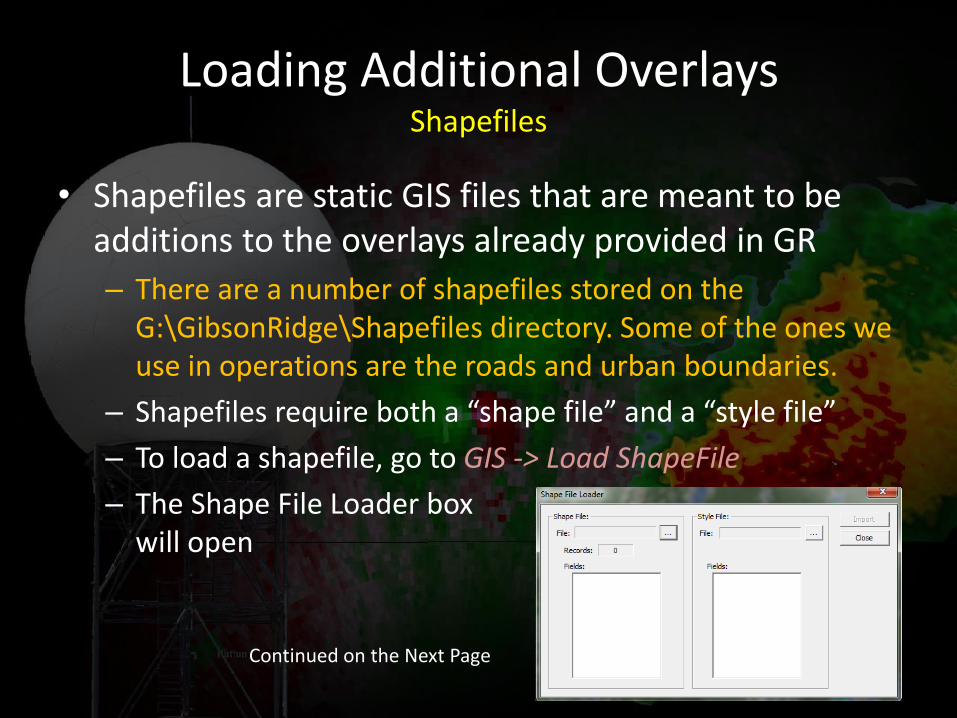
Loading Additional Overlays Shapefiles
• Shapefiles are static GIS files that are meant to be additions to the overlays already provided in GR
– There are a number of shapefiles stored on the G:\GibsonRidge\Shapefiles directory. Some of the ones we use in operations are the roads and urban boundaries.
– Shapefiles require both a “shape file” and a “style file”
– To load a shapefile, go to GIS -> Load ShapeFile
– The Shape File Loader box will open
Continued on the Next Page
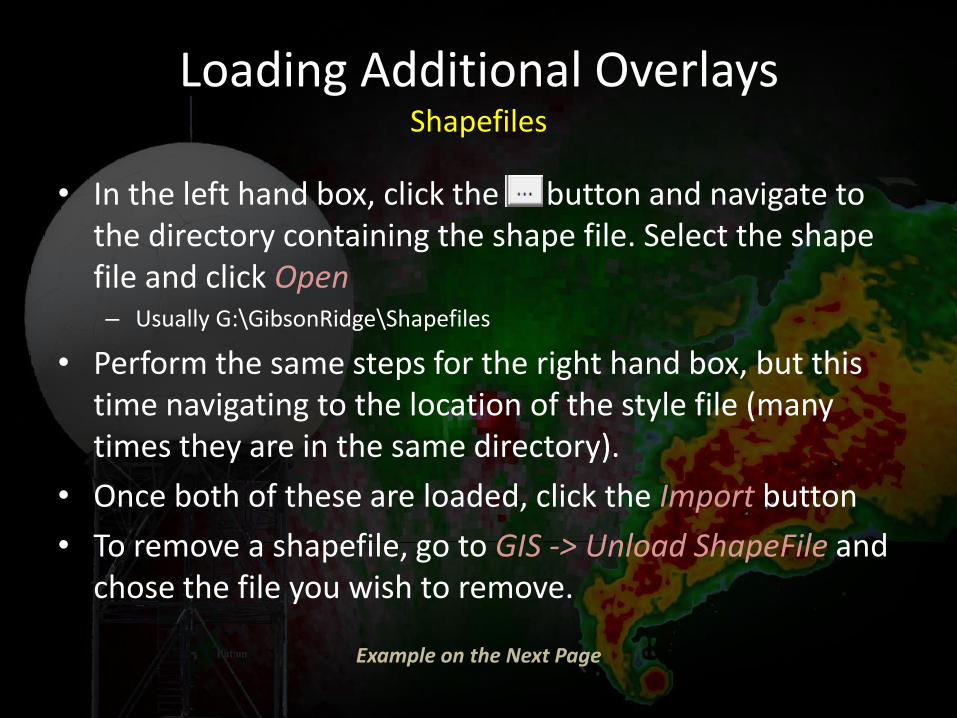
Loading Additional Overlays Shapefiles
• In the left hand box, click the button and navigate to the directory containing the shape file. Select the shape file and click Open – Usually G:\GibsonRidge\Shapefiles
• Perform the same steps for the right hand box, but this time navigating to the location of the style file (many times they are in the same directory).
• Once both of these are loaded, click the Import button
• To remove a shapefile, go to GIS -> Unload ShapeFile and chose the file you wish to remove.
Example on the Next Page

Loading Additional Overlays Shapefiles Example: Loading CWA Roads
• From the Shape File Loader window, click the button on the left side.
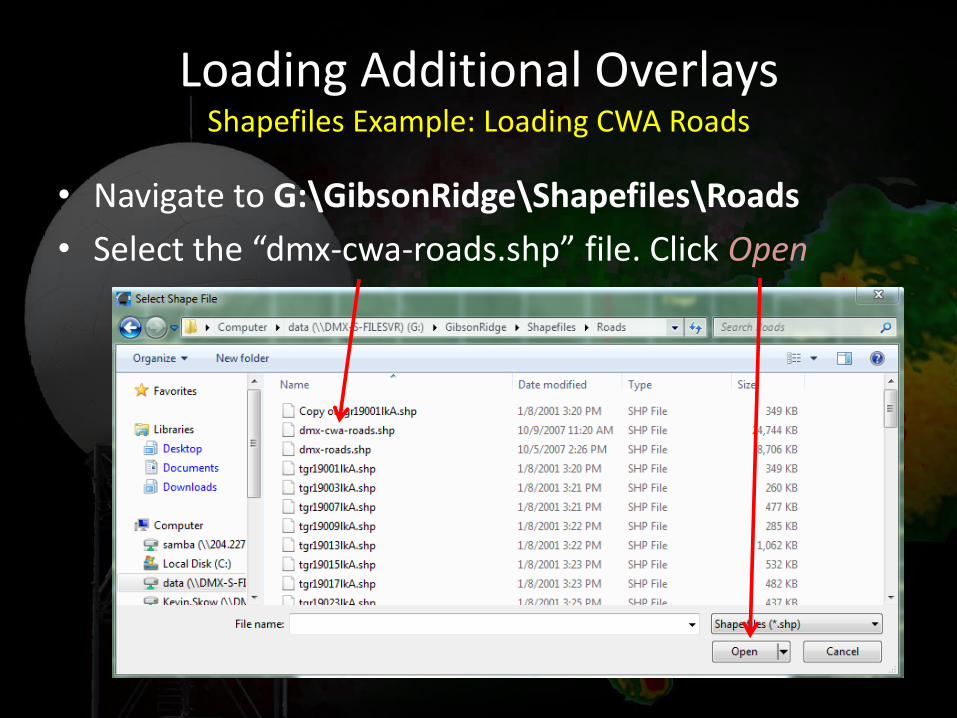
Loading Additional Overlays Shapefiles Example: Loading CWA Roads
• Navigate to G:\GibsonRidge\Shapefiles\Roads
• Select the “dmx-cwa-roads.shp” file. Click Open
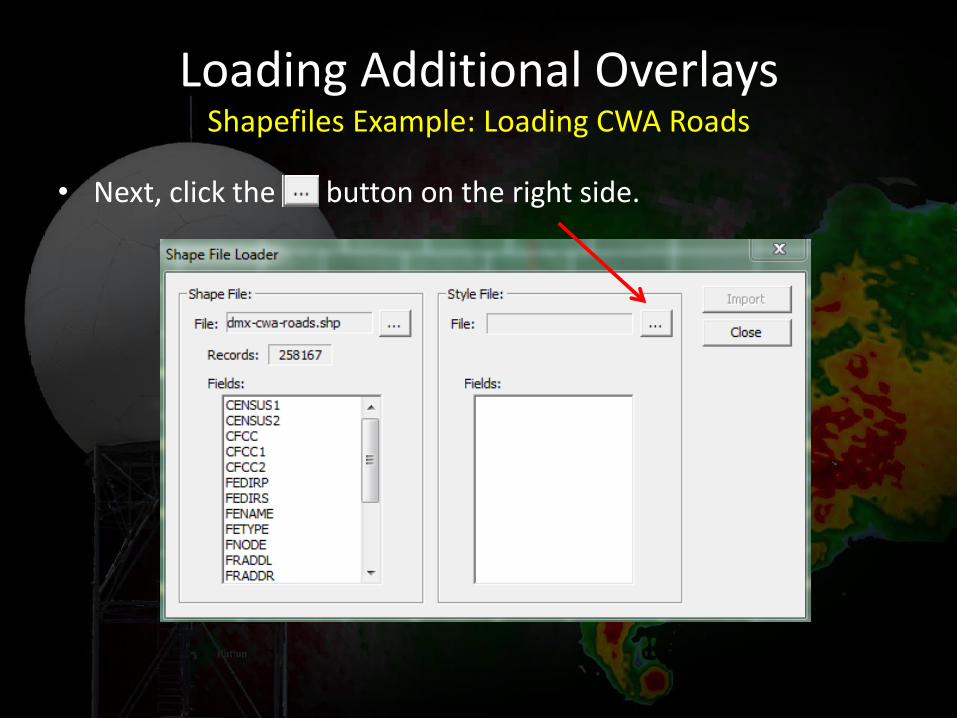
Loading Additional Overlays Shapefiles Example: Loading CWA Roads
• Next, click the button on the right side.
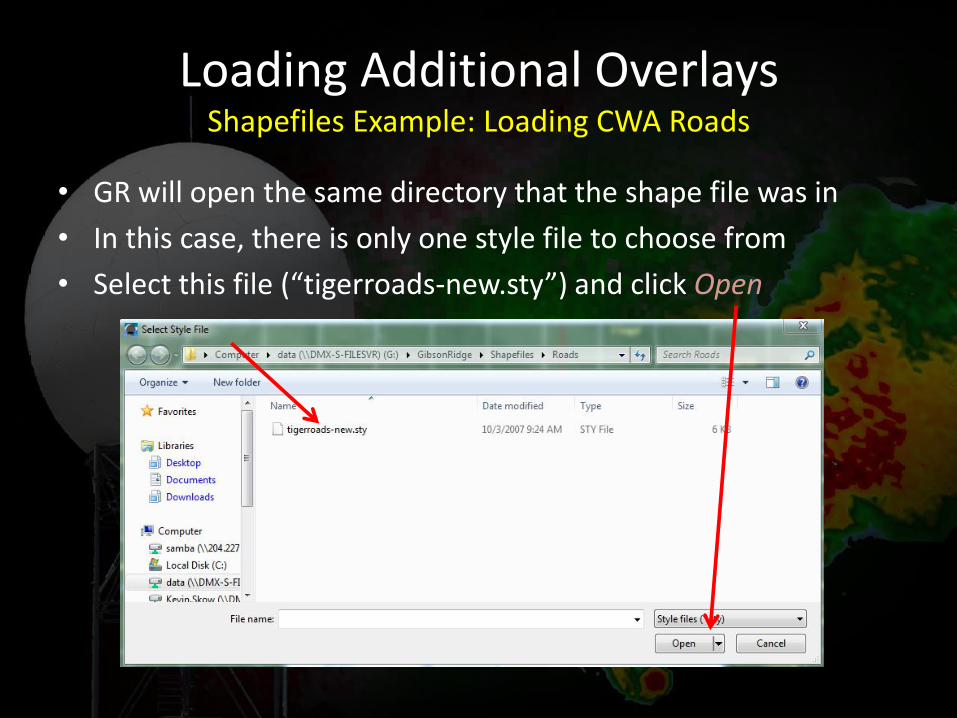
Loading Additional Overlays Shapefiles Example: Loading CWA Roads
• GR will open the same directory that the shape file was in
• In this case, there is only one style file to choose from
• Select this file (“tigerroads-new.sty”) and click Open
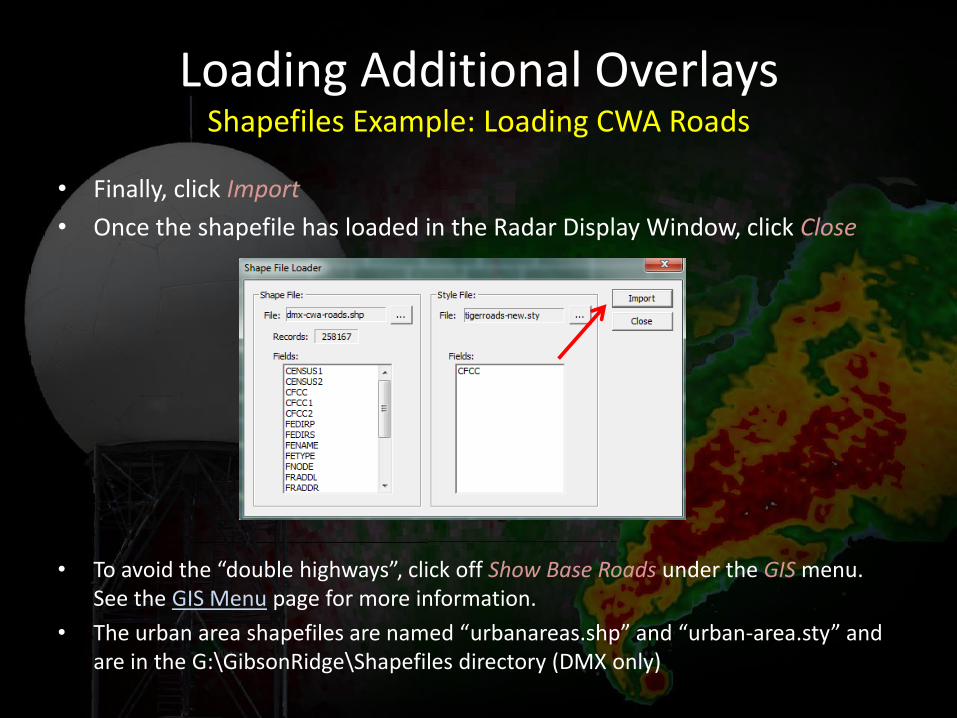
Loading Additional Overlays Shapefiles Example: Loading CWA Roads
• Finally, click Import
• Once the shapefile has loaded in the Radar Display Window, click Close
• To avoid the “double highways”, click off Show Base Roads under the GIS menu. See the GIS Menu page for more information.
• The urban area shapefiles are named “urbanareas.shp” and “urban-area.sty” and are in the G:\GibsonRidge\Shapefiles directory (DMX only)
Loading Additional Overlays Placefiles
• Placefiles are custom text files that are specifically designed for GR
– Can be either static files (spotter residences, law enforcement locations, etc.) or dynamically updated on a server (surface obs, SPC outlooks and watches, webcam images, etc.)
• To load either type of placefile, make sure the Windows -> Show Placefile Manager option is checked. When it is checked, a small window should open up on the screen.
Continued on Next Page

Loading Additional Overlays Placefiles: Loading
• Click the button on the Placefile Manager window – The following window will open
– To load a static (saved) placefile, click the button and navigate to the file on the computer.
– To load a placefile located on the Internet, simply paste the address to the placefile in the text field (to the left of the button)
– Click OK when done. Repeat the process above for each placefile
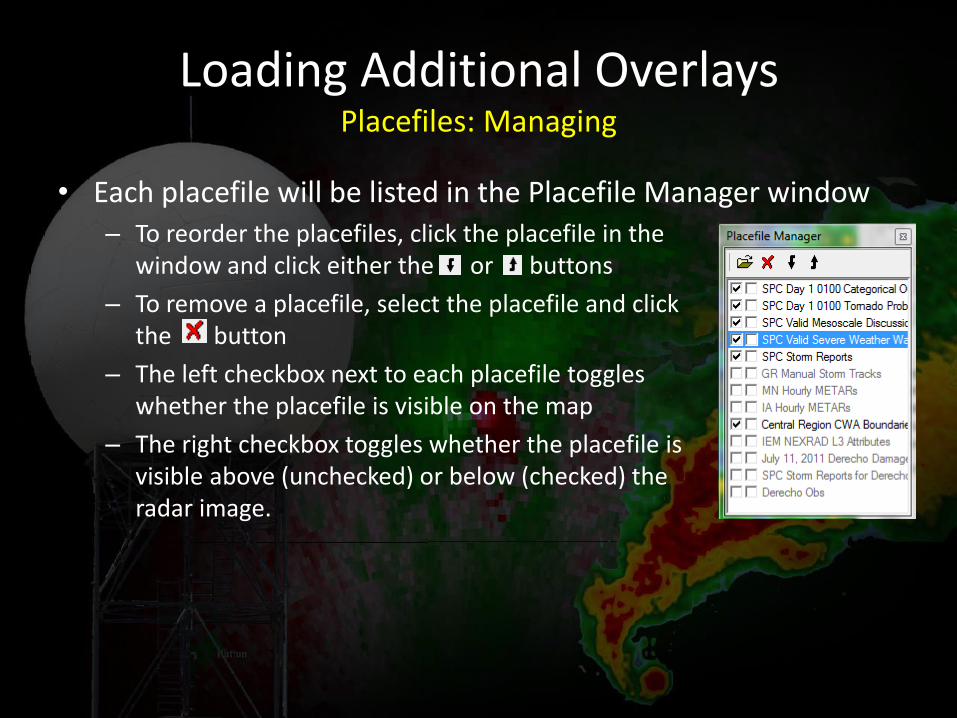
Loading Additional Overlays Placefiles: Managing
• Each placefile will be listed in the Placefile Manager window – To reorder the placefiles, click the placefile in the
window and click either the or buttons
– To remove a placefile, select the placefile and click the button
– The left checkbox next to each placefile toggles whether the placefile is visible on the map
– The right checkbox toggles whether the placefile is visible above (unchecked) or below (checked) the radar image.
Loading Additional Overlays Placefile Locations
• Placefiles Stored Locally at DMX (G:\GibsonRidge)
– Highly recommended placefiles include: • GRSpotters.dat
• GRLaw.dat
• GRFire.dat
– Other good placefiles include: • GRCOOP.dat (good for getting snow reports)
• GRRadio.dat (Radio Station Locations and Phone Numbers)
• GRTV.dat (Television Station Locations and Phone Numbers)
• Online Placefiles (non-exhaustive list and not endorsed by the NWS) – http://placefiles.redteamwx.com/fullobs.php
• Dynamically updating METAR placefile. Just paste this link into the placefile window.
– http://wilmingtonwx.com/placefiles.html SPC Outlooks/Mesoscale Discussions/Watches and Surface Observations
– http://mesonet.agron.iastate.edu/request/grx/ • Iowa surface obs (all networks), webcam images, NEXRAD Level 3 attributes
– http://www.spotternetwork.org/gr-feeds.php • Spotter Network locations and reports
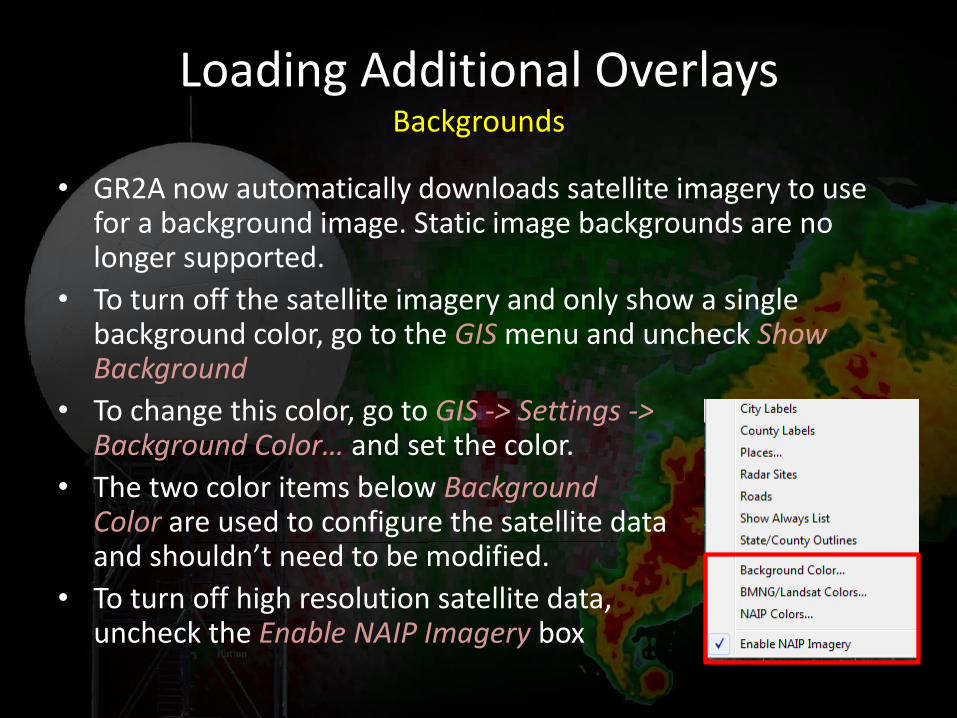
Loading Additional Overlays Backgrounds
• GR2A now automatically downloads satellite imagery to use for a background image. Static image backgrounds are no longer supported.
• To turn off the satellite imagery and only show a single background color, go to the GIS menu and uncheck Show Background
• To change this color, go to GIS -> Settings -> Background Color… and set the color.
• The two color items below Background Color are used to configure the satellite data and shouldn’t need to be modified.
• To turn off high resolution satellite data, uncheck the Enable NAIP Imagery box
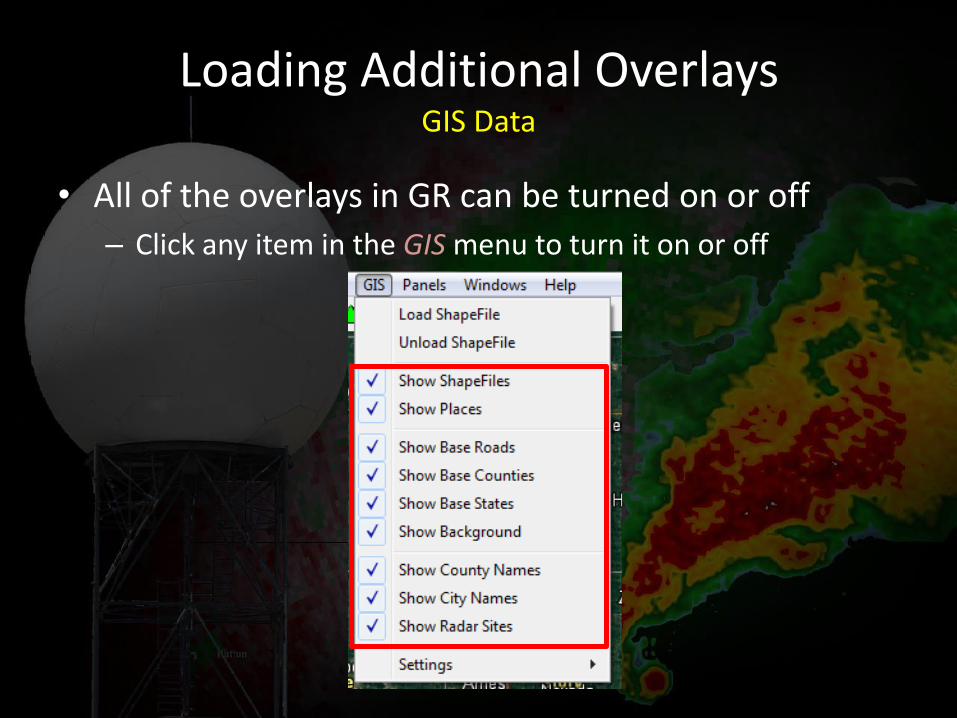
Loading Additional Overlays GIS Data
• All of the overlays in GR can be turned on or off
– Click any item in the GIS menu to turn it on or off
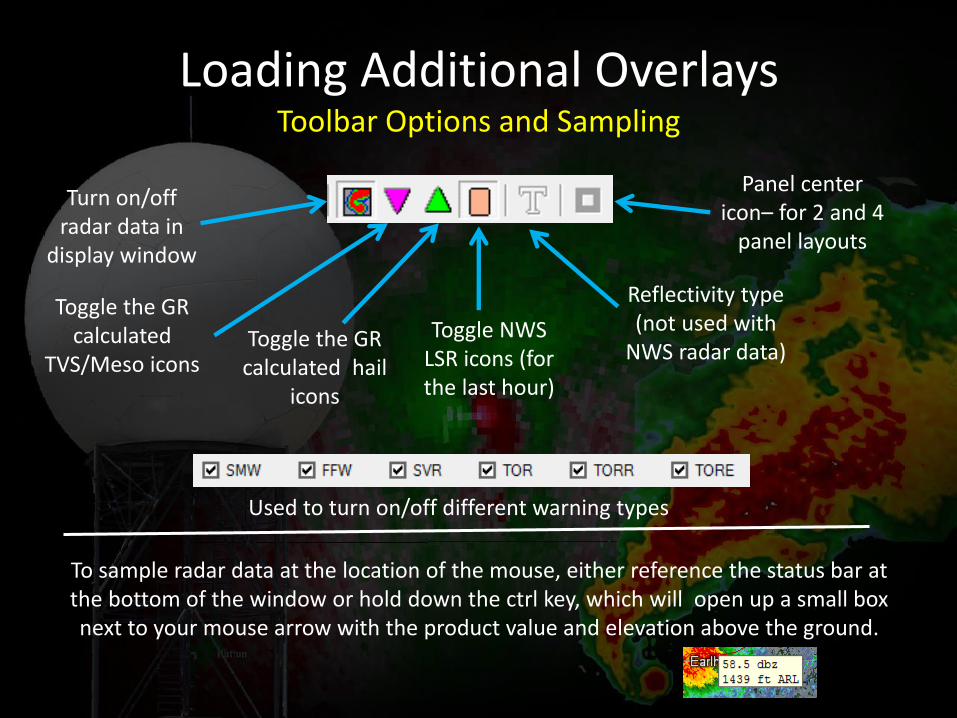
Loading Additional Overlays Toolbar Options and Sampling
Turn on/off radar data in
display window
Toggle the GR calculated
TVS/Meso icons Toggle the GR calculated hail
icons
Toggle NWS LSR icons (for the last hour)
Reflectivity type (not used with
NWS radar data)
Panel center icon– for 2 and 4
panel layouts
Used to turn on/off different warning types
To sample radar data at the location of the mouse, either reference the status bar at the bottom of the window or hold down the ctrl key, which will open up a small box next to your mouse arrow with the product value and elevation above the ground.
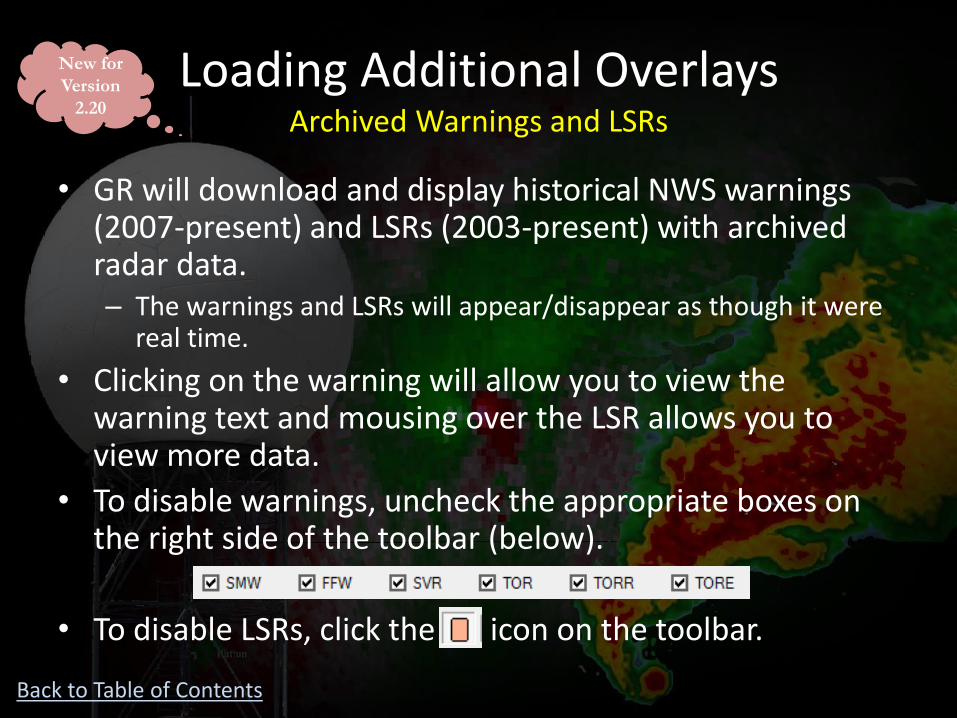
Loading Additional Overlays Archived Warnings and LSRs
• GR will download and display historical NWS warnings (2007-present) and LSRs (2003-present) with archived radar data. – The warnings and LSRs will appear/disappear as though it were
real time.
• Clicking on the warning will allow you to view the warning text and mousing over the LSR allows you to view more data.
• To disable warnings, uncheck the appropriate boxes on the right side of the toolbar (below).
• To disable LSRs, click the icon on the toolbar.
New for
Version
2.20
Back to Table of Contents
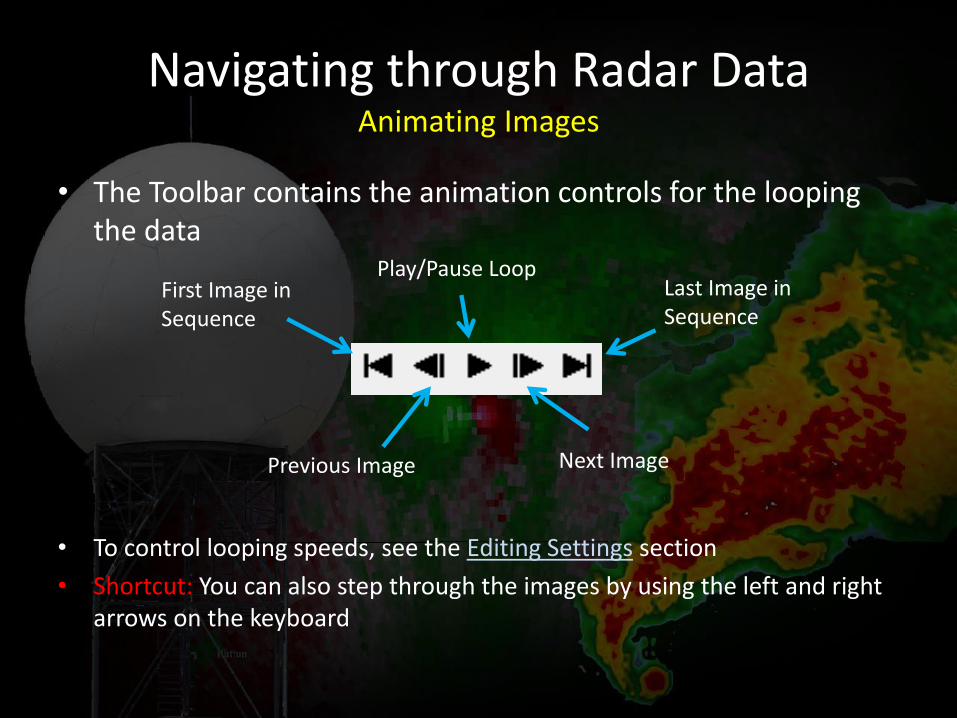
Navigating through Radar Data Animating Images
• The Toolbar contains the animation controls for the looping the data
• To control looping speeds, see the Editing Settings section
• Shortcut: You can also step through the images by using the left and right arrows on the keyboard
First Image in Sequence
Last Image in Sequence
Play/Pause Loop
Previous Image Next Image
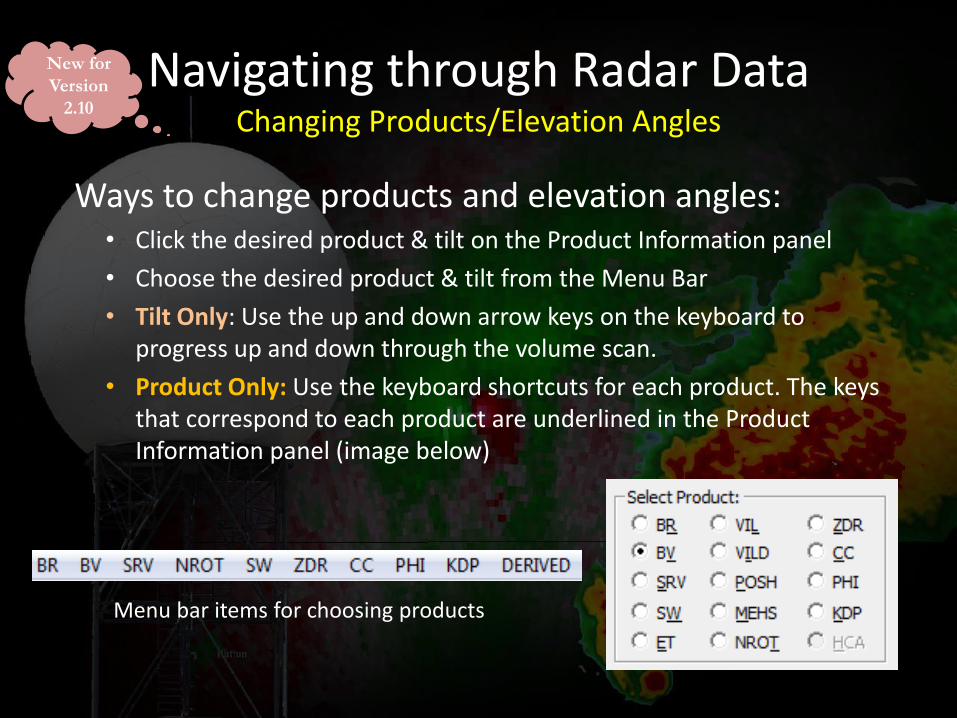
Navigating through Radar Data Changing Products/Elevation Angles
Ways to change products and elevation angles: • Click the desired product & tilt on the Product Information panel
• Choose the desired product & tilt from the Menu Bar
• Tilt Only: Use the up and down arrow keys on the keyboard to progress up and down through the volume scan.
• Product Only: Use the keyboard shortcuts for each product. The keys that correspond to each product are underlined in the Product Information panel (image below)
New for
Version
2.10
Menu bar items for choosing products
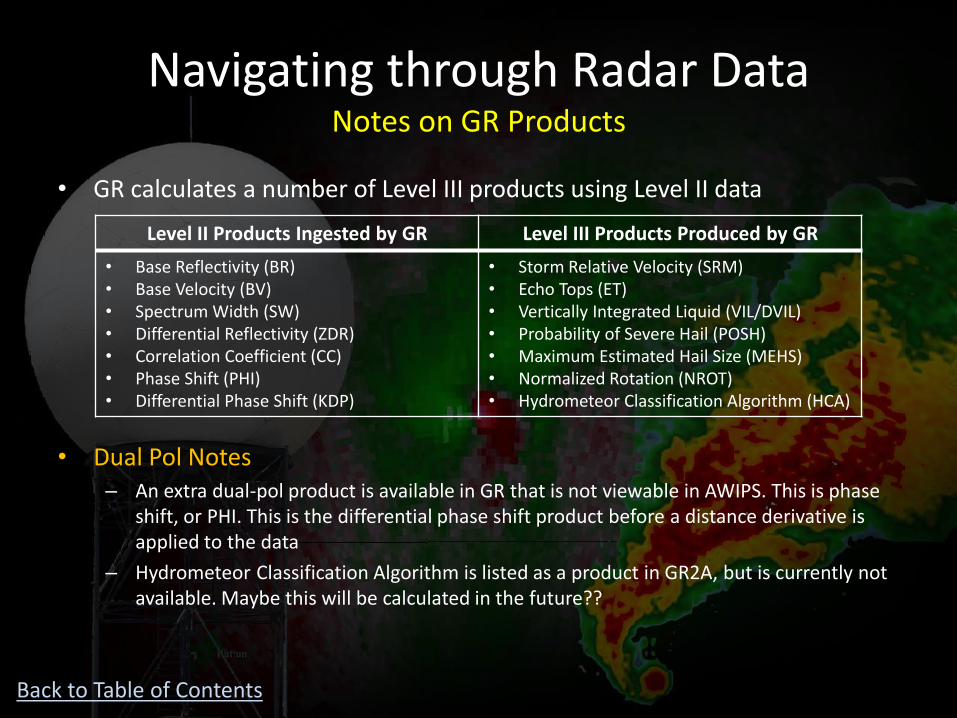
Navigating through Radar Data Notes on GR Products
• GR calculates a number of Level III products using Level II data
• Dual Pol Notes – An extra dual-pol product is available in GR that is not viewable in AWIPS. This is phase
shift, or PHI. This is the differential phase shift product before a distance derivative is applied to the data
– Hydrometeor Classification Algorithm is listed as a product in GR2A, but is currently not available. Maybe this will be calculated in the future??
Level II Products Ingested by GR Level III Products Produced by GR
• Base Reflectivity (BR) • Base Velocity (BV) • Spectrum Width (SW) • Differential Reflectivity (ZDR) • Correlation Coefficient (CC) • Phase Shift (PHI) • Differential Phase Shift (KDP)
• Storm Relative Velocity (SRM) • Echo Tops (ET) • Vertically Integrated Liquid (VIL/DVIL) • Probability of Severe Hail (POSH) • Maximum Estimated Hail Size (MEHS) • Normalized Rotation (NROT) • Hydrometeor Classification Algorithm (HCA)
Back to Table of Contents
Viewing Options Panels
• You can view radar data in one, two, or four separate panels in the Radar Display Window, much like the four panel display in AWIPS. – Panels -> One Panel to view one window
– Panels -> Two Panels to view two panels side by side
– Panels -> Four Panels to view four panels in the window
• To add a product to each panel, click the panel (it becomes highlighted with a thin black box) and choose the desired product and elevation from the Product Information panel or menu list.
• Pre-built panels are also under the Panels menu. Up to 8 different layouts can be edited and saved using the Save Current Panels as option in the menu.
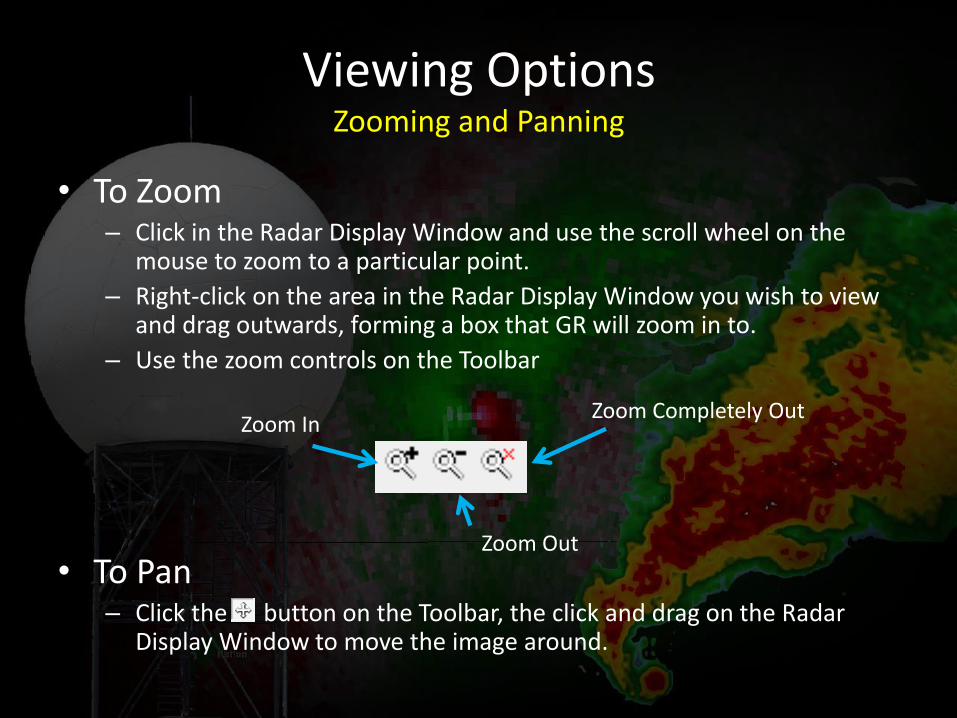
Viewing Options Zooming and Panning
• To Zoom – Click in the Radar Display Window and use the scroll wheel on the
mouse to zoom to a particular point.
– Right-click on the area in the Radar Display Window you wish to view and drag outwards, forming a box that GR will zoom in to.
– Use the zoom controls on the Toolbar
• To Pan – Click the button on the Toolbar, the click and drag on the Radar
Display Window to move the image around.
Zoom In
Zoom Out
Zoom Completely Out
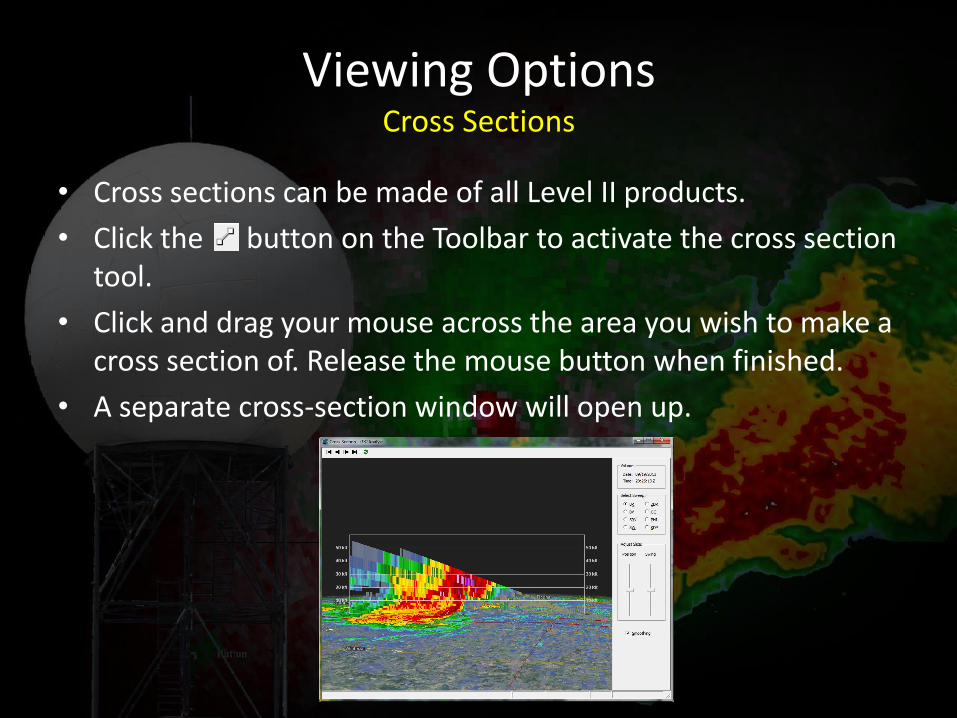
Viewing Options Cross Sections
• Cross sections can be made of all Level II products.
• Click the button on the Toolbar to activate the cross section tool.
• Click and drag your mouse across the area you wish to make a cross section of. Release the mouse button when finished.
• A separate cross-section window will open up.
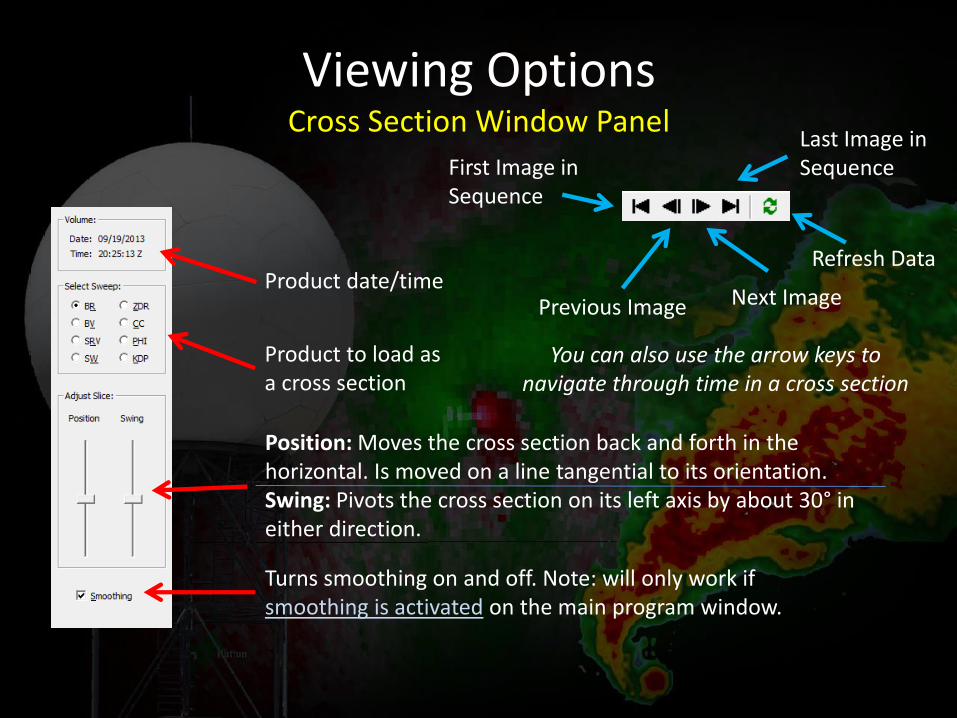
Viewing Options Cross Section Window Panel
Product to load as a cross section
Product date/time
Position: Moves the cross section back and forth in the horizontal. Is moved on a line tangential to its orientation. Swing: Pivots the cross section on its left axis by about 30° in either direction.
Turns smoothing on and off. Note: will only work if smoothing is activated on the main program window.
First Image in Sequence
Last Image in Sequence
Previous Image Next Image
Refresh Data
You can also use the arrow keys to navigate through time in a cross section
Viewing Options Cross Section Window Notes
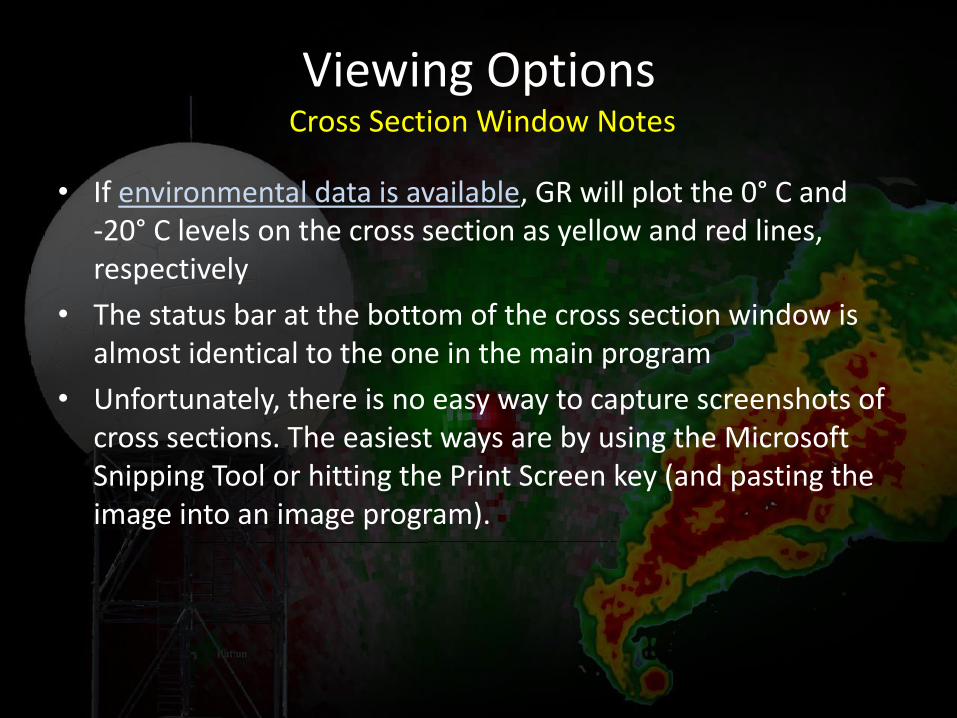
• If environmental data is available, GR will plot the 0° C and -20° C levels on the cross section as yellow and red lines, respectively
• The status bar at the bottom of the cross section window is almost identical to the one in the main program
• Unfortunately, there is no easy way to capture screenshots of cross sections. The easiest ways are by using the Microsoft Snipping Tool or hitting the Print Screen key (and pasting the image into an image program).

Viewing Options Volumetric Display
• Volumetric displays allow you to get a 3D look at a storm.
• Volumetric displays are only available for BR, BV, SRM, SW, and rotation (special GR calculated product).
• To create a volumetric display, click the icon on the Toolbar.
• Move your mouse to where you want the center of the cross section to be, then click and drag outward. A box will grow outward with your cursor showing the area that will be analyzed.
• When you let go of your mouse button, the volumetric display will open in a new window.
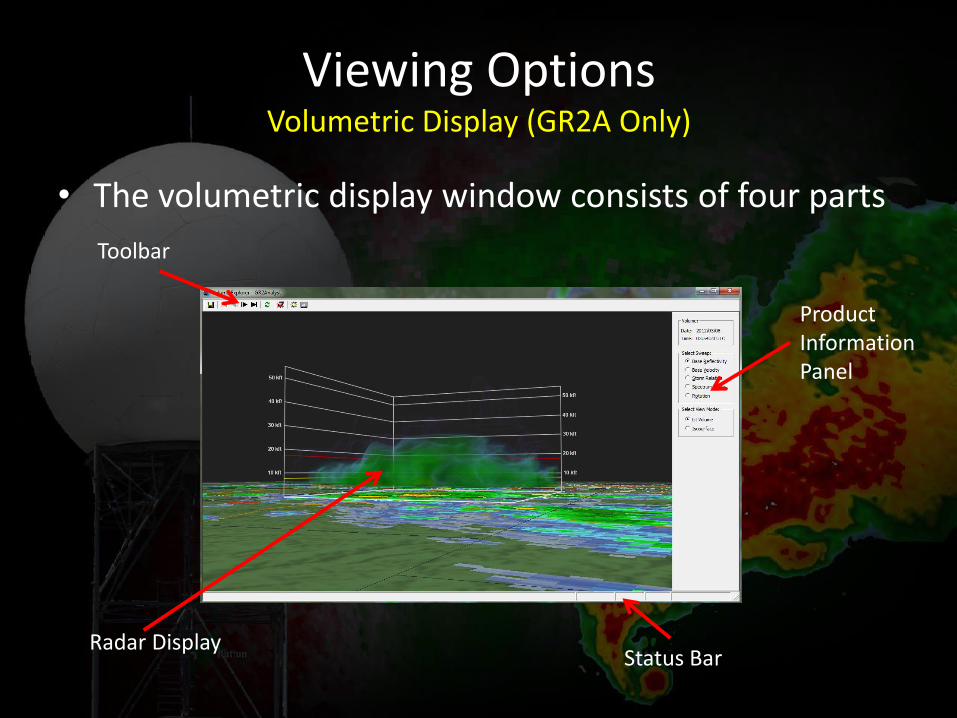
Viewing Options Volumetric Display (GR2A Only)
• The volumetric display window consists of four parts
Toolbar
Product Information Panel
Radar Display Status Bar
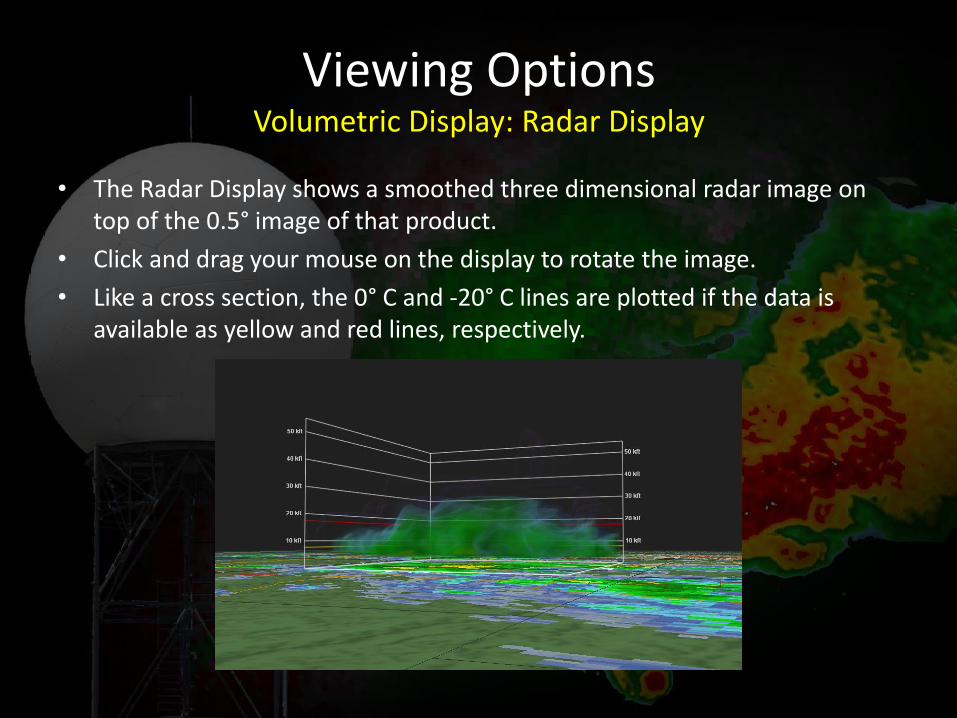
Viewing Options Volumetric Display: Radar Display
• The Radar Display shows a smoothed three dimensional radar image on top of the 0.5° image of that product.
• Click and drag your mouse on the display to rotate the image.
• Like a cross section, the 0° C and -20° C lines are plotted if the data is available as yellow and red lines, respectively.
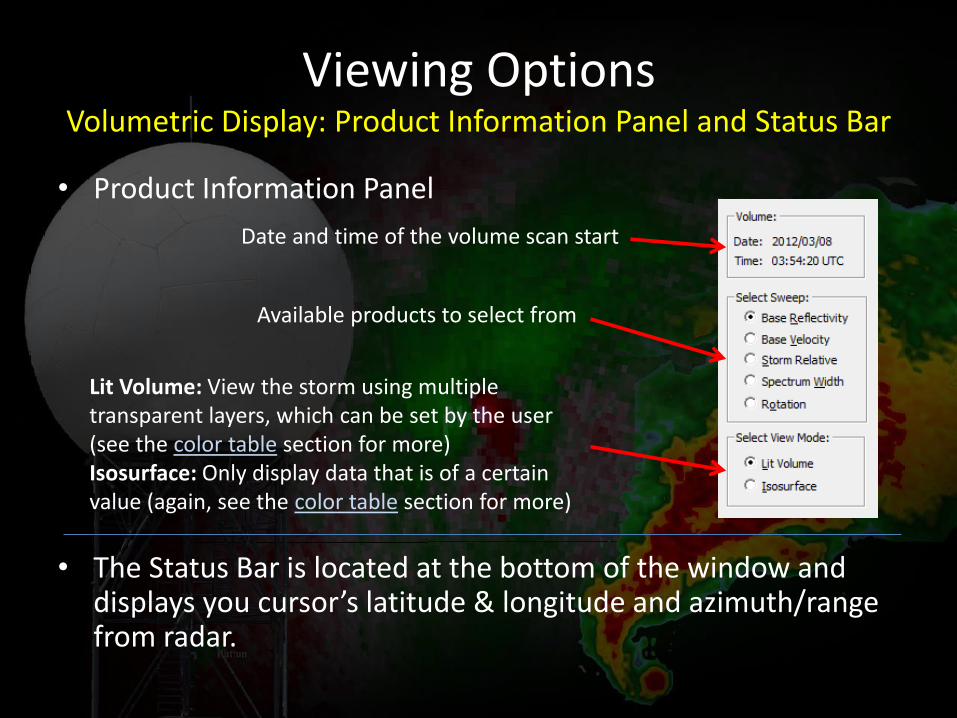
Viewing Options Volumetric Display: Product Information Panel and Status Bar
• Product Information Panel
• The Status Bar is located at the bottom of the window and displays you cursor’s latitude & longitude and azimuth/range from radar.
Date and time of the volume scan start
Available products to select from
Lit Volume: View the storm using multiple transparent layers, which can be set by the user (see the color table section for more) Isosurface: Only display data that is of a certain value (again, see the color table section for more)
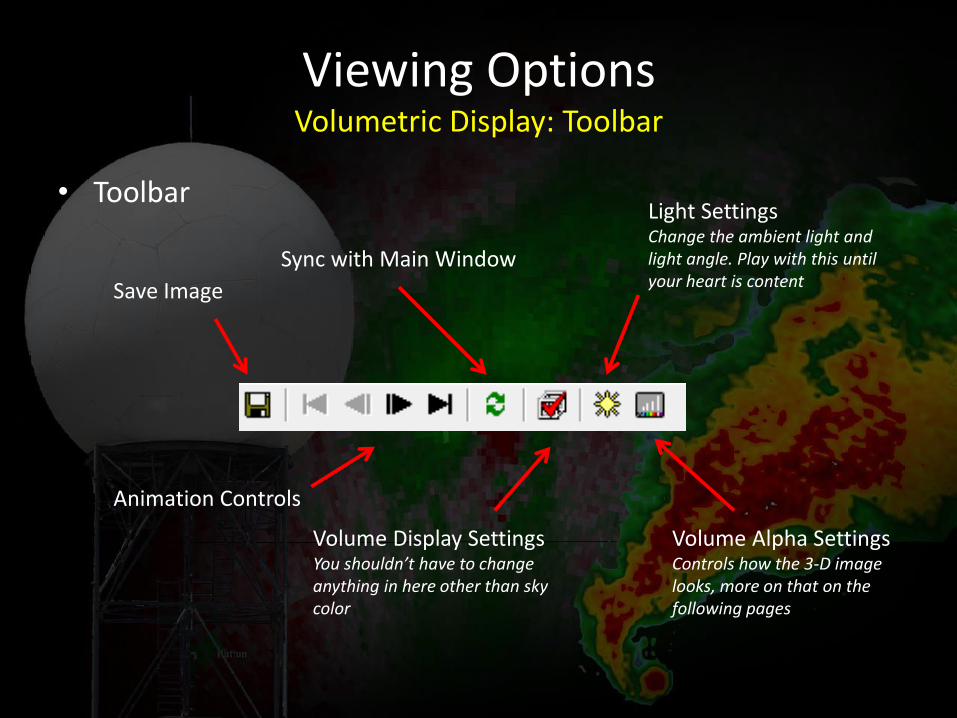
Viewing Options Volumetric Display: Toolbar
• Toolbar
Save Image
Animation Controls
Sync with Main Window
Volume Display Settings You shouldn’t have to change anything in here other than sky color
Volume Alpha Settings Controls how the 3-D image looks, more on that on the following pages
Light Settings Change the ambient light and light angle. Play with this until your heart is content

Viewing Options Volumetric Display: Editing the Lit Volume Colors
• Click on the icon on the Toolbar. The Volume Alpha window will open.
• The color scale is oriented along the bottom of the window, with a line stretching from the left to right side of the window. This line controls the transparency of the colors.
• The closer to the top of the window the line is, the more opaque the color directly under the line is; the closer the line is to the bottom of the window, the more transparent the color under it becomes.
• You use a series of click and drags with your mouse in the window to edit the transparency of colors.
Completely Opaque
Completely Transparent Examples on Next Pages
Viewing Options Volumetric Display: Editing the Lit Volume Colors
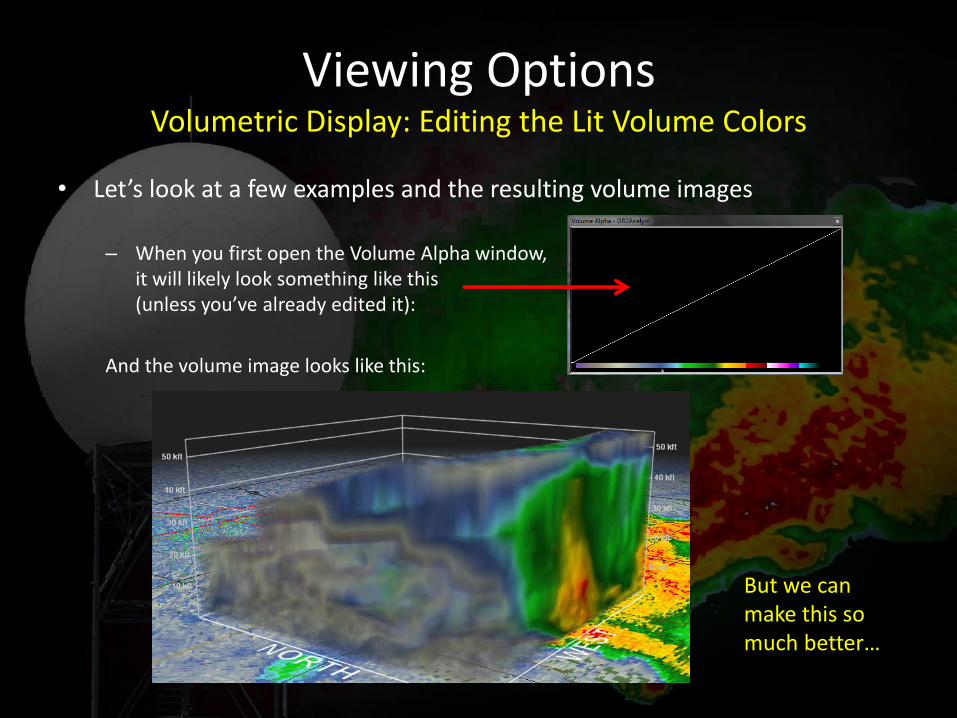
• Let’s look at a few examples and the resulting volume images
– When you first open the Volume Alpha window, it will likely look something like this (unless you’ve already edited it):
And the volume image looks like this:
But we can make this so much better…
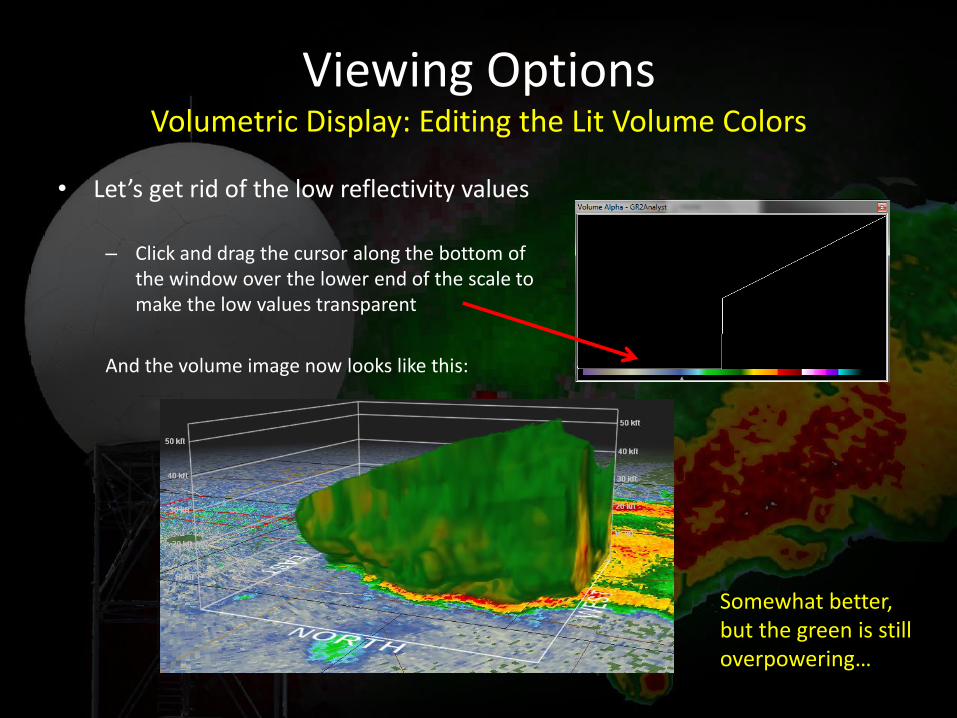
Viewing Options Volumetric Display: Editing the Lit Volume Colors
• Let’s get rid of the low reflectivity values
– Click and drag the cursor along the bottom of the window over the lower end of the scale to make the low values transparent
And the volume image now looks like this:
Somewhat better, but the green is still overpowering…
Viewing Options Volumetric Display: Editing the Lit Volume Colors
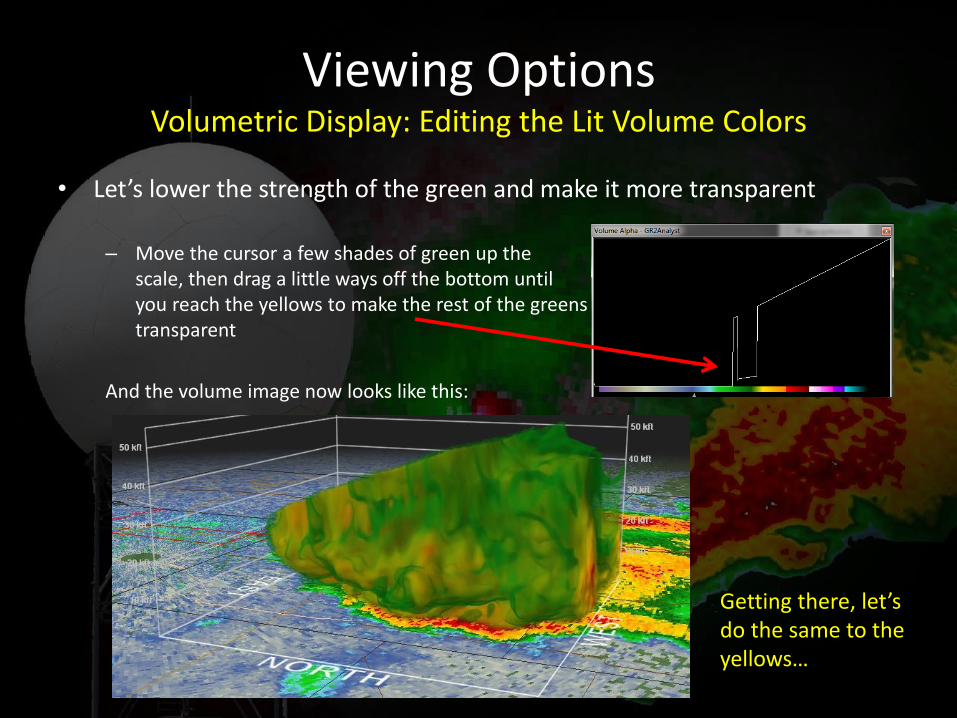
• Let’s lower the strength of the green and make it more transparent
– Move the cursor a few shades of green up the scale, then drag a little ways off the bottom until you reach the yellows to make the rest of the greens transparent
And the volume image now looks like this:
Getting there, let’s do the same to the yellows…
Viewing Options Volumetric Display: Editing the Lit Volume Colors
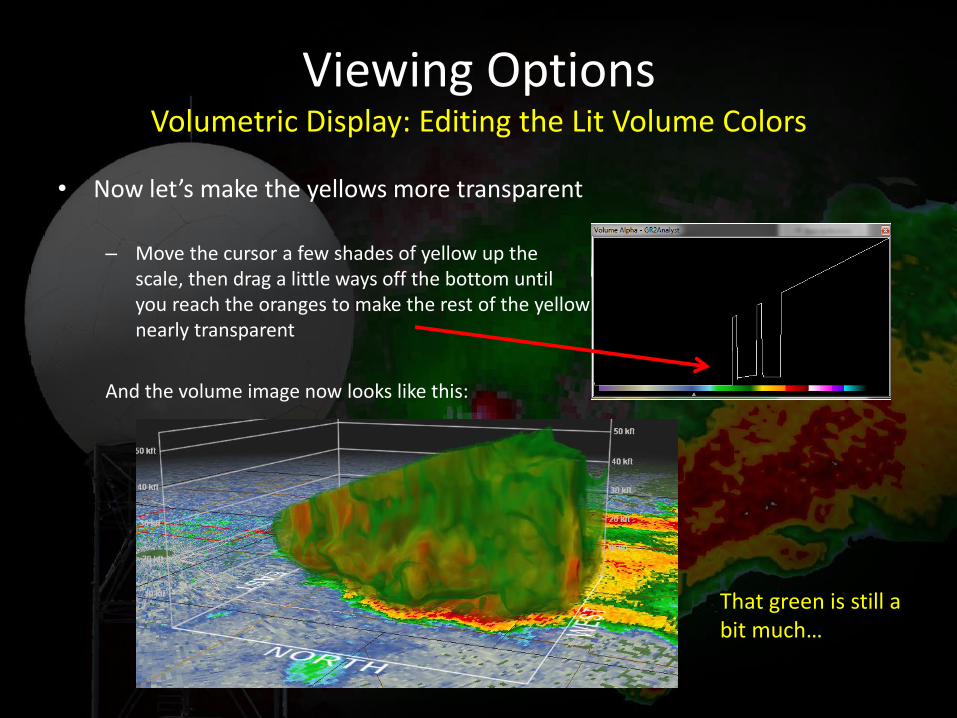
• Now let’s make the yellows more transparent
– Move the cursor a few shades of yellow up the scale, then drag a little ways off the bottom until you reach the oranges to make the rest of the yellows nearly transparent
And the volume image now looks like this:
That green is still a bit much…
Viewing Options Volumetric Display: Editing the Lit Volume Colors
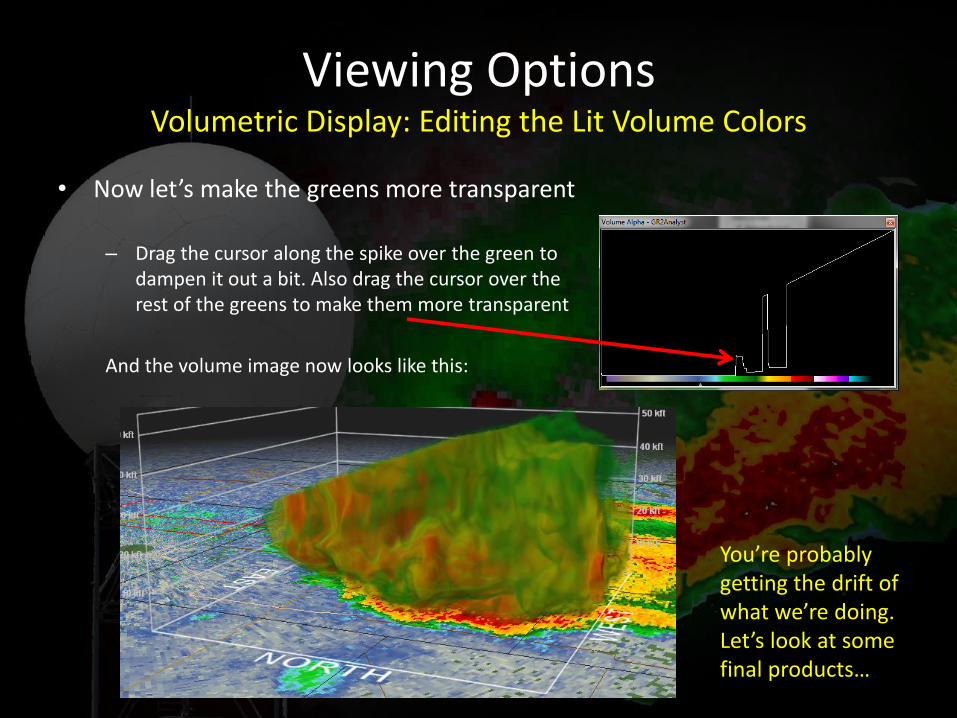
• Now let’s make the greens more transparent
– Drag the cursor along the spike over the green to dampen it out a bit. Also drag the cursor over the rest of the greens to make them more transparent
And the volume image now looks like this:
You’re probably getting the drift of what we’re doing. Let’s look at some final products…
Viewing Options Volumetric Display: Editing the Lit Volume Colors
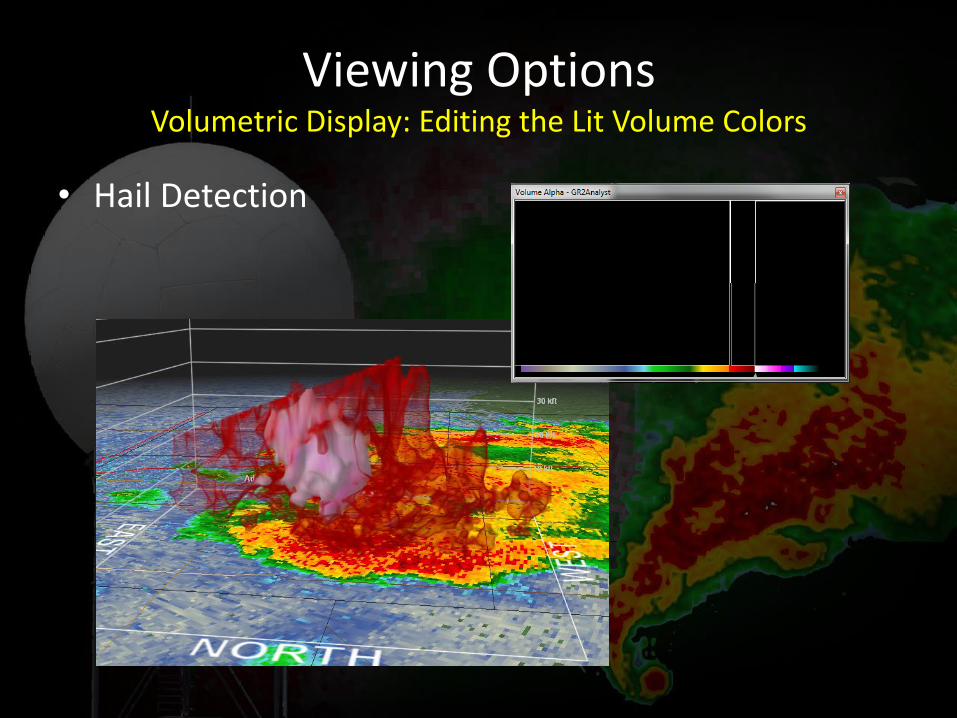
• Hail Detection
Viewing Options Volumetric Display: Editing the Lit Volume Colors
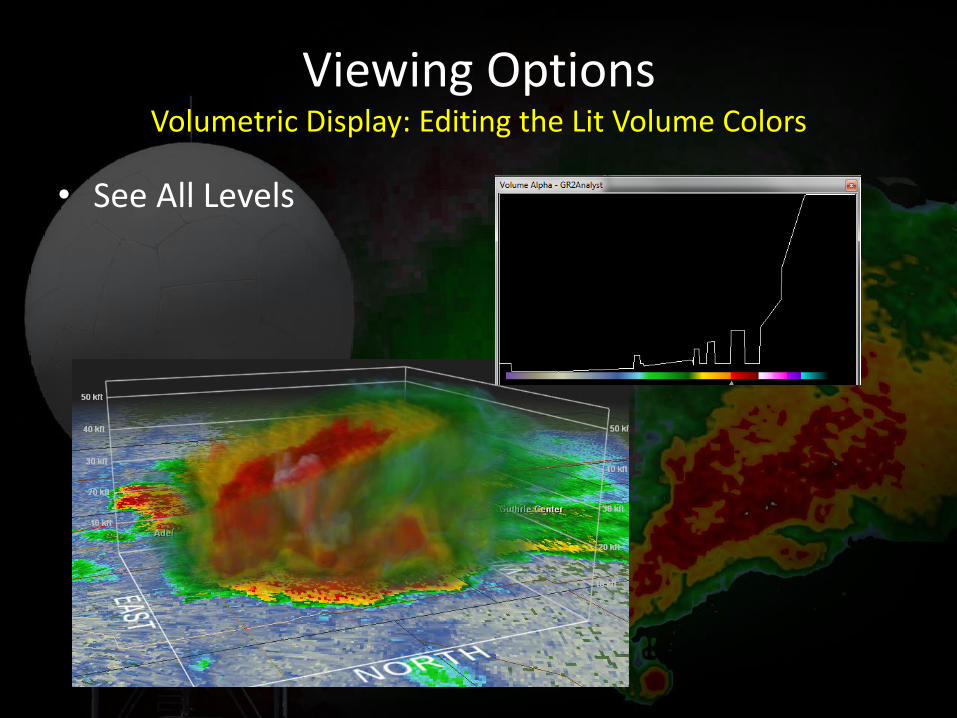
• See All Levels
Viewing Options Volumetric Display: Editing the Lit Volume Colors
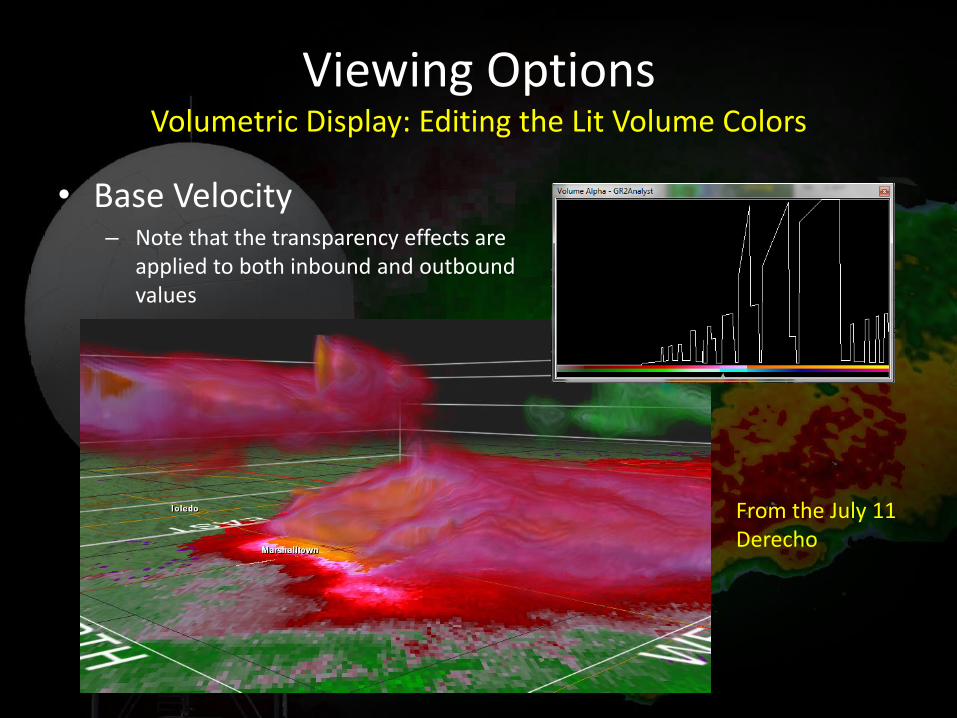
• Base Velocity – Note that the transparency effects are
applied to both inbound and outbound values
From the July 11 Derecho
Viewing Options Volumetric Display: Editing the Lit Volume Colors
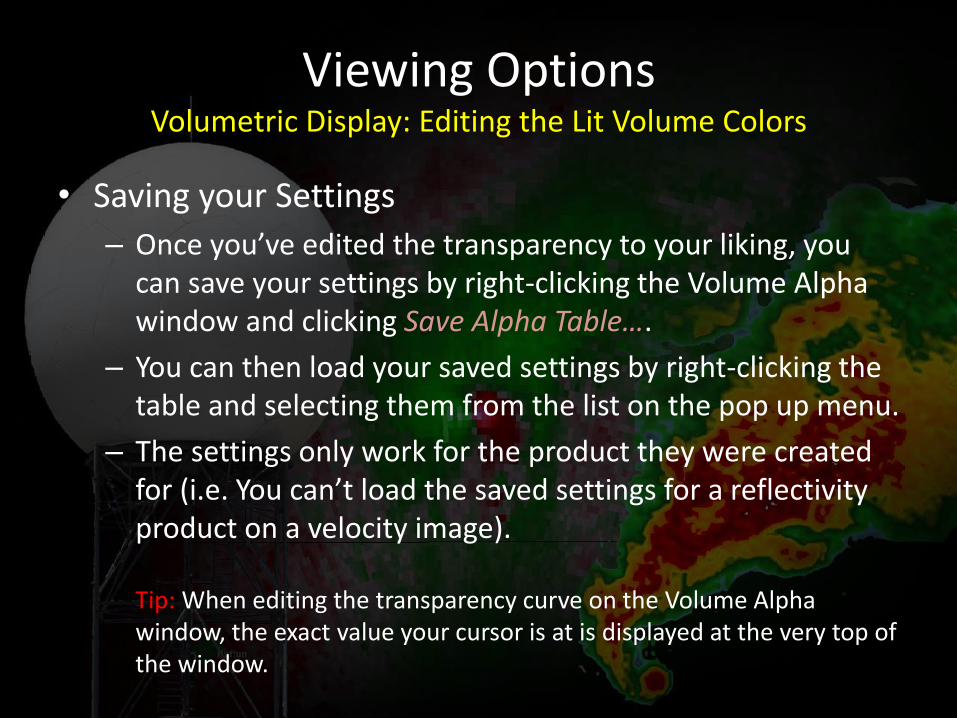
• Saving your Settings
– Once you’ve edited the transparency to your liking, you can save your settings by right-clicking the Volume Alpha window and clicking Save Alpha Table….
– You can then load your saved settings by right-clicking the table and selecting them from the list on the pop up menu.
– The settings only work for the product they were created for (i.e. You can’t load the saved settings for a reflectivity product on a velocity image).
Tip: When editing the transparency curve on the Volume Alpha window, the exact value your cursor is at is displayed at the very top of the window.
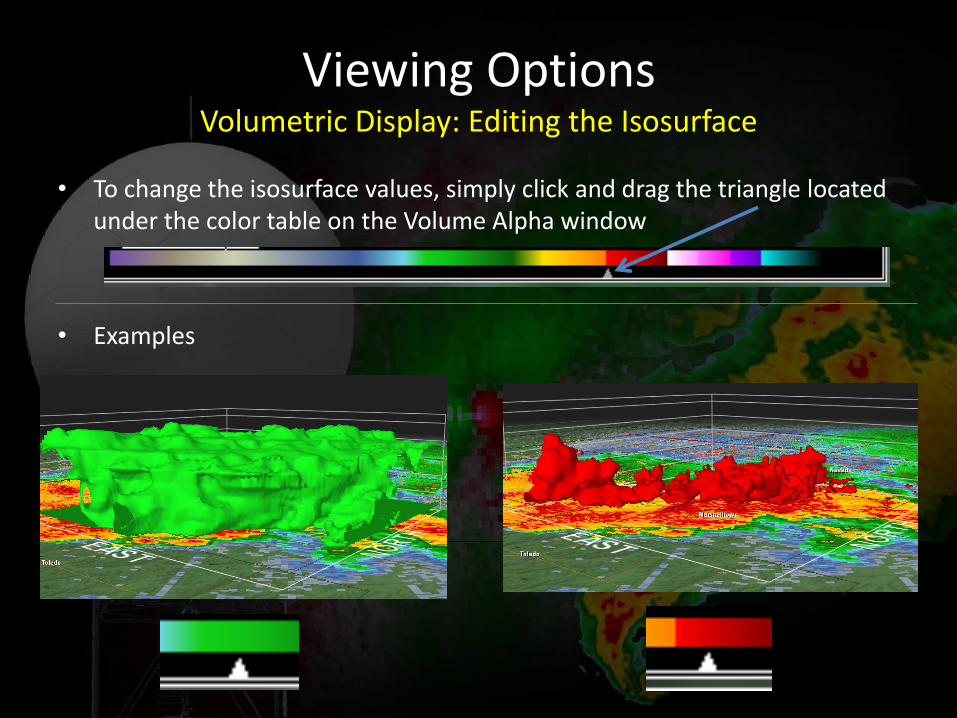
Viewing Options Volumetric Display: Editing the Isosurface
• To change the isosurface values, simply click and drag the triangle located under the color table on the Volume Alpha window
• Examples
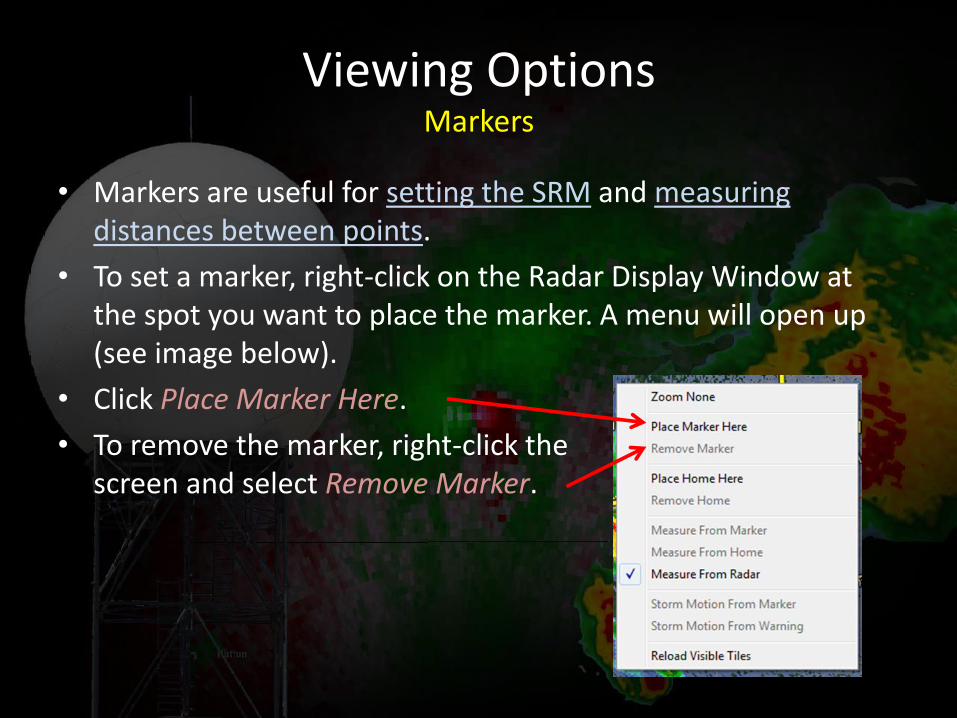
Viewing Options Markers
• Markers are useful for setting the SRM and measuring distances between points.
• To set a marker, right-click on the Radar Display Window at the spot you want to place the marker. A menu will open up (see image below).
• Click Place Marker Here.
• To remove the marker, right-click the screen and select Remove Marker.
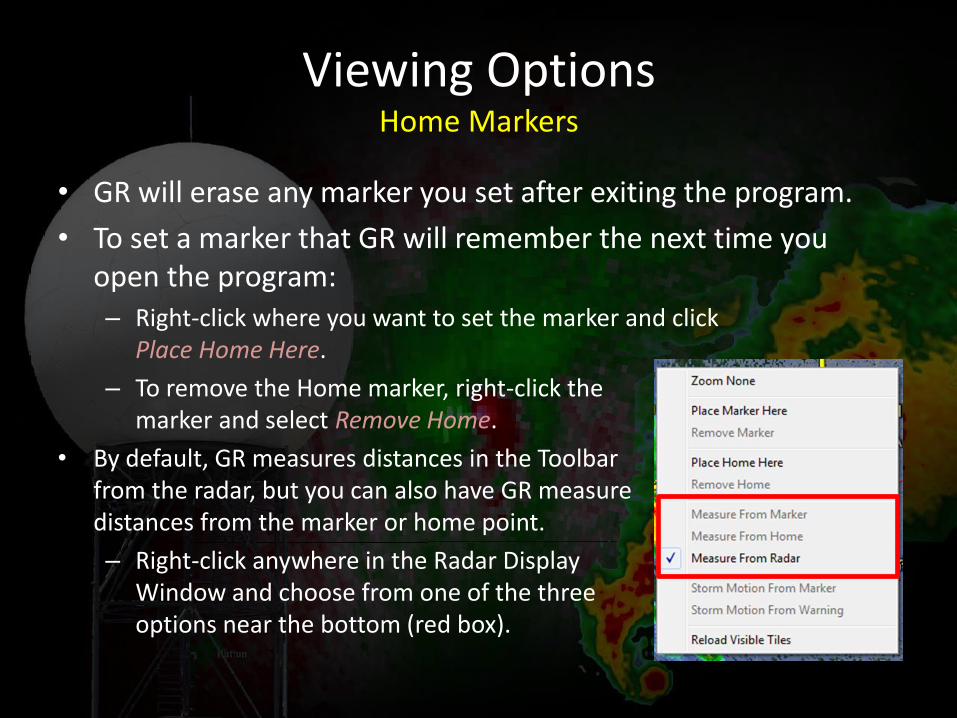
• GR will erase any marker you set after exiting the program.
• To set a marker that GR will remember the next time you open the program: – Right-click where you want to set the marker and click
Place Home Here.
– To remove the Home marker, right-click the marker and select Remove Home.
• By default, GR measures distances in the Toolbar from the radar, but you can also have GR measure distances from the marker or home point.
– Right-click anywhere in the Radar Display Window and choose from one of the three options near the bottom (red box).
Viewing Options Home Markers

Viewing Options Setting Storm Motion for SRM Velocity
• To set the storm motion manually
– Click the icon in the Toolbar.
– A window will pop up allowing you to enter the storm’s motion and speed. (Note: Storm motion should be the direction the storm is COMING from)
• To have GR calculate the storm motion 1. Right-click in the middle of storm (or edge, as long as you are
consistent in step 3) and set a marker there.
2. Advance several frames forward and backward.
3. Right-click on that region of the storm again and in the menu that opens up, select Storm Motion from Marker.

Viewing Options Setting Storm Motion for SRM Velocity (Part 2)
• Go to File -> Save Image—there are two options – Entire Window: Captures the whole screen
– Radar Only: Captures only the Radar Display Window
Saving Images
• To set the storm motion from NWS warnings – Right-click the warning polygon and select
Storm Motion from Warning from the menu that appears
New for
Version
2.20
Viewing Options Misc. Options
• To turn smoothing on and off for certain products, click the button on the Toolbar – To configure smoothing settings, navigate to View -> Smoothing
Settings. In general, these settings don’t need to be changed.
• To turn dealiasing on or off for velocity products, click the button on the Toolbar – To configure dealiasing settings, navigate to View -> Dealias Settings. It
is highly recommended to uncheck the box next to Convert Unresolved to ND. This will force GR to show velocity data even if it can’t dealias it correctly.
• To reload the satellite imagery background, right-click the map and select Reload Visible Tiles.
Back to Table of Contents
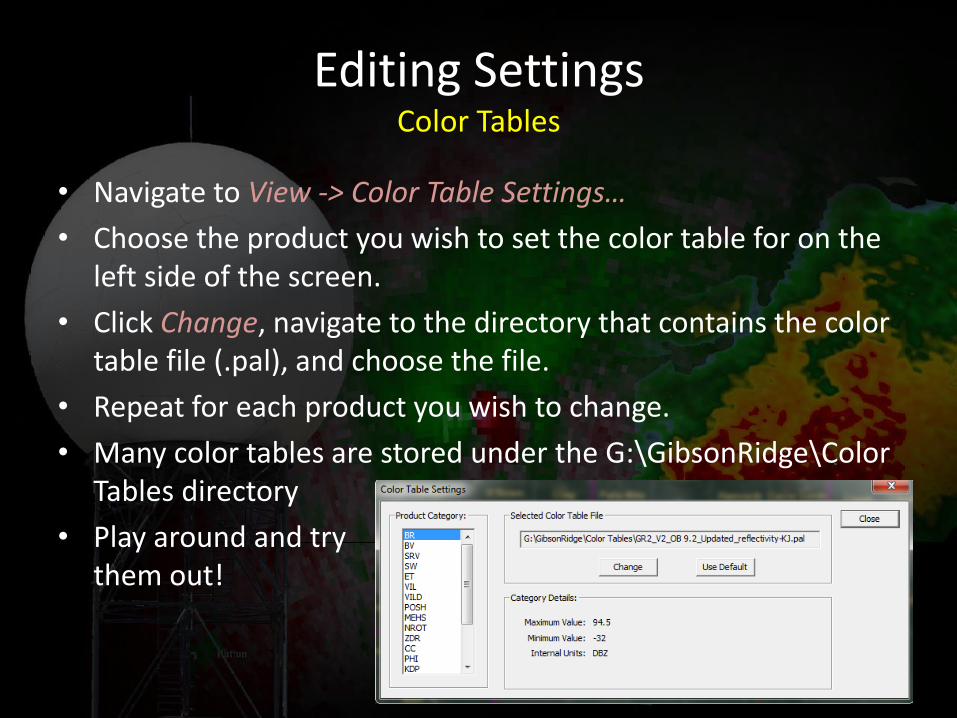
Editing Settings Color Tables
• Navigate to View -> Color Table Settings…
• Choose the product you wish to set the color table for on the left side of the screen.
• Click Change, navigate to the directory that contains the color table file (.pal), and choose the file.
• Repeat for each product you wish to change.
• Many color tables are stored under the G:\GibsonRidge\Color Tables directory
• Play around and try them out!
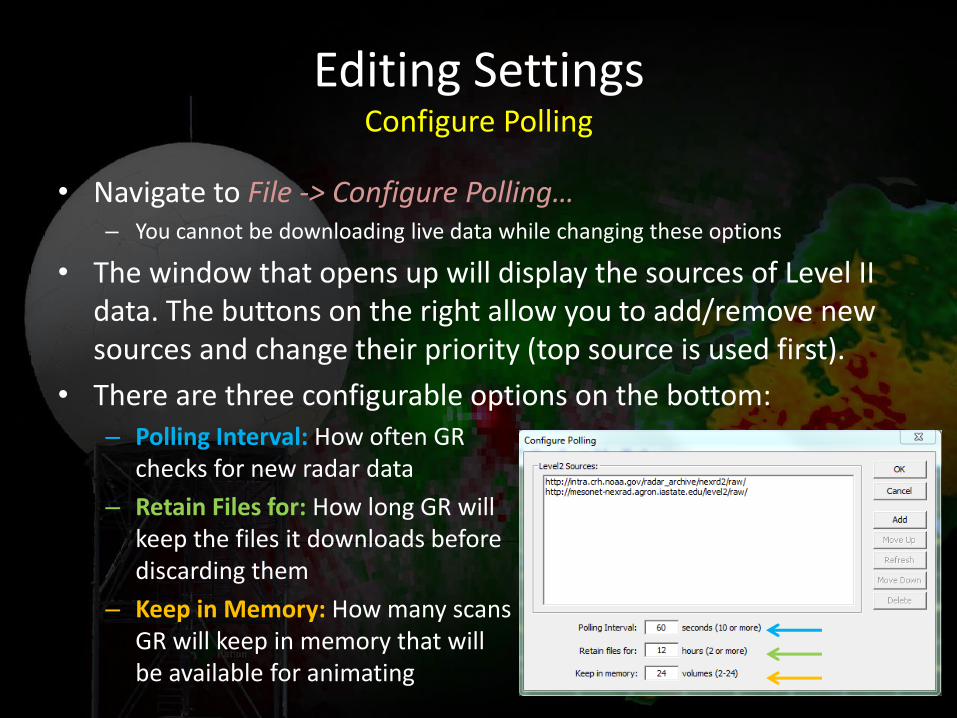
Editing Settings Configure Polling
• Navigate to File -> Configure Polling… – You cannot be downloading live data while changing these options
• The window that opens up will display the sources of Level II data. The buttons on the right allow you to add/remove new sources and change their priority (top source is used first).
• There are three configurable options on the bottom: – Polling Interval: How often GR
checks for new radar data
– Retain Files for: How long GR will keep the files it downloads before discarding them
– Keep in Memory: How many scans GR will keep in memory that will be available for animating
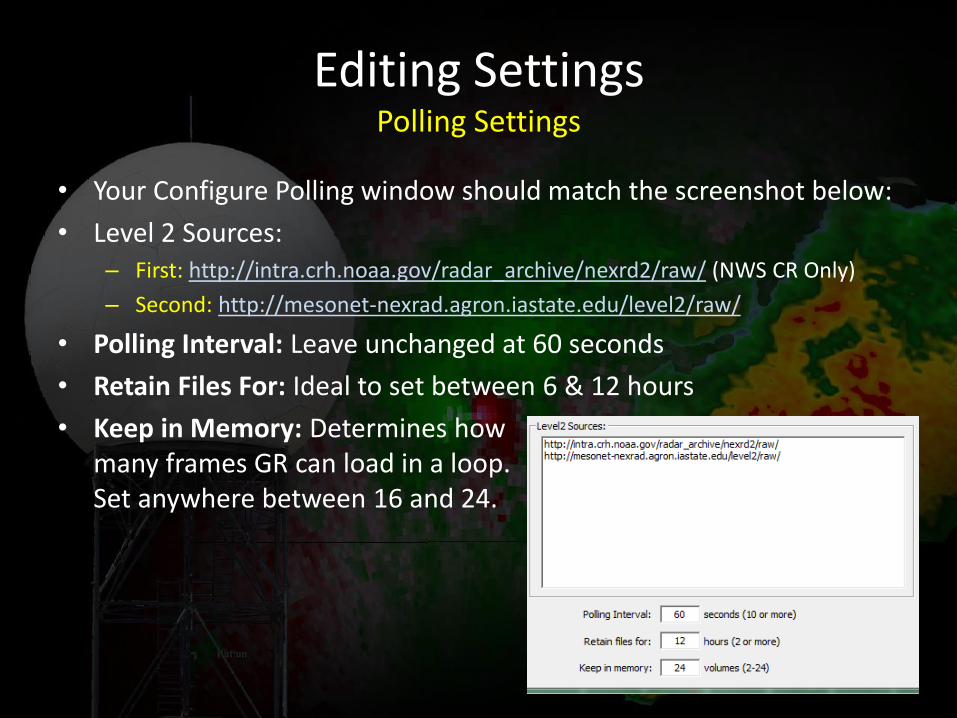
Editing Settings Polling Settings
• Your Configure Polling window should match the screenshot below:
• Level 2 Sources: – First: http://intra.crh.noaa.gov/radar_archive/nexrd2/raw/ (NWS CR Only)
– Second: http://mesonet-nexrad.agron.iastate.edu/level2/raw/
• Polling Interval: Leave unchanged at 60 seconds
• Retain Files For: Ideal to set between 6 & 12 hours
• Keep in Memory: Determines how many frames GR can load in a loop. Set anywhere between 16 and 24.
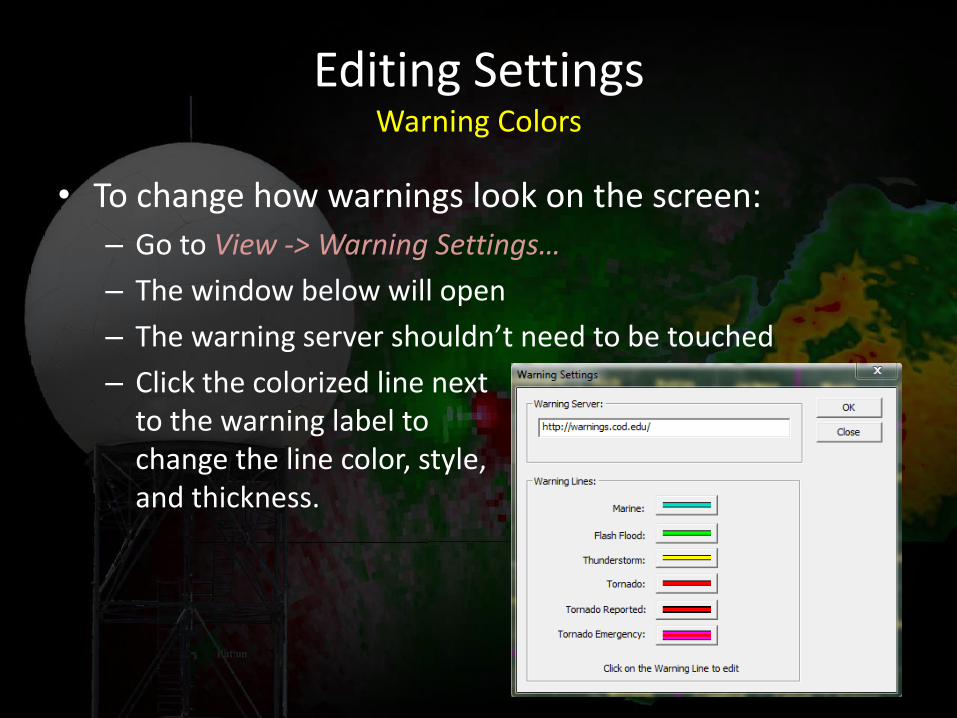
Editing Settings Warning Colors
• To change how warnings look on the screen:
– Go to View -> Warning Settings…
– The window below will open
– The warning server shouldn’t need to be touched
– Click the colorized line next to the warning label to change the line color, style, and thickness.
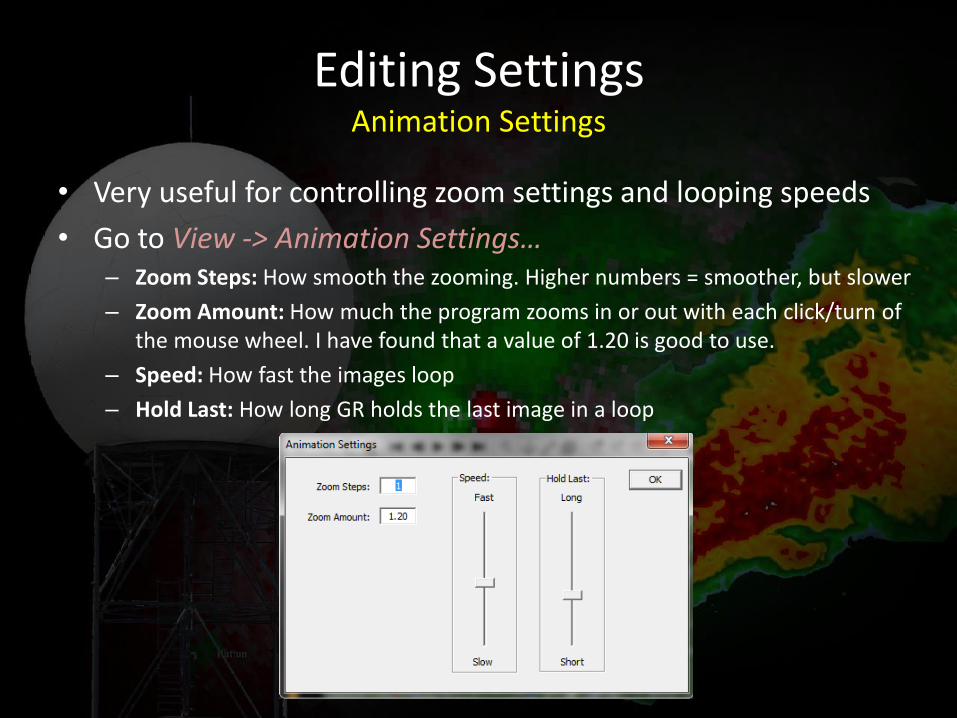
Editing Settings Animation Settings
• Very useful for controlling zoom settings and looping speeds
• Go to View -> Animation Settings… – Zoom Steps: How smooth the zooming. Higher numbers = smoother, but slower
– Zoom Amount: How much the program zooms in or out with each click/turn of the mouse wheel. I have found that a value of 1.20 is good to use.
– Speed: How fast the images loop
– Hold Last: How long GR holds the last image in a loop
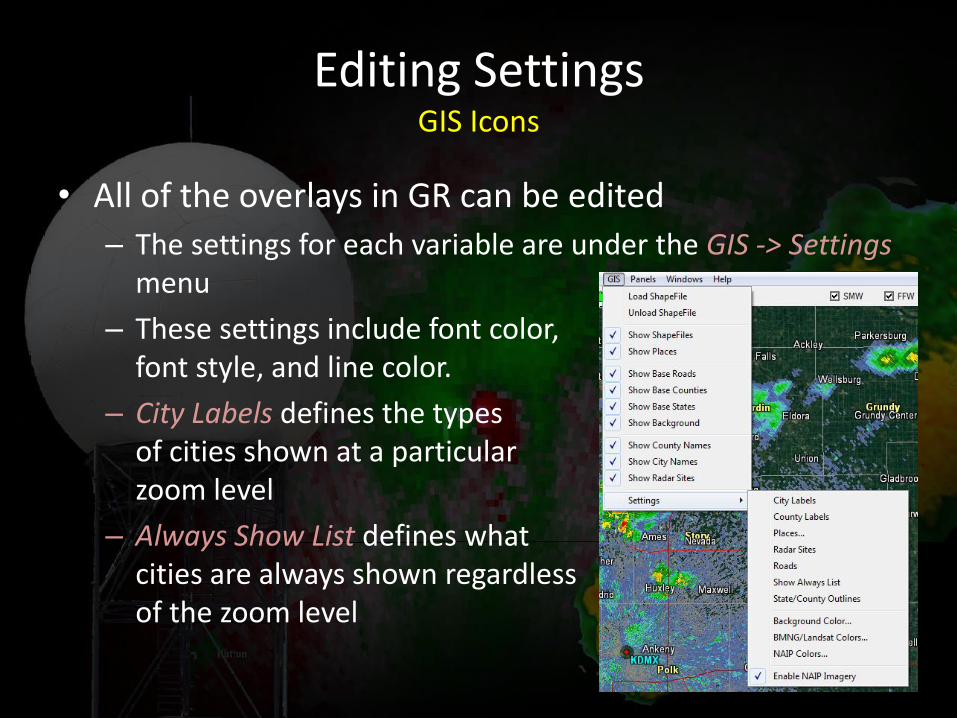
Editing Settings GIS Icons
• All of the overlays in GR can be edited
– The settings for each variable are under the GIS -> Settings menu
– These settings include font color, font style, and line color.
– City Labels defines the types of cities shown at a particular zoom level
– Always Show List defines what cities are always shown regardless of the zoom level

Editing Settings Algorithms
• Changing how GR calculates VIL and Echo Tops
– Algorithms -> Algorithm Settings…
– Max VIL DBZ: Maximum reflectivity to be used in calculating VIL
– Echo Tops DBZ: Lowest reflectivity value to be used in calculate ET
• Changing MDA Threshold Settings
– Algorithms -> MDA Settings…
– Can change the ROT threshold and count at certain ranges from the radar (probably won’t need to change)
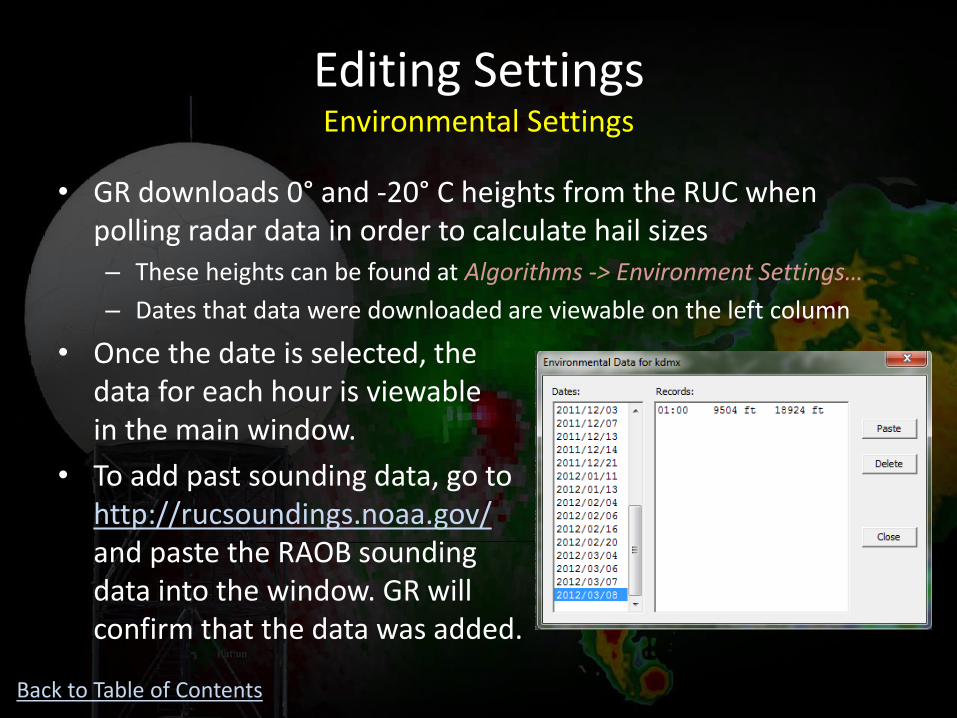
Editing Settings Environmental Settings
• GR downloads 0° and -20° C heights from the RUC when polling radar data in order to calculate hail sizes – These heights can be found at Algorithms -> Environment Settings…
– Dates that data were downloaded are viewable on the left column
• Once the date is selected, the data for each hour is viewable in the main window.
• To add past sounding data, go to http://rucsoundings.noaa.gov/ and paste the RAOB sounding data into the window. GR will confirm that the data was added.
Back to Table of Contents
The End!!!