Embed Size (px)
Citation preview
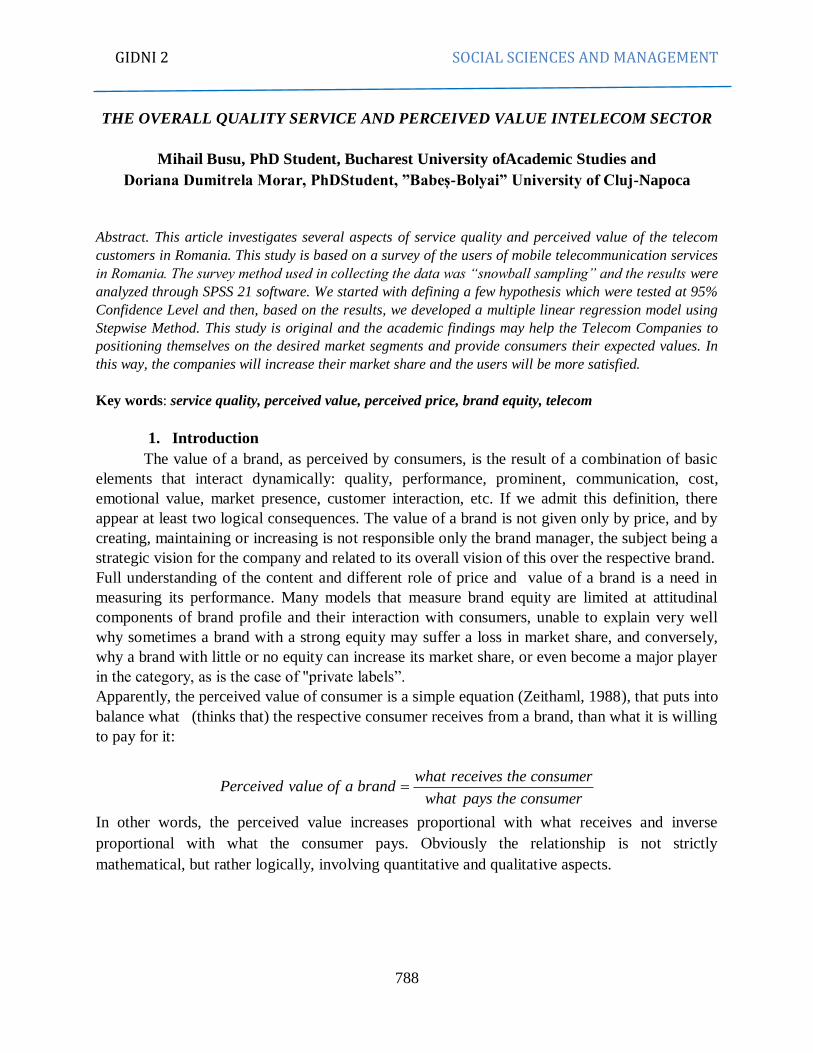
GIDNI 2 SOCIAL SCIENCES AND MANAGEMENT
788
THE OVERALL QUALITY SERVICE AND PERCEIVED VALUE INTELECOM SECTOR
Mihail Busu, PhD Student, Bucharest University ofAcademic Studies and
Doriana Dumitrela Morar, PhDStudent, ”Babeș-Bolyai” University of Cluj-Napoca
Abstract. This article investigates several aspects of service quality and perceived value of the telecom
customers in Romania. This study is based on a survey of the users of mobile telecommunication services
in Romania. The survey method used in collecting the data was ―snowball sampling‖ and the results were
analyzed through SPSS 21 software. We started with defining a few hypothesis which were tested at 95%
Confidence Level and then, based on the results, we developed a multiple linear regression model using
Stepwise Method. This study is original and the academic findings may help the Telecom Companies to
positioning themselves on the desired market segments and provide consumers their expected values. In
this way, the companies will increase their market share and the users will be more satisfied.
Key words: service quality, perceived value, perceived price, brand equity, telecom
1. Introduction
The value of a brand, as perceived by consumers, is the result of a combination of basic
elements that interact dynamically: quality, performance, prominent, communication, cost,
emotional value, market presence, customer interaction, etc. If we admit this definition, there
appear at least two logical consequences. The value of a brand is not given only by price, and by
creating, maintaining or increasing is not responsible only the brand manager, the subject being a
strategic vision for the company and related to its overall vision of this over the respective brand.
Full understanding of the content and different role of price and value of a brand is a need in
measuring its performance. Many models that measure brand equity are limited at attitudinal
components of brand profile and their interaction with consumers, unable to explain very well
why sometimes a brand with a strong equity may suffer a loss in market share, and conversely,
why a brand with little or no equity can increase its market share, or even become a major player
in the category, as is the case of "private labels‖.
Apparently, the perceived value of consumer is a simple equation (Zeithaml, 1988), that puts into
balance what (thinks that) the respective consumer receives from a brand, than what it is willing
to pay for it:
what receives the consumerPerceived value of a brand
what pays the consumer
In other words, the perceived value increases proportional with what receives and inverse
proportional with what the consumer pays. Obviously the relationship is not strictly
mathematical, but rather logically, involving quantitative and qualitative aspects.
GIDNI 2 SOCIAL SCIENCES AND MANAGEMENT
789
2. Brief literature review
The concept of perceived value has become since the last decade of the last century, a
key element in defining the method of developing businesses in most of the worlds developed
economies of the globe.
Thus, the consumer value creation has become a strategic imperative of organizations in
order to build and maintain a competitive advantage over competitors. Over time a number of
definitions of value have been proposed by various authors, of which standing out the one
proposed by Holbrook (1994, 1999), Woodruff (1997) and especially the one proposed by
Zeithaml (1988).
The author proposes four definitions for the concept of value:
1) Value represents a low price;
2) Value represents whatever is desired by consumers in a product;
3) The value represents the quality obtained for the price paid;
4) Value represents what is obtained for what is offered.
Zeithaml (1988) believes that the last definition proposed- the compromise between what is
sacrificed in exchange for what is obtained- as best suited for the concept of perceived value.
Note that the last definition is adopted by many other studies in the field value.
The conceptual model proposed by Zeithaml (1988) involves establishing a hierarchy of
variables according to their level of abstraction, providing an overview of established relations
between the concepts - perceived price, perceived quality respectively perceived value.
According to this model, consumers evaluate products and services based on their perceptions
about price, quality and value, rather than on the base of some objective attributes - real price or
real quality (Sanchez-Fernandez & Iniesta-Bonillo, 2007).
More and more companies now base their price on customer‘s perceived value. Firms
must provide the value they promised by the valuable proposal made to the market, and the
customer must perceive this value. Therefore, they use the other elements of the marketing mix,
such as advertising and sales force to communicate and improve the perceived value in the minds
of buyers (Tung-Zong Chang and Albert R. Wildt, 1993).
Perceived value consists of several elements, such as the image which the buyer's makes
about the performance of the product / service, the things that the channel of distribution needs to
provide, quality guarantee, customer support for the client and a set of abstract attributes, such as
supplier's reputation, seriousness and the respect they enjoy. Moreover, each potential client
attaches importance differently to those elements, the result being that some of them will be
become buyers. Even when a company claims that its offer provides more overall value, not all
customers will respond positively. There will always be a segment of buyers who do not care
about price. There are also buyers who suspect that the company exaggerates about the product
quality and its services.
The basic condition in establishing the price based on perceived value is to provide more
value than competitors and to demonstrate this to their potential buyers. In principle, the
company must study the factors that influence customer perception of value and understand the
customer‘s decisional process. The company may seek to determine the perceived value of its
GIDNI 2 SOCIAL SCIENCES AND MANAGEMENT
790
offer on several ways: internal managerial assessments, compared to similar products value,
research through focus groups, surveys, experimentation, analysis of past data and combined
analysis. (James C. Anderson, Dipak C. Jain, and Pradeep K. Chintagunta, 1993).
Value perceived by customers is treated as a single general concept, and value perceptions of
individuals can be measured and evaluated using a single measurement variable (or set of
variables closely related) (Dodds & Monroe, 1985; Monroe & Chapman, 1987; Zeithaml, 1988,
Dodds et al., 1991, Bolton & Drew, 1991; Spreng et al., 1993, Lapierre et al., 1999, Sweeny et
al., 1999; Agarwal & Teas, 2001, 2002).
Also, this perspective offers the possibility of inclusion of multiple antecedents of value,
but the concept itself is treated as one-dimensional form, being excluded the idea that it can
actually be formed by aggregating several distinct components (Sanchez-Fernandez & Iniesta-
Bonillo, 2007). Meanwhile, one-dimensional approaches of the concept of perceived value is the
starting point like the first stage of research of this concept.
According to one-dimensional research studies of value, this is treated from a utilitarian
perspective, economic and rational thinking of consumers being used to assess the benefits and
sacrifices relevant for consumption situations (Sanchez-Fernandez & Iniesta-Bonillo, 2007). One
of the first studies addressing quality-price relationship and its influence on value is realized by
Dodds and Monroe (1985). They are trying to study the impact of odd and even prices.
In order to achieve the objective proposed, those authors consider that the impact of odd or even
price on purchase intention is not a direct one, but is mediated by the concept of quality and
value perceived by consumers. Thus, a price increase will reflect by changing consumer
perceptions on product quality and service in the sense that the quality of the objective will
increase too. At the same time, a price increase will have a negative impact over objective value
concerned, consumers feeling an increase or decrease of it.
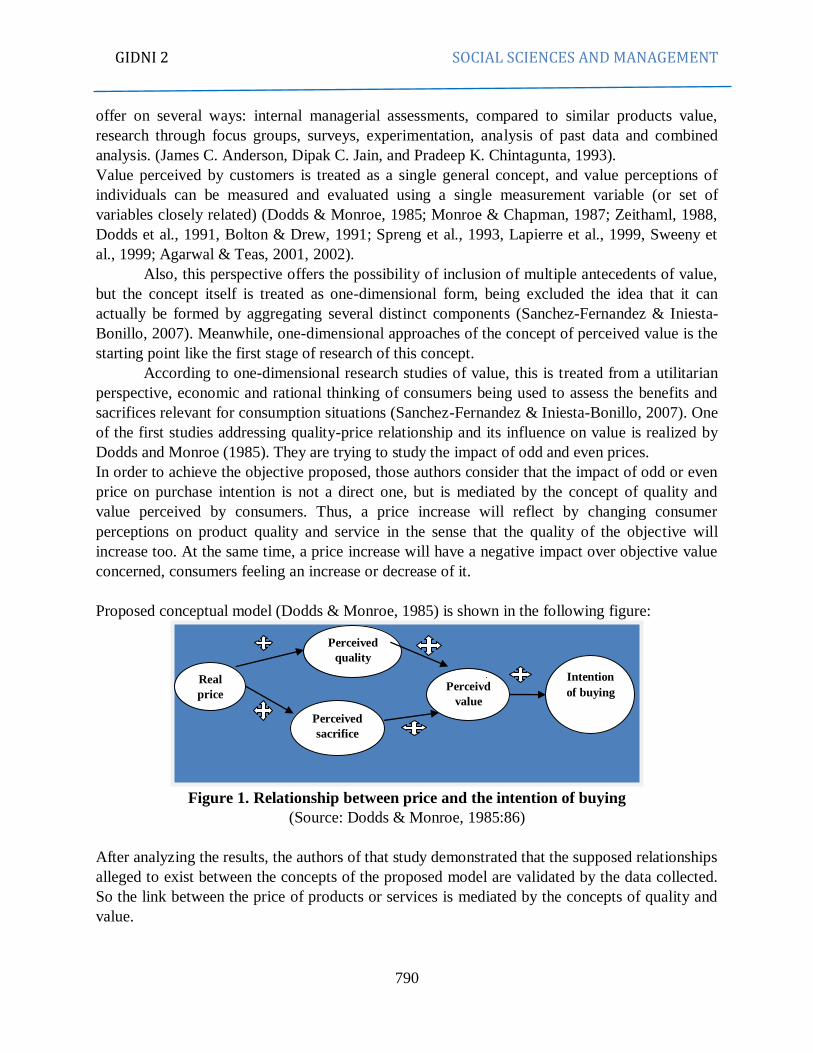
Proposed conceptual model (Dodds & Monroe, 1985) is shown in the following figure:
Figure 1. Relationship between price and the intention of buying
(Source: Dodds & Monroe, 1985:86)
After analyzing the results, the authors of that study demonstrated that the supposed relationships
alleged to exist between the concepts of the proposed model are validated by the data collected.
So the link between the price of products or services is mediated by the concepts of quality and
value.
Perceived
quality
Intention
of buying Real
price
Perceived
sacrifice
Perceivd
value
GIDNI 2 SOCIAL SCIENCES AND MANAGEMENT
791
After a short review of the literature in the field, we have been able to notice that the
quality of services is based on different conceptual models, this quality being analysed from the
perspective of consumers‘ expectations and perceptions on services (Morar & Plăiaș, 2014, p.
14). Thus, representatives of the North American School, Parasuraman, Zeithaml and Berry
(PBZ), support the idea of conceptualization and operationalization of service quality powered
by perceptions on service performance and consumer expectations.
―The quality of service as perceived by consumers can be defined as the size of the gap
between consumers‘ expectations or desires and their perceptions‖. (Zeithaml et al., 1990, p. 19)
The main supporters of this perspective are: Busu (2015), Gronroos (1991), Lewis
(1991), Mangold & Babakus (1991), Busu et al. (2015), Oliver (1993, 2010) cited in Radomir
(2013, p. 9). Summarizing what has been said, the aforementioned authors suggest the existence
of a comparison standard for assessing service quality.
Concerning the research studies on telecommunications services, we have identified
several papers about the users of these services. Bayer, J. (2010) conducted a study in which he
divided customers in four segments: Customer Value Segmentation, Customer Behaviour
Segmentation, Customer Life Cycle Segmentation and Customer Migration Segmentation.
According to him, mobile network operators have understood the importance of segmentation
and tried to make every customer be part of a micro-segment. The author has also understood
that there is something else in addition, besides the standard segmentation: consumers who have
a subscription or a card, such as consumer versus business. Using an advanced segmentation,
both customers and business have the chance to win: customers receive what they want at the
right time while company‘s profitability increases (Bayer, J., 2010, p. 256). He & Li (2011) have
also studied how the quality of mobile services in Taiwan influences holistic perception of
service quality, the perceived value and brand equity.
After analysing the proposed model, He & Li (2011) have concluded that the dimensions
of a service do have different effect on service quality and on the value perceived by customers.
According to them, the functional aspects of services (network quality and reliability), such as
staff empathy and faith, are significant factors for the overall quality of services, all these leading
to a stronger brand equity (He & Li, 2011, p.95). In addition, the cited authors have surprised the
partial effect of the value perceived in the relationship between service quality and brand equity.
A recent case study on Romanian telecom market was done by (Mihail, 2014), in which
the author evaluated the concentration degree in Telecom Sector. The case study presented in his
paper analyzed the mobile market in Romania compared to that corresponding to the other
European Union Member States. Although the Connected Continent Package adopted by the
European Commission did not involve the regulation issues, it provides a series of incentives for
increasing investments as well as consumer protection. The author also brought into focus the
last legislative developments, coupled with the current economic context specific to Romanian
mobile market.
In another study, the authors (Băcilă & Rădulescu, 2014), have identified eight segments
of customers of telecom enterprises with different behaviours. By knowing these aspects, the
company may create differentiated marketing strategies according to certain criterions describing
consumer buying behaviour, for example the RFM customer value: recency, frequency and
monetary value (Băcilă, Rădulescu, 2014, p. 49).
GIDNI 2 SOCIAL SCIENCES AND MANAGEMENT
792
3. Methodology
The aim of this study is to investigate the relationship between the quality perceived by
mobile services consumers in Romania and the price.
The data analysed in the present paper are part of an online questionnaire administrated
by means of the web page: www.isondaje.ro. These data were collected on the basis of a study
conducted between December 2014 and February 2015 among mobile services consumers in
Romania.
Due to the fact that the random survey or probabilistic sampling supposes the existence of
a complete frame (Pop, 2004; Buiga, 2008), in the present research work we appeal to the non-
probability sampling method namely the snowball sampling method because the authors could
not been able to access an exhaustive list of statistical units. Among the persons having received
the questionnaire, only 260 of them answered. Using the snowball sampling method, we could
not been able to calculate the success rate; however, considering our main purpose consisting in
generalizing the results to the entire population, our decision to use the mentioned method is
based on the opinion of other statisticians, such as Bell and Bryman (2007). The named
researchers consider that the sheer size of a sample is more important that its relative size
reported to the entire researched population. Afifi and Clark (1990) believe that the number of
questionnaires should be between 5 and 10 times greater than the number of the questions, thus
reducing the response errors. In the case of our analysis, this ratio is of 8.67 times greater
(260/30), result which fits with the range indicated by the two famous statisticians.
Demographic features taken into consideration and included in the present paper are
linked to: gender, education, age, income of consumers as well as the dimensions of mobile
operators they are using, the type of mobile service and the number of minutes used in the
network (see Table 1).
GIDNI 2 SOCIAL SCIENCES AND MANAGEMENT
793
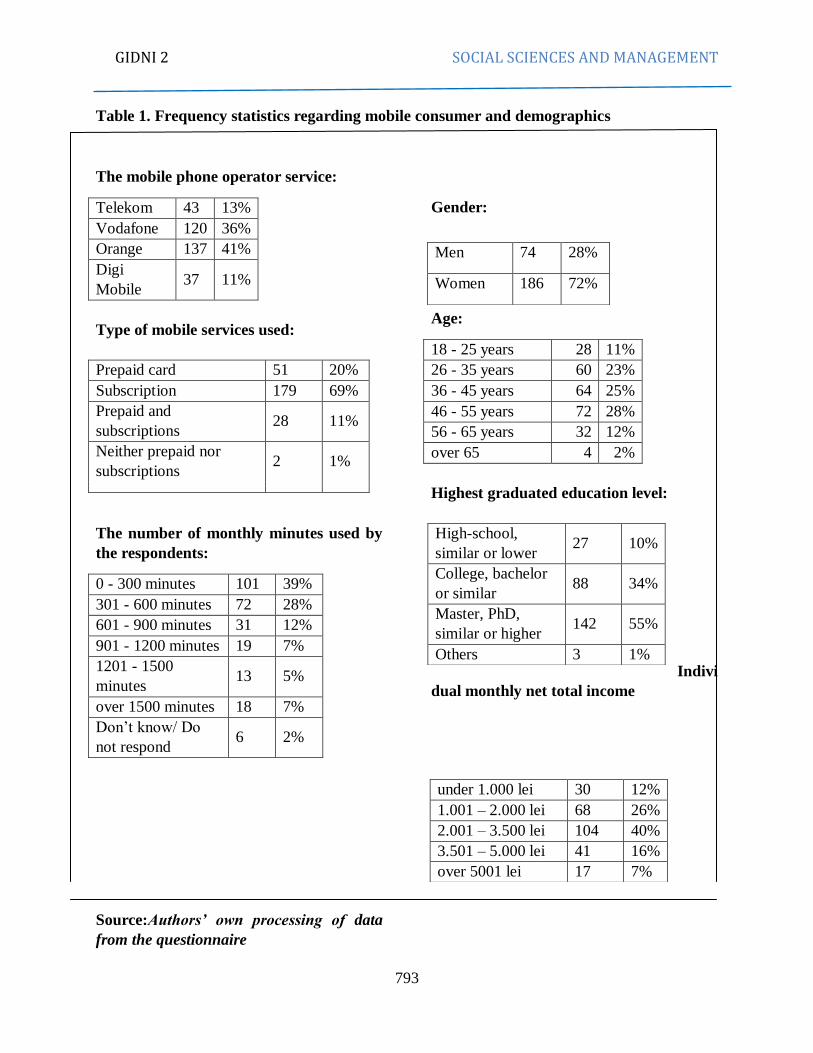
Table 1. Frequency statistics regarding mobile consumer and demographics
The mobile phone operator service:
Telekom 43 13%
Vodafone 120 36%
Orange 137 41%
Digi
Mobile 37 11%
Type of mobile services used:
Prepaid card 51 20%
Subscription 179 69%
Prepaid and
subscriptions 28 11%
Neither prepaid nor
subscriptions 2 1%
The number of monthly minutes used by
the respondents:
0 - 300 minutes 101 39%
301 - 600 minutes 72 28%
601 - 900 minutes 31 12%
901 - 1200 minutes 19 7%
1201 - 1500
minutes 13 5%
over 1500 minutes 18 7%
Don‘t know/ Do
not respond 6 2%
Source:Authors‘ own processing of data
from the questionnaire
Gender:
Age:
18 - 25 years 28 11%
26 - 35 years 60 23%
36 - 45 years 64 25%
46 - 55 years 72 28%
56 - 65 years 32 12%
over 65 4 2%
Highest graduated education level:
Indivi
dual monthly net total income
under 1.000 lei 30 12%
1.001 – 2.000 lei 68 26%
2.001 – 3.500 lei 104 40%
3.501 – 5.000 lei 41 16%
over 5001 lei 17 7%
Men 74 28%
Women 186 72%
High-school,
similar or lower 27 10%
College, bachelor
or similar 88 34%
Master, PhD,
similar or higher 142 55%
Others 3 1%
GIDNI 2 SOCIAL SCIENCES AND MANAGEMENT
794
The aim of this paper as well as the objectives of the research derives from the formulation of
the following hypotheses:
H1.There are significant differences between the importance of service quality and the level
of tariffs.
H2 [(a,b,c)]: There are significant differences between the importance of the three variables
[(a) its customers migrate to other mobile operator / (b) the operator applies differential
pricing to its customers / (c) the operator allows the negotiation of prices for its services as
regards to the fairness of a mobile operator toward its customers].
H3. Mobile operators apply abusive prices to their customers.
4. Results and discussion
Statistical hypotheses enounced in the Methodology section were tested by using Statistical
Hypotheses Testing Method by means of SPSS 21 Program.To verify this hypothesis, we will
use the Statistical Hypotheses Testing Method for the difference of averages of two
independent variables.
Firstly, we will formulate two related statistical assumptions:
H0: There are not significant differences between the importance of service quality and the
level of tariffs.
H1: There are significant differences between the importance of service quality and the level
of tariffs.
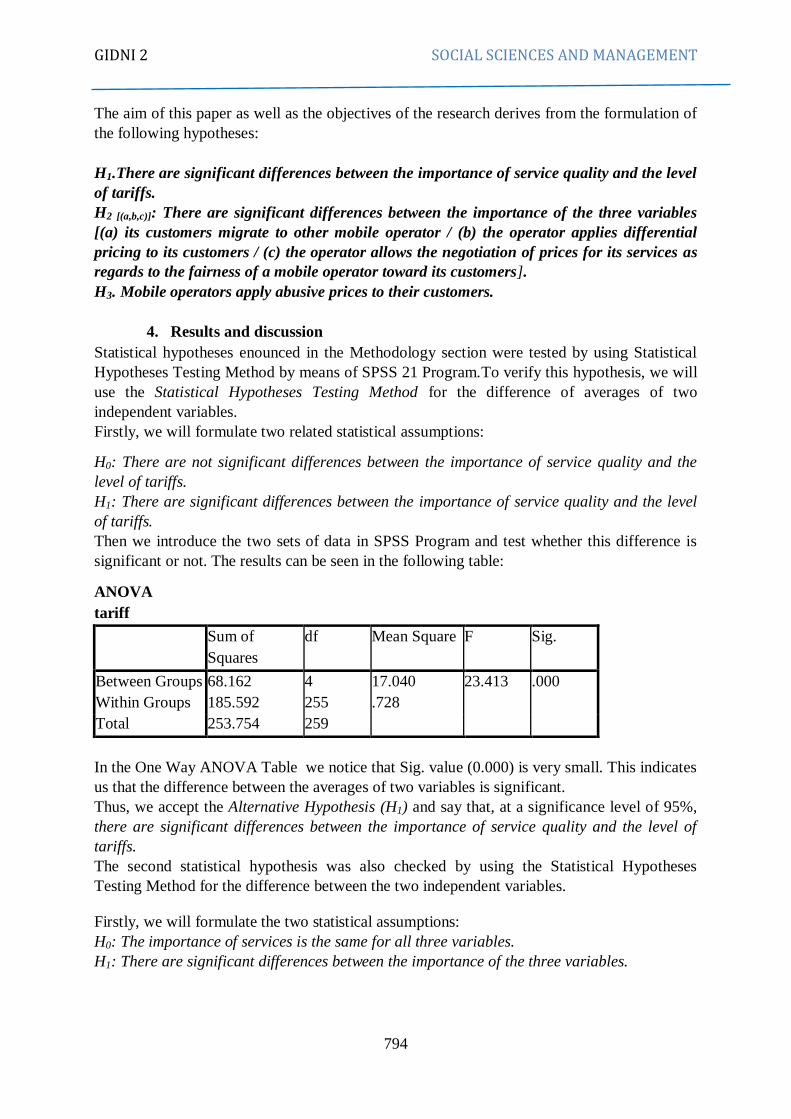
Then we introduce the two sets of data in SPSS Program and test whether this difference is
significant or not. The results can be seen in the following table:
ANOVA
tariff
Sum of
Squares
df Mean Square F Sig.
Between Groups 68.162 4 17.040 23.413 .000
Within Groups 185.592 255 .728
Total 253.754 259
In the One Way ANOVA Table we notice that Sig. value (0.000) is very small. This indicates
us that the difference between the averages of two variables is significant.
Thus, we accept the Alternative Hypothesis (H1) and say that, at a significance level of 95%,
there are significant differences between the importance of service quality and the level of
tariffs.
The second statistical hypothesis was also checked by using the Statistical Hypotheses
Testing Method for the difference between the two independent variables.
Firstly, we will formulate the two statistical assumptions:
H0: The importance of services is the same for all three variables.
H1: There are significant differences between the importance of the three variables.
GIDNI 2 SOCIAL SCIENCES AND MANAGEMENT
795
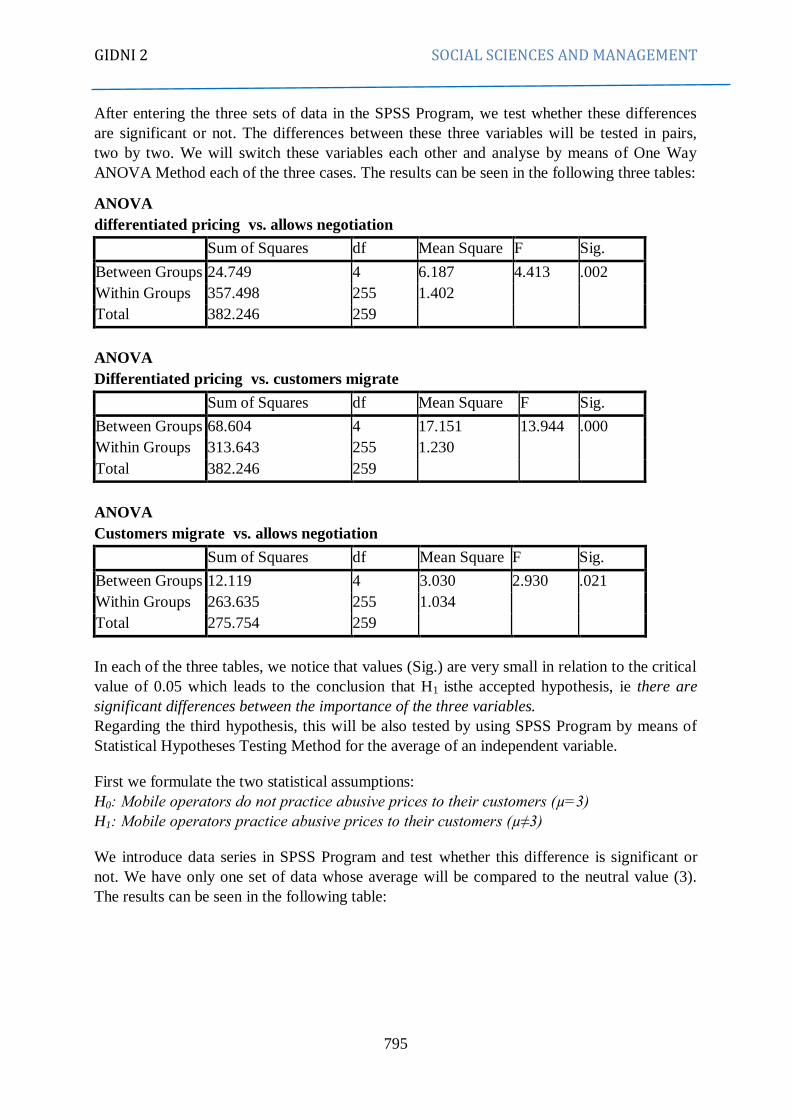
After entering the three sets of data in the SPSS Program, we test whether these differences
are significant or not. The differences between these three variables will be tested in pairs,
two by two. We will switch these variables each other and analyse by means of One Way
ANOVA Method each of the three cases. The results can be seen in the following three tables:
ANOVA
differentiated pricing vs. allows negotiation
Sum of Squares df Mean Square F Sig.
Between Groups 24.749 4 6.187 4.413 .002
Within Groups 357.498 255 1.402
Total 382.246 259
ANOVA
Differentiated pricing vs. customers migrate
Sum of Squares df Mean Square F Sig.
Between Groups 68.604 4 17.151 13.944 .000
Within Groups 313.643 255 1.230
Total 382.246 259
ANOVA
Customers migrate vs. allows negotiation
Sum of Squares df Mean Square F Sig.
Between Groups 12.119 4 3.030 2.930 .021
Within Groups 263.635 255 1.034
Total 275.754 259
In each of the three tables, we notice that values (Sig.) are very small in relation to the critical
value of 0.05 which leads to the conclusion that H1 isthe accepted hypothesis, ie there are
significant differences between the importance of the three variables.
Regarding the third hypothesis, this will be also tested by using SPSS Program by means of
Statistical Hypotheses Testing Method for the average of an independent variable.
First we formulate the two statistical assumptions:
H0: Mobile operators do not practice abusive prices to their customers (µ=3)
H1: Mobile operators practice abusive prices to their customers (µ≠3)
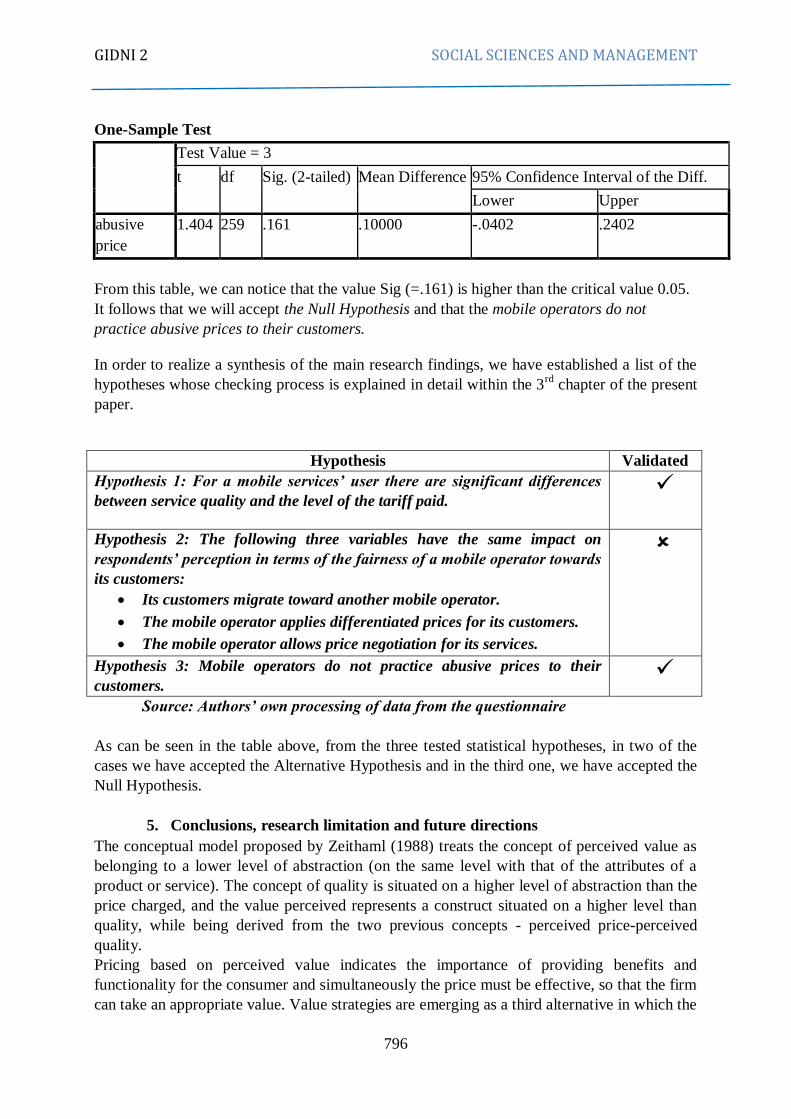
We introduce data series in SPSS Program and test whether this difference is significant or
not. We have only one set of data whose average will be compared to the neutral value (3).
The results can be seen in the following table:
GIDNI 2 SOCIAL SCIENCES AND MANAGEMENT
796
One-Sample Test
Test Value = 3
t df Sig. (2-tailed) Mean Difference 95% Confidence Interval of the Diff.
Lower Upper
abusive
price
1.404 259 .161 .10000 -.0402 .2402
From this table, we can notice that the value Sig (=.161) is higher than the critical value 0.05.
It follows that we will accept the Null Hypothesis and that the mobile operators do not
practice abusive prices to their customers.
In order to realize a synthesis of the main research findings, we have established a list of the
hypotheses whose checking process is explained in detail within the 3rd
chapter of the present
paper.
Hypothesis Validated
Hypothesis 1: For a mobile services‘ user there are significant differences
between service quality and the level of the tariff paid.
Hypothesis 2: The following three variables have the same impact on
respondents‘ perception in terms of the fairness of a mobile operator towards
its customers:
Its customers migrate toward another mobile operator.
The mobile operator applies differentiated prices for its customers.
The mobile operator allows price negotiation for its services.
Hypothesis 3: Mobile operators do not practice abusive prices to their
customers.
Source: Authors‘ own processing of data from the questionnaire
As can be seen in the table above, from the three tested statistical hypotheses, in two of the
cases we have accepted the Alternative Hypothesis and in the third one, we have accepted the
Null Hypothesis.
5. Conclusions, research limitation and future directions
The conceptual model proposed by Zeithaml (1988) treats the concept of perceived value as
belonging to a lower level of abstraction (on the same level with that of the attributes of a
product or service). The concept of quality is situated on a higher level of abstraction than the
price charged, and the value perceived represents a construct situated on a higher level than
quality, while being derived from the two previous concepts - perceived price-perceived
quality.
Pricing based on perceived value indicates the importance of providing benefits and
functionality for the consumer and simultaneously the price must be effective, so that the firm
can take an appropriate value. Value strategies are emerging as a third alternative in which the
GIDNI 2 SOCIAL SCIENCES AND MANAGEMENT
797
company is trying to acquire the best price, with due regard to the fact that consumers can get
a fair surplus.
The main conclusions resulting from the validation/invalidation of the above mentioned
hypotheses are the following ones:
i. Users of mobile services perceive differently the service quality and the level of the
tariff paid. Specifically for them, the qualitative aspect of service is more important
than the one linked to the price.
ii. The impact of the three variables tested by means of Hypothesis 2, namely: ―its
customers migrate toward another operator‖, ―mobile operator applies differentiated
prices to its customers‖ and ―mobile operator allows the negotiation of prices for its
services‖ is different for mobile services users in Romania. Perceived value is not
uniform among respondents. If some of them consider that the migration of a user to
another operator is due largely to the incorrectness of the operator toward its
customers, there are other respondents considering that this might be due to
differentiated prices applied by the operator or to the fact that the operator itself allows
or not the negotiation of tariff.
iii. Customers of mobile telecommunications companies do not believe that operators‘
prices would be unfair. This means that there is a high degree of satisfaction with
respect to the offered services.
In terms of the practical part of the research paper, by means of the effected tests, we have
been able to notice a uniform continuity of answers coming from the respondents presenting
the same similarities. The results of applying managerial strategies are highlighted by
quantifying the effects on customers from the telecom sector. Market evolution indicates
implicitly the necessity of accumulating investments in research and innovation area. A major
managerial objective for the enterprises operating in telecom sector should be represented by
the investment process. From this perspective, any investment project of a company is
conditioned in terms of the decision-making process, by the ability to ensure funding sources
for the activities in the field of research and innovation.
The main limitation of the study is linked to the way of realising the sampling process. First
of all, due to the lack of a sampling frame, we have used a non-probability sampling method,
the snowball method, which decreases the representativeness of the sampling. Another
limitation of the paper is related to the financial part and to respondents‘ unavailability, this
leading to a reduced number of completed questionnaires.
As future research directions, we plan to do a more detailed analysis on each geographic
region of the country which will give us an opportunity to analyse whether the satisfaction
degree of mobile services users varies from one region to another. Moreover, we wish to
realize a marketing research for pursuing the relationship between customers‘ personal values
or that of the potential ones as well as the assessment of the extent corresponding to the
perceived value by telecom customers.
GIDNI 2 SOCIAL SCIENCES AND MANAGEMENT
798
Acknowledgement: This work was cofinanced from the European Social Fund through Sectoral
Operational Programme Human Resources Development 2007-2013, project number
POSDRU/159/1.5/S/142115 „Performance and excellence in doctoral and postdoctoral research in
Romanian economics science domain‖.
REFERENCES:
1. Afifi, A. A., & Clark, V. (1990). Computer-Aided Multivariate Analysis. Van
Nostrand–Reinhold. New York, 234-236.
2. Agarwal, S., & Teas, R. (2002). Cross National Applicability of a Perceived Quality
Model. 11 (4-5), 36-213.
3. Anderson, J. C., Jain, D. C., & Chintagunta, P. K. (1992). Customer value assessment
in business markets: A state-of-practice study. Journal of Business-to-Business
Marketing, 1(1), 3-29.
4. Bacila, M. F., & Radulescu, A. (2014). Telecom Market Segmentation Using the K-
mean Algorithm and the Recency, Frequency and Monetary Value. Marketing From
Information to Decision, (7), 40-51.
5. Bayer, J. (2010). Customer segmentation in the telecommunications industry. Journal
of Database Marketing & Customer Strategy Management, 17, 247 – 256. Doi:
10.1057/dbm.2010.21.
6. Bell, E., & Bryman, A. (2007). The ethics of management research: an exploratory
content analysis. British Journal of Management, 18(1), 63-77.
7. Bolton, N. R., & Drew, H. (1991). A multistage model of customers' assessments of
service quality and value. Journal of Consumer Research , 17 (March), 375-384
8. Buiga, A. (2008). ‖Tehnici de eșantionare neprobabiliste‖, pp. 435-446. În Plăiaș, I.
(Ed). Cercetări de marketing, Risoprint, Cluj-Napoca.
9. Busu, M. (2015). Corporate Governance Codes in Romania and European Union Countries, Review of International Comparative Management, 16 (1), 119-128.
10. Busu, C., Busu, M., Dragoi, M., Popa, I., Dobrin, C., & Giurgiu, A. (2015). Dissipative
Advertising In Retail Markets. Economic Computation And Economic Cybernetics Studies And Research, 49(2), 57-69.
11. Dodds, W. B., & Monroe, K. B. (1985). The Effect of Brand and Price Information on
Subjective Product Evaluations. 12, 85-90.
12. Dodds, W., Monroe, K., & Grewal, D. (1991). Effects of price, brand, and store
information on buyers' product evaluation. Journal of Marketing Research , 28
(August), 307-319.
13. Fornwell, C. (1992). A national customer satisfaction barometer: The Swedish
experience. The Journal of Marketing, 6-21.
14. He, H., Li, Y. (2011). Key service drivers for high-tech service brand equity: The
mediating role of overall service quality and perceived value. Journal of Marketing
Management, Vol. 27, Nos. 1–2, pp. 77–99, DOI: 10.1080/0267257X.2010.495276.
15. Holbrook, M. (1999). Consumer value - A framework for analysis and research.
London; New York: Routledge.

GIDNI 2 SOCIAL SCIENCES AND MANAGEMENT
799
16. James C. Anderson, Dipak C. Jain și Pradeep K. Chintagunta, „Customer Value
Assessment in Business Markets: A State-of-Practice Study―, Journal of Business-to-
Business Marketing 1, no. 1 (1993): pp. 3-29.
17. Lapierre, J. (1997). What does value mean in business-to-business professional
services? International Journal of Service Industry Management, 8 (5), 377-397.
18. Lee, J., Lee, J., & Feick, L. (2001). The impact of switching costs on the customer
satisfaction-loyalty link: mobile phone service in France. Journal of services
marketing, 15(1), 35-48.
19. Mihail, B. U. Ş. U. (2014). How Concentrated Is The Romanian Mobile Market? SEA-
Practical Application of Science, (4), 473-482.
20. Monroe, K., & Chapman, J. (1987). Framing Effects on Buyers' Subjective Product
Evaluations. 14 (1), 7-193.
21. Morar D., Plăiaș I. (2014). A possible model for measuring service quality in the
hospitality industry. International Conference Communication, Context,
Interdisciplinarity, Section: Economy and Management, 3rd
Ed., Tirgu-Mureș, ‖Petru
Maior‖ University Press, 12-23.
22. Pop, M. D. (2004). ‖Marketing Research‖. Alma-Mater, Cluj-Napoca.
23. Radomir, L. (2013), The quality of the banking services – Perception and Impact on
client – bank relationship, first edition, Risoprint Edition, Cluj-Napoca.
24. Sanchez-Fernandez, R., & Iniesta-Bonillo, A. (2007). The concept of perceived value:
a systematic review of the research. Marketing Theory, 7 (4), 427-451.
25. Shaw M. - ,,Positioning and price: merging theory, strategy and tactics‘‘,Hospitality
Research Journal, 15,1992;
26. Sweeney, C. J., Soutar, N. G., & Johnson, W. L. (1999). The role of perceived risk in
the quality-value relationship: A study in the retail environment. Journal of Retailing,
75 (1), 77-105.
27. Tung-Zong Chang & Albert R. Wildt, „Price, Product Information, and Purchase
Intention: An Empirical Study―, Journal of the Academy of Marketing Science, winter
1994, pp. 16-27. See G. Dean Kortge and Patrick A. Okonkwo, „Perceived Value
Approach to Pricing―, Industrial Marketing Management, May 1993, pp. 133-40.
28. Woodruff, R. (1997). Customer value: The next source for competitive advantage.
Journal of the Academy of Marketing Science , 25 (2), 139-153.
29. Zeithaml, V. A., Parasuraman, A & Berry, L. (1990). Delivering Quality Service:
Balancing Customer Perceptions and Expectations, The Free Pres, New York, New
York.
30. Zeithaml, V. (1988). Consumer Perceptions of Price, Quality, and Value: A Means-
End Model and Synthesis of Evidence. Journal of Marketing, 52, 2-22.