Embed Size (px)
Citation preview
6
ISM
ImLtSssew
Gifted Child QuarterlyVolume 51 Number 1
Winter 2007 64-81© 2007 National Association for
Gifted Children
http://gcq.sagepub.comhosted at
http://online.sagepub.com
nvestigating the Influence of Attributiontyles on the Development ofathematical Talent
Petri NokelainenUniversity of Tampere, Finland
Kirsi TirriUniversity of Helsinki, Finland
Hanna-Leena Merenti-VälimäkiEspoo-Vantaa Institute of Technology, Finland
4
Putting the Research to Use: It is essential that educators and parents understand the influence of bution styles on the development of mathematical talent. This study provides understanding of howerately, and mildly mathematically gifted adolescents and adults differ in their specific reasons fofailure. Differences in attribution styles between the three groups of mathematically gifted, as measSelf-Confidence Attitude Attribute Scales questionnaire, indicate that it is important to know if the asuccess or failure are stable or unstable, external or internal.
Knowledge of how learners or trainees use attributions to account for success and failure can hand parents gain a deeper awareness of the mathematically gifted and, thus, predict their expectanintervention strategies when needed. The information is also applicable to courses concerning thegifted. Furthermore, the information can be presented directly to mathematically gifted studentsdevelop more insight into their own behavior.
n 2000, 180,000 students from 28 Organization forEconomic Co-Operation and Development (OECD)
ember countries and 4 non-OECD countries (Brazil,atvia, Liechtenstein, and the Russian Federation) par-
icipated in the first Programme for Internationaltudent Assessment (PISA). The results showed thattudents from Japan, Korea, New Zealand, and Finlandcored highest in all tests measuring mathematics lit-racy (OECD, 2001). The Finnish students’ rankingas even higher (i.e. third, when variation within
country was taken into account; O2003, the PISA follow-up study, foematics literacy and involving 276,students, was conducted in 41 countrieThe results of overall student perforent countries on the mathematics sc
Authors’ Note: Please address correspondenceResearch Centre for Vocational EducatiHämeenlinna, Finland 13101; e-mail: petri.no
© 2007 National Association for Gifted Children. All rights reserved. Not for commercial use or unauthorized distribution. by guest on October 16, 2007 http://gcq.sagepub.comDownloaded from
10.1177/0016986206296659
Abstract: In this article, the authors examine the influence of attribution styles on the development of mathematicaltalent. The study employs a Self-Confidence Attitude Attribute Scale questionnaire, which measures ability and effortattributions. Participants are three groups of highly, moderately, or mildly mathematically gifted Finnish adolescentsand adults (N = 203). The results of Bayesian classification modeling show that items attributing success to effort andfailure to lack of effort are the best predictors for the level of mild mathematical giftedness and gender (females). Theresults of multivariate analysis of variance show that highly and moderately mathematically gifted students reportedthat ability was more important for success than effort, but mildly mathematically gifted tended to see effort as lead-ing to success. Moderately and mildly mathematically gifted students attribute failure to lack of effort, whereashighly mathematically gifted students attribute failure to lack of ability.
different attri- highly, mod-r success andured with thettributions for
elp educatorscies and plan needs of the
to help them
Keywords: attribution styles; self-regulation; mathematical talent; academic Olympians; vocational high schoolstudents
ECD, 2001). Incusing on math-165 15-year-olds (OECD, 2004).mance in differ-ale showed that
to Petri Nokelainen,on, P.O. Box 229,[email protected].
Nokelainen et al. / Investigating the Influence of Attribution Styles 65
Hong Kong students had the highest, and Finnishstudents had the second highest, mean student score(OECD, 2004). The finding of small within-countryvariance in the Finnish sample was repeated.
One logical reason for success in international com-parison studies is the Finnish government’s “equalopportunities and high-quality education for all”principle. The first practical consequence of the prin-ciple is that education is free for all students partici-pating in these assessments. The second consequenceis government’s strong financial support for publicsector educational institutions. This has led to the sit-uation where there are no appreciable differences inteaching quality or premises between public and specialschools. Partly for this reason, only a small minorityof the schools in Finland are special schools withentrance examinations and financial support from pri-vate or corporate sources. There are no private uni-versities or polytechnics in Finland.
The purpose of this study is to explore the attribu-tion styles—that is, personal explanations for successand failure—in Finnish adolescents and adults (N =203) with varying levels of mathematical giftednessto discover what attributions contribute to or impedethe development of mathematical talent.
The first group, “Olympians,” consists of highlymathematically gifted adults who have participated inthe International Olympics for Mathematics. Tirri andCampbell (2002) reported that 80% of the FinnishOlympians apply their mathematical talent by choos-ing a career in science. The majority of them areresearchers in academia or engineers in technicalfields. The Olympians have been very successful intheir graduate studies, and they have published arti-cles and books related to their fields. Those Olympianswho did not continue in academia chose a career asan engineer or as a CEO or a manager in leadingFinnish companies, such as Nokia (Tirri, 2002; Tirri& Campbell, 2002).
The second group, “Prefinalists,” consists of sec-ondary school students who have taken part in nationalcompetitions in mathematics. The group representsthe top level of Finnish 15-year-old students that par-ticipated in the international PISA 2000 study.
The third group, “Polytechnics,” consists of adoles-cent students from a technical vocational high schoolwho study mathematics as their major subject. InFinland, most of the vocational high schools are highlyspecialized regional institutions that train adolescentsfor the tasks of an expert. This particular institution
is the top-rated technically oriented vocational highschool in Finland.
Giftedness is not a monolithic construct. There aredifferent levels of giftedness, and thus, the three groupsrepresenting mathematically gifted adolescents andadults in this study are not homogenous. Furthermore,we are not able to guarantee that the individuals withineach group share the same level of mathematical abil-ity. Intelligence quotient is, especially with children, auseful index of the discrepancy between mental andchronological age. As the participants of this study areadolescents and adults, we did not measure their IQ,but instead, we looked at their current or past achieve-ments. Olympians are the most homogenous and math-ematically gifted group in this study on the basis oftheir achievements as Academic Olympians and theirtraceable academic publication record (Nokelainen,Tirri, & Campbell, 2004; Nokelainen, Tirri, Campbell,& Walberg, 2004). We classify Olympians for the pur-pose of this study as highly mathematically gifted.Also, Prefinalists underwent a series of increasinglydemanding mathematical tests to be included in theAcademic Olympians training program. Their trainersare past Olympians—that is, members of the firstgroup in this study. Prefinalists are classified as mod-erately mathematically gifted, as we do not yet knowhow many will be selected to participate as AcademicOlympians in the future. Technical vocation highschool students, who study mathematics as their major,represent mildly mathematically gifted students inthis study. Group membership (1 = Olympians, 2 =Prefinalists, and 3 = Polytechnics) showed a strongpositive correlation with secondary school mathemat-ics grade average (from 1, the highest, to 7), with a cor-relation coefficient of r(203) = .82, p < .001.
Earlier studies of mathematical giftedness havemainly focused on within-group differences relatedto, for example, gender or attribution styles. There arevery few between-group comparisons, except cross-cultural, reported. Socioeconomic differences do existin Finland, but their impact on children’s educationalpossibilities is minor because education is free at alllevels. As the PISA results indicate (OECD, 2001,2004), all individuals in Finland are provided with auniformly high level of basic mathematical training,thus controlling, at least to some extent, individual-level educational differences. This allows us to inter-pret possible differences between the groups throughdifferences in individuals’ characteristics, such asmathematical giftedness and attribution styles.
© 2007 National Association for Gifted Children. All rights reserved. Not for commercial use or unauthorized distribution. by guest on October 16, 2007 http://gcq.sagepub.comDownloaded from
All the participants completed the Self-ConfidenceAttitude Attribute Scales (SaaS) questionnaire(Campbell, 1996a). The instrument included 18 itemsbased on Weiner’s (1974, 1980, 1986, 1994, 2000)properties of attributional thinking, measuring abilityand effort attributions on four dimensions: (a) successbecause of ability, (b) failure because of lack of abil-ity, (c) success because of effort, and (d) failure becauseof lack of effort.
Our three research questions are as follows: (a) Arethe four dimensions of the SaaS instrument present inthe empirical sample? (b) What are the best predic-tors of the level of mathematical giftedness and gen-der among the SaaS variables? (c) Do the attributionstyles differ by the level of mathematical giftednessor gender?
Theoretical Framework
Properties of Attributional Thinking
Reasons people give for an outcome, such as suc-cess or failure in a task, are called attributions (Heider,1958). Factors involved in attributional thinking, suchas specific reasons for success and failure, have beenshown to be related in achievement settings (Weiner,1974, 1980, 1986, 1994, 2000). In his studies, Weinerfound that the four most frequent reasons for successand failure are ability, effort, task difficulty, and luck.Subsequent research identified learning strategiesas a fifth possible reason for success and failure(Alderman, 2004): “It is no good thing trying harderif you do not know how to try.”
Dai, Moon, and Feldhusen (1998) classify attributionconstructs into three groups. First, attribution appraisalsare explanations assessed following actual or manipu-lated success or failure in performing a specific task.Second, attribution beliefs are domain-specific ordomain-general beliefs about the causes of success orfailure. Third, attribution styles are generalized, stereo-typical patterns of attributions and dispositional beliefs.Attribution styles are assessed in a similar way toattribution beliefs, except that a certain typology isimposed on the data using predetermined criteria. Inthis study, we examined attribution styles using Weiner’s(1992) classification of reasons for success and fail-ure: (a) internal and external attributions, referring towithin or outside person causes; (b) stable and unsta-ble attributions, referring to consistent or inconsistentcauses over time; and (c) controllable and uncon-trollable attributions, referring to the extent a person
believes he or she has control over the cause of anoutcome. In this study, we examined within-personfactors (ability and effort) as they have typically beenfound to be the most frequently cited reasons forsuccess and failure in achievement contexts. Those fac-tors are classified as “internal” attributions. “External”attributions (luck, task difficulty) were omitted fromthe study design. Thus, our focus is on stable andunstable, controllable and uncontrollable, internal attri-butions. Most effort attributions tend to be unstableand controllable, as opposed to ability attributions,which are usually stable and uncontrollable. We willshow later how the 18 SaaS items are related to thesedimensions. We will also discuss in later stages of theanalysis how the four SaaS factors describe dimen-sions of reasons for success and failure.
Self-Regulation and Attribution Styles
Self-regulation refers to the process through whichself-generated thoughts, feelings, and actions areplanned and systematically adapted as necessary toaffect one’s learning and motivation (Schunk & Ertmer,2000; Zimmerman, 2000). According to social-cognitivetheory, self-regulation is dependent on the situation.Therefore, self-regulation is not a general characteris-tic or a developmental level but rather is contextuallydependent.
Zimmerman (2000) describes self-regulation ascyclical because the feedback from prior performanceis used to make adjustments during current efforts.Personal, behavioral, and environmental factors areconstantly changing, and therefore, an individual has tomonitor these changes continuously to know whetherany adjustments are required. Zimmerman describesthe three feedback loops involved in monitoring one’sinternal state, one’s behaviors, and one’s environmentas the triadic forms of self-regulation.
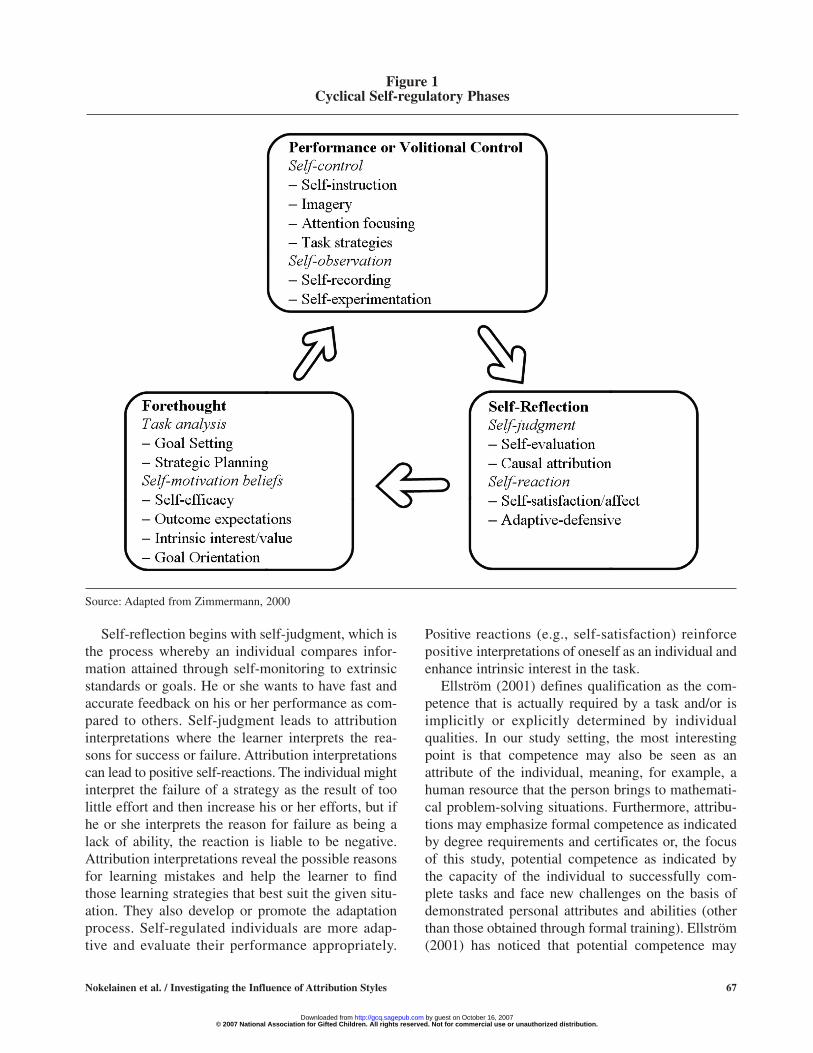
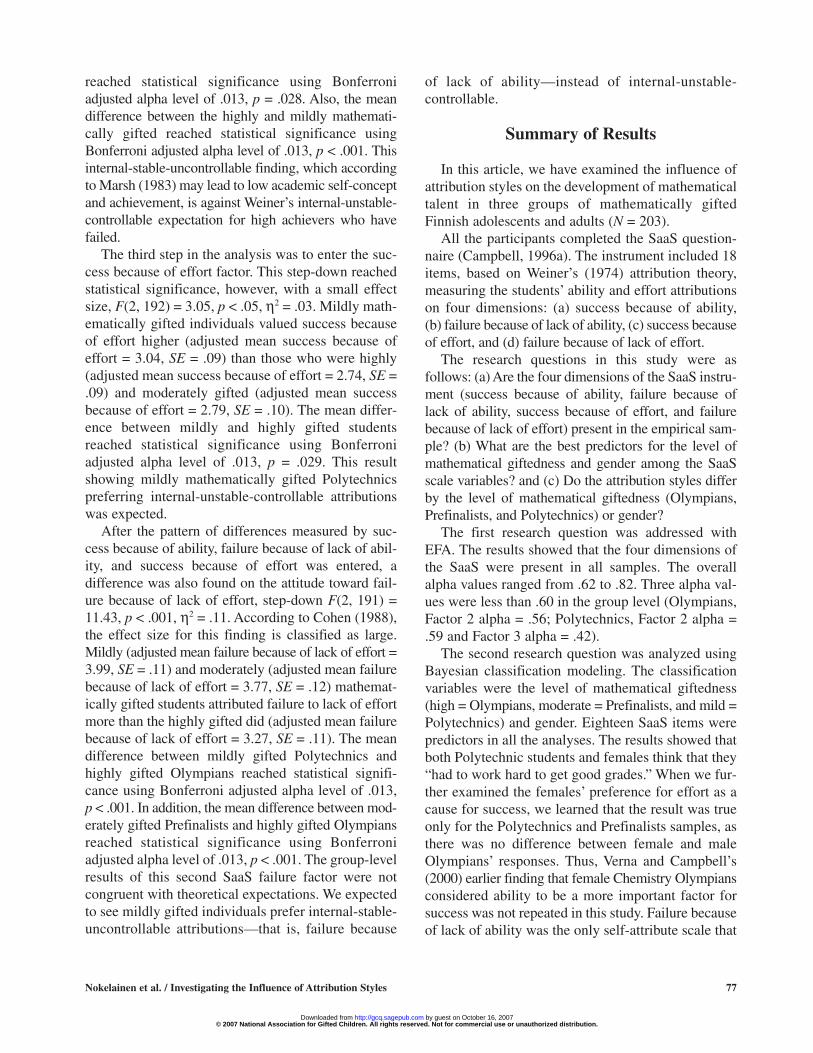
Figure 1 describes self-regulation of learning tasksas a cyclical, three-phase process (Zimmerman, 1998).The phases in this learning cycle are forethought,performance or volitional control, and self-reflection.Forethought, which creates the necessary conditions forlearning, consists of task analysis and self-motivationbeliefs. Performance or volitional control, which guidesthe learning process and regulates concentration andlearning performance, consists of self-control and self-observation. Self-reflection, which refers to examiningand making meaning of the learning experience, con-sists of self-judgment and self-reaction. Next, we exam-ine more closely the last phase, which contains thefocus of this article, attribution styles.
66 Gifted Child Quarterly, Vol. 51, No. 1
© 2007 National Association for Gifted Children. All rights reserved. Not for commercial use or unauthorized distribution. by guest on October 16, 2007 http://gcq.sagepub.comDownloaded from
Nokelainen et al. / Investigating the Influence of Attribution Styles 67
Self-reflection begins with self-judgment, which isthe process whereby an individual compares infor-mation attained through self-monitoring to extrinsicstandards or goals. He or she wants to have fast andaccurate feedback on his or her performance as com-pared to others. Self-judgment leads to attributioninterpretations where the learner interprets the rea-sons for success or failure. Attribution interpretationscan lead to positive self-reactions. The individual mightinterpret the failure of a strategy as the result of toolittle effort and then increase his or her efforts, but ifhe or she interprets the reason for failure as being alack of ability, the reaction is liable to be negative.Attribution interpretations reveal the possible reasonsfor learning mistakes and help the learner to findthose learning strategies that best suit the given situ-ation. They also develop or promote the adaptationprocess. Self-regulated individuals are more adap-tive and evaluate their performance appropriately.
Positive reactions (e.g., self-satisfaction) reinforcepositive interpretations of oneself as an individual andenhance intrinsic interest in the task.
Ellström (2001) defines qualification as the com-petence that is actually required by a task and/or isimplicitly or explicitly determined by individualqualities. In our study setting, the most interestingpoint is that competence may also be seen as anattribute of the individual, meaning, for example, ahuman resource that the person brings to mathemati-cal problem-solving situations. Furthermore, attribu-tions may emphasize formal competence as indicatedby degree requirements and certificates or, the focusof this study, potential competence as indicated bythe capacity of the individual to successfully com-plete tasks and face new challenges on the basis ofdemonstrated personal attributes and abilities (otherthan those obtained through formal training). Ellström(2001) has noticed that potential competence may
Figure 1Cyclical Self-regulatory Phases
Source: Adapted from Zimmermann, 2000
© 2007 National Association for Gifted Children. All rights reserved. Not for commercial use or unauthorized distribution. by guest on October 16, 2007 http://gcq.sagepub.comDownloaded from
vary greatly between individuals with the same formalqualifications, because they may possess very differentlevels of inherent ability and may have learned differentthings outside of school or studies through their work-ing life and recreational activities. Thus, ability attribu-tions affect later performance expectations and, innegative cases, the development or continuation oflearned helplessness (Ruohotie & Nokelainen, 2000).
In this study, we concentrate on participants’ self-evaluations on the basis of mathematics achievementand academic ability, because causal attributions (seephase “Self-Reflection” in Figure 1) play an impor-tant part in the self-regulatory process by being cen-tral elements of self-judgment and thus influencing,for example, goal setting and self-efficacy. We areinterested to see if the attribution styles of highlymathematically gifted individuals differ from those ofthe mathematically able.
Our research questions are as follows: (a) Are thefour dimensions of the SaaS instrument (successbecause of ability, failure because of lack of ability,success because of effort, and failure because of lackof effort) present in the empirical sample? (b) What arethe best predictors of the level of mathematical gifted-ness (high = Olympians, moderate = Prefinalists, andmild = Polytechnics) and gender among the SaaS vari-ables? (c) Do the attribution styles differ by the level ofmathematical giftedness or gender?
Literature Review
Mathematical Giftednessand Attribution Styles
Campbell has conducted several cross-nationalstudies on Mathematics Olympians (see, e.g., Campbell,1994, 1996b; Nokelainen, Tirri, & Campbell, 2004).He made two interesting findings: First, the interna-tional data on mathematics self-concept verified thefinding that their academic self-concepts fluctuatefrom grade school to high school and, second, that theOlympians attributed effort to be more important intheir success than ability (Campbell, 1996b). The lat-ter research finding has been verified by Chan (1996),who reported that adolescent gifted students weremore likely to attribute failure to lack of effort than toattribute it to low ability. The American and TaiwaneseOlympians have also attributed success and failuremore to effort than to ability (Feng, Campbell, &Verna, 2001; Wu & Chen, 2001).
Heller and Lengfelder (2000) investigated 100German Olympian finalists and 135 Prefinalists inmathematics, physics, and chemistry. In contrast toCampbell’s findings, their results showed that partic-ipants in both groups valued ability significantlymore highly than effort. Effort was estimated to beequally important in the case of failure as in the caseof success (Heller & Lengfelder, 2000).
Marsh (1983) found, as he studied relationshipsbetween the dimensions of self-attribution, self-concept,and academic achievements, that those who attribute aca-demic success to ability and who do not attribute failureto a lack of ability have better academic self-conceptsand better academic achievement. Multon, Brown, andLent (1991) have also shown a positive correlationbetween perceived ability and achievement.
Gender and Attribution Styles
In an American study by Verna and Campbell(2000), a small significant difference between malesand females was found with regard to perceptions ofability. The female American Chemistry Olympiansconsidered ability to be a more important factor forsuccess than did the males. However, no differencewas found for the effort factor.
Kerr (1994) and Reis (1998) have identified exter-nal barriers to gifted women as including the attitudesof parents and school, environmental options, and pos-sible discrimination or harassment at school or atwork. The possible internal barriers among giftedfemales included self-doubt, self-criticism, and lowexpectations. According to Siegle and Reis (1998),gifted girls tend to underestimate their abilities, espe-cially in mathematics, social studies, and science.
Instrumentation of Attribution Theory
There is abundant literature and research on attri-bution theory, especially on attributional properties inachievement settings (Weiner, 1974, 1980, 1986,1994, 2000), because the role of motivation in acade-mic achievement has proven to be a popular topic. Theprinciple of attribution theory is that students searchfor understanding, trying to discover why an event hasoccurred (Weiner, 1974). The interest is apparent aswe examine the structure of existing measurementinstruments: Biggs’s (1985) 42-item Study ProcessQuestionnaire consists of two scales (Motive andStrategy) with three approaches: (a) surface, (b) deep,and (c) achieving. The questionnaire contains six sub-scales (Surface Motive, Deep Motive, Achieving Motive,
68 Gifted Child Quarterly, Vol. 51, No. 1
© 2007 National Association for Gifted Children. All rights reserved. Not for commercial use or unauthorized distribution. by guest on October 16, 2007 http://gcq.sagepub.comDownloaded from
Nokelainen et al. / Investigating the Influence of Attribution Styles 69
Surface Strategy, Deep Strategy, and AchievingStrategy). Ramsden and Entwistle’s (1981) Approachesto Studying Inventory, which is one of the most widelyused questionnaires on student learning in higher edu-cation, contains subscales including such factors asfear of failure, extrinsic motivation, and achievingorientation. Marsh (e.g., Marsh & O’Neill, 1984)has developed a set of scales (Self-DescriptionQuestionnaire I to III) for different age groups measur-ing self-concept with a multifaceted (e.g., mathe-matics, verbal, academic, physical) view. Accordingto Strein (1995), research results during the past 15years have strongly supported the multifaceted viewemphasizing domain-specific self-concepts. In thisstudy, we apply the SaaS questionnaire that was devel-oped by Campbell (1996a) originally for cross-cultural Academic Olympiad studies.
Method
Sample
The Finnish education system includes compre-hensive schools, postcomprehensive general and voca-tional education, higher education, and adult education.Comprehensive schools provide a 9-year compulsoryeducational program for all school-age childrenbeginning at the age of 7. Postcomprehensive educa-tion is provided in upper secondary schools and voca-tional institutions. The Finnish higher educationsystem includes 20 universities and 30 vocationalhigh schools. The higher education system as a wholeoffers openings for 66% of the relevant age group(universities 29%, vocational high schools 37%).
Respondents in the first group, Olympians, are theFinnish students most gifted in mathematics. Thegroup consists of individuals of different ages whoparticipated in Olympiad Studies in Mathematics from1965 through 1999. Separate programs exist for theMathematics, Physics, and Chemistry Olympiads. Inrecent years, programs have been created for Biologyand Computer Science Olympiads as well. Distinctstudies have been undertaken in each of these acade-mic areas. In the Mathematics, Physics, and ChemistryOlympiad programs, a series of increasingly difficulttests are administered. This testing concludes withthe identification of the top national finalists (6 to 20Olympians). These individuals are trained to competein the International Olympiad programs.
The second group, Prefinalists, involved in thisstudy consists of secondary school students who have
taken part in the national competitions in mathemat-ics from 2000 to 2001. Each year, schools all overFinland send their most talented students to thisannual competition. The tests of this competitionresemble the tests used in academic Olympians.
The third group, Polytechnics, consists of studentsof Espoo-Vantaa Institute of Technology. They needprogressively advanced mathematical skills as theyprogress in their studies. However, compared to higherlevel mathematics studies in universities, technologicalmathematics studies in vocational high schools aremore practically oriented.
In addition, respondents’ parents were asked abouttheir educational level. More than 60% of Olympians(62.2%) and Prefinalists (65.4%) parents had an acad-emic degree. Only 23.9% of Polytechnics parents hadthe same educational level. Analysis of parental occu-pation in the three groups showed that Olympians andPrefinalists parents shared similar vocational interests,as they were, for example, doctors, teachers, andbusiness managers. Polytechnics’ parents were mainlymiddle-class (e.g., factory workers). However, inFinland, educational level is not a good predictor ofsocioeconomic status. Prefinalists’ parents belong tothe highest income class in Finland, with the averageannual salary of US$83,597. Both Olympians’ parents($49,447) and Polytechnics’ parents ($46,721) earnmiddle-level salaries in the Finnish context.
Procedure
All the participants completed the SaaS question-naire (Campbell, 1996a) based on Weiner’s (1974) self-attribution theory. The Mathematics Olympians’ data(n = 77) included 68 male and 9 female respondents.The sample is quite representative, as the total numberof Finnish Mathematics Olympians is 84 (70 males and14 females). The second group (n = 52) is a samplefrom about 200 secondary school national competitorsin mathematics. The polytechnic student data (n = 74) isa fully representative sample of an advanced mathemat-ics course held at Espoo-Vantaa Institute of Technologyin Autumn 2001, the total number of participants inwhich is approximately 3,000. Olympiad data was col-lected between 1997 and 2002, the Polytechnic data in2001, and the Prefinalists data between 2001 and 2002.
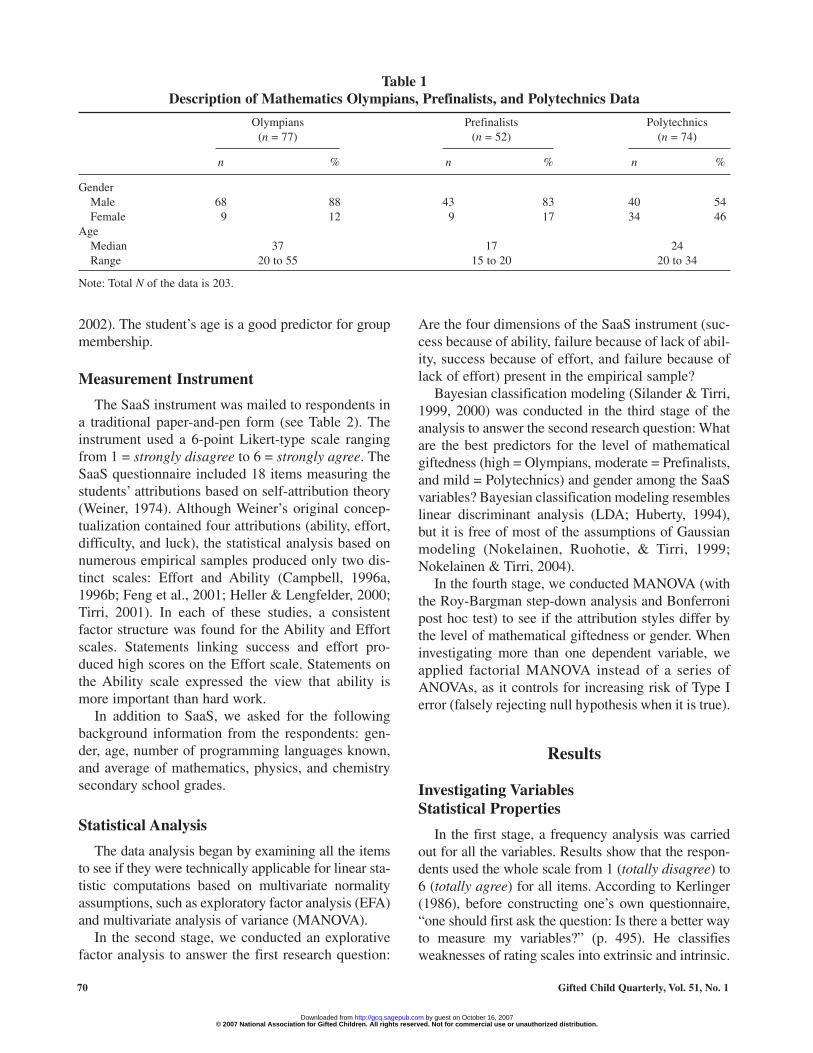
Table 1 shows that, except for the Polytechnics, gen-der is biased toward males. This finding is related tothe well-documented tendency of females not to pur-sue careers in science even though they are as equallycapable as males (e.g., Enman & Lupart, 2000), unlessone or both of their parents are in the same field (Tirri,
© 2007 National Association for Gifted Children. All rights reserved. Not for commercial use or unauthorized distribution. by guest on October 16, 2007 http://gcq.sagepub.comDownloaded from
70 Gifted Child Quarterly, Vol. 51, No. 1
2002). The student’s age is a good predictor for groupmembership.
Measurement Instrument
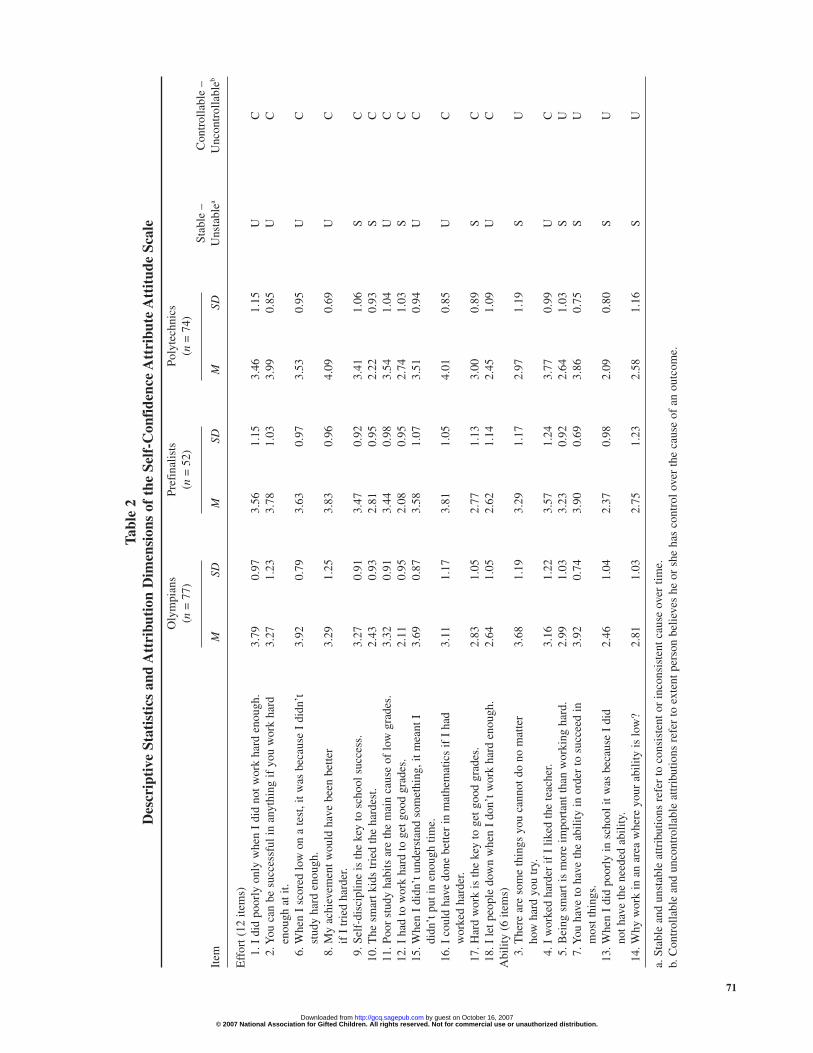
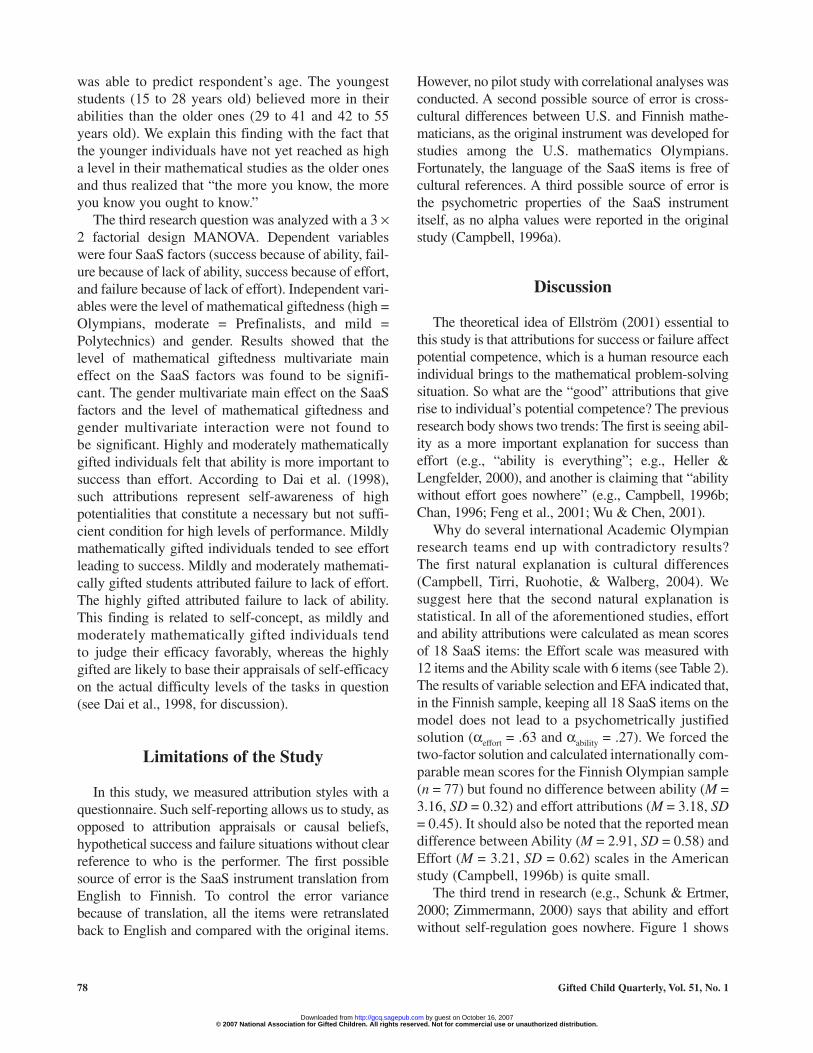
The SaaS instrument was mailed to respondents ina traditional paper-and-pen form (see Table 2). Theinstrument used a 6-point Likert-type scale rangingfrom 1 = strongly disagree to 6 = strongly agree. TheSaaS questionnaire included 18 items measuring thestudents’ attributions based on self-attribution theory(Weiner, 1974). Although Weiner’s original concep-tualization contained four attributions (ability, effort,difficulty, and luck), the statistical analysis based onnumerous empirical samples produced only two dis-tinct scales: Effort and Ability (Campbell, 1996a,1996b; Feng et al., 2001; Heller & Lengfelder, 2000;Tirri, 2001). In each of these studies, a consistentfactor structure was found for the Ability and Effortscales. Statements linking success and effort pro-duced high scores on the Effort scale. Statements onthe Ability scale expressed the view that ability ismore important than hard work.
In addition to SaaS, we asked for the followingbackground information from the respondents: gen-der, age, number of programming languages known,and average of mathematics, physics, and chemistrysecondary school grades.
Statistical Analysis
The data analysis began by examining all the itemsto see if they were technically applicable for linear sta-tistic computations based on multivariate normalityassumptions, such as exploratory factor analysis (EFA)and multivariate analysis of variance (MANOVA).
In the second stage, we conducted an explorativefactor analysis to answer the first research question:
Are the four dimensions of the SaaS instrument (suc-cess because of ability, failure because of lack of abil-ity, success because of effort, and failure because oflack of effort) present in the empirical sample?
Bayesian classification modeling (Silander & Tirri,1999, 2000) was conducted in the third stage of theanalysis to answer the second research question: Whatare the best predictors for the level of mathematicalgiftedness (high = Olympians, moderate = Prefinalists,and mild = Polytechnics) and gender among the SaaSvariables? Bayesian classification modeling resembleslinear discriminant analysis (LDA; Huberty, 1994),but it is free of most of the assumptions of Gaussianmodeling (Nokelainen, Ruohotie, & Tirri, 1999;Nokelainen & Tirri, 2004).
In the fourth stage, we conducted MANOVA (withthe Roy-Bargman step-down analysis and Bonferronipost hoc test) to see if the attribution styles differ bythe level of mathematical giftedness or gender. Wheninvestigating more than one dependent variable, weapplied factorial MANOVA instead of a series ofANOVAs, as it controls for increasing risk of Type Ierror (falsely rejecting null hypothesis when it is true).
Results
Investigating VariablesStatistical Properties
In the first stage, a frequency analysis was carriedout for all the variables. Results show that the respon-dents used the whole scale from 1 (totally disagree) to6 (totally agree) for all items. According to Kerlinger(1986), before constructing one’s own questionnaire,“one should first ask the question: Is there a better wayto measure my variables?” (p. 495). He classifiesweaknesses of rating scales into extrinsic and intrinsic.
Table 1Description of Mathematics Olympians, Prefinalists, and Polytechnics Data
Olympians Prefinalists Polytechnics(n = 77) (n = 52) (n = 74)
n % n % n %
GenderMale 68 88 43 83 40 54Female 9 12 9 17 34 46
AgeMedian 37 17 24Range 20 to 55 15 to 20 20 to 34
Note: Total N of the data is 203.
© 2007 National Association for Gifted Children. All rights reserved. Not for commercial use or unauthorized distribution. by guest on October 16, 2007 http://gcq.sagepub.comDownloaded from
71
Tabl
e 2
Des
crip
tive
Sta
tist
ics
and
Att
ribu
tion
Dim
ensi
ons
of t
he S
elf-
Con
fide
nce
Att
ribu
te A
ttit
ude
Scal
e
Oly
mpi
ans
Pref
inal
ists
Poly
tech
nics
(n=
77)
(n=
52)
(n=
74)
Stab
le –
Con
trol
labl
e –
Item
MSD
MSD
MSD
Uns
tabl
eaU
ncon
trol
labl
eb
Eff
ort (
12 it
ems)
1. I
did
poo
rly
only
whe
n I
did
not w
ork
hard
eno
ugh.
3.79
0.97
3.56
1.15
3.46
1.15
UC
2. Y
ou c
an b
e su
cces
sful
in a
nyth
ing
if y
ou w
ork
hard
3.27
1.23
3.78
1.03
3.99
0.85
UC
enou
gh a
t it.
6. W
hen
I sc
ored
low
on
a te
st,i
t was
bec
ause
I d
idn’
t3.
920.
793.
630.
973.
530.
95U
Cst
udy
hard
eno
ugh.
8. M
y ac
hiev
emen
t wou
ld h
ave
been
bet
ter
3.29
1.25
3.83
0.96
4.09
0.69
UC
if I
trie
d ha
rder
.9.
Sel
f-di
scip
line
is th
e ke
y to
sch
ool s
ucce
ss.
3.27
0.91
3.47
0.92
3.41
1.06
SC
10. T
he s
mar
t kid
s tr
ied
the
hard
est.
2.43
0.93
2.81
0.95
2.22
0.93
SC
11. P
oor
stud
y ha
bits
are
the
mai
n ca
use
of lo
w g
rade
s.3.
320.
913.
440.
983.
541.
04U
C12
. I h
ad to
wor
k ha
rd to
get
goo
d gr
ades
.2.
110.
952.
080.
952.
741.
03S
C15
. Whe
n I
didn
’t u
nder
stan
d so
met
hing
,it m
eant
I3.
690.
873.
581.
073.
510.
94U
Cdi
dn’t
put
in e
noug
h tim
e.16
. I c
ould
hav
e do
ne b
ette
r in
mat
hem
atic
s if
I h
ad3.
111.
173.
811.
054.
010.
85U
Cw
orke
d ha
rder
.17
. Har
d w
ork
is th
e ke
y to
get
goo
d gr
ades
.2.
831.
052.
771.
133.
000.
89S
C18
. I le
t peo
ple
dow
n w
hen
I do
n’t w
ork
hard
eno
ugh.
2.64
1.05
2.62
1.14
2.45
1.09
UC
Abi
lity
(6 it
ems)
3. T
here
are
som
e th
ings
you
can
not d
o no
mat
ter
3.68
1.19
3.29
1.17
2.97
1.19
SU
how
har
d yo
u tr
y.4.
I w
orke
d ha
rder
if I
like
d th
e te
ache
r.3.
161.
223.
571.
243.
770.
99U
C5.
Bei
ng s
mar
t is
mor
e im
port
ant t
han
wor
king
har
d.2.
991.
033.
230.
922.
641.
03S
U7.
You
hav
e to
hav
e th
e ab
ility
in o
rder
to s
ucce
ed in
3.92
0.74
3.90
0.69
3.86
0.75
SU
mos
t thi
ngs.
13. W
hen
I di
d po
orly
in s
choo
l it w
as b
ecau
se I
did
2.46
1.04
2.37
0.98
2.09
0.80
SU
not h
ave
the
need
ed a
bilit
y.14
. Why
wor
k in
an
area
whe
re y
our
abili
ty is
low
?2.
811.
032.
751.
232.
581.
16S
U
a. S
tabl
e an
d un
stab
le a
ttrib
utio
ns r
efer
to c
onsi
sten
t or
inco
nsis
tent
cau
se o
ver
time.
b. C
ontr
olla
ble
and
unco
ntro
llabl
e at
trib
utio
ns r
efer
to e
xten
t per
son
belie
ves
he o
r sh
e ha
s co
ntro
l ove
r th
e ca
use
of a
n ou
tcom
e.
© 2007 National Association for Gifted Children. All rights reserved. Not for commercial use or unauthorized distribution. by guest on October 16, 2007 http://gcq.sagepub.comDownloaded from
72 Gifted Child Quarterly, Vol. 51, No. 1
The extrinsic defect is that scales are much too easy toconstruct and use. Sometimes a scale is used to mea-sure things for which it is not appropriate. Kerlingerdefines the intrinsic defect of rating scales as theirproneness to constant error. He lists four main sources:halo effect, the error of severity (to rate all items toolow), error of leniency (to rate all items too high), anderror of central tendency (to avoid all extreme judg-ments). To address this issue, we analyzed the overallresponse tendency. We found that distribution of themodes on a 6-point Likert-type scale was multimodaland slightly biased toward positive values: (a) n = 0,(b) n = 5, (c) n = 0, (d) n = 11, (e) n = 0, and (f) n = 0.
Numerous publications declare that certain attrib-utes belong to data appropriate for multivariate analy-sis (e.g., Bradley & Schaefer, 1998; Tabachnick &Fidell, 1996). The most commonly used criteria foraccepting variables for multivariate analysis are asfollows: (a) a standard deviation of no more than halfthe mean, (b) skewness less than +/– .3, and (c) cor-relation between +/– .3 and .7. When we examinedthe 18 items using the first two criteria, we noticedthat all the items passed the first criteria, but only 4items passed the second criteria. As it seemed impos-sible to take the second criteria literally because of ahigh rejection rate at the .03 level, we examined theskewness of items in three additional levels (.05, .07,and .08). The .07 level proved to be suitable for thisdata set, suggesting rejection of three items (#4, #6,and #7). A nonparametric interitem correlation matrixwas produced to examine the third criteria. Thirteenitems reached the desired level, as the values rangedfrom –.48 to .71 (M = .05, SD = .16). The rejecteditems were #4, #7, #10, #14, and #18. We examinedmultivariate normality with Mahalanobis distances.The maximum values for the two SaaS scales werebelow critical values obtained from the chi-squaretable (alpha = .001), thus not indicating the presenceof outliers.
Finally, when we combine the results of the variableselection phase, it seems obvious that at least two items(#4, “I worked harder if I liked the teacher,” and #7,“You have to have the ability in order to succeed inmost things”) should be omitted from further analysis.
Explorative Factor Analysis
Our next task, according to the first researchquestion, was to see if the combined sample andthree subsamples contained the following fourdimensions: (a) success because of ability, (b) failure
because of lack of ability, (c) success because ofeffort, and (d) failure because of lack of effort. Weperformed the analysis with 16 items, as the variablerejection based on communalities of two-dimensionalprincipal components analysis structure did notappear to provide a feasible solution. Factor analysiswith the maximum likelihood extraction method anddirect oblimin rotation (delta value was set to zero, i.e.,letting factors correlate) was conducted for the com-bined sample (N = 203) and for each sample sepa-rately (Olympians n = 77, Prefinalists n = 52, andPolytechnics n = 74).
A four-factor solution with eight items grouped thevariables in all three subsamples and the combinedsample as expected. Next, we present the eight itemsoperationalizing the four SaaS factors. Factor 1, successbecause of ability, included only one variable: #5,“Being smart is more important than working hard.”The logic behind this solution was that the other tworelated items (#4, “I worked harder if I liked theteacher,” and #7, “You have to have the ability in orderto succeed in most things”) were omitted from furtheranalysis because they did not meet the assumptions ofmultivariate analysis. Factor 2, failure because of a lackof ability, included Items 3, “There are some things youcannot do no matter how hard you try,” and 13, “WhenI did poorly in school it was because I did not have theneeded ability” (alpha = .62). Factor 3, success becauseof effort, included Item 9, “Self-discipline is the key toschool success”; Item 12, “I had to work hard to getgood grades”; and Item 17, “Hard work is the key to getgood grades” (alpha = .63). Factor 4, failure because ofa lack of effort, included Items 8, “My achievementwould have been better if I tried harder,” and 16, “Icould have done better in mathematics if I had triedharder” (alpha = .82). The Cronbach’s alpha values forthe four factors within the three groups varied asfollows: Olympist data (Factor 1 = not calculated,Factor 2 = .56, Factor 3 = .75, and Factor 4 = .76),Prefinalists data (Factor 1 = not calculated, Factor 2 =.60, Factor 3 = .67, and Factor 4 = .84), andPolytechnics data (Factor 1 = not calculated, Factor 2 =.59, Factor 3 = .42, and Factor 4 = .80).
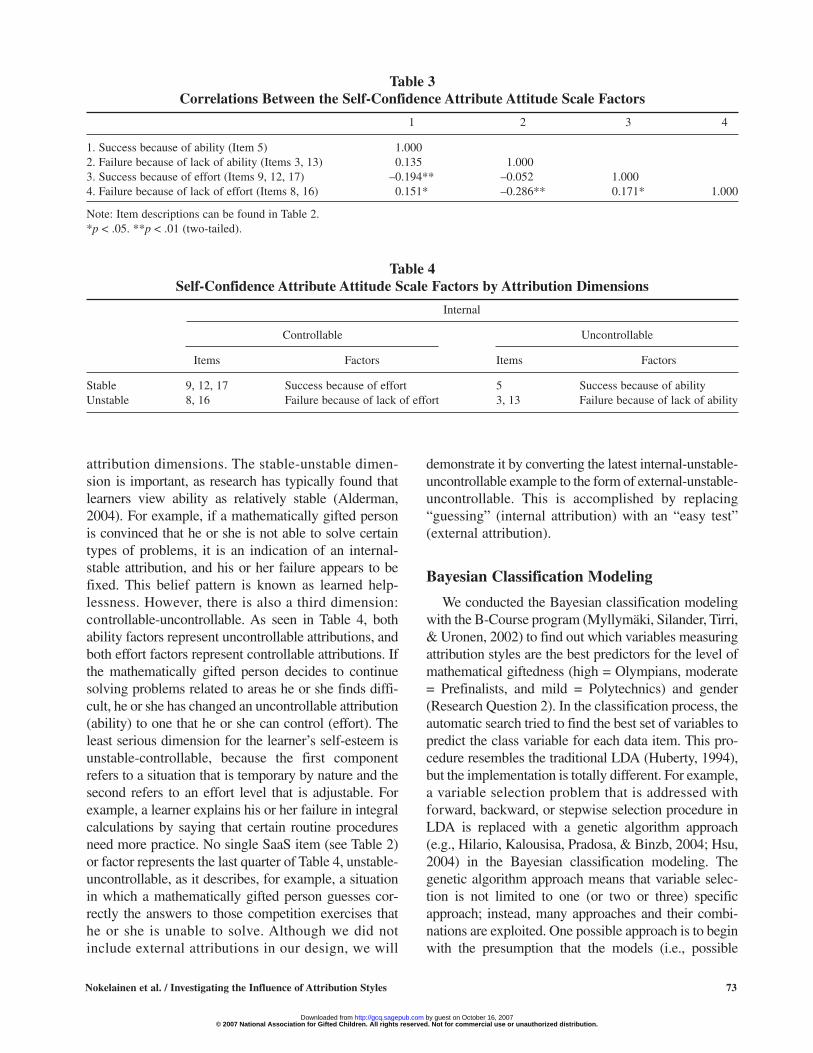
Although we found only one item measuring thefirst SaaS dimension, success because of ability, cor-relations between factors behaved as expected (seeTable 3). Ability and effort factors correlated nega-tively with each other, and both effort factors, as wellas both ability factors, correlated positively.
Table 4 shows how four SaaS factors are related tointernal, stable-unstable, and controllable-uncontrollable
© 2007 National Association for Gifted Children. All rights reserved. Not for commercial use or unauthorized distribution. by guest on October 16, 2007 http://gcq.sagepub.comDownloaded from
Nokelainen et al. / Investigating the Influence of Attribution Styles 73
attribution dimensions. The stable-unstable dimen-sion is important, as research has typically found thatlearners view ability as relatively stable (Alderman,2004). For example, if a mathematically gifted personis convinced that he or she is not able to solve certaintypes of problems, it is an indication of an internal-stable attribution, and his or her failure appears to befixed. This belief pattern is known as learned help-lessness. However, there is also a third dimension:controllable-uncontrollable. As seen in Table 4, bothability factors represent uncontrollable attributions, andboth effort factors represent controllable attributions. Ifthe mathematically gifted person decides to continuesolving problems related to areas he or she finds diffi-cult, he or she has changed an uncontrollable attribution(ability) to one that he or she can control (effort). Theleast serious dimension for the learner’s self-esteem isunstable-controllable, because the first componentrefers to a situation that is temporary by nature and thesecond refers to an effort level that is adjustable. Forexample, a learner explains his or her failure in integralcalculations by saying that certain routine proceduresneed more practice. No single SaaS item (see Table 2)or factor represents the last quarter of Table 4, unstable-uncontrollable, as it describes, for example, a situationin which a mathematically gifted person guesses cor-rectly the answers to those competition exercises thathe or she is unable to solve. Although we did notinclude external attributions in our design, we will
demonstrate it by converting the latest internal-unstable-uncontrollable example to the form of external-unstable-uncontrollable. This is accomplished by replacing“guessing” (internal attribution) with an “easy test”(external attribution).
Bayesian Classification Modeling
We conducted the Bayesian classification modelingwith the B-Course program (Myllymäki, Silander, Tirri,& Uronen, 2002) to find out which variables measuringattribution styles are the best predictors for the level ofmathematical giftedness (high = Olympians, moderate= Prefinalists, and mild = Polytechnics) and gender(Research Question 2). In the classification process, theautomatic search tried to find the best set of variables topredict the class variable for each data item. This pro-cedure resembles the traditional LDA (Huberty, 1994),but the implementation is totally different. For example,a variable selection problem that is addressed withforward, backward, or stepwise selection procedure inLDA is replaced with a genetic algorithm approach(e.g., Hilario, Kalousisa, Pradosa, & Binzb, 2004; Hsu,2004) in the Bayesian classification modeling. Thegenetic algorithm approach means that variable selec-tion is not limited to one (or two or three) specificapproach; instead, many approaches and their combi-nations are exploited. One possible approach is to beginwith the presumption that the models (i.e., possible
Table 3Correlations Between the Self-Confidence Attribute Attitude Scale Factors
1 2 3 4
1. Success because of ability (Item 5) 1.0002. Failure because of lack of ability (Items 3, 13) 0.135 1.0003. Success because of effort (Items 9, 12, 17) –0.194** –0.052 1.0004. Failure because of lack of effort (Items 8, 16) 0.151* –0.286** 0.171* 1.000
Note: Item descriptions can be found in Table 2.*p < .05. **p < .01 (two-tailed).
Table 4Self-Confidence Attribute Attitude Scale Factors by Attribution Dimensions
Internal
Controllable Uncontrollable
Items Factors Items Factors
Stable 9, 12, 17 Success because of effort 5 Success because of abilityUnstable 8, 16 Failure because of lack of effort 3, 13 Failure because of lack of ability
© 2007 National Association for Gifted Children. All rights reserved. Not for commercial use or unauthorized distribution. by guest on October 16, 2007 http://gcq.sagepub.comDownloaded from
74
Tabl
e 5
Impo
rtan
ce R
anki
ng o
f th
e Se
lf-C
onfi
denc
e A
ttri
bute
Att
itud
e Sc
ale
Item
s by
the
Lev
el o
f G
ifte
dnes
s an
d G
ende
r
The
Lev
el o
f G
ifte
dnes
sG
ende
r
Oly
mpi
ans
Pref
inal
ists
Poly
tech
nics
Mal
eFe
mal
eD
ropa
(n=
77)
(n=
52)
(n=
74)
(n=
149
)(n
= 5
2)
Cla
ss a
nd P
redi
ctor
Var
iabl
es%
MSD
MSD
MSD
MSD
MSD
The
leve
l of
gift
edne
ssb
10. T
he s
mar
t kid
s tr
ied
the
hard
est.
14.3
62.
430.
932.
810.
952.
220.
9316
. I c
ould
hav
e do
ne b
ette
r in
mat
hem
atic
s if
I7.
923.
111.
173.
811.
054.
010.
85ha
d w
orke
d ha
rder
.12
. I h
ad to
wor
k ha
rd to
get
goo
d gr
ades
.6.
932.
110.
952.
080.
952.
741.
035.
Bei
ng s
mar
t is
mor
e im
port
ant t
han
4.95
2.99
1.03
3.23
0.92
2.64
1.03
wor
king
har
d.3.
The
re a
re s
ome
thin
gs y
ou c
anno
t do
no3.
963.
681.
193.
291.
172.
971.
19m
atte
r ho
w h
ard
you
try.
4. I
wor
ked
hard
er if
I li
ked
the
teac
her.
2.48
3.16
1.22
3.57
1.24
3.77
0.99
8. M
y ac
hiev
emen
t wou
ld h
ave
been
bet
ter
1.98
3.29
1.25
3.83
0.96
4.09
0.69
if I
trie
d ha
rder
.G
ende
rc
12. I
had
to w
ork
hard
to g
et g
ood
grad
es.
6.93
2.23
0.96
2.67
1.10
8. M
y ac
hiev
emen
t wou
ld h
ave
been
bet
ter
6.44
3.68
1.13
3.85
0.87
if I
trie
d ha
rder
.2.
You
can
be
succ
essf
ul in
any
thin
g if
you
3.96
3.65
1.14
3.71
0.98
wor
k ha
rd e
noug
h at
it.
1. I
did
poo
rly
only
whe
n I
did
not w
ork
3.47
3.67
1.11
3.43
1.03
hard
eno
ugh.
14. W
hy w
ork
in a
n ar
ea w
here
you
r ab
ility
2.97
2.78
1.13
2.61
1.02
is lo
w?
5. B
eing
sm
art i
s m
ore
impo
rtan
t tha
n1.
982.
960.
992.
861.
06w
orki
ng h
ard.
a. D
ecre
ase
in p
redi
ctiv
e cl
assi
fica
tion
if it
em is
dro
pped
fro
m th
e cl
assi
fica
tion
mod
el.
b. C
lass
ific
atio
n ac
cura
cy is
65.
35%
.c.
Cla
ssif
icat
ion
accu
racy
is 7
9.70
%.
© 2007 National Association for Gifted Children. All rights reserved. Not for commercial use or unauthorized distribution. by guest on October 16, 2007 http://gcq.sagepub.comDownloaded from
Nokelainen et al. / Investigating the Influence of Attribution Styles 75
predictor variable combinations) that resemble eachother a lot (i.e., have almost same variables and dis-cretizations) are likely to be almost equally good. Thisleads to a search strategy in which models that resem-ble the current best model are selected for comparison,instead of picking models randomly. Another approachis to abandon the habit of always rejecting the weakestmodel and instead collect a set of relatively good mod-els. The next step is to combine the best parts of thesemodels so that the resulting combined model is betterthan any of the original models. B-Course is capable ofmobilizing many more viable approaches, for example,rejecting the better model (algorithms such as hillclimbing, simulated annealing) or trying to avoid pick-ing similar model twice (tabu search).
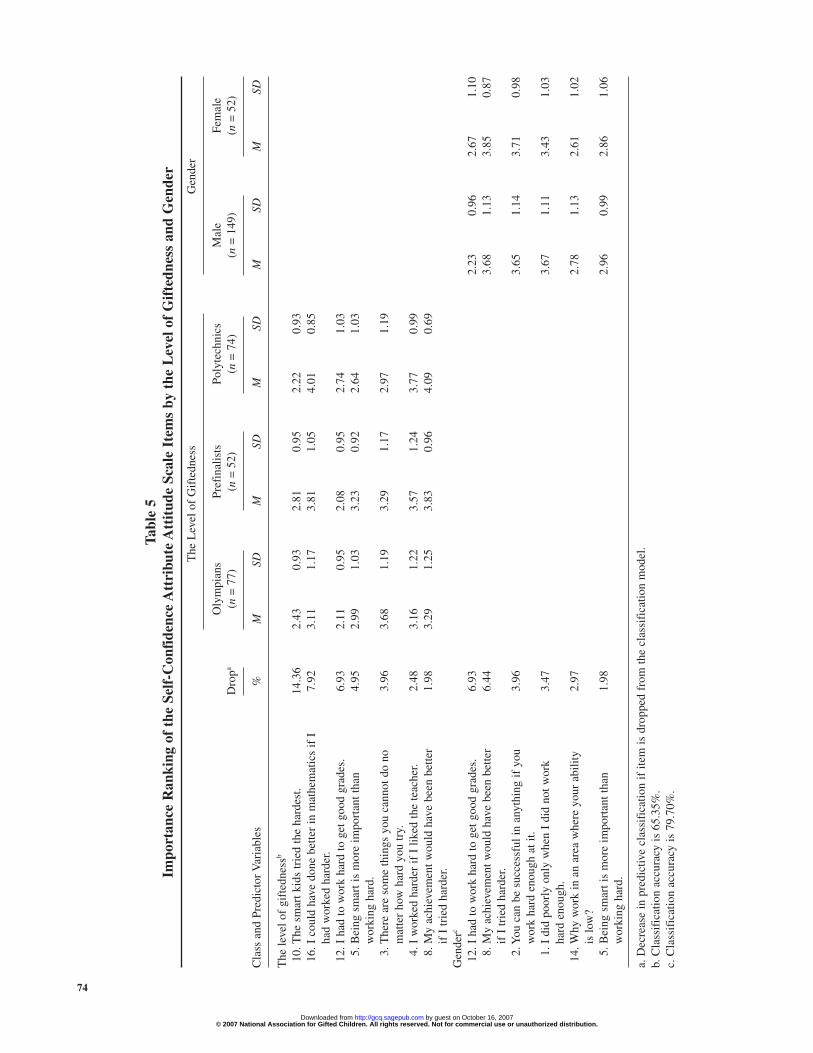
First, we derived the model for classifying data itemsaccording to the class variable level of mathematical gift-edness (Olympians, Prefinalists, and Polytechnics) with18 variables of the SaaS scale as predictors (items arelisted in Table 2). The estimated classification accuracyfor the model was 65.4%. Second, we derived the modelfor classifying data items according to the class variablegender. The estimated classification accuracy for themodel was 79.7%.
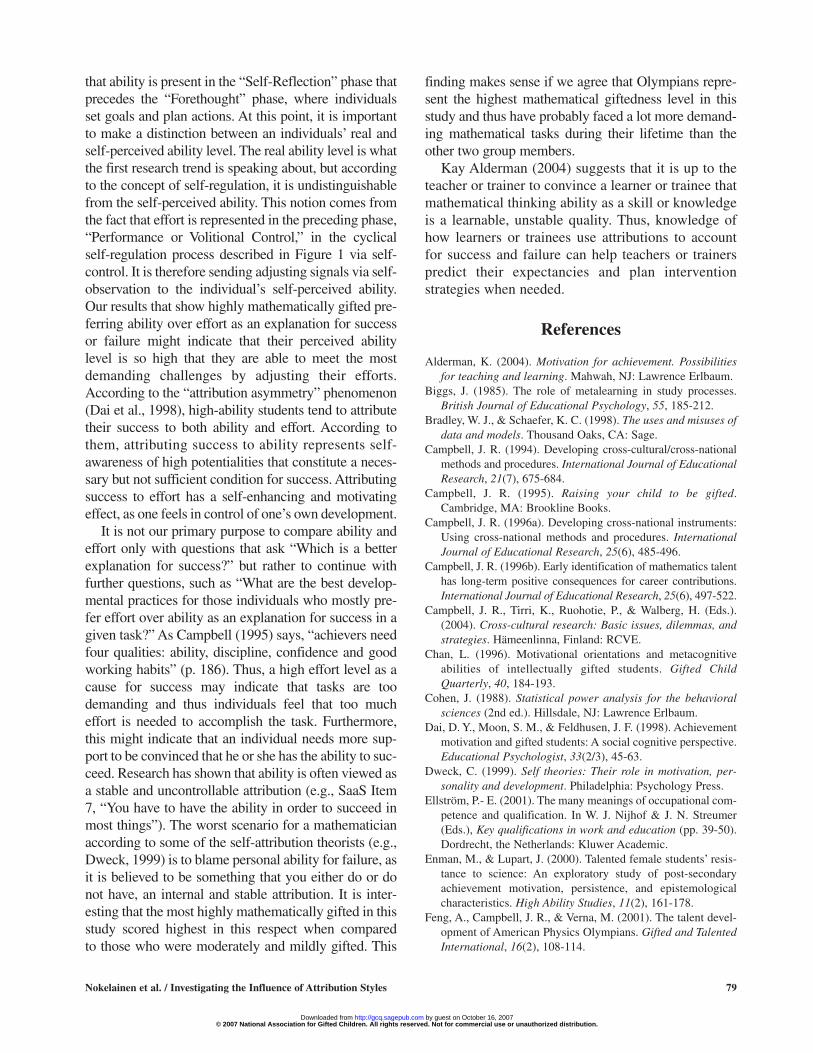
Table 5 lists the variables ordered by their estimatedclassification performance in the model. The strongestvariables—that is, those that discriminate the indepen-dent variables best—are listed first. The percentagevalue attached to each variable indicates the predicteddecrease in the classification performance if the vari-able were to be dropped from the model. The tableshows that the variables in the first two models, levelof giftedness and gender, have a clear order of impor-tance. The most important variable for both models isItem 12, “I had to work hard to get good grades.” If weremove that variable from the first model, it wouldweaken the performance from 65.4% to 58.4%.Removal of the variable from the second model wouldweaken the performance from 79.7% to 72.8%.
Differences in the group means in Table 5 show thatthe first classification between three groups of themathematically gifted is based on effort attributions asfive items out of seven measure success or failurebecause of effort. The first item, 10, “The smart kidstried the hardest,” is the best overall predictor variable.However, the other items are more interesting, asthey show that both mildly (Polytechnics) and moder-ately (Prefinalists) mathematically gifted individualsattribute failure to lack of effort, but only mildly math-ematically gifted individuals attribute success to effort.Highly (Olympians) and moderately (Prefinalists)
mathematically gifted individuals prefer ability as anexplanation for their success.
Females in this sample tend to attribute success toeffort more than males. Furthermore, they are alsomore likely to attribute failure to lack of ability thanmales. Both findings are consistent with existingresearch (e.g., Alderman, 2004; Vermeer, Boekaerts,& Seegers, 2000). However, we note that “femalevoice” in this study belongs to mostly those who aremathematically mildly gifted as they are members ofthe Polytechnics group. This explains at least tosome extent why items measuring effort have suchan important role in the first two classificationmodels.
Multivariate Analysis of Variance
We investigated the third research question, “Do theattribution styles differ by the level of mathematicalgiftedness) and gender?” with a 3 × 2 factorial multi-variate analysis of variance. The four dependent vari-ables were SaaS factors based on both theoreticalassumptions (Weiner, 1974) and the results of preced-ing EFA: success because of ability, failure because oflack of ability, success because of effort, and failurebecause of lack of effort. The independent variableswere the level of mathematical giftedness and gender.Preliminary assumption testing was conducted to checkfor normality, linearity, univariate, and multivariate out-liers; homogeneity of variance-covariance matrices;and multicollinearity. No violations were discoveredexcept for the fourth factor, failure because of lack ofeffort, for which the test of homogeneity of variancewas not met (Levene’s p < .001, Cochran’s p = .014,Bartlett-Box’s p = .002). Larger variances indicate thata .05 alpha level is overstated and the differences shouldbe assessed using a lower value (e.g., .03; Hair,Anderson, Tatham, & Black, 1998). For such depen-dent variables, Tabachnick and Fidell (1996) suggestusing Pillai’s criterion instead of Wilks’s lambda.
With the use of Pillai’s criterion, the level of mathe-matical giftedness multivariate main effect on the SaaSfactors was found to be significant, F(8, 384) = 4.33,p < .001. The gender multivariate main effect on theSaaS factors was not found to be significant, F(4, 191) =0.23, p = .992. The level of mathematical giftedness andgender multivariate interaction was not found to be sig-nificant, F(8, 384) = 0.45, p = .893. The resultsreflected a modest association between three groups ofmathematically gifted and the SaaS factors, partialη2 = .08 (Pillai’s trace) – .16 (Roy’s Largest Root). This
© 2007 National Association for Gifted Children. All rights reserved. Not for commercial use or unauthorized distribution. by guest on October 16, 2007 http://gcq.sagepub.comDownloaded from
76 Gifted Child Quarterly, Vol. 51, No. 1
finding suggests that group membership explains attri-bution styles from 8% to 16%. The achieved statisticalpower for this main effect was 1.0.
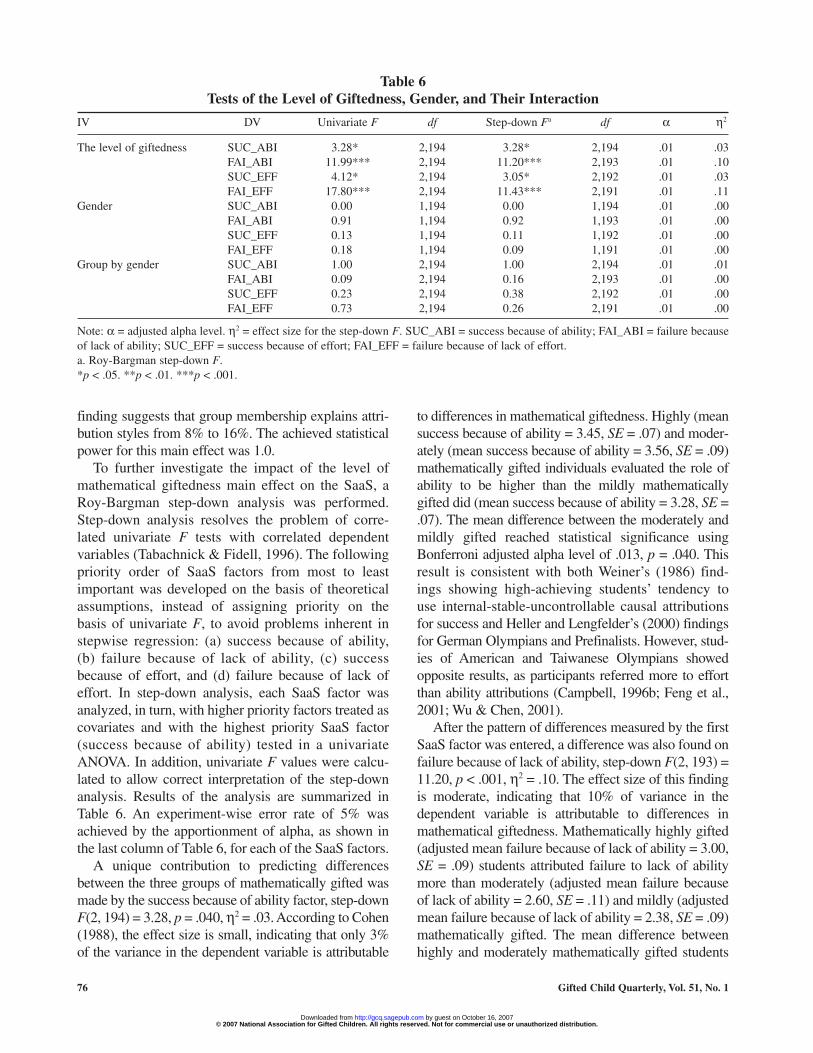
To further investigate the impact of the level ofmathematical giftedness main effect on the SaaS, aRoy-Bargman step-down analysis was performed.Step-down analysis resolves the problem of corre-lated univariate F tests with correlated dependentvariables (Tabachnick & Fidell, 1996). The followingpriority order of SaaS factors from most to leastimportant was developed on the basis of theoreticalassumptions, instead of assigning priority on thebasis of univariate F, to avoid problems inherent instepwise regression: (a) success because of ability,(b) failure because of lack of ability, (c) successbecause of effort, and (d) failure because of lack ofeffort. In step-down analysis, each SaaS factor wasanalyzed, in turn, with higher priority factors treated ascovariates and with the highest priority SaaS factor(success because of ability) tested in a univariateANOVA. In addition, univariate F values were calcu-lated to allow correct interpretation of the step-downanalysis. Results of the analysis are summarized inTable 6. An experiment-wise error rate of 5% wasachieved by the apportionment of alpha, as shown inthe last column of Table 6, for each of the SaaS factors.
A unique contribution to predicting differencesbetween the three groups of mathematically gifted wasmade by the success because of ability factor, step-downF(2, 194) = 3.28, p = .040, η2 = .03. According to Cohen(1988), the effect size is small, indicating that only 3%of the variance in the dependent variable is attributable
to differences in mathematical giftedness. Highly (meansuccess because of ability = 3.45, SE = .07) and moder-ately (mean success because of ability = 3.56, SE = .09)mathematically gifted individuals evaluated the role ofability to be higher than the mildly mathematicallygifted did (mean success because of ability = 3.28, SE =.07). The mean difference between the moderately andmildly gifted reached statistical significance usingBonferroni adjusted alpha level of .013, p = .040. Thisresult is consistent with both Weiner’s (1986) find-ings showing high-achieving students’ tendency touse internal-stable-uncontrollable causal attributionsfor success and Heller and Lengfelder’s (2000) findingsfor German Olympians and Prefinalists. However, stud-ies of American and Taiwanese Olympians showedopposite results, as participants referred more to effortthan ability attributions (Campbell, 1996b; Feng et al.,2001; Wu & Chen, 2001).
After the pattern of differences measured by the firstSaaS factor was entered, a difference was also found onfailure because of lack of ability, step-down F(2, 193) =11.20, p < .001, η2 = .10. The effect size of this findingis moderate, indicating that 10% of variance in thedependent variable is attributable to differences inmathematical giftedness. Mathematically highly gifted(adjusted mean failure because of lack of ability = 3.00,SE = .09) students attributed failure to lack of abilitymore than moderately (adjusted mean failure becauseof lack of ability = 2.60, SE = .11) and mildly (adjustedmean failure because of lack of ability = 2.38, SE = .09)mathematically gifted. The mean difference betweenhighly and moderately mathematically gifted students
Table 6Tests of the Level of Giftedness, Gender, and Their Interaction
IV DV Univariate F df Step-down Fa df α η2
The level of giftedness SUC_ABI 3.28* 2,194 3.28* 2,194 .01 .03FAI_ABI 11.99*** 2,194 11.20*** 2,193 .01 .10SUC_EFF 4.12* 2,194 3.05* 2,192 .01 .03FAI_EFF 17.80*** 2,194 11.43*** 2,191 .01 .11
Gender SUC_ABI 0.00 1,194 0.00 1,194 .01 .00FAI_ABI 0.91 1,194 0.92 1,193 .01 .00SUC_EFF 0.13 1,194 0.11 1,192 .01 .00FAI_EFF 0.18 1,194 0.09 1,191 .01 .00
Group by gender SUC_ABI 1.00 2,194 1.00 2,194 .01 .01FAI_ABI 0.09 2,194 0.16 2,193 .01 .00SUC_EFF 0.23 2,194 0.38 2,192 .01 .00FAI_EFF 0.73 2,194 0.26 2,191 .01 .00
Note: α = adjusted alpha level. η2 = effect size for the step-down F. SUC_ABI = success because of ability; FAI_ABI = failure becauseof lack of ability; SUC_EFF = success because of effort; FAI_EFF = failure because of lack of effort.a. Roy-Bargman step-down F.*p < .05. **p < .01. ***p < .001.
© 2007 National Association for Gifted Children. All rights reserved. Not for commercial use or unauthorized distribution. by guest on October 16, 2007 http://gcq.sagepub.comDownloaded from
Nokelainen et al. / Investigating the Influence of Attribution Styles 77
reached statistical significance using Bonferroniadjusted alpha level of .013, p = .028. Also, the meandifference between the highly and mildly mathemati-cally gifted reached statistical significance usingBonferroni adjusted alpha level of .013, p < .001. Thisinternal-stable-uncontrollable finding, which accordingto Marsh (1983) may lead to low academic self-conceptand achievement, is against Weiner’s internal-unstable-controllable expectation for high achievers who havefailed.
The third step in the analysis was to enter the suc-cess because of effort factor. This step-down reachedstatistical significance, however, with a small effectsize, F(2, 192) = 3.05, p < .05, η2 = .03. Mildly math-ematically gifted individuals valued success becauseof effort higher (adjusted mean success because ofeffort = 3.04, SE = .09) than those who were highly(adjusted mean success because of effort = 2.74, SE =.09) and moderately gifted (adjusted mean successbecause of effort = 2.79, SE = .10). The mean differ-ence between mildly and highly gifted studentsreached statistical significance using Bonferroniadjusted alpha level of .013, p = .029. This resultshowing mildly mathematically gifted Polytechnicspreferring internal-unstable-controllable attributionswas expected.
After the pattern of differences measured by suc-cess because of ability, failure because of lack of abil-ity, and success because of effort was entered, adifference was also found on the attitude toward fail-ure because of lack of effort, step-down F(2, 191) =11.43, p < .001, η2 = .11. According to Cohen (1988),the effect size for this finding is classified as large.Mildly (adjusted mean failure because of lack of effort =3.99, SE = .11) and moderately (adjusted mean failurebecause of lack of effort = 3.77, SE = .12) mathemat-ically gifted students attributed failure to lack of effortmore than the highly gifted did (adjusted mean failurebecause of lack of effort = 3.27, SE = .11). The meandifference between mildly gifted Polytechnics andhighly gifted Olympians reached statistical signifi-cance using Bonferroni adjusted alpha level of .013,p < .001. In addition, the mean difference between mod-erately gifted Prefinalists and highly gifted Olympiansreached statistical significance using Bonferroniadjusted alpha level of .013, p < .001. The group-levelresults of this second SaaS failure factor were notcongruent with theoretical expectations. We expectedto see mildly gifted individuals prefer internal-stable-uncontrollable attributions—that is, failure because
of lack of ability—instead of internal-unstable-controllable.
Summary of Results
In this article, we have examined the influence ofattribution styles on the development of mathematicaltalent in three groups of mathematically giftedFinnish adolescents and adults (N = 203).
All the participants completed the SaaS question-naire (Campbell, 1996a). The instrument included 18items, based on Weiner’s (1974) attribution theory,measuring the students’ ability and effort attributionson four dimensions: (a) success because of ability,(b) failure because of lack of ability, (c) success becauseof effort, and (d) failure because of lack of effort.
The research questions in this study were asfollows: (a) Are the four dimensions of the SaaS instru-ment (success because of ability, failure because oflack of ability, success because of effort, and failurebecause of lack of effort) present in the empirical sam-ple? (b) What are the best predictors for the level ofmathematical giftedness and gender among the SaaSscale variables? and (c) Do the attribution styles differby the level of mathematical giftedness (Olympians,Prefinalists, and Polytechnics) or gender?
The first research question was addressed withEFA. The results showed that the four dimensions ofthe SaaS were present in all samples. The overallalpha values ranged from .62 to .82. Three alpha val-ues were less than .60 in the group level (Olympians,Factor 2 alpha = .56; Polytechnics, Factor 2 alpha =.59 and Factor 3 alpha = .42).
The second research question was analyzed usingBayesian classification modeling. The classificationvariables were the level of mathematical giftedness(high = Olympians, moderate = Prefinalists, and mild =Polytechnics) and gender. Eighteen SaaS items werepredictors in all the analyses. The results showed thatboth Polytechnic students and females think that they“had to work hard to get good grades.” When we fur-ther examined the females’ preference for effort as acause for success, we learned that the result was trueonly for the Polytechnics and Prefinalists samples, asthere was no difference between female and maleOlympians’ responses. Thus, Verna and Campbell’s(2000) earlier finding that female Chemistry Olympiansconsidered ability to be a more important factor forsuccess was not repeated in this study. Failure becauseof lack of ability was the only self-attribute scale that
© 2007 National Association for Gifted Children. All rights reserved. Not for commercial use or unauthorized distribution. by guest on October 16, 2007 http://gcq.sagepub.comDownloaded from
78 Gifted Child Quarterly, Vol. 51, No. 1
was able to predict respondent’s age. The youngeststudents (15 to 28 years old) believed more in theirabilities than the older ones (29 to 41 and 42 to 55years old). We explain this finding with the fact thatthe younger individuals have not yet reached as higha level in their mathematical studies as the older onesand thus realized that “the more you know, the moreyou know you ought to know.”
The third research question was analyzed with a 3 ×2 factorial design MANOVA. Dependent variableswere four SaaS factors (success because of ability, fail-ure because of lack of ability, success because of effort,and failure because of lack of effort). Independent vari-ables were the level of mathematical giftedness (high =Olympians, moderate = Prefinalists, and mild =Polytechnics) and gender. Results showed that thelevel of mathematical giftedness multivariate maineffect on the SaaS factors was found to be signifi-cant. The gender multivariate main effect on the SaaSfactors and the level of mathematical giftedness andgender multivariate interaction were not found tobe significant. Highly and moderately mathematicallygifted individuals felt that ability is more important tosuccess than effort. According to Dai et al. (1998),such attributions represent self-awareness of highpotentialities that constitute a necessary but not suffi-cient condition for high levels of performance. Mildlymathematically gifted individuals tended to see effortleading to success. Mildly and moderately mathemati-cally gifted students attributed failure to lack of effort.The highly gifted attributed failure to lack of ability.This finding is related to self-concept, as mildly andmoderately mathematically gifted individuals tendto judge their efficacy favorably, whereas the highlygifted are likely to base their appraisals of self-efficacyon the actual difficulty levels of the tasks in question(see Dai et al., 1998, for discussion).
Limitations of the Study
In this study, we measured attribution styles with aquestionnaire. Such self-reporting allows us to study, asopposed to attribution appraisals or causal beliefs,hypothetical success and failure situations without clearreference to who is the performer. The first possiblesource of error is the SaaS instrument translation fromEnglish to Finnish. To control the error variancebecause of translation, all the items were retranslatedback to English and compared with the original items.
However, no pilot study with correlational analyses wasconducted. A second possible source of error is cross-cultural differences between U.S. and Finnish mathe-maticians, as the original instrument was developed forstudies among the U.S. mathematics Olympians.Fortunately, the language of the SaaS items is free ofcultural references. A third possible source of error isthe psychometric properties of the SaaS instrumentitself, as no alpha values were reported in the originalstudy (Campbell, 1996a).
Discussion
The theoretical idea of Ellström (2001) essential tothis study is that attributions for success or failure affectpotential competence, which is a human resource eachindividual brings to the mathematical problem-solvingsituation. So what are the “good” attributions that giverise to individual’s potential competence? The previousresearch body shows two trends: The first is seeing abil-ity as a more important explanation for success thaneffort (e.g., “ability is everything”; e.g., Heller &Lengfelder, 2000), and another is claiming that “abilitywithout effort goes nowhere” (e.g., Campbell, 1996b;Chan, 1996; Feng et al., 2001; Wu & Chen, 2001).
Why do several international Academic Olympianresearch teams end up with contradictory results?The first natural explanation is cultural differences(Campbell, Tirri, Ruohotie, & Walberg, 2004). Wesuggest here that the second natural explanation isstatistical. In all of the aforementioned studies, effortand ability attributions were calculated as mean scoresof 18 SaaS items: the Effort scale was measured with12 items and the Ability scale with 6 items (see Table 2).The results of variable selection and EFA indicated that,in the Finnish sample, keeping all 18 SaaS items on themodel does not lead to a psychometrically justifiedsolution (αeffort = .63 and αability = .27). We forced thetwo-factor solution and calculated internationally com-parable mean scores for the Finnish Olympian sample(n = 77) but found no difference between ability (M =3.16, SD = 0.32) and effort attributions (M = 3.18, SD= 0.45). It should also be noted that the reported meandifference between Ability (M = 2.91, SD = 0.58) andEffort (M = 3.21, SD = 0.62) scales in the Americanstudy (Campbell, 1996b) is quite small.
The third trend in research (e.g., Schunk & Ertmer,2000; Zimmermann, 2000) says that ability and effortwithout self-regulation goes nowhere. Figure 1 shows
© 2007 National Association for Gifted Children. All rights reserved. Not for commercial use or unauthorized distribution. by guest on October 16, 2007 http://gcq.sagepub.comDownloaded from
Nokelainen et al. / Investigating the Influence of Attribution Styles
that ability is present in the “Self-Reflection” phase thatprecedes the “Forethought” phase, where individualsset goals and plan actions. At this point, it is importantto make a distinction between an individuals’ real andself-perceived ability level. The real ability level is whatthe first research trend is speaking about, but accordingto the concept of self-regulation, it is undistinguishablefrom the self-perceived ability. This notion comes fromthe fact that effort is represented in the preceding phase,“Performance or Volitional Control,” in the cyclicalself-regulation process described in Figure 1 via self-control. It is therefore sending adjusting signals via self-observation to the individual’s self-perceived ability.Our results that show highly mathematically gifted pre-ferring ability over effort as an explanation for successor failure might indicate that their perceived abilitylevel is so high that they are able to meet the mostdemanding challenges by adjusting their efforts.According to the “attribution asymmetry” phenomenon(Dai et al., 1998), high-ability students tend to attributetheir success to both ability and effort. According tothem, attributing success to ability represents self-awareness of high potentialities that constitute a neces-sary but not sufficient condition for success. Attributingsuccess to effort has a self-enhancing and motivatingeffect, as one feels in control of one’s own development.
It is not our primary purpose to compare ability andeffort only with questions that ask “Which is a betterexplanation for success?” but rather to continue withfurther questions, such as “What are the best develop-mental practices for those individuals who mostly pre-fer effort over ability as an explanation for success in agiven task?” As Campbell (1995) says, “achievers needfour qualities: ability, discipline, confidence and goodworking habits” (p. 186). Thus, a high effort level as acause for success may indicate that tasks are toodemanding and thus individuals feel that too mucheffort is needed to accomplish the task. Furthermore,this might indicate that an individual needs more sup-port to be convinced that he or she has the ability to suc-ceed. Research has shown that ability is often viewed asa stable and uncontrollable attribution (e.g., SaaS Item7, “You have to have the ability in order to succeed inmost things”). The worst scenario for a mathematicianaccording to some of the self-attribution theorists (e.g.,Dweck, 1999) is to blame personal ability for failure, asit is believed to be something that you either do or donot have, an internal and stable attribution. It is inter-esting that the most highly mathematically gifted in thisstudy scored highest in this respect when comparedto those who were moderately and mildly gifted. This
finding makes sense if we agree that Olympians repre-sent the highest mathematical giftedness level in thisstudy and thus have probably faced a lot more demand-ing mathematical tasks during their lifetime than theother two group members.
Kay Alderman (2004) suggests that it is up to theteacher or trainer to convince a learner or trainee thatmathematical thinking ability as a skill or knowledgeis a learnable, unstable quality. Thus, knowledge ofhow learners or trainees use attributions to accountfor success and failure can help teachers or trainerspredict their expectancies and plan interventionstrategies when needed.
© 2007 National Association for Gifted Children. All rights rhttp://gcq.sagepDownloaded from
References
Alderman, K. (2004). Motivation for achievement. Possibilitiesfor teaching and learning. Mahwah, NJ: Lawrence Erlbaum.
Biggs, J. (1985). The role of metalearning in study processes.British Journal of Educational Psychology, 55, 185-212.
Bradley, W. J., & Schaefer, K. C. (1998). The uses and misuses ofdata and models. Thousand Oaks, CA: Sage.
Campbell, J. R. (1994). Developing cross-cultural/cross-nationalmethods and procedures. International Journal of EducationalResearch, 21(7), 675-684.
Campbell, J. R. (1995). Raising your child to be gifted.Cambridge, MA: Brookline Books.
Campbell, J. R. (1996a). Developing cross-national instruments:Using cross-national methods and procedures. InternationalJournal of Educational Research, 25(6), 485-496.
Campbell, J. R. (1996b). Early identification of mathematics talenthas long-term positive consequences for career contributions.International Journal of Educational Research, 25(6), 497-522.
Campbell, J. R., Tirri, K., Ruohotie, P., & Walberg, H. (Eds.).(2004). Cross-cultural research: Basic issues, dilemmas, andstrategies. Hämeenlinna, Finland: RCVE.
Chan, L. (1996). Motivational orientations and metacognitiveabilities of intellectually gifted students. Gifted ChildQuarterly, 40, 184-193.
Cohen, J. (1988). Statistical power analysis for the behavioralsciences (2nd ed.). Hillsdale, NJ: Lawrence Erlbaum.
Dai, D. Y., Moon, S. M., & Feldhusen, J. F. (1998). Achievementmotivation and gifted students: A social cognitive perspective.Educational Psychologist, 33(2/3), 45-63.
Dweck, C. (1999). Self theories: Their role in motivation, per-sonality and development. Philadelphia: Psychology Press.
Ellström, P.- E. (2001). The many meanings of occupational com-petence and qualification. In W. J. Nijhof & J. N. Streumer(Eds.), Key qualifications in work and education (pp. 39-50).Dordrecht, the Netherlands: Kluwer Academic.
Enman, M., & Lupart, J. (2000). Talented female students’ resis-tance to science: An exploratory study of post-secondaryachievement motivation, persistence, and epistemologicalcharacteristics. High Ability Studies, 11(2), 161-178.
Feng, A., Campbell, J. R., & Verna, M. (2001). The talent devel-opment of American Physics Olympians. Gifted and TalentedInternational, 16(2), 108-114.
79
eserved. Not for commercial use or unauthorized distribution. by guest on October 16, 2007 ub.com
Hair, J. F., Anderson, R. E., Tatham R. L., & Black, W. C. (1998).Multivariate data analysis (5th ed.). Englewood Cliffs, NJ:Prentice Hall.
Heider, F. (1958). The psychology of interpersonal relationships.New York: Wiley.
Heller, K., & Lengfelder, A. (2000, April). German Olympiadstudy on mathematics, physics and chemistry. Paper presentedat the annual meeting of American Educational ResearchAssociation, New Orleans, LA.
Hilario, M., Kalousisa, A., Pradosa, J., & Binzb, P.- A. (2004).Data mining for mass-spectra based diagnosis and biomarkerdiscovery. Drug Discovery Today: BIOSILICO, 2(5), 214-222.
Hsu, W. H. (2004). Genetic wrappers for feature selection indecision tree induction and variable ordering in Bayesiannetwork structure learning. Information Sciences, 163(1-3),103-122.
Huberty, C. (1994). Applied discriminant analysis. New York:John Wiley & Sons.
Kerlinger, F. (1986). Foundations of behavioral research (3rded.). New York: CBS College Publishing.
Kerr, B. (1994). Smart girls: A new psychology of girls, women andgiftedness (2nd ed.). Scottsdale, AZ: Gifted Psychology Press.
Marsh, H. (1983). Relationships among dimensions of self-attribution, dimensions of self-concept and academic achieve-ments. (ERIC Document Reproduction Service No. ED 243 914)
Marsh, H., & O’Neill, R. (1984). Self Description QuestionnaireIII: The construct validity of multidimensional self-conceptratings by late adolescents. Journal of Educational Measure-ment, 21, 153-174.
Multon, K. D., Brown, S. D., & Lent, R. W. (1991). Relation ofself-efficacy beliefs to academic outcomes: A meta-analyticinvestigation. Journal of Counseling Psychology, 38, 30-38.
Myllymäki, P., Silander, T., Tirri, H., & Uronen, P. (2002). B-Course: A Web-based tool for Bayesian and causal data analy-sis. International Journal on Artificial Intelligence Tools,11(3), 369-387.
Nokelainen, P., Ruohotie, P., & Tirri, H. (1999). Professional growthdeterminants—Comparing Bayesian and linear approachesto classification. In P. Ruohotie, H. Tirri, P. Nokelainen, &T. Silander (Eds.), Modern modeling of professional growth(Vol. 1, pp. 85-120). Hämeenlinna, Finland: RCVE.
Nokelainen, P., & Tirri, H. (2004). Bayesian methods that opti-mize cross-cultural data analysis. In J. R. Campbell, K. Tirri,P. Ruohotie, & H. Walberg (Eds.), Cross-cultural research:Basic issues, dilemmas, and strategies (pp. 141-158).Hämeenlinna, Finland: RCVE.
Nokelainen, P., Tirri, K., & Campbell, J. R. (2004). Cross-culturalpredictors of mathematical talent and academic productivity.High Ability Studies, 15(2), 230-242.
Nokelainen, P., Tirri, K., Campbell, J. R., & Walberg, H. (2004).Isolating factors that contribute or hinder adult productivity:Comparing the Terman longitudinal studies with the retro-spective Olympiad studies. In J. R. Campbell, K. Tirri,P. Ruohotie, & H. Walberg (Eds.), Cross-cultural research:Basic issues, dilemmas, and strategies (pp. 119-140).Hämeenlinna, Finland: RCVE.
Organization for Economic Co-Operation and Development.(2001). Knowledge and skills for life. first results from theOECD Programme for International Student Assessment(PISA) 2000. Paris: Author.
80
© 2007 National Association for Gifted Children. All rights reshttp://gcq.sagepubDownloaded from
Organization for Economic Co-Operation and Development.(2004). Learning for tomorrow’s world. First results fromPISA 2003. Paris: Author.
Ramsden, P., & Entwistle, N. (1981). Effects of academic depart-ments on students’ approaches to studying. British Journal ofEducational Psychology, 51, 368-383.
Reis, S. (1998). Work left undone. Mansfield Center, CT: CreativeLearning Press.
Ruohotie, P., & Nokelainen, P. (2000). Modern modeling of studentmotivation and self-regulated learning. In P. R. Pintrich &P. Ruohotie (Eds.), Conative constructs and self-regulatedlearning (pp. 141-193). Hämeenlinna, Finland: RCVE.
Schunk, D. H., & Ertmer, P. A. (2000). Self-regulation and acad-emic learning. In M. Boekaerts, P. R. Pintrich, & M. Zeidner(Eds.), Handbook of self-regulation (pp. 631-650). San DiegoCA: Academic Press.
Siegle, D., & Reis, S. (1998). Gender differences in teacher andstudent perceptions of gifted students’ ability and effort.Gifted Child Quarterly, 42(1), 39-47.
Silander, T., & Tirri, H. (1999). Bayesian classification. InP. Ruohotie, H. Tirri, P. Nokelainen, & T. Silander (Eds.),Modern modeling of professional growth (Vol. 1, pp. 61-84).Hämeenlinna, Finland: RCVE.
Silander, T., & Tirri, H. (2000, April). Model selection for Bayesiannetworks. Paper presented at the annual meeting of AmericanEducational Research Association, New Orleans, LA.
Strein, W. (1995). Assessment of self-concept. (ERIC DocumentReproduction Service No. ED 389 962)
Tabachnick, B., & Fidell, L. (1996). Using multivariate statistics.New York: HarperCollins.
Tirri, K. (2001). Finland Olympiad studies: What factors con-tribute to the development of academic talent in Finland?Educating Able Children, 5(2), 56-66.
Tirri, K. (2002). Developing females’ talent: Case studies of FinnishOlympians. Journal of Research in Education, 12(1), 80-85.
Tirri, K., & Campbell, J. (2002). Actualizing mathematical gift-edness in adulthood. Educating Able Children, 6(1), 14-20.
Vermeer, H. J., Boekaerts, M., & Seegers, G. (2000).Motivational and gender differences: Sixth-grade students’mathematical problem-solving behavior. Journal ofEducational Psychology, 92, 308-315.
Verna, M., & Campbell, J. R. (2000, April). Career orientations forAmerican chemistry Olympians. Paper presented at the annualmeeting of American Educational Research Association, NewOrleans, LA.
Weiner, B. (1974). Achievement motivation and attributiontheory. Morristown, NJ: General Learning Press.
Weiner, B. (1980). The role of affect in rational (attributional)approaches to human motivation. Educational Researcher, 9,4-11.
Weiner, B. (1986). An attributional theory of motivation andemotion. New York: Springer.
Weiner, B. (1992). Human motivation: Metaphors, theories andresearch. Newbury Park, CA: Sage.
Weiner, B. (1994). Integrating social and personal theories ofachievement striving. Review of Educational Research, 64,557-573.
Weiner, B. (2000). Intrapersonal and interpersonal theories ofmotivation from an attributional perspective. EducationalPsychology Review, 12(1), 1-14.
Gifted Child Quarterly, Vol. 51, No. 1
erved. Not for commercial use or unauthorized distribution. by guest on October 16, 2007 .com
Wu, W., & Chen, J. (2001). A follow-up study of Taiwan physics andchemistry Olympians: The role of environmental influences in tal-ent development. Gifted and Talented International, 16(1), 16-26.
Zimmerman, B. J. (1998). Developing self-fulfilling cyclesof academic regulation: An analysis of exemplary instruc-tional models. In D. H. Schunk & B. J. Zimmerman (Eds.),Self-regulated learning: From teaching to self-reflective prac-tice (pp. 1-19). New York: Guilford.
Zimmerman, B. J. (2000). Attaining self-regulation. A socialcognitive perspective. In M. Boekaerts, P. R. Pintrich, &M. Zeidner (Eds.), Handbook of self-regulation (pp. 13-39).San Diego, CA: Academic Press.
Petri Nokelainen, Ed. Lic., is a special researcher at the ResearchCentre for Vocational Education, University of Tampere, Finland.
Nokelainen et al. / Investigating the Influence of Attribution Styles
© 2007 National Association for Gifted Children. All rights resehttp://gcq.sagepub.cDownloaded from
His research interest lies in the study of applied statistical model-ing, gifted education, modern network-based learning, and profes-sional growth.
Kirsi Tirri is a professor at the Department of PracticalTheology,University of Helsinki, Finland. Her research interestsinclude gifted education, teacher training, moral education, andcross-cultural studies.
Hanna-Leena Merenti-Välimäki is a principal lecturer of math-ematics at the Espoo-Vantaa Institute of Technology. Her researchinterests include mathematical education, mathematical model-ing, and statistical and technical analysis.
81
rved. Not for commercial use or unauthorized distribution. by guest on October 16, 2007 om


![Controllable Sliding Bearings and Controllable Lubrication ... · Review Controllable Sliding Bearings and Controllable ... or evolutionary [5], but it does not change the fact that](https://img.pdfslide.net/doc/110x75/5fc50df11ca4e1756528a85b/controllable-sliding-bearings-and-controllable-lubrication-review-controllable.jpg)