Embed Size (px)
Citation preview

Gilham, C; Rake, C; Hodgson, J; Darnton, A; Burdett, G; Peto Wild,J; Newton, M; Nicholson, AG; Davidson, L; Shires, M; Treasure, T;Peto, J; TIPS Collaboration, (2018) Past and current asbestos expo-sure and future mesothelioma risks in Britain: The Inhaled ParticlesStudy (TIPS). International journal of epidemiology. ISSN 0300-5771DOI: https://doi.org/10.1093/ije/dyx276
Downloaded from: http://researchonline.lshtm.ac.uk/4646993/
DOI: 10.1093/ije/dyx276
Usage Guidelines
Please refer to usage guidelines at http://researchonline.lshtm.ac.uk/policies.html or alterna-tively contact [email protected].
Available under license: http://creativecommons.org/licenses/by/2.5/

Original article
Past and current asbestos exposure and future
mesothelioma risks in Britain: The Inhaled
Particles Study (TIPS)
Clare Gilham,1 Christine Rake,1 John Hodgson,2 Andrew Darnton,2
Garry Burdett,3 James Peto Wild,1 Michelle Newton,4
Andrew G Nicholson,5 Leslie Davidson,6 Mike Shires,7 Tom Treasure8
and Julian Peto;1* for the TIPS Collaboration
1London School of Hygiene and Tropical Medicine, London, UK, 2Health and Safety Executive, Bootle,
UK, 3Health and Safety Laboratory, Buxton, UK, 4Department of Cardiovascular Sciences, University of
Leicester, UK, 5Department of Histopathology, Royal Brompton and Harefield Hospitals NHS Foundation
Trust, and National Heart and Lung Institute, Imperial College, London, UK, 6Department of Cellular
Pathology, Leeds Teaching Hospitals NHS Trust, Leeds, UK, 7Leeds Institute of Cancer and Pathology,
University of Leeds, UK and 8Clinical Operational Research Unit, University College Hospital, London, UK
*Corresponding author. Faculty of Epidemiology and Population Health, London School of Hygiene and Tropical Medicine,
Keppel St, London WC1E 7HT, UK. E-mail: [email protected]
Editorial decision 4 December 2017; Accepted 15 December 2017
Abstract
Background: Occupational and environmental airborne asbestos concentrations are too
low and variable for lifetime exposures to be estimated reliably, and building workers and
occupants may suffer higher exposure when asbestos in older buildings is disturbed or
removed. Mesothelioma risks from current asbestos exposures are therefore not known.
Methods: We interviewed and measured asbestos levels in lung samples from 257 pa-
tients treated for pneumothorax and 262 with resected lung cancer, recruited in England
and Wales. Average lung burdens in British birth cohorts from 1940 to 1992 were esti-
mated for asbestos-exposed workers and the general population.
Results: Regression analysis of British mesothelioma death rates and average lung
burdens in birth cohorts born before 1965 suggests a lifetime mesothelioma risk of ap-
proximately 0.01% per fibre/mg of amphiboles in the lung. In those born since 1965, the
average lung burden is �1 fibre/mg among those with no occupational exposure.
Conclusions: The average lifetime mesothelioma risk caused by recent environmental
asbestos exposure in Britain will be about 1 in 10 000. The risk is an order of magnitude
higher in a subgroup of exposed workers and probably in occupants in the most conta-
minated buildings. Further data are needed to discover whether asbestos still present in
buildings, particularly schools, is a persistent or decreasing hazard to workers who dis-
turb it and to the general population, and whether environmental exposure occurs pre-
dominantly in childhood or after beginning work. Similar studies are needed in other
VC The Author(s) 2018. Published by Oxford University Press on behalf of the International Epidemiological Association. 1
This is an Open Access article distributed under the terms of the Creative Commons Attribution License (http://creativecommons.org/licenses/by/4.0/), which permits
unrestricted reuse, distribution, and reproduction in any medium, provided the original work is properly cited.
International Journal of Epidemiology, 2018, 1–12
doi: 10.1093/ije/dyx276
Original article
Downloaded from https://academic.oup.com/ije/advance-article-abstract/doi/10.1093/ije/dyx276/4925430by London School of Hygiene & Tropical Medicine useron 15 March 2018

countries to estimate continuing environmental and occupational mesothelioma hazards
worldwide, including the contribution from chrysotile.
Introduction
Britain’s mesothelioma rate is the highest worldwide and is
still rising above age 70.1 Former construction workers,
particularly carpenters, plumbers and electricians, are the
main high-risk group.2 Most mesotheliomas develop more
than 35 years after first asbestos exposure, so almost all re-
cent cases are due to exposure before 1980 when asbestos
was widely used, and only three of the 2542 mesothelioma
deaths in Britain in 2015 were born after 1975.1 Building
workers may still suffer substantial exposure when asbes-
tos in older buildings is disturbed or removed, and the gen-
eral population are potentially exposed in such buildings.
However, the resulting mesothelioma risks are not known,
as current occupational and environmental airborne con-
centrations are too low and variable for lifetime exposures
to be estimated reliably. The aims of The Inhaled Particle
Study (TIPS) were to determine whether the linear relation-
ship between mesothelioma risk and asbestos lung burden
in individuals3 is also seen in national mesothelioma death
rates and population average burdens, and hence to predict
future occupational and environmental mesothelioma rates
from the lung burdens of exposed workers and of the gen-
eral population born since 1965 who started work after
1980, when use of asbestos had virtually ceased in the UK.
Chrysotile (white asbestos) fibres are ignored in our ana-
lyses which are based on amphibole fibres, mainly amosite
(brown asbestos) and crocidolite (blue asbestos).
Chrysotile causes a much lower mesothelioma risk than
the amphiboles,4–6 but its effect cannot be estimated from
our data because its half-life in the lung is too short3 for
lung burden to reflect lifetime exposure. Chrysotile consti-
tuted 88% of UK asbestos imports between 1955 and
1990 but only 2% of asbestos fibres in the lungs of men
with mesothelioma or lung cancer, born 1940–64.3
Whatever its effect, therefore, the dose-response estimate
based on all asbestos fibres in the lung would be virtually
the same as our estimate for amphiboles.
Materials and Methods
The study was approved by South Thames Multicentre
Research Ethics Committee.
Lifetime occupational histories were obtained by tele-
phone interview from resected lung cancer and mesotheli-
oma patients in a national case-control study as previously
described,2,7 and also from 1005 unselected pneumothorax
patients (648 men, 357 women) born between 1918 and
1996, recruited from 13 hospital centres in England and
Wales. All eligible pneumothorax patients (aged 18 or
over, with retained lung samples obtained at operation
within the past 10 years) identified in these centres were
invited by the local clinician to take part in a telephone
interview. Overall 42% replied agreeing to be interviewed,
of whom 91% gave consent for their lung material to be
analysed. The lung burden study was restricted to partici-
pants born in 1940 or later. Normal lung tissue for trans-
mission electron microscopy (TEM) analysis was excised
from residual stored material from 262 lung cancers
Key Messages
• Occupational and environmental mesothelioma risks from asbestos in older buildings are not known. Airborne con-
centrations are too low and variable for lifetime exposures to be estimated reliably, and mesothelioma rarely de-
velops within 35 years of beginning asbestos exposure.
• British mesothelioma death rates are proportional to the population’s average amphibole asbestos lung burden (life-
time risk 0.01% per fibre/mg).
• Occupational and environmental risks can therefore be predicted from the distribution of asbestos lung burdens in
people who began work since the 1980s, when asbestos was no longer used.
• The lifetime mesothelioma risk from environmental exposure among people born since 1965 will be �1 in 10 000, 10-
fold less than in older people and almost 1000-fold less than in carpenters born in the 1940s. The risk is an order of
magnitude higher in a subgroup of exposed workers.
• Further data are needed to discover whether asbestos in buildings, particularly schools, is a persisting or decreasing
hazard.
2 International Journal of Epidemiology, 2018, Vol. 0, No. 0
Downloaded from https://academic.oup.com/ije/advance-article-abstract/doi/10.1093/ije/dyx276/4925430by London School of Hygiene & Tropical Medicine useron 15 March 2018

resected in 1999–2010 and at subsequent postmortem
from 133 pleural mesothelioma patients in a previous
study,3 and from 271 pneumothorax patients surgically
treated in 2002–10 (a random sample of 251 stratified by
year of birth, sex and centre and 20 additional men born
since 1965 who had worked in construction). Asbestos
fibres longer than 5 mm were counted by transmission elec-
tron microscopy (TEM). The analytical detection limit
(lung burden per counted fibre) was reduced from 10 to
3.3 f/mg (fibres per milligram of dry lung) for the 165
(90%) pneumothorax patients born since 1965 with suffi-
cient material available. Job titles were assigned to
Standard Occupational Classification 1990 (SOC 90) and
grouped into categories of similar mesothelioma risk, as in
our case-control study.2 Subjects were assigned to the high-
est risk job category they had worked in irrespective of
duration. We classified those who had ever worked in any
of the five categories with elevated mesothelioma odds
ratios in our case-control study,2 as having occupational
exposure (carpenters; plumbers, electricians and painters;
other construction workers; other high-risk work; and me-
dium risk). Those who worked in none of these jobs are
referred to as environmentally exposed, which includes
any exposures from buildings they worked in. The Health
and Safety Executive provided cumulative mesothelioma
mortality rates to age 50 years in England, Scotland and
Wales for each birth cohort from 1940–44 to 1960–64.
Statistical methods
The distribution of lung burden is approximately lognor-
mal (Figure 1) and fibre counts are modelled as Poisson.
Mean population lung burdens in different subgroups in
Tables 1 and 2 were therefore estimated by maximizing
the Poisson-lognormal likelihood. Mean asbestos lung
burdens in the general population born before 1965 were
estimated using samples from lung cancer and pneumo-
thorax cases. Asbestos increases lung cancer risk, so our
analysis adjusts for this, using the previously estimated3
increase in lung cancer risk ratio (RR) with lung burden
(0.00255 per f/mg) to estimate mean lung burden in the
population from the observed levels in lung cancer pa-
tients. The linear relationship between cumulative meso-
thelioma mortality to age 50 and population mean lung
burden was also estimated by maximum likelihood. To es-
timate the increase per f/mg in lifetime risk (defined as the
actuarial probability of dying of mesothelioma by age
90), the slope was multiplied by 51.8, the ratio of pro-
jected lifetime risk to observed risk by age 50 in men. The
statistical appendix gives further details. All tables, figures
and analyses are restricted to amphibole fibres, except
Table 3 and Figure 3 which also show chrysotile lung
burdens.
Results
In men, the average amphibole lung burden fell from 62
f/mg (born 1940–44) to 11 f/mg (born 1960–64) and meso-
thelioma risk per million to age 50 fell from 184 to 35
(Table 1, Figure 2a). In women, the average lung burden
fell from 18 f/mg (born 1940–44) to 9 f/mg (born 1960–
64) and their risk per million to age 50 fell from 33 to 16.
The dose-specific mesothelioma risk to age 50 estimated
from these data is 0.00032% per f/mg [95% confidence
interval (CI) 0.00026%, 0.00040%)] for men and
0.00019% per f/mg (95% CI 0.00014%, 0.00024%) for
women (P < 0.002). Average lung burdens unadjusted for
asbestos-related lung cancer risk for those born 1940–64
are shown in Table 1 footnote a. (Only one lung cancer pa-
tient was born after 1964.) The adjustment has a material
impact only for men born before 1955.
Table 2 and Figure 2b show lung burdens by year of
birth and highest risk occupation. For environmental ex-
posure (those who never worked in hazardous occupa-
tions), burdens were much lower and were similar in men
and women. In those born 1940–64, the proportion with
lung burdens exceeding 200 f/mg was 19% (14/75) among
men who worked in the three highest risk categories (car-
penters; plumbers, electricians and painters; other high-
risk occupations), 2% (3/152) among other men and 1%
(1/109) among women. None exceeded 60 f/mg in those
born since 1965. Table 3 shows counts for each fibre type
and unadjusted lung burdens for all amphiboles and
chrysotile by year of birth, sex and occupation. In men, the
overall distribution of counted fibres was 75% amosite,
Figure 1. Approximately lognormal distribution of amphibole lung bur-
dens in male mesothelioma, lung cancer and pneumothorax patients
born 1940–64. Values < 5 f/mg are recoded as 0.01 f/mg, including 5/106
mesothelioma, 35/181 lung cancer and 14/46 pneumothorax samples in
which no fibres were counted.
International Journal of Epidemiology, 2018, Vol. 0, No. 0 3
Downloaded from https://academic.oup.com/ije/advance-article-abstract/doi/10.1093/ije/dyx276/4925430by London School of Hygiene & Tropical Medicine useron 15 March 2018

13% crocidolite, 9% other amphiboles and 3% chrysotile,
and in women 52% amosite, 11% crocidolite, 23% other
amphiboles and 14% chrysotile. Fibre type differed be-
tween occupational groups, carpenters having the highest
proportion of amosite (90.8%) and the lowest of crocido-
lite (0.4%). Chrysotile concentrations were uniformly low
and showed no consistent relationship with occupation or
gender.
People born in 1965–74 began work after 1980 when
amosite materials were no longer being installed. Their
average lung burden was as low in carpenters (1.8 f/mg) as
in unexposed men and women (1.7 f/mg) but remained
substantially higher among plumbers, painters and electri-
cians (9.1 f/mg: Table 2, Figure 2b). Figure 3 shows that
crocidolite burdens fell sharply in men born after 1950,
about 5 years earlier than amosite.
Discussion
Trends in lung burden and dose-specific risk in
those born before 1965
Average lung burdens in men born 1940–54 (Table 2) re-
flect the ranking of occupational and environmental rela-
tive risks seen in our case-control study2 (154 f/mg in
carpenters, 88 f/mg in plumbers, electricians and decor-
ators, 60 f/mg in other high-risk occupations (including
shipbuilding and lagging), 49 f/mg in medium-risk (mainly
factory) work and 30 f/mg in general construction). Lung
burdens in those born 1940–54 with environmental expos-
ure only were similar in men and women (average
17 f/mg). Occupationally exposed women had a similar
level (14 f/mg, 95% CI 8, 31). Occupational and environ-
mental lung burdens were substantially lower in those
born 1955–64 but show a similar pattern.
Regression analysis of the parallel decline in mesotheli-
oma mortality and average amphibole lung burden in male
birth cohorts from 1940–44 to 1960–64 (Figure 2a,
Table 1) gives a cumulative risk by age 50 in men of
0.00032% per f/mg. Multiplying by 51.8 (see Statistical
Methods) gives a lifelong mortality of 0.017% per f/mg,
close to the lifetime incidence of 0.020% per f/mg esti-
mated from case-control analysis of lung burdens in male
mesothelioma patients.3 However, the male data are domi-
nated by a heavily exposed minority. The estimated in-
crease in lung cancer RR from our case-control study
(0.00255 per f/mg) is very imprecise,3 and adjusting for it
substantially reduced the estimated average lung burdens
of men born before 1955 (see Table 1 footnote a). Lung
burdens in women are much lower and are hardly altered
by the adjustment. Therefore we believe that the female es-
timate of the risk per f/mg (0.00019% by age 50, lifetime
risk 0.010%) provides a more reliable indication of future
mesothelioma rates in both sexes from recent exposure,
which is predominantly environmental. This predicts a life-
time mesothelioma risk of the order of 1 in 10 000 at the
Table 1. British mesothelioma mortality up to age 50 and population average amphibole lung burdens (f/mg) in the unselected
sample by sex and year of birth
Males Females
Mortality
to age 50
Mean lung
burden (fibres/mg)
Fibres counted/
subjects
Mortality
to age 50
Mean lung
burden (fibres/mg)
Fibres counted/
subjects
Rate per
million
No. of
deaths
Meana 95% CI Lung
cancer
Pneumothorax Rate per
million
No. of
deaths
Meana 95% CI Lung
cancer
Pneumothorax
1940–44 184 302 62.2b (42.9, 91.8) 551/74 153/9 33 54 18.3 (11.2, 30.4) 87/26 0/1
1945–49 148 294 41.7 (30.5, 58.0) 394/66 54/13 29 58 13.3 (8.6, 21.2) 53/32 19/7
1950–54 99 180 30.8 (19.6, 49.0) 98/31 45/10 23 42 13.5 (7.1, 25.7) 19/15 11/6
1955–59 58 111 13.5 (5.8, 31.4) 25/7 6/7 22 44 10.8 (4.7, 25.2) 3/4 15/8
1960–64 35 63 10.9 (3.6, 32.0) 6/3 13/7 16 27 8.6 (3.6, 21.0) 8/3 8/7
1965–69 7.2 (2.3, 21.6) 1/1 9/8 1.2 (0.2, 4.4) 3/11
1970–74 3.3 (1.5, 7.0) 22/24 4.3 (1.7, 10.6) 14/11
1975–79 1.0 (0.3, 2.7) 6/21 1.2 (0.3, 3.3) 5/15
1980–84 3.2 (1.1, 9.1) 11/12 0.8 (0.2, 2.9) 3/12
1985–89 0.5 (0.1, 1.6) 3/21 1.0 (0.3, 2.7) 5/17
1990–92 0.0 (0.0, 2.4) 0/5 0.7 (0.03, 4.7) 1/5
Total 1075/182 322/137 170/80 84/100
aLung burdens are adjusted for the effect of asbestos on lung cancer risk (see Statistical Methods). Respective unadjusted mean burdens in those born in 1940–44,
1945–49, 1950–54, 1955–59 and 1960–64 were 154.4, 52.0, 36.6, 14.8 and 11.7 f/mg in men and 20.2, 14.4, 14.6, 11.5 and 9.1 f/mg in women; respective un-
adjusted means based only on pneumothorax patients were 121.8, 17.8, 80.8, 1.6 and 15.0 f/mg in men and 0.0, 10.0, 16.2, 10.6 and 3.4 f/mg in women.bIncluding a lung cancer with 22 000 fibre/mg.
4 International Journal of Epidemiology, 2018, Vol. 0, No. 0
Downloaded from https://academic.oup.com/ije/advance-article-abstract/doi/10.1093/ije/dyx276/4925430by London School of Hygiene & Tropical Medicine useron 15 March 2018

Tab
le2.
Av
era
ge
am
ph
ibo
lelu
ng
bu
rde
na
(fib
res/
mg
)a
nd
95
%C
Ib
yo
ccu
pa
tio
na
nd
ye
ar
of
bir
thin
un
sele
cte
dlu
ng
can
cer
an
dp
ne
um
oth
ora
xp
ati
en
tsa
nd
ad
dit
ion
al
20
con
-
stru
ctio
nw
ork
ers
wit
hp
ne
um
oth
ora
x.
(Nu
mb
er
of
fib
res
cou
nte
d/n
um
be
ro
fsu
bje
cts
sho
wn
inp
are
nth
ese
s.)
Th
elo
we
rp
art
sho
ws
the
dis
trib
uti
on
of
lun
gb
urd
en
sb
yo
ccu
pa
-
tio
na
nd
ye
ar
of
bir
th
Occ
upati
onal
exposu
reE
nvi
ronm
enta
lex
posu
reonly
Men
Wom
enM
enW
om
enB
oth
sexes
Carp
ente
rPlu
mber
,
elec
tric
ian
or
pain
ter
Oth
er
const
ruct
ion
work
er
Hig
hri
skM
ediu
m
risk
Any
occ
upati
onal
exposu
re
Any
occ
upati
onal
exposu
re
Obse
rved
Pre
dic
ted
scen
ario
Ab
Pre
dic
ted
scen
ario
Bc
Mes
oth
elio
ma
OR
v.
popula
tion
contr
ols
d
34.2
15.9
5.1
17.5
4.1
2.4
1.0
(ref
)1.0
(ref
)
Yea
rof
bir
th
1940–5
4154.3
87.6
29.7
59.8
49.2
56.4
13.5
19.6
15.2
16.9
18.5
19.6
68.3
–346.8
48.9
–156.6
20.4
–46.4
34.4
–103.7
29.9
–81.7
43.9
–73.4
8.4
–21.4
13.6
–28.7
10.7
–21.6
13.2
–22.1
(217/1
2)
(264/2
5)
(204/4
8)
(297/3
1)
(207/4
1)
(1189/1
57)
(66/3
1)
(106/4
6)
(123/5
6)
(229/1
02)
1955–6
478.0
15.6
2.1
0.0
11.7
22.7
8.9
5.9
9.4
7.9
6.3
7.4
18.8
–323.9
4.1
–57.6
0.2
–17.7
3.0
–41.2
8.4
–60.2
1.6
–37.8
2.2
–14.5
5.0
–17.5
4.8
–13.3
(20/2
)(1
1/4
)(2
/2)
(0/1
)(7
/4)
(40/1
3)
(3/4
)(1
0/1
1)
(31/1
8)
(41/2
9)
1965–7
41.8
9.1
4.1
3.0
6.2
4.0
1.0
2.4
1.7
1.1
1.9
0.2
–9.1
3.7
–21.7
1.5
–10.7
1.0
–7.9
3.0
–12.8
1.0
–13.7
0.3
–3.1
1.0
–5.4
0.9
–3.4
(2/4
)(1
9/9
)(1
0/9
)(9
/10)
(40/3
2)
(6/5
)(4
/12)
(11/1
7)
(15/2
9)
1975–8
41.7
9.1
1.4
0.5
2.9
2.5
1.2
0.9
1.0
1.1
1.0
0.1
–16.1
2.6
–31.2
0.4
–4.6
0.0
–3.3
1.1
–7.5
0.1
–24.3
0.4
–2.8
0.3
–2.1
0.5
–1.9
(1/2
)(9
/4)
(4/9
)(1
/6)
(15/2
1)
(1/2
)(7
/19)
(7/2
5)
(14/4
4)
1985–9
20.0
1.8
0.0
0.5
0.5
0.9
0.7
1.1
0.3
0.1
–16.9
0.0
–4.7
0.1
–1.4
0.3
–2.2
0.3
–1.4
(0/3
)(1
/2)
(0/2
)(1
/7)
(3/2
1)
(6/2
2)
(9/4
3)
Lung
fibre
conce
ntr
atio
n
f/m
g
Born
1940–6
4
<5
15
15
12
12
45
15
22
30
52
5–24
29
17
717
52
14
21
29
50
25–199
710
17
814
56
614
14
28
�200
45
15
217
00
11
Born
1965–9
2
<5
68
16
16
46
651
60
111
5–24
06
32
11
11
45
25–60
02
10
30
00
0
aL
ung
burd
enes
tim
ate
sare
adju
sted
for
the
effe
ctof
asb
esto
son
lung
cance
rri
sk,se
eT
able
1fo
otn
ote
a.
bSce
nari
oA
:annualacc
um
ula
tion
of
0.1
f/m
gper
yea
rfr
om
ages
5to
16
from
1945
toth
epre
sent,
follow
edaft
erage
16
by
1f/
mg
per
yea
runti
l1980
and
zero
since
1980.
c Sce
nari
oB
:neg
ligib
leex
posu
reunti
lage
16,fo
llow
edaft
erage
16
by
1f/
mg
per
yea
runti
l1980
and
0.1
f/m
gper
from
1980
unti
llu
ng
sam
ple
sw
ere
obta
ined
.For
both
scen
ari
os,
the
calc
ula
tion
was
base
don
indiv
idual
yea
rsof
bir
thand
yea
rsof
oper
ati
on
am
ong
those
report
ing
no
occ
upati
onalex
posu
re.
dO
Rs
(odds
rati
os)
from
the
case
-contr
olst
udy.2
International Journal of Epidemiology, 2018, Vol. 0, No. 0 5
Downloaded from https://academic.oup.com/ije/advance-article-abstract/doi/10.1093/ije/dyx276/4925430by London School of Hygiene & Tropical Medicine useron 15 March 2018

Tab
le3.N
um
be
ra
nd
pe
rce
nta
ge
of
fib
res
cou
nte
db
ya
sbe
sto
sfi
bre
typ
e,y
ea
ro
fb
irth
,se
xa
nd
occ
up
ati
on
Num
ber
of
fibre
sco
unte
d%
of
fibre
sco
unte
dA
ver
age
lung
burd
enf/
mgb
Am
phib
ole
sC
hry
soti
leA
mphib
ole
sC
hry
soti
leA
mphib
ole
sC
hry
soti
le
Fib
rety
pea
am
crtr
an
ac
ua
am
crtrþ
anþ
acþ
ua
amþ
crtrþ
anþ
ac
nper
sons
Men
born
since
1965
Envir
onm
enta
lonly
52
62
41
10
531.6
10.5
31.6
26.3
0.5
0.3
0.3
Carp
ente
r6
30
00
00
0100.0
0.0
0.0
0.0
1.6
0.0
0.0
Plu
mber
,el
ectr
icia
n,pain
ter
16
26
10
01
00
92.9
3.6
3.6
0.0
6.8
0.9
0.0
Oth
erco
nst
ruct
ion
work
ers
20
10
01
13
01
62.5
0.0
31.3
6.3
3.1
0.8
0.3
Med
ium
-ris
k18
70
11
10
258.3
0.0
25.0
16.7
1.3
0.6
0.4
Tota
l112
52
36
36
08
66.7
3.8
19.2
10.3
1.9
0.4
0.2
Wom
enborn
since
1965
Envir
onm
enta
lonly
64
14
23
42
05
46.7
6.7
30.0
16.7
0.8
0.5
0.3
Med
ium
-ris
k7
60
10
00
085.7
0.0
14.3
0.0
2.9
0.5
0.0
Tota
l71
20
24
42
05
54.1
5.4
27.0
13.5
1.0
0.5
0.2
Men
born
1940–6
4
Envir
onm
enta
lonly
57
62
14
12
21
53
11
48.4
10.9
32.0
8.6
11.4
4.8
1.7
Hig
h-r
isk
32
243
43
14
42
879.7
14.1
3.6
2.6
343.4
2.9
2.0
Carp
ente
r14
216
11
14
14
190.8
4.6
4.2
0.4
173.0
3.2
0.5
Plu
mber
,el
ectr
icia
n,pain
ter
29
203
55
45
44
472.8
19.7
6.1
1.4
129.1
3.1
1.0
Oth
erco
nst
ruct
ion
work
ers
50
170
17
18
55
13
77.6
7.8
8.7
5.9
30.0
3.1
2.5
Med
ium
-ris
k45
149
43
511
24
568.0
19.6
10.0
2.3
80.1
2.6
0.6
Tota
l227
1043
183
24
53
21
22
42
75.1
13.2
8.6
3.0
70.7
3.1
1.5
Wom
enborn
1940–6
4
Envir
onm
enta
lonly
74
88
23
13
24
33
29
48.1
12.6
23.5
15.8
12.1
3.0
1.8
Med
ium
-ris
k35
46
82
12
01
760.5
10.5
19.7
9.2
12.2
3.2
1.3
Tota
l109
134
31
15
36
34
36
51.7
12.0
22.4
13.9
12.1
3.0
1.4
aA
m,am
osi
te;cr
,cr
oci
dolite
;tr
,tr
emolite
;an,anth
ophyllit
e;ac,
act
inolite
;ua,unty
ped
am
phib
ole
.bA
ver
age
lung
burd
ens
unadju
sted
for
the
effe
ctof
asb
esto
son
lung
cance
r(s
eeSta
tist
icalM
ethods)
.
6 International Journal of Epidemiology, 2018, Vol. 0, No. 0
Downloaded from https://academic.oup.com/ije/advance-article-abstract/doi/10.1093/ije/dyx276/4925430by London School of Hygiene & Tropical Medicine useron 15 March 2018

average lung burden of �1 f/mg due to environmental ex-
posure in men and women born since 1965 (Table 2).
Asbestos exposure since 1980
By 1980, when those born in 1965 were starting work,
traditional high-risk occupations such as lagging and ship-
building had disappeared and carpenters no longer cut
amosite board. The only occupational groups born since
1965 with substantially higher lung burdens than the gen-
eral population are the 43% (6/14) of plumbers, electri-
cians and decorators, 17% (3/18) of other construction
workers and 14% (3/22) in medium-risk occupations in
whom two or more amphibole fibres were counted in ap-
proximately 0.3 mg of lung tissue. The mean lung burden
in these 12 cases (11 f/mg) implies a lifetime risk of �1 in
1000. Potentially remediable work practices seem likely to
underlie this continuing occupational hazard. The
distribution among the other 48 men and women in jobs
classed as occupationally exposed in whom fewer than two
fibres were counted, including the remaining eight
plumbers, electricians and decorators, was 35 with no
fibres and 13 with one fibre, similar to that among those
with environmental exposure only. The reduction in the
asbestos-exposed workforce and their declining lung bur-
dens are reflected in the converging trends in male and fe-
male mesothelioma rates (Figure 2a). The majority of
mesotheliomas in people born since 1965 will be caused by
environmental exposure, presumably mainly in buildings.
Numbers of amphibole fibres counted in 105 men and
women born since 1965 with environmental exposure only
(77 with none, 22 with one, four with two, one with three
and one with four fibres) suggest fairly uniform environ-
mental exposure across the UK, with a minority having
higher (probably unsuspected) exposure. For example,
these fibre counts are consistent with about 10% having a
0.0
20.0
40.0
60.0
80.0
100.0
0
50
100
150
200
1940 1950 1960 1970 1980 1990
Mea
n am
phib
ole
lung
conc
entr
a�on
(fi
bres
/mg)
Cum
ula�
ve m
esot
helio
ma
mor
talit
y pe
r m
illio
n by
age
50
Year of birth
male mortality rate
female mortality rate
male mean amphibole concentra�on
female mean amphibole concentra�on
0
20
40
60
80
100
120
140
160
1940-54 1955-64 1965-74 1975-84 1985-92
Mea
n am
phib
ole
lung
conc
entr
a�on
(fi
bres
/mg)
Year of birth
High risk
Carpenters
Plumbers, electricians & painters
Other construc�on workers
Medium risk
Environmental only (both sexes)
(a)
(b)
Figure 2. (a) National mesothelioma mortality and average amphibole
asbestos lung burdens in Britain by year of birth (fibres/mg longer than
5 microns). Subjects born 1940–64 are predominantly resected lung
cancer patients, whereas all but one of those born 1965–92 are pneumo-
thorax patients. (b) Average amphibole asbestos lung burdens in
occupationally exposed men by year of birth (fibres/mg longer
than 5 microns). Data for environmental exposure only include both
sexes.
0.0
20.0
40.0
60.0
80.0
100.0
120.0
140.0
1940 1950 1960 1970 1980 1990
Mea
n as
best
os lu
ng co
ncen
tra�
on (f
/mg)
Year of birth
amosite (males)
crocidolite (males)
amosite (females)
crocidolite (females)
0.0
0.5
1.0
1.5
2.0
2.5
3.0
3.5
4.0
4.5
5.0
1940 1950 1960 1970 1980 1990
Mea
n as
best
os lu
ng co
ncen
tra�
on (f
/mg)
Year of birth
chryso�le
tremolite + anthophyllite + ac�nolite
* see footnote b
(a)
(b)
Figure 3. Average asbestos lung burdensa in Britain by year of birth
(fibres/mg longer than 5 microns). Upper graph: crocidolite and amosite
by sex. Lower graph: other amphiboles and chrysotile (both sexes).aAverage lung burdens unadjusted for the effect of asbestos on lung
cancer (see Statistical Methods).bExcluding a chrysotile concentration of 72 f/mg based on 24 fibres in a
woman who reported no asbestos exposure. Her inclusion increases
the chrysotile average for those born 1960–64 from 2.0 to 26.0 f/mg.
International Journal of Epidemiology, 2018, Vol. 0, No. 0 7
Downloaded from https://academic.oup.com/ije/advance-article-abstract/doi/10.1093/ije/dyx276/4925430by London School of Hygiene & Tropical Medicine useron 15 March 2018

mean lung burden of �6 f/mg (lifetime risk �1 in 2000),
with the remaining 90% having a lung burden an order of
magnitude lower (�0.6 f/mg; lifetime risk �1 in 20 000).
The steep decline in mean lung burden in men and
women with environmental exposure only from 17 f/mg
born 1940–54 to 1 f/mg born 1975–84 (P < 0.001) indi-
cates that environmental as well as occupational exposure
levels fell abruptly around 1980 when use of amphibole
products had ended. This suggests that until the 1970s,
most asbestos entered the environment during or soon after
installation of new asbestos materials. Current environ-
mental releases may also occur mainly during construction
or demolition work on asbestos-containing buildings.8
(Our sample included no asbestos removal workers, but re-
moval and demolition may contribute substantially to both
occupational and environmental exposure.) However, air-
borne asbestos fibres released by weathering and everyday
occupation of buildings may also be an important source
of environmental exposure. Identifying asbestos in build-
ings that warrants containment or removal should con-
tinue to be a regulatory priority, but unnecessary asbestos
removal may increase the number of fibres released to the
environment.
The trend in average lung burden for men and women
born before 1965 with only environmental exposure sug-
gests an annual increment in eventual lung burden of �1
f/mg per year in adults until about 1980, when it fell
sharply. The crucial question is whether environmental ex-
posures, particularly in childhood, have remained fairly
constant since 1980. In men and women born since 1965
with only environmental exposure, the average lung
burden declines from 1.7 f/mg (95% CI 0.9, 3.4) born
1965–74, to 0.7 f/mg (95% CI 0.3, 1.4) born 1985–92
(P ¼ 0.04), but the data are too sparse for the separate con-
tributions of exposure in infancy, during school age and in
adults to be estimated. Table 2 shows predicted lung bur-
dens under two scenarios that are both consistent with
these data but imply very different regulatory priorities:
continuing exposure from age 5 to 16 with negligible envir-
onmental exposure after age 16 since 1980 (scenario A),
and environmental exposure being negligible in childhood
and beginning at age 16 (scenario B). Domestic exposure
in infancy could be included without greatly altering these
predicted lung burdens. The excess over these environmen-
tal levels in the average lung burdens of men with any oc-
cupational exposure increases for each year after age 16 by
about 2 f/mg per year from 1955 to 1980, and after 1980
by about 0.1 f/mg per year in plumbers, electricians and
painters, almost ceasing in other occupations (Table 2).
UK amphibole imports up to 1980 show a similar pattern,3
changing little from 1960 to the late 1970s when amosite
imports ended abruptly. Crocidolite use ended in 1970,3
and this is reflected in the earlier decline of crocidolite lung
burdens in both sexes (Figure 3).
If asbestos levels have not fallen since the 1980s, our re-
sults suggest an average lung burden from current environ-
mental amphibole exposure of about 1 f/mg by age 30.
Lifetime mesothelioma risk is largely determined by asbes-
tos exposure before age 30,2,9 and most of the amphibole
fibres still present in the lungs of those born 1940–64, on
whom our linear dose-response is based, were inhaled be-
fore age 30. However, the only direct evidence of recent
environmental exposure is the average lung burden (0.7
f/mg) in 43 unexposed men and women born 1985–92
(Table 2), which is very imprecise and only includes fibres
inhaled up to about age 19, the median age when their
lung samples were taken. The 14 fibres counted in these 43
subjects comprised five amosite, one tremolite, one antho-
phyllite, two actinolite and five chrysotile.
Study limitations
The consistency of the lung burden patterns in Table 2 with
known occupational and environmental risks and national
trends in mesothelioma mortality is reassuring. However,
prediction of future risk from lung burdens in young adults
may be affected by several factors. These include the pro-
portion of environmental exposure that occurs in child-
hood, differences in amphibole fibre type and dimension
between past occupational and current environmental ex-
posure, and the opposite effects of fibre clearance and fu-
ture accumulation on the lung burdens of those born since
1980 who were aged under 30 when samples were taken.
Amosite has a particularly long half-life,3 but it is not
known whether most fibres still present 20 years after in-
halation remain in the lung forever, or whether carcinogen-
icity and clearance of tremolite, anthophyllite and actinolite
are similar. Our main findings are unaffected by informa-
tion bias, as the average lung burdens in Table 1 were based
on the unselected sample irrespective of reported occupa-
tion. Any systematic differences between pneumothorax pa-
tients and the general population should have little effect
on our prediction of future mesothelioma rates, if the dose-
response in those born before 1965 and the lung burdens of
younger people had both been based solely on pneumo-
thorax patients. However, 78% of subjects born before
1965 were lung cancers from our previous study.3 The high
cost of sample preparation and TEM precluded replacing
them with pneumothorax patients, but differences between
lung cancer and pneumothorax patients might lead to error
in our prediction of future mesothelioma rates even if lung
burdens in young pneumothorax patients were known pre-
cisely. Mean lung burdens in pneumothorax patients born
before 1965 show no consistent difference from the overall
8 International Journal of Epidemiology, 2018, Vol. 0, No. 0
Downloaded from https://academic.oup.com/ije/advance-article-abstract/doi/10.1093/ije/dyx276/4925430by London School of Hygiene & Tropical Medicine useron 15 March 2018

estimates but vary irregularly across birth cohorts due to
small numbers (Table 1 footnote a). The primary risk factor
for both lung cancer and pneumothorax is smoking10,11
(among our participants 94% of lung cancers and 75% of
pneumothorax patients had ever smoked), so marked dif-
ferential bias related to the populations studied seems un-
likely, but the lung sample was apical in almost all
pneumothorax patients and from various sites in resected
lung cancers. To avoid these uncertainties, future studies
should use lung samples only from pneumothorax patients.
This would also simplify the statistical analysis and might
eliminate the difference between the results in men and
women.
Further studies and international comparisons
Lung burden studies on larger numbers of young people
would determine whether environmental exposures have
fallen since the 1980s and whether they occur predomin-
antly in childhood or after beginning work. Analysis of
larger amounts of tissue to increase sensitivity would iden-
tify individuals with higher levels that might be linked to
specific buildings or other sources of environmental expos-
ure. The mesothelioma risk from chrysotile is low6 but
cannot be estimated from our results,12 and an interna-
tional study of average TEM asbestos lung burdens is
needed to show whether or not mesothelioma mortality in
different birth cohorts can be explained by historical
amphibole exposure even in countries where almost all as-
bestos was chrysotile. The risk per fibre for different
amphiboles might also be estimated. Lower amphibole im-
ports account for the much lower mesothelioma rate in the
USA than in Britain and Australia,2,3 despite similar over-
all asbestos consumption per head. There is no consistent
international correlation between overall asbestos con-
sumption and mesothelioma risk, but crocidolite, amosite
and chrysotile consumption were not recorded separately
for most countries. Lin et al.13 reported a strong interna-
tional correlation between the logarithm of recent meso-
thelioma mortality and historical asbestos consumption,
which was predominantly chrysotile even in Britain. The
exponential dose-response this would imply is interpreted
as evidence of the mesothelioma risk from chrysotile,14 but
the apparent correlation merely reflects two separate clus-
ters of countries. There is little correlation either among
the countries of North America, Australasia, Western
Europe and Japan (the only outlier being Portugal) or in
Eastern Europe, South America and the rest of Asia, where
registered mesothelioma death rates and asbestos imports
in the 1960s also varied widely but were much lower.13
This is confirmed in an updated analysis restricted to
European countries.15 Replacement of chrysotile by safer
substitutes is justified by the lung cancer and asbestosis
risks, and the likelihood of some mesothelioma risk
strengthens the case; but population-based data on amphi-
bole lung burdens as well as total asbestos imports will be
needed to identify any countries in which a large propor-
tion of mesotheliomas were caused by chrysotile.
Conclusion
The British mesothelioma death rate will decline from the
current peak (0.75% of male deaths and 0.13% of female
deaths in 2015) until about 2055, when those born before
1965 will be aged over 90.16 If the average lung burden by
age 30 from environmental asbestos exposure is now �1
f/mg and remains at that level, there will be a continuing
lifetime mesothelioma risk of the order of 1 in 10 000, aver-
aged across the whole population. With projected popula-
tion growth and ageing over the next 40 years, this would
imply almost 100 mesotheliomas per year caused by asbes-
tos, and there may be a similar number unrelated to asbes-
tos.17 The risk is an order of magnitude higher in a
subgroup of plumbers, electricians, decorators and presum-
ably asbestos removal workers who do not take adequate
precautions and probably in a minority of the general popu-
lation with unusually high environmental exposure. Further
samples from young people are needed to estimate current
average lung burdens at each age more precisely. This
would indicate whether the environmental hazard is declin-
ing and whether exposure is predominantly before or after
school-leaving age. Our results suggest that a minority of
the general population may have unusually high environ-
mental exposure, but more sensitive fibre counting will be
needed to confirm this. We are now recruiting further young
pneumothorax cases, to identify those with high lung bur-
dens so that their schools and homes can be studied.
Funding
This work was supported by the British Lung Foundation (grant no.
APG11-3), Health and Safety Executive and Cancer Research UK.
A.G.N. was supported by the National Institute of Health Research
Respiratory Disease Biomedical Research Unit at the Royal
Brompton and Harefield NHS Foundation Trust and Imperial
College London.
AcknowledgmentsWe thank Jayne Simpson and Maria Kelly for the majority of the
telephone interviews; Jane Hatch, Samantha Warnakulasuriya,
Laura Newmark, Bavithra Vijayakumar, Chris Heaton, Qichen Liu,
Katie Field and Emma Afify for administrative work on the study;
and Richard Houlihan, Catherine Taylor, Kirsty Dewberry and
James Staff at the Health and Safety Laboratory for TEM counting.
Most importantly, we thank the mesothelioma, lung cancer and
pneumothorax patients who agreed to participate.
International Journal of Epidemiology, 2018, Vol. 0, No. 0 9
Downloaded from https://academic.oup.com/ije/advance-article-abstract/doi/10.1093/ije/dyx276/4925430by London School of Hygiene & Tropical Medicine useron 15 March 2018

Author Contributions
C.G. performed the majority of the statistical analyses and contrib-
uted to the design of the study, interpretation of data and writing the
report. C.R. contributed to the design and supervised the conduct of
the study. J.H. fitted the maximum likelihood models and contributed
to interpretation of data and writing the report. A.D. contributed to
interpretation of data and writing the report. G.B. supervised the
TEM and contributed to study conduct and writing the report. J.P.W.
and M.S. contributed to the conduct of the study and data collection.
A.N., L.D. and M.S. provided advice on lung pathology and contrib-
uted to study design and conduct. T.T. contributed to study design
and conduct. J.P. designed and supervised the study and the statistical
analysis. J.P. and C.G. drafted the initial manuscript with major input
from J.H., A.D. and G.B. All authors have contributed to revision of
the manuscript and approved the final version. The TIPS collaborators
provided access to study participants and their lung samples.
TIPS collaborators: Andrew Duncan, Blackpool Victoria Hospital,
Blackpool, Michael Dusmet, Royal Brompton Hospital, London, John
G Edwards, Northern General Hospital, Sheffield, Eric Lim, Harefield
Hospital, Middlesex, Richard Milton, St James’s University Hospital,
Leeds, Ian Morgan, Royal Wolverhampton Hospitals NHS
Trust, Wolverhampton, P O’Keefe, University Hospital of Wales,
Cardiff, Danielle Power, Charing Cross Hospital, London, P B Rajesh
and Sridhar Rathinam, Birmingham Heartlands Hospital,
Birmingham, Doris M Rassl, Papworth Hospital NHS Foundation
Trust, Cambridge, T Routledge, Guy’s Hospital, London, Michael
Shackcloth, Liverpool Heart and Chest Hospital NHS Trust, Liverpool
and Anthony De Soyza, Freeman Hospital, Newcastle upon Tyne, UK.
Conflict of interest: None declared.
References
1. Health and Safety Executive. Tables MESO02 and MESO03: Death
Certificates Mentioning Mesothelioma, 1968-2015. 2017. http://
www.hse.gov.uk/statistics/tables/ (26 July 2017, date last accessed).
2. Rake C, Gilham C, Hatch J, Darnton A, Hodgson J, Peto J.
Occupational, domestic and environmental mesothelioma risks
in the British population: a case-control study. Br J Cancer 2009;
100:1175–83.
3. Gilham C, Rake C, Burdett G et al. Pleural mesothelioma and
lung cancer risks in relation to occupational history and asbestos
lung burden. Occup Environ Med 2016;73:290–99.
4. Hodgson JT, Darnton A. The quantitative risks of mesothelioma
and lung cancer in relation to asbestos exposure. Ann Occup
Hyg 2000;44:56–601.
5. Hodgson JT, Darnton A. Mesothelioma risk from chrysotile.
Occup Environ Med 2010;67:432.
6. Berman DW, Crump KS. A meta-analysis of asbestos-related
cancer risk that addresses fiber size and mineral type. Crit Rev
Toxicol 2008;38(Suppl 1):49–73.
7. Peto J, Rake C, Gilham C, Hatch J. Occupational, Domestic and
Environmental Mesothelioma Risks in Britain: A Case-Control
Study. 2009. http://www.hse.gov.uk/research/rrhtm/rr696.htm
(5 February 2018, date last accessed).
8. Burdett GJ, Jaffrey SA, Rood AP. Airborne asbestos fibre levels
in buildings: a summary of UK measurements. IARC Scientific
Publications 1989;90:277–90.
9. Peto J, Seidman H, Selikoff IJ. Mesothelioma mortality in asbes-
tos workers: implications for models of carcinogenesis and risk
assessment. Br J Cancer 1982;45:124–35.
10. Bense L, Eklund G, Wiman LG. Smoking and the increased risk of
contracting spontaneous pneumothorax. Chest 1987;92:1009–12.
11. Bintcliffe O, Maskell N. Spontaneous pneumothorax. BMJ
2014;348:g2928.
12. Peto J, Gilham C, Rake C, Darnton A, Hodgson J, Burdett G.
Authors’ reply to letters from Egilman et al and Oliver et al.
Occup Environ Med 2016;73:710–11.
13. Lin RT, Takahashi K, Karjalainen A et al. Ecological associ-
ation between asbestos-related diseases and historical asbestos
consumption: an international analysis. Lancet 2007;369:
844–49.
14. Wagner GR. The fallout from asbestos. Lancet 2007;369:973–74.
15. Darnton A, Gilham C, Peto J. Epidemiology of mesothelioma in
Europe. In: Mineo T (ed). Malignant Pleural Mesothelioma:
Present Status and Future Directions. Sharjah, United Arab
Emirates: Bentham Science, 2016.
16. Hodgson JT, McElvenny DM, Darnton AJ, Price MJ, Peto J. The
expected burden of mesothelioma mortality in Great Britain
from 2002 to 2050. Br J Cancer 2005;92:587–93.
17. McDonald JC. Health implications of environmental exposure
to asbestos. Environ Health Perspect 1985;62:319–28.
18. Pharoah PD, Antoniou A, Bobrow M, Zimmern RL, Easton DF,
Ponder BA. Polygenic susceptibility to breast cancer and implica-
tions for prevention. Nat Genet 2002;31:33–36.
10 International Journal of Epidemiology, 2018, Vol. 0, No. 0
Downloaded from https://academic.oup.com/ije/advance-article-abstract/doi/10.1093/ije/dyx276/4925430by London School of Hygiene & Tropical Medicine useron 15 March 2018
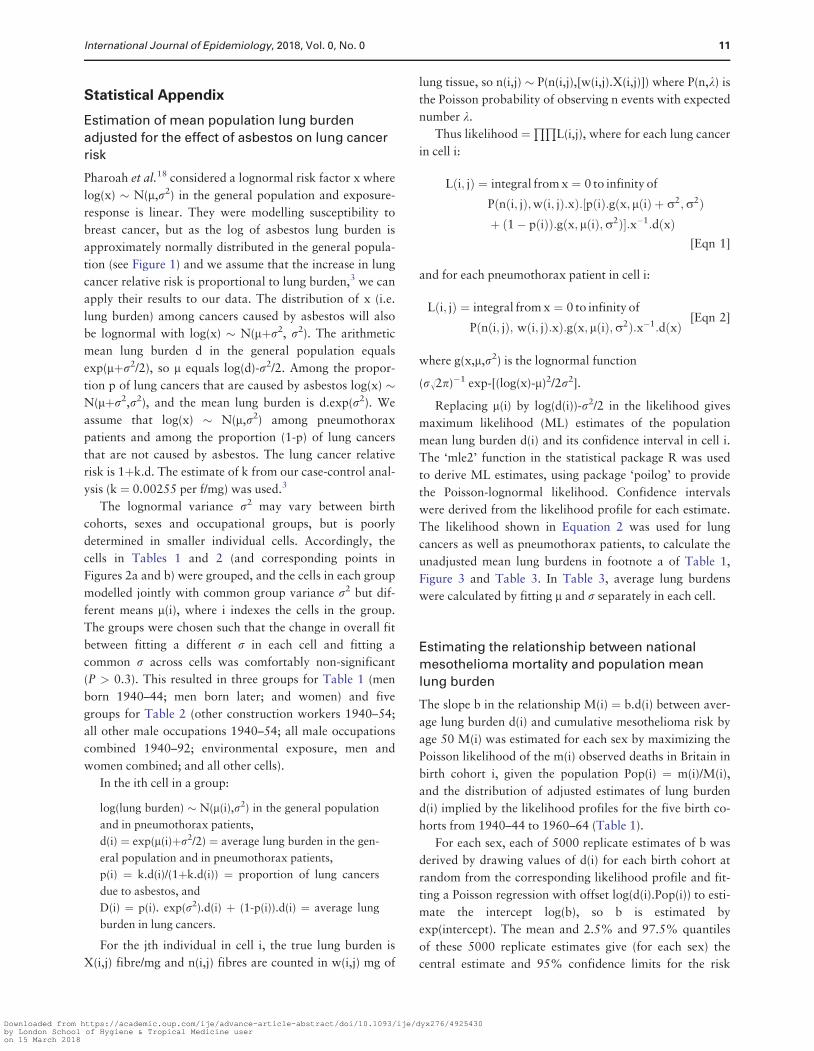
Statistical Appendix
Estimation of mean population lung burden
adjusted for the effect of asbestos on lung cancer
risk
Pharoah et al.18 considered a lognormal risk factor x where
log(x) � N(m,r2) in the general population and exposure-
response is linear. They were modelling susceptibility to
breast cancer, but as the log of asbestos lung burden is
approximately normally distributed in the general popula-
tion (see Figure 1) and we assume that the increase in lung
cancer relative risk is proportional to lung burden,3 we can
apply their results to our data. The distribution of x (i.e.
lung burden) among cancers caused by asbestos will also
be lognormal with log(x) � N(mþr2, r2). The arithmetic
mean lung burden d in the general population equals
exp(mþr2/2), so m equals log(d)-r2/2. Among the propor-
tion p of lung cancers that are caused by asbestos log(x) �N(mþr2,r2), and the mean lung burden is d.exp(r2). We
assume that log(x) � N(m,r2) among pneumothorax
patients and among the proportion (1-p) of lung cancers
that are not caused by asbestos. The lung cancer relative
risk is 1þk.d. The estimate of k from our case-control anal-
ysis (k ¼ 0.00255 per f/mg) was used.3
The lognormal variance r2 may vary between birth
cohorts, sexes and occupational groups, but is poorly
determined in smaller individual cells. Accordingly, the
cells in Tables 1 and 2 (and corresponding points in
Figures 2a and b) were grouped, and the cells in each group
modelled jointly with common group variance r2 but dif-
ferent means m(i), where i indexes the cells in the group.
The groups were chosen such that the change in overall fit
between fitting a different r in each cell and fitting a
common r across cells was comfortably non-significant
(P > 0.3). This resulted in three groups for Table 1 (men
born 1940–44; men born later; and women) and five
groups for Table 2 (other construction workers 1940–54;
all other male occupations 1940–54; all male occupations
combined 1940–92; environmental exposure, men and
women combined; and all other cells).
In the ith cell in a group:
log(lung burden) � N(m(i),r2) in the general population
and in pneumothorax patients,
d(i) ¼ exp(m(i)þr2/2) ¼ average lung burden in the gen-
eral population and in pneumothorax patients,
p(i) ¼ k.d(i)/(1þk.d(i)) ¼ proportion of lung cancers
due to asbestos, and
D(i) ¼ p(i). exp(r2).d(i) þ (1-p(i)).d(i) ¼ average lung
burden in lung cancers.
For the jth individual in cell i, the true lung burden is
X(i,j) fibre/mg and n(i,j) fibres are counted in w(i,j) mg of
lung tissue, so n(i,j) � P(n(i,j),[w(i,j).X(i,j)]) where P(n,k) is
the Poisson probability of observing n events with expected
number k.
Thus likelihood ¼QQ
L(i,j), where for each lung cancer
in cell i:
Lði; jÞ ¼ integral from x ¼ 0 to infinity of
Pðnði; jÞ;wði; jÞ:xÞ:½pðiÞ:gðx; lðiÞ þ r2;r2Þþ ð1� pðiÞÞ:gðx; lðiÞ;r2Þ�:x�1:dðxÞ
[Eqn 1]
and for each pneumothorax patient in cell i:
Lði; jÞ ¼ integral from x ¼ 0 to infinity of
Pðnði; jÞ; wði; jÞ:xÞ:gðx;lðiÞ;r2Þ:x�1:dðxÞ[Eqn 2]
where g(x,m,r2) is the lognormal function
(r�2p)�1 exp-[(log(x)-m)2/2r2].
Replacing m(i) by log(d(i))-r2/2 in the likelihood gives
maximum likelihood (ML) estimates of the population
mean lung burden d(i) and its confidence interval in cell i.
The ‘mle2’ function in the statistical package R was used
to derive ML estimates, using package ‘poilog’ to provide
the Poisson-lognormal likelihood. Confidence intervals
were derived from the likelihood profile for each estimate.
The likelihood shown in Equation 2 was used for lung
cancers as well as pneumothorax patients, to calculate the
unadjusted mean lung burdens in footnote a of Table 1,
Figure 3 and Table 3. In Table 3, average lung burdens
were calculated by fitting m and r separately in each cell.
Estimating the relationship between national
mesothelioma mortality and population mean
lung burden
The slope b in the relationship M(i) ¼ b.d(i) between aver-
age lung burden d(i) and cumulative mesothelioma risk by
age 50 M(i) was estimated for each sex by maximizing the
Poisson likelihood of the m(i) observed deaths in Britain in
birth cohort i, given the population Pop(i) ¼ m(i)/M(i),
and the distribution of adjusted estimates of lung burden
d(i) implied by the likelihood profiles for the five birth co-
horts from 1940–44 to 1960–64 (Table 1).
For each sex, each of 5000 replicate estimates of b was
derived by drawing values of d(i) for each birth cohort at
random from the corresponding likelihood profile and fit-
ting a Poisson regression with offset log(d(i).Pop(i)) to esti-
mate the intercept log(b), so b is estimated by
exp(intercept). The mean and 2.5% and 97.5% quantiles
of these 5000 replicate estimates give (for each sex) the
central estimate and 95% confidence limits for the risk
International Journal of Epidemiology, 2018, Vol. 0, No. 0 11
Downloaded from https://academic.oup.com/ije/advance-article-abstract/doi/10.1093/ije/dyx276/4925430by London School of Hygiene & Tropical Medicine useron 15 March 2018
coefficient b linking mesothelioma with average lung
burden. The ratio of predicted lifetime risk (the
actuarial probability of dying of mesothelioma by age 90)
to the observed cumulative mortality to age 50 was esti-
mated by simple age and birth cohort analysis of British
male mesothelioma death rates from 1990 to 2009, assum-
ing current British mortality rates for all other causes of
death.
The statistical programming code is available on
request.
12 International Journal of Epidemiology, 2018, Vol. 0, No. 0
Downloaded from https://academic.oup.com/ije/advance-article-abstract/doi/10.1093/ije/dyx276/4925430by London School of Hygiene & Tropical Medicine useron 15 March 2018