Embed Size (px)
Citation preview
1998.03 October, 1998 Fiji & South Pacific GIS/RS NEWS 1
Highlights
· Crime and GIS in Fiji
· New projects in the Cooks and in Nuie
· GIS activity in Tonga
Inside
· Meeting reports
· Satellite news
· Project updates
The newsletter expands with input from more countriesand more application areas. The outlook:a richer Pacific Island GIS user community.
As a starting point, this newsletter serves as a communica-tion device for the Fiji GIS and Remote Sensing UserForum, a group that meets monthly to share informationabout recent events. The Forum also provides the opportu-nity for those who are working on new projects to presentthe details of their work to others in the local GIS commu-nity. There is the opportunity for feedback and the ex-change of further ideas in an informal setting. Reflectingthis, the newsletter acts to publish the details of eachmeeting in each quarterly issue.
From the beginning stages of this revitalised publication,we wanted to build something that included areas of thePacific Island Region besides Fiji. Relative to the rest of theRegion, the Fiji GIS community is quite large, as is expectedgiven the overall population and �westernisation� of theisland. However, it is fair to say that GIS activity outside ofFiji is notable in its diversity and in its geography...an ideathat reflects much that is interesting and unique about thePacific Islands.
We are very happy that with this, our third edition of therevitalised newsletter, we see a wide range of articlescoming in from across the Region. While past issues haveseen articles from Tonga and Vanuatu as well as input fromthe Solomon Islands and others, this issue includes the TheCook Islands and Nuie. In future issues we look forwardto articles from even more contributors.
What is also interesting is the wider application base of thearticles we receive. In this issue we see articles onhydrographic work and increased activity for water utilities.The article from Nuie outlines the beginnings of GIS usewithin an integrated Land and Marine project.
A wider user base, both in terms of numbers, membercountries, and in different application areas is positive for anumber of reasons. The most immediate, perhaps, is that
this publication becomes more interesting and informative.And, of course, we like that very much. But a wider basemeans a more robust GIS user community in many ways.
In its earliest stages, formal training and education isrequired for human development in GIS. Courses andworkshops from SOPAC, USP, and others have been theestablished methods to upgrade skills and abilities. Technol-ogy transfer from the various agencies setting up systemshas also been an avenue for education. But this sort ofdevelopment is only part of the picture.
As the GIS user community gets larger, we will see moreeducation from within. The kind of informal educationthat results from one-on-one and group discussionsbetween different GIS practitioners. As the user baseexpands, these opportunities increase. Learning opportuni-ties such as group problem solving and informal informa-tion sharing become as important as formal classroom orworkshop settings. The comparison has often been madeto the term �critical mass�, as used in nuclear energy. Theidea here is that if enough radioactive material gets going,the nuclear reaction will grow by itself. I prefer the analogyof lighting a fire. At first, you need to pay lots of attentionto the small twigs and tinder in your fire, but once the firegets established, it rapidly expands. So, here�s to our firetaking off by itself !
This is also the idea behind the first year-end mini-confer-ence to be held at USP on December 2 & 3, 1998. It willbe an opportunity for as wide a group as possible to meet,talk, listen, and share ideas, questions and answers aboutGIS. Information about the mini-conference will be outshortly. If you do not get this information or would like toreceive it, please contact the USP GIS Unit through JamesBritton at the address on the next page. While we are tryingto keep the meeting as informal as possible, it would begreat to include as many as we can.
FijiGIS/RSnewsand South Pacific The Newsletter of the
Fiji GIS/Remote SensingUser ForumIssue 98/03
October, 1998
2 Fiji & South Pacific GIS/RS NEWS 1998.03 October, 1998
Contents
Regular Features
Meeting Reports: April, May and June ......................................................... 3-6
Spaceborne Image Data Update ................................................................. 24
Local System News and Updates
GIS and Remote Sensing Unit for Agriculture ................................................. 7
GIS for Crime Analysis................................................................................... 8
Mapping at Management Services Division, Department of Forestry ............. 9
GIS/GPS Systems for the Suva Water Supply ............................................... 11
Vanua View: Land titles for the masses. ........................................................ 11
Regional System News and Updates
Charting in Tonga......................................................................................... 14
Department of Water Works GIS in the Cook Islands.................................... 15
Tonga Water Board GIS ............................................................................... 16
Land and Marine Resource Use Planning in Niue Island............................... 17
GPS Base Station in Tonga ......................................................................... 18
Techniques
Image Rectification using GPS surveyed GCPs ........................................... 20
Metadata construction: MRD case study ...................................................... 22
GIS opportunities for GIS specialists ............................................................ 24
Publishing
Fiji and South Pacific GIS/RS News is published through the facilities of SOPAC and The University of the South Pacific inSuva, Fiji. Besides acting as the newsletter of the Fiji GIS and Remote Sensing User Forum, this publication serves as aninformation and news link between individuals and organisations across the South Pacific Region who are interested in GIS,Remote Sensing and related disciplines. Articles focus on how GIS is developing within the Region and feature news onindividual projects and organisations, new trends, technological problems, human resource issues, successes and failures. Weencourage all types of contributions on a variety of topics from both new and established members of the GIS communityboth regionally and internationally.
If at all possible, please provide submissions electronically via disk or email as unformatted (no boldface, style, layout or otherappearance attributes) text files and separate graphic files in their original format (not embedded in wordprocessing files).We can work with most system, text and image formats. If you have an idea for an article, or any questions about submit-ting articles, please contact any member of the editing team listed below for advice and development help.
Fiji and South Pacific GIS/RS News is available over the Internet through the SOPAC Website: http:\\sopac.org.fj\
James BrittonGIS Unit, Geography DepartmentSchool of Social and Economic DevelopmentThe University of the South PacificP.O. Box 1168 Suva, Fiji
Phone: 212 620, 212 651 or 212 542 (679)Fax: 301 487 (679)Email: [email protected]: http:\\www.usp.ac.fj\~gisunit\
Wolf Forstreuter, Les Allinson, and Lala BukarauSOPAC SecretariatPrivate MailbagGPO Suva, Fiji
Phone: 381 377 (679) Fax: 370 040 (679)Email:Wolf: [email protected]
1998.03 October, 1998 Fiji & South Pacific GIS/RS NEWS 3
Meeting Reports
E-mail access concerns voicedat July meeting
Fiji GIS/Remote Sensing User ForumMinutes of July 1998 MeetingLibrary Conference Room, USPJuly 14, 1998
Welcome
James Britton, Acting Director of the USP GIS Unit,opened the meeting at 14:15
Representatives from: Agriculture, FEA, Fiji School ofMedicine, FLIS, Forestry, I.T.C. services, Lukemine, MRD,Regional Development, Statistics, Telecom, SOPAC, USP.
Updates
Agriculture
Viti Levu soils layer completed
FLIS
New FLIS News just published (copies available at thismeeting)
Forestry
Logging plans now up to 4,015 hectaresCirculated 2 copies of the logging code for interest as
follow-up to presentation at SOPAC User ForumMeeting earlier in the year
Lukemine
Garmin hand-held GPS units going into Marine Studies @USP Notable at circa $F200 per unit. No downloadcapability
MRD
Aero-Magnetic information for Fiji is now available andfor sale at MRD. For further information, please seethe article by the Director of MRD in the latest GIS/RS News (98:02) and FLIS News
Digitisation of 1:50,000 Viti Levu geology maps is underway. (40 sheets)
A database for rock sample sites has been started. Thisinformation is based on logbook data kept at MRDover the past 20 years (approx)
Telecom
Phase 1 completion projected for end of month, Phase 2continues
100 users now on-line.
USP
Classes about to start for Semester II with project coursein GIS and Remote Sensing courses running, plus theintroductory GIS course (about 60 students)
Three students completed GIS-based postgraduate courses(two presenting today, the other last meeting)
Five lab sections total will be offered in 1998 in introduc-tory GIS
SOPAC
Hazard Assessment UnitBuilding and Assets Survey: Nukua'lofa field work has
been completed, post-processing of the GPS data isin progress
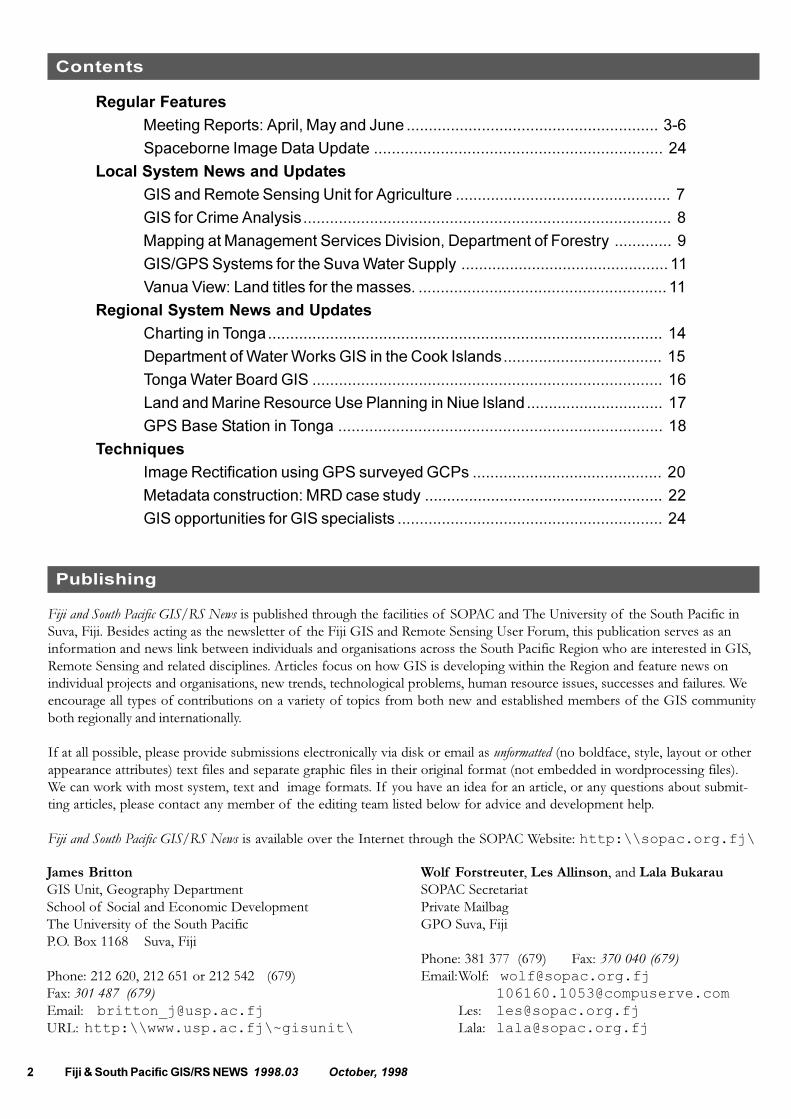
Seismic Microzonation Map: nearing completionInformation Technology Unit1998 aerial photographs of the Suva peninsula are available
at SOPAC. They are in digital format (600 dpi) andrectified to the Fiji Map Grid at 0.5m resolution.
A GPS survey was carried out. The comparison madebetween the base station data at Colo-I-Suva andLautoka showed minimal difference. The base stationat Lautoka will be checked again with the trig pointsduring the next few weeks.
Further permanent update on the SOPAC website willinclude information about the space borne dataavailable for South Pacific Island Countries.
ITU is preparing for a workshop (2-3 weeks) focusing onDisaster Management to be held in Niue in August.SOPAC will be providing the software - MapInfoand MapBasic. There will be potential for usingsatellite images for Land Cover Change.
An attachment is arriving in August from the Lands Divi-sion, Ministry of Natural Resource Development,Kiribati, for a 2 week training in GIS.
Presentations
Update on GIS-Crime Analysis projectRashmi Rita; FLIS
Update on GIS activities at Bureau of StatisticsTurega Christopher; Bureau of Statistics
Aerial Photograph Rectification Using GPS SurveyedGCPsVilici Kalou; FEA
GIS activity at Fiji School of MedicineZaid Ali, Frank Piscioneri, Jan Pryor; Fiji School ofMedicine

4 Fiji & South Pacific GIS/RS NEWS 1998.03 October, 1998
E-mail access concerns voicedat August meeting
Fiji GIS/Remote Sensing User ForumMinutes of August, 1998 MeetingConference Room, FLIS Support CentreAugust 10, 1998
Welcome
Iliatia opened the meeting at 14:15
Representatives from ALTA, FEA, Forestry Department,FLIS, GLISSPAC, Lukemine, MRD, NLTB, SOPAC,Bureau of Statistics, Telecom, USP.
Updates
ALTA
The Chair first gave congratulations to Asesela for his newappointment at ALTA
ALTA is just setting up and he envisions a working envi-ronment using ARC/Info, MapInfo, and Erdas. Hehopes to carry out complete basic analysis and imageprocessing.
Forestry
Restructuring process has resulted in the lost of AseselaWata to ALTA
Fiji Hardwood Corporation Limited discussions still on-going
Project on-going for Logging Planning for Mahoganystands with emphasis on road alignment, verificationof Mataqali boundaries, and verification of smallcreeks. Emphasis on environmental concerns. Projectincludes using GPS rover for positional control.
Training: V. Latilevu attends "RS/GIS in Watershed Man-agement" course inThailand
Other projects on-going as normal
FEA
Attachment of FEA staff with SOPAC examiningMAPBASIC
FLIS
Vanua View system was commissioned yesterday (more inpresentation)
Modification of T&P system completed and now beingtested
Electoral mapping�first drafts completed and now withBoundaries Commission.
Street Addressing Committee moving ahead with PilotProject (Princes Road to Nausori). Rashmi Rita isFLIS representative
Other Business
James Britton indicated that FLIC had given strong sup-port to the year-end conference, and he urged all membersof the User Forum to begin considering their presentationsor contributions. He reminded Forum members that theintention of this first conference was for each participatinggroup to outline the progress they had made over 1998,for example, challenges overcome, work completed,problems still ahead, and plans for the future.
The issue of communications between members of theGIS community was discussed. Noted were the contribu-tions of FLIS News and the newly re-established SouthPacific GIS/RS News. Several members raised the issueof electronic communications, particularly e-mail. It wasnoted that most members of the User Forum were notconnected to e-mail and the Internet. Such a connectionbrings many advantages, especially in the areas of learning,problem solving, and sharing ideas and concerns amongother members of the local GIS community and outsideexperts. Such communication is fast and inexpensive.
Examples of possibilities raised were electronic distribu-tion of the above-mentioned journals, minutes of theGIS/RS User Forum minutes, and the use of GISPac Net,the Internet-based GIS information sharing network,which allows questions from individuals to be broadcasteasily to a range of users and experts in GIS locally andaround the world. Extensive educational resources areavailable via the Internet and could be accessed by mem-bers. This is especially important given the high need forGIS education among all members
The consensus was that all efforts should be made toconnect members of the local GIS community as soon aspossible. Efforts to support this would include awarenessarticles and discussion with various managers and othergroups by members of the User Forum, particularly thosewho are connected. (A discussion of GISPac Net isavailable in the GIS/RS News issue 98-02)
Next Meeting
Second Tuesday in August (11th).
Location to be announced
Close
James Britton thanked everyone for attending.
1998.03 October, 1998 Fiji & South Pacific GIS/RS NEWS 5
GLISSPAC (Private Sector)
Has established links with Ed Lyons and AirResearch inAustralia and is open for project ideas/opportunities
Lukemine
Noted delivery problems with some Trimble ProductsTrimble Website has data about Trimble product Y2K
compliance. Follow-up in GIS/RS NewsNoted that Garmin GPS Units sent to USP (see July
minutes) worked out to about F$500, plus taxes
MRD
Analysis/Interpretation of Aeromagnetic data leadingtowards a Regional Integrated Mapping (RIM)project is underway to produce geological maps
Manipulation of Bathymetric satellite altimeter data for FijiEEZ has started. Hopefully a compilation of surficialinformation will provide a platform for a structuralinterpretation of Fiji's EEZ
NLTB
Data input for leases continues in Central and EasternDivisions
Providing ALTA lease data maps to GovernmentProviding support land data to Monasavu land dispute
issue
Bureau of Statistics
Polygonisation of EA data will be completed by end ofweek
Telecom (as provided in presentation)
Completion of base data, with completion projected forJune 1998
Sixty percent of land coverage is now live.Training is ongoing with workshop and completion by
August 1998
SOPAC
Conducting workshop March 10-12 in the Cook Islandson GIS for marine resources and disaster reliefmanagers
FEA have begun project similar to work already underwayin Solomon Islands
Working on cadastral mapping project in NuieDistributing MapInfo 4.5Provided two weeks training in MapBasic programming.
The programs created update the MapInfo standardmenu; the programs are transferable to other utilities;the source code is open
On Wednesday 12.08.98, a GPS base station and one roverunit will be delivered to TEPB in Tonga. Both partswere tested and they are working well
LADS Corporation (Australia) explained their system atSOPAC. The laser based instrument can record waterdepth up to 70m with a spatial resolution of 5m orbetter. The system is GPS connected, the raster data
can be easily used to produce sea bed surface mod-els; however, such surveys are very expensive. Anarticle will be included in the next newsletter
On Wednesday this week the water utility of Suva will visitSOPAC to discuss transfer of FEA GIS set-up
SOPAC is in discussion with NRSA (in India) for purchaseof panchromatic 5m resolution image data. This willbe an input for a GIS/RS workshop held in Niue byend of November this year.
Seismic microzonation maps are now available for thecities Suva, Honiara, Port Vila and Nukua'lofa
The building and assets survey for these four cities iscomplete regarding the fieldwork. Data postprocessing is in progress
USP
Nothing new since semester start (see last month)
The meeting Chair noted the importance of the updatesand asked all members of the User Forum to providequality updates.
Presentations
Suva Area GIS Backdrop Data from Aerial PhotographyOlivier Dupperay, SOPACNotes: Rectified Digital Aerial Photography Data isavailable for $50.00. Format: .TIF files with accom-panying MapInfo .Tab files
Vanua ViewRashmi Rita, FLISNotes: Vanua View is a fast-access, seamless viewerof GIS dataCurrently has cadastral data enteredData and system will be available at commercial ratesthrough FLIS
Update on Telecom ProjectsS. Shandil, TelecomNotes: System is coming together wellData conversion is completedOver 100 networked users over the country
Other Business
None
Next Meeting
SCC was asked if they could host the next meeting. Theywill investigate, but have not hosted before. JamesBritton agreed to coordinate the meeting for SCC.Next meeting is Tuesday, September 8th.
Close
Ilaitia thanked everyone for attending

6 Fiji & South Pacific GIS/RS NEWS 1998.03 October, 1998
Meeting held at Suva CityCouncil for first timeFiji GIS/Remote Sensing User ForumMinutes of September, 1998 Meeting2nd Floor Foyer, Suva Civic Centre
Welcome
The Chair, Mr. Kevin McConell brought the meeting toorder at 2.20
Aneesh Singh, gave a short welcome speech on behalf ofthe host, Suva City Council .
Representation from NLTB, GLISSPAC, Police, Wood &Jepson, USP, SOPAC, MRD, FSM, Agriculture-Landuse,Telecom, Forestry, PWD, FEA, FLIS, Lukemine
Updates
Agriculture-Landuse
Soil map of Fiji completed
FLIS
Two pilot projects underway�Property Addressing andSite Suitability for Commissioner Central
VanuaView Version 1.1 to be released soonThe objection period for election mapping over, final
mapping to be completed in two weeks
Forestry
Lukemine
MapInfo Version 5.0 to release soon
MRD
Aerial-magnetic Data�Ground truthing is been carriedout by geologists using the magnetic susceptibilitymeter.
Large parts of VitiLevu have been covered and at presentwork is under way for the Vanua Levu region. Thiswill Contribute to the production of Fiji�s ??? maps
Mine Tenanment area Management - Work has began tomanage Fiji�s surface area leased for mining prospect-ing purpose through a GIS Based database
Bathymetry Data- The processing of altimetry data forFiji�s EEZ is still underway. It is hoped that resultswill be available in SOPAC�s annual session at the endof October.
PWD
Digitizing in Suva & Nausori Area
SOPAC
Recording ground control points for rectification ofAirsearch Photographs
Rectification of Honiara air-photosHydrodynamic modelling of Majuro
Telecom
Data maintenance work for Tamavua, Samabula and Suvaare underway with completion expected by October30, 1998
Data capture for Nasinu Cabinet �E�-Laucala Beach arearecabling pilot project is underway with completionexpected by September 18, 1998
Rolta staff currently on-site training staff for these projects.Suva City house numbering project nearing completion.
Approximately 7,500 houses complete with 3,000more to go.
Lautoka addressing beginningCane farm number data has been found. Over 22,000
farms to be entered into system by October 30, 1998GIS system now in use for customer applications with
excellent results. Data available for Central andWestern Divisions and Lautoka.
Requirements analysis completed for Phase II (blockwiring) project. Application due for completion byFebruary, 1999
Overall GIS end-user logs show increased GIS usageacross system.
USP
On Mid-Semester Break
Presentations
Addressing UpdateS. Shandil, Telecom
Project UpdatesOlivier Duperyay, SOPAC
FMG Datum UpdateFranck Martin, SOPAC
Other Business
None
Next Meeting
FEA to host the next meeting in Lautoka on Tuesday 13th
October at 10.00.
Close
Kevin McConell thanked everyone for attending.

1998.03 October, 1998 Fiji & South Pacific GIS/RS NEWS 7
Local System News and Updates
GIS and Remote Sensing Unitfor Agricultureby Asesela Wata
Introduction
The Land Development and Resettlement Unit of Fiji�sAgricultural Department wants to establish its own GISand Remote Sensing unit to add spatial data to the existingtabular database. This is necessary for two reasons:� The forecast of agricultural harvest becomes more
important and it is essential to add area informationto any tabular data, to enhance precision;
� Agricultural area becomes smaller and potentialagricultural areas have to be identified, which requiresspatial data analysis to estimate the land capability.
Available Data and Required Spatial Data
The Agriculture Department already holds data about theproduction costs such as� Work unit costs for agricultural production,� Amount of fertiliser used,� Degree of mechanising,� Distance of the production area to the market.
To estimate the market development it is essential to know:the exact area of production and classified informationabout the area, e.g. due to� soil categories,� slope classes,� water drainage categories,� land tenure restrictions,� flood risk levels.
To obtain this information it has to be imported to digitalmap layers, such as� Mataqali boundaries;� Infrastructure, roads, tracks, bridges etc.;� Soil maps;� Rainfall maps;� Slope, exposition and height above sea level;� Flood risk levels
(detailed contour lines for lower area).
Other information has to be analysed from remotelysensed data, such as� Recent land use,� Change of land use,� Land slides.
Expected Output
The main output is expected as clear statistic figures basedon exact area analysis combining and analysing differentinformation layers.
Besides this, maps are required at 1:50,000, 1:25,000 and1:10,000 scale showing the location of different harvestexpectation and potential agricultural areas. Such maps arenot only necessary on management level, but also onoperational level to assist in planning and performance.
Required Hardware and Software
ArcInfo is already available at the Agriculture Department.MapInfo will be added. To perform overlay analysis forscattered areas at 1:50,000 scale a raster data GIS is re-quired. For land cover analysis, land cover change detectionor erosion monitoring remotely sensed data has to beanalysed. This can be done with aerial photographs ifrecent images are available and purchasing satellite data willbe carried out. Satellite data will become more importantbecause a new generation of data is expected by the endof the year, allowing thematic mapping up to to 1:10,000scale.
Both image analysis packages ER-Mapper and ERDASImagine will handle both raster data GIS analysis and allfunctions of image handling such as geometric correction,image enhancement and image classification. It is still openwhich of the two software packages will be purchased.The hardware will include PC, an A1 size ink jet plotter,digitising table and backup media.
GIS For Crime Analysisby Rasmi RitaProject Officer, FLIS
Why GIS for Crime Analysis?
For decades, police departments have relied on paper �pinmaps� to identify crime locations and patterns. Crimeanalysts from each station update crime locations each dayby manually inserting pin markers on outdated printed wallmaps of their patrol areas. Although is possible to seecrime locations, there is no connection between the pinmap and the reports. This situation is slowly changing, aspolice departments are becoming aware of the capabilitiesof Geographical Information Systems (GIS). GIS systemsstore and manage representations of geographic features.These same systems also store attributes of these features,permitting spatial analysis of variables that cannot be easily

8 Fiji & South Pacific GIS/RS NEWS 1998.03 October, 1998
visualised with tables and lists. GIS has great potential incrime analysis because of its three key functions: databasemanagement, spatial analysis and visualisation. Thesefunctions provide the capabilities of linking criminal actsand their multiple characteristics with their geographiclocations. GIS is a sophisticated tool which can perform awider range of analysis tasks and provide clues for policeinvestigations.
Local System News and Updates
...continued from previous page.
Social Issues
Crime is a social problem everywhere and no developmentin either law or penology seems to have any impact on theproblem. On the other hand, improvement in policetechnology, crime analysis and efficient use of resourceshas had a significant effect (David A. Thomas, Reader inCriminal Justice, University of Cambridge; author ofPrinciples of Sentencing). The objective of police and society isto reduce criminal activity. The problem is not simplyovercoming the fear of crime but also discerning where,why and who is committing those crimes. There is a needto understand the correlation between the socio-economicstructure of community and nature of criminal activity inorder to solve and prevent crime. GIS is a tool which willhelp the police do this. GIS analytical capabilities can helpvisualise the correlation and track crime patterns. GIS hasthe potential to help target crime areas with preventivemeasures. Through GIS, communities could be givenbetter information on crime in their immediate areas. Thiswould help the community to work with law enforcementofficials to determine what are best means to reduce thecrime rate in their neighbourhood
Fiji Police Force Pilot Project
One of the key functions within the remit of the Fiji PoliceForce�s daily responsibilities is its crime analysis operationalactivities. The work involves locating and identifying crimepatterns using paper pin maps to assist in the investigation.However, this method has various shortcomings, such asbeing fairly labour intensive, time consuming and havinglimited display capabilities. With the apparent increase inthe crime rate within Fiji, it was realised that the currentsystem cannot cope up with the increasing demand orwork load. Therefore, a more sophisticated tool is neededby the Fiji Police Force to address these difficulties withinthe present system for more effective and efficient services.By using Geographical Information systems (GIS) as analternative method of analysis, not only can the currentdifficulties be overcome but the Police Force will be ableto perform a wider range of analysis functions.
However, members of the Fiji Police force are not fullyaware of the capabilities of a GIS system in crime analysis.As a result of a recent visit to the Fiji Land InformationSupport Centre (FLISSC) by a delegation of senior policeofficers led by the Commissioner of Police, it was decidedthat a pilot project should be developed for the Police.Developing pilot projects is part of FLISSC awarenessprogram. FLISSC set up a pilot project named �CrimeAnalysis and Mapping Prototype� (CAMP). Its majorobjective is to develop a prototype GIS System for crimeanalysis for Suva City in order to demonstrate the effec-tiveness of using GIS for crime analysis to the Fiji PoliceForce.
The area chosen for the pilot project was Suva Peninsular,which consists four police stations and districts - Central,Raiwaqa, Samabula, and Nabua. Using MS Access for theattribute database and MapInfo Professional 4.5 for theGIS components, FLISSC established a sample systemusing crime reports from the first quarter of 1998.
Map 1: Stations, Posts, Boundaries and Crimes
Map 2: Crime by category

1998.03 October, 1998 Fiji & South Pacific GIS/RS NEWS 9
First a database was set up and a crime report formcreated. Hard copies of the forms, which also included apage for sketch of location, were sent to each station.From the sketch map on the crime report form the crimelocation could be linked to the spatial database. Details ofthe individual crime, also found on the report form, madeup the attribute tables attached to the spatial data. Policestations, posts and boundaries were digitised into thesystem, and existing spatial data layers from CCMS wereimported to form the spatial database. Then using thesketches from the forms, each crime was plotted andcrime number (key field) entered.
The database and maps were linked. A custom programautomatically filled x & y coordinates and the key field inthe database. All the other details of crime were recordedin the Access attribute database because it is easier tohandle relationships such as one crime, many suspects in adatabase. Now since the crime locations were mapped andthe details were in both MapInfo tables and Access tables,it was possible to create queries, thematic maps, buffersand other GIS Analysis.
Since such queries were generally not possible or feasibleusing the older, manual systems, Police Force staff werenot sure at first what sort of queries would be useful orpossible. However, once the capabilities of the systemwere clear, they soon worked out a series of useful queries.These included· Crime locations· Distance from a particular feature· Number of crimes per district· Crime hot spots· Crimes modus operandi same.Suspect details
It was also possible to create thematic maps by category,modus operandi, detection, crime density, etc. Such mapshad never been created by the Police Force. Maps 1 and 2show crime locations by crime category.
There are many questions that could be answered by such acrime-related GIS system; however in this pilot project therange of possible queries was limited by the number ofattributes for each crime available through the crimereports filled in by the reporting officers.
In order to set up a workable GIS System, the Police Forcehas to first improve and set strict standards for datacollection and recording procedures and to ensure that thefield police officers adhere to these standards. FLISSC hasbeen able to show the Police Force the advantages of usingGIS. Although the use of information technology has and
Local System News and Updates
will provide the ability for more sophisticated systems, theFiji Police Force has to make a start in adapting theirmethods to support such systems.
FLISSC and Fiji Police Force would like to acknowledgeUSP, SOPAC & Digital Corporation for their support inthis pilot project.
Mapping at Management Serv-ices Division, Department ofForestry
By Eroni Tupua and Samu UluikadavuManagement Services Division, Department of Forestry
Introduction
The mapping system at Forestry was installed as part ofthe AusAID funded Fiji Forest Resource Tactical PlanningProject (1994-1996). The installation of the system andtraining of staff was carried out during the period 1994-95. This paper documents the system, and reviews itsprogress to date.
Purpose of the System
The system was installed to allow Forestry to prepare1:10,000 scale topographc base maps. These maps are usedin the preparation of logging plans. Logging plans formthe basis of logging operations. By having good maps,forestry operations can be better planned, which greatlyimproves the residual effects of logging. Good plans allowthe forester to� minimise where roading and skidding
tracks are placed,� avoid creeks and streams,� minimise erosion effects,� isolate logging in steep areas,� specify watercourse buffer areas.
The net outcome is that better planning leads to improvedforestry operations, and this is a direct benefit to theenvironment, in terms of cleaner water streams, andreduced siltation.
System Components
The mapping system is divided into two distinct sections.They are
10 Fiji & South Pacific GIS/RS NEWS 1998.03 October, 1998
Local System News and Updates
...continued from previous page
� A GPS system used for ground control of aerialphotography, and for adding detail to existing map-ping, and
� A computer based stereoplotting and map editingsystem.
GPS system
The GPS system consists of a base station and a hand heldGeoExplorer receiver. A further two receivers wereacquired, one supplied jointly by the AusAID project andForestry, and the other by the European Union fundedhardwood plantation project (1996). The Department ofForestry now has three roving GeoExplorer receivers.
The Trimble Navigation Community base station wasinstalled on the top of the Forestry garage at Colo-i-Suva.This point was surveyed accurately by The Department ofLands, using their survey grade GPS receivers. Co-ordi-nates were supplied in both WGS-84, and Fiji Map Grid(FMG).
The mapping advisor to the AusAID project subsequentlyderived a uniform set of parameters to be used in thetransformation between WGS-84 and Fiji Map Grid. TheGPS system works on the WGS-84 spheroid, while the FijiMap Grid is based on the WGS-72 spheroid.
When the system is used in differential mode, a singleobservation is accurate to the 2-5 metre level. This is theaccuracy as supplied by the manufacturer, and our experi-ence with the system verifies this accuracy. It is possible toincrease this accuracy by observing a greater number ofGPS observation at each point observed.
Transformation Parameters
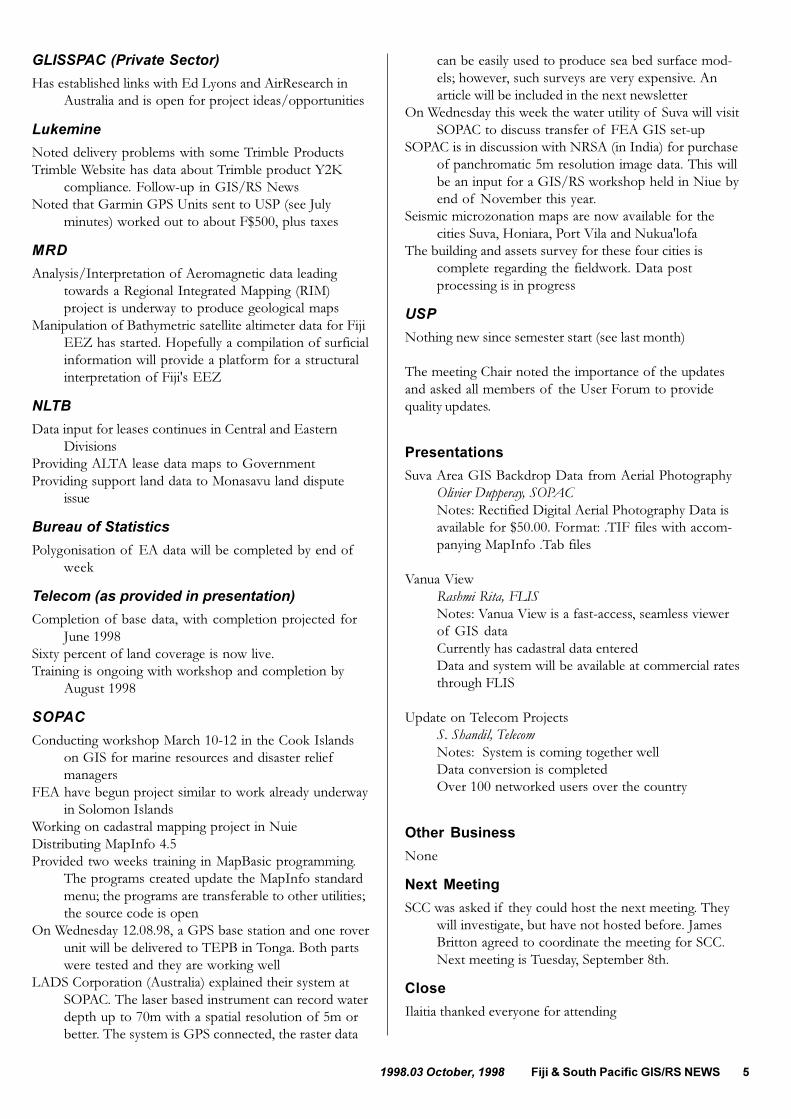
The transformation parameters were derived from a setof First Order control co-ordinates provided by theDepartment of Lands. The network included points in VitiLevu, Vanua Levu and the Lau group. The transformationparamters derived can be considered to be accurate at theone metre level. These parameters were derived for use inpreparing 1:10,000 scale forest maps. Care should be takenif these parameters are used for other applications. Theseven parameters derived are :Parameters from WGS-84 to WGS-72X = -35.176 metres x = 1.371 secsY = 136.57 metres y = -0.842 secsZ = -36.965 metres z = -4.718 secsScale = 1.537 ppm
Use of the GPS system
The GPS system is used for the ground control of aerialphotgraphy, and for adding mapping detail to existingmapping. Points are identified on the aerial photography,and survey ground control is derived using the GPS rovingreceivers in the field. When selecting points in the field, afield stereoscope and aerial photographs are used to ensurethat the correct point is chosen. A minimum of 120 GPSobservations at 5 second intervals is observed for eachpoint. Initial trials of the GPS system of the system, byobserving other First and Second order control throughoutFiji, has provided Forestry with the confidence that pointscan be observed to the one metre accuracy level.
The GPS system is also used for adding detail to theexisting base maps. Some of the aerial photography used isoften dated, and in time infrastructure features such asroads and logged out areas change. This detail is nowmapped using GPS and the information overlayed in themapping system to reflect the changes. Lease boundaries,compartment and stand boundaries can also be mappedand overlayed onto the mapping.
The Mapping System
The mapping system installed at the Management ServicesDivision is a Zeiss Visopret, connected to the computerbased Microstation package. This allows the operator toview stereospopic aerial photography and directly map theterrain with both point and line features. In general thefollowing detail is collected :� linear features such as ridgelines, creeks, and roads;� spot heights;� where applicable, cleared and/or vegetated areas;� buildings, villages and other artificial features.
After the collection of data from the stereoplotter, the datais transferred to another computer, also running theMicrostation software. This system has Microstation andand an add-on software package called GWN-DTM,which allows the operator to build a digital terrain modelusing the data collected from the stereoplotter. Afterbuilding the terrain model, contours are automaticallyproduced, and final map editing allows the production ofmaps at 1:10,000 scale.
The GWN-DTM software package has the ability toproduce the following products from the digital terrainmodel:� Slope analysis,� Plane and slope areas� Longitudinal sections,� Road design and volumes,� Aerial Triangulation.

1998.03 October, 1998 Fiji & South Pacific GIS/RS NEWS 11
Local System News and Updates
Aerial trinagulation is the process of extending groundcontrol to aerial photography without the need to acquire4-6 ground control points for each stereo-model. Theprocess requires the operator to prepare the aerial photog-raphy by placing marks on the photographs (pugging)using a point transfer device. The marks are then observedin the stereoplotter and the results processed through acomputer program that computes the ground controlcoordinates for each pug mark. As part of the mappingsystem the program PAT-M was purchased to undertakethis adjustment. In undertaking the aerial triangulation,Forestry uses the Department of Lands point transferdevice, while Lands uses Forestry´s PAT-M program.
Mapping Progress
The mapping system was installed in April 1994, andtraining of staff within the Forestry department com-menced from that date. Up to the period December 1995,a total of approximately 52,000 hectares of 1:10,000 scaletopographic mapping was completed. Since 1996, afurther 62,000 hectares have been completed. The Depart-ment is now at a stage where demand has been met, andthere is now a slowly declining need for further mapping.The emphasis is now on preparing 1:10,000 scale topo-graphic maps for the hardwood plantation areas.
Acknowledgements
The authors would like to thank AusAID for their majorcontribution to the provision of the mapping system andthe local training of counterpart staff. The benefits of themapping combined with the training of forestry staff inlogging planning has greatly enhanced the standard offorest harvest practices in Fiji.
GIS/GPS Systems for the SuvaWater Supply
A recent meeting was held between the management ofthe Suva Water Supply (under the Water and SewerageSection of PWD) and SOPAC staffs to discuss the intro-duction of GIS/GPS systems to improve the perform-ance of Fiji�s largest water supply system. SOPAC staffmade several presentations showing what is required to setup a GIS system to meet the on going demands of theSuva water supply plus the potential benefits. The presen-tations highlighted the training aspect of the proposedproject and the fact the most additional add-on software
routines may be developed by staff themselves knowingthat SOPAC backup support is not far away.
Demonstration of a small GIS example containing waterrelated information was given. Mr Wilisoni, PrincipalEngineer, got an insight into the power of GIS based datamanagement and its application to the operation of awater utility. The possibility to collect data by using GPSand the need to connect to GIS with water distributionmodeling software was emphasised.
The next step is to develop a project that meets the currentand future needs of the Suva Water Supply.
Vanua View:Land titles for the masses.Observations by Franck MartinSOPAC
The Fiji Land Information System, FLIS, is introducing anew tool for land planners, real estate agencies and otherbodies. Vanua View is a software package developed byTerraLink, a New Zealand company, to visualise thegeographical information held at FLIS. This package iscomposed of a CD containing the data and the softwareto display the data. The FLIS is planning to providemonthly upgrades. A subscription scheme will be availableto customers.
The software allows the display of the cadastral informa-tion of Fiji. It will simplify the process of locating infor-mation about land plots. The advantage of the software isits fast rendering engine and its query system, which hasbeen tailored for the Fiji data sets. However, the systemdoes not allow exporting data and its sole purpose is onlydata displaying. It is unfortunate that the software does notallow reporting of geographical co-ordinates of land unitsas registered through surveys. It is understood that thisfunction is not available as the original data stored onMicrostation is not organised as land units but simply as aline collection which does not retain geographical informa-tion such as surfaces and tabular information.
Vanua View brings new flexibility to the land information,as it will set the FLIS in a process of monthly updatesavailable to the public. It also fits in the FLIS policy of costsustainability of the land information system by requestingusers to pay for the data; however, one may wonder whygovernment bodies and the public should pay for data theyalready own through taxes.
12 Fiji & South Pacific GIS/RS NEWS 1998.03 October, 1998
System News
Laser Now Collects New Coastal Datafor All Pacific GIS Usersby Hamish JollyLADS Corportation
High density bathymetric data represents the basic GISdata set required by GIS managers for decision-support inrelation to marine coastal zone management issues andinshore marine resources. This is particularly important forPacific Island nations whose populations rely heavily on thecoastal marine environment.
Using advanced techniques, coastal bathymetric data cannow be collected quickly and cost effectively using theLaser Airborne Depth Sounder (LADS Mk II), so that afull coastal bathymetric data set (for waters up to 70mdeep) is now within reach of most Pacific Island nations.Where development funding may be required, the full dataset can be delivered in a timeframe consistent with aconventional development project.
The new generation LADS Mk II surveys up to 64sq kmper hour, to a depth of 70 metres at a fraction of the costof conventional surface vessel operations. As well asnautical charting to IHO Order 1 accuracy, the high densityprocessed ASCII digital data products underpin GISmodelling and analysis for:� Coral Reef Management� Fisheries and Aquaculture Management� Mineral, Oil and Gas Resource Development� Inshore Marine Transport� Environmental and Waste Management� Natural Resource Management� Tourism
Australian Experience in the Pacific Environ-ment:
The LADS system has been used in continuous routinesurvey by the Royal Australian Navy for nearly six yearsand has collected 45,000sq km of survey data over theGreat Barrier Reef in the Pacific and in the Timor Sea.New generation LADS Mk II surveys are now beingconducted commercially worldwide through LADSCorporation Limited of Australia.
In Australia, LADS data has been used for identification ofnew navigation routes, territorial sea and EEZ baselines,modelling of marine processes and coral reef manage-ment. Users include the Hydrographic Office, Departmentof Transport, AUSLIG (Land Information Group),
Australian Institute of Marine Science, Great Barrier ReefMarine Park Authority, exploration companies and com-mercial tourist operators. It is estimated that with the useof LADS, Australia will reduce its EEZ survey backlogfrom 100 years to 15 years, providing critical data to theseand other GIS users in the management of Australia�scoastal marine resources.
LADS MK II System Operations - 900 Soundingsper Second
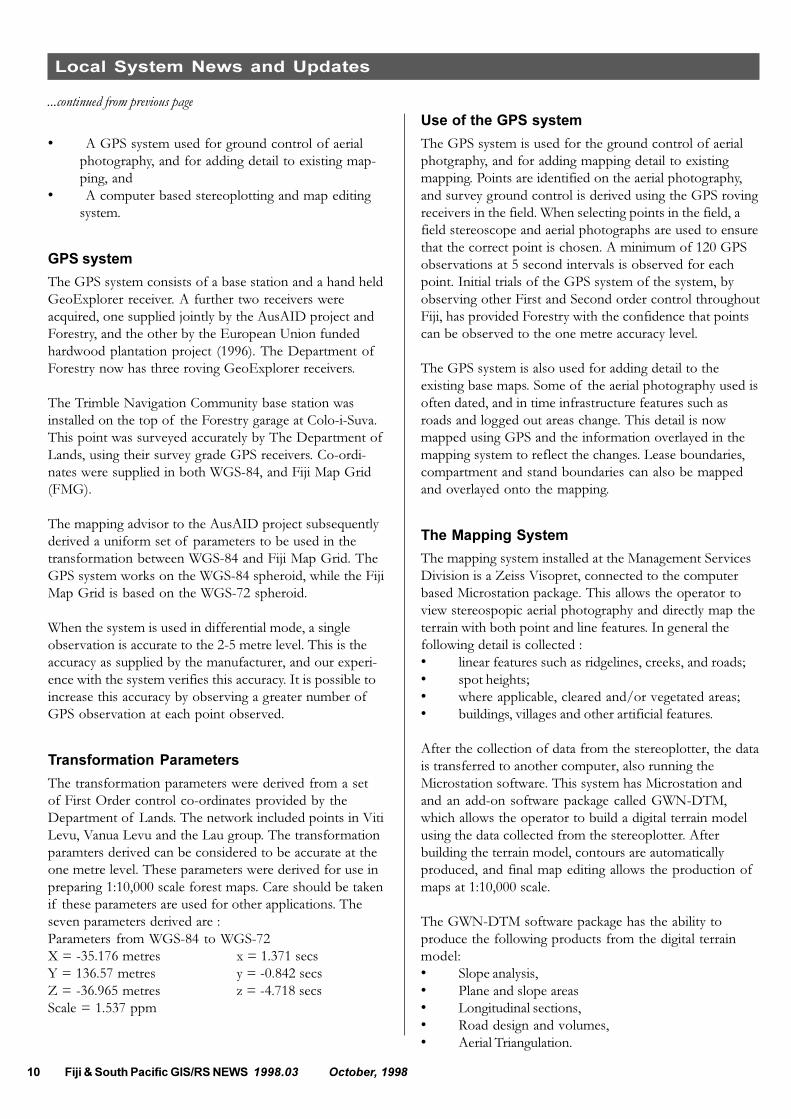
LADS is a self contained, transportable hydrographicsurvey system mounted in a fixed wing aircraft which useslaser pulses to gather accurate, high density, digital depthand position data in coastal waters.
The system uses pulsed laser to provide high densitysoundings at 900 per second in a survey swath 240m wideindependent of water depth. Each laser pulse is returned
Figure 1:LADS Aircraft with red and green laser operating

1998.03 October, 1998 Fiji & South Pacific GIS/RS NEWS 13
from the surface and also from the sea floor. The systemworks by measuring the time differential between thesetwo returns to a high level of accuracy.
Specifically, the LADS Mk II System operating specifica-tions are:
� Sounding Rate: 900 Hz (3.24 million soundings /hour
� Area coverage: 64 square kilometres / hour (19 sqnm / hour)
� Sounding density: 5m x 5m (2m x 2m, 3m x 3m,4mx 4m capability)
� Swath width: 240m� Depth range: 0.5m to 70m� Depth accuracy: S44 IHO Standard for
Hydrographic Surveys � Special Publication of 4th
Edition 1998, Order 1� Position accuracy: 5m CEP 95%� Data processing to data collection ratio: Better than
1:1� Output: Fairsheet plots and digital data in ASCII
format
The digital data products read easily into common GISapplications such as ArcInfo, Mapview and Fledermaus forGIS modelling across the full spectrum of users.
Application for Pacific Nations:
The large archipelagic maritime states of Pacific Islandnations are a significant and important resource for theircommunities. However, hampered by hazardous coralreefs which prevent conventional survey, geographicalremoteness and constraints to long term and recurrent
funding for surface vessel operations, much of the shallowwaters in these regions remain unsurveyed.
In contrast, for LADS Mk II the clear shallow seas, reefareas and remote islands of the Pacific region representoptimum conditions for survey. Using the fast fixed wingdeHavilland Dash 8 aircraft which can accommodate longtransits to remote areas in an 8 hour sortie, a complete setof fairsheets and high quality bathymetric data sets can beprovided for GIS modelling of national coastal waterswithin months rather than decades. Combined with thewide capacity for usage of data in environmental andresource management and economic and regional develop-ment, a LADS Mk II survey project is therefore an attrac-tive project option for development funding throughmultilateral or bilateral agencies active in the Pacific region.
Simultaneously, Pacific nations can discharge their obliga-tions for concise survey of EEZ regions under the UnitedNations Convention For Law of the Sea and consolidatetheir legal rights and obligations for EEZ management.
LADS Corporation Limited
LADS Corporation is a multi-disciplined company dedi-cated to LADS activities. LADS Corporation designs,manufactures, supports and provides world wide contractsurvey services using the LADS Mk II System in its Dash8-200 aircraft. LADS Corporation personnel includesengineers (computing, electronics, mechanical and optics),scientists, project development specialists and hydrographicsurveyors.
Hamish Jolly is Project Development Manager with LADS Corpo-ration LimitedTelephone: +61-8-8300 4447 FAX: +61-8-8349 7528e-mail: [email protected]: http://www.vsl.com.au/lads
Figure 3: 3D view of coral reef enclaveFigure 2: 3D Passage between reef
14 Fiji & South Pacific GIS/RS NEWS 1998.03 October, 1998
Regional System News and Updates
Charting In Tonga
By Stuart EvansChief Hydrographer, Tongan Army
Tonga is a Kingdom of over 170 islands, spread overabout 400 miles in a roughly NNE/SSW alignment. Someof Fiji�s islands are closer to the main island of Tongataputhan the outer Tongan islands. Some of the greatest depthson Earth are to be found in the Tonga Trench to the eastand some of the world�s most complex volcanic and coraltopography is to be found in the shallow waters andcoastal zones of the Tonga Ridge.
Charting the seabed throughout this area would be chal-lenging with even the most advanced technology. It is thatmuch more difficult without the resources to acquire andoperate new technology and equipment.
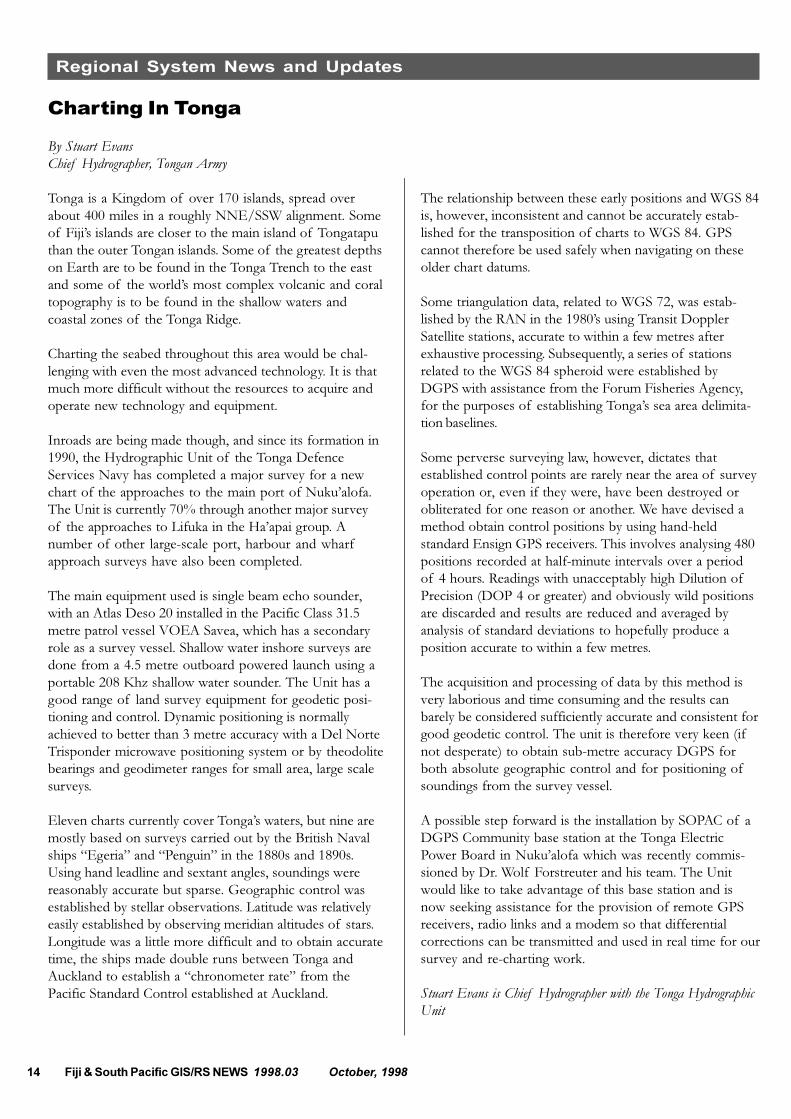
Inroads are being made though, and since its formation in1990, the Hydrographic Unit of the Tonga DefenceServices Navy has completed a major survey for a newchart of the approaches to the main port of Nuku�alofa.The Unit is currently 70% through another major surveyof the approaches to Lifuka in the Ha�apai group. Anumber of other large-scale port, harbour and wharfapproach surveys have also been completed.
The main equipment used is single beam echo sounder,with an Atlas Deso 20 installed in the Pacific Class 31.5metre patrol vessel VOEA Savea, which has a secondaryrole as a survey vessel. Shallow water inshore surveys aredone from a 4.5 metre outboard powered launch using aportable 208 Khz shallow water sounder. The Unit has agood range of land survey equipment for geodetic posi-tioning and control. Dynamic positioning is normallyachieved to better than 3 metre accuracy with a Del NorteTrisponder microwave positioning system or by theodolitebearings and geodimeter ranges for small area, large scalesurveys.
Eleven charts currently cover Tonga�s waters, but nine aremostly based on surveys carried out by the British Navalships �Egeria� and �Penguin� in the 1880s and 1890s.Using hand leadline and sextant angles, soundings werereasonably accurate but sparse. Geographic control wasestablished by stellar observations. Latitude was relativelyeasily established by observing meridian altitudes of stars.Longitude was a little more difficult and to obtain accuratetime, the ships made double runs between Tonga andAuckland to establish a �chronometer rate� from thePacific Standard Control established at Auckland.
The relationship between these early positions and WGS 84is, however, inconsistent and cannot be accurately estab-lished for the transposition of charts to WGS 84. GPScannot therefore be used safely when navigating on theseolder chart datums.
Some triangulation data, related to WGS 72, was estab-lished by the RAN in the 1980�s using Transit DopplerSatellite stations, accurate to within a few metres afterexhaustive processing. Subsequently, a series of stationsrelated to the WGS 84 spheroid were established byDGPS with assistance from the Forum Fisheries Agency,for the purposes of establishing Tonga�s sea area delimita-tion baselines.
Some perverse surveying law, however, dictates thatestablished control points are rarely near the area of surveyoperation or, even if they were, have been destroyed orobliterated for one reason or another. We have devised amethod obtain control positions by using hand-heldstandard Ensign GPS receivers. This involves analysing 480positions recorded at half-minute intervals over a periodof 4 hours. Readings with unacceptably high Dilution ofPrecision (DOP 4 or greater) and obviously wild positionsare discarded and results are reduced and averaged byanalysis of standard deviations to hopefully produce aposition accurate to within a few metres.
The acquisition and processing of data by this method isvery laborious and time consuming and the results canbarely be considered sufficiently accurate and consistent forgood geodetic control. The unit is therefore very keen (ifnot desperate) to obtain sub-metre accuracy DGPS forboth absolute geographic control and for positioning ofsoundings from the survey vessel.
A possible step forward is the installation by SOPAC of aDGPS Community base station at the Tonga ElectricPower Board in Nuku�alofa which was recently commis-sioned by Dr. Wolf Forstreuter and his team. The Unitwould like to take advantage of this base station and isnow seeking assistance for the provision of remote GPSreceivers, radio links and a modem so that differentialcorrections can be transmitted and used in real time for oursurvey and re-charting work.
Stuart Evans is Chief Hydrographer with the Tonga HydrographicUnit
1998.03 October, 1998 Fiji & South Pacific GIS/RS NEWS 15
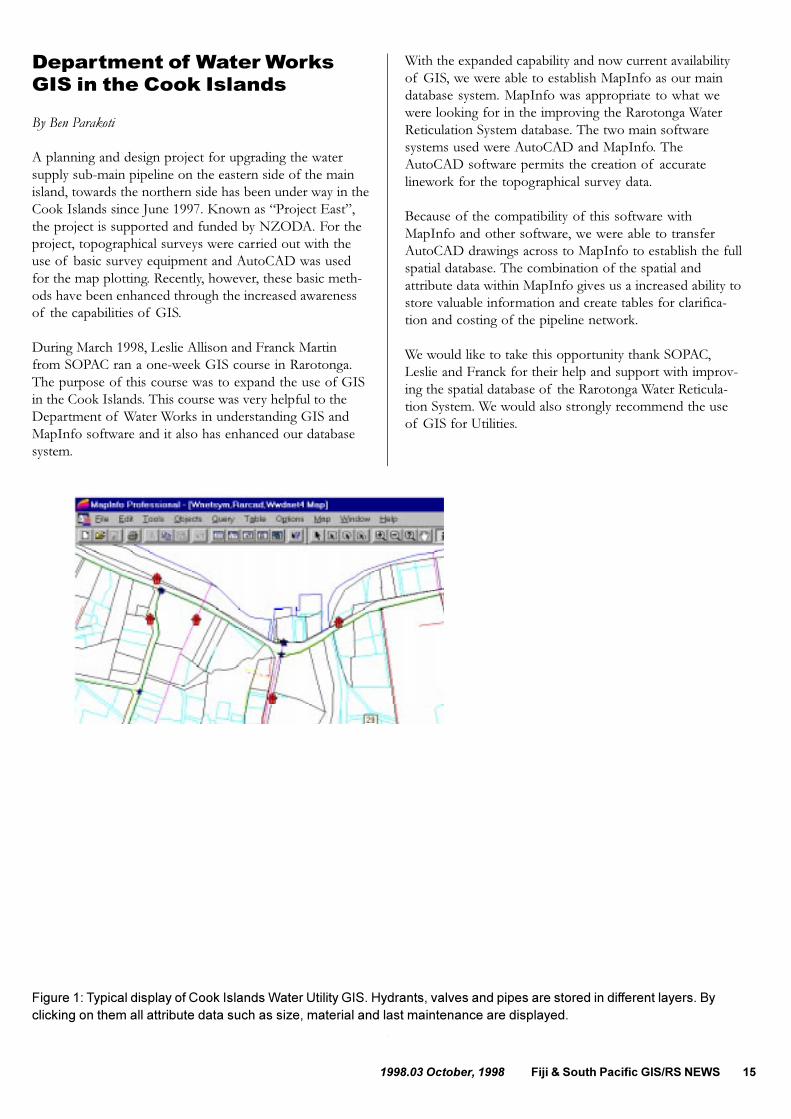
Department of Water WorksGIS in the Cook Islands
By Ben Parakoti
A planning and design project for upgrading the watersupply sub-main pipeline on the eastern side of the mainisland, towards the northern side has been under way in theCook Islands since June 1997. Known as �Project East�,the project is supported and funded by NZODA. For theproject, topographical surveys were carried out with theuse of basic survey equipment and AutoCAD was usedfor the map plotting. Recently, however, these basic meth-ods have been enhanced through the increased awarenessof the capabilities of GIS.
During March 1998, Leslie Allison and Franck Martinfrom SOPAC ran a one-week GIS course in Rarotonga.The purpose of this course was to expand the use of GISin the Cook Islands. This course was very helpful to theDepartment of Water Works in understanding GIS andMapInfo software and it also has enhanced our databasesystem.
With the expanded capability and now current availabilityof GIS, we were able to establish MapInfo as our maindatabase system. MapInfo was appropriate to what wewere looking for in the improving the Rarotonga WaterReticulation System database. The two main softwaresystems used were AutoCAD and MapInfo. TheAutoCAD software permits the creation of accuratelinework for the topographical survey data.
Because of the compatibility of this software withMapInfo and other software, we were able to transferAutoCAD drawings across to MapInfo to establish the fullspatial database. The combination of the spatial andattribute data within MapInfo gives us a increased ability tostore valuable information and create tables for clarifica-tion and costing of the pipeline network.
We would like to take this opportunity thank SOPAC,Leslie and Franck for their help and support with improv-ing the spatial database of the Rarotonga Water Reticula-tion System. We would also strongly recommend the useof GIS for Utilities.
Figure 1: Typical display of Cook Islands Water Utility GIS. Hydrants, valves and pipes are stored in different layers. Byclicking on them all attribute data such as size, material and last maintenance are displayed.
16 Fiji & South Pacific GIS/RS NEWS 1998.03 October, 1998
Regional System News and Updates
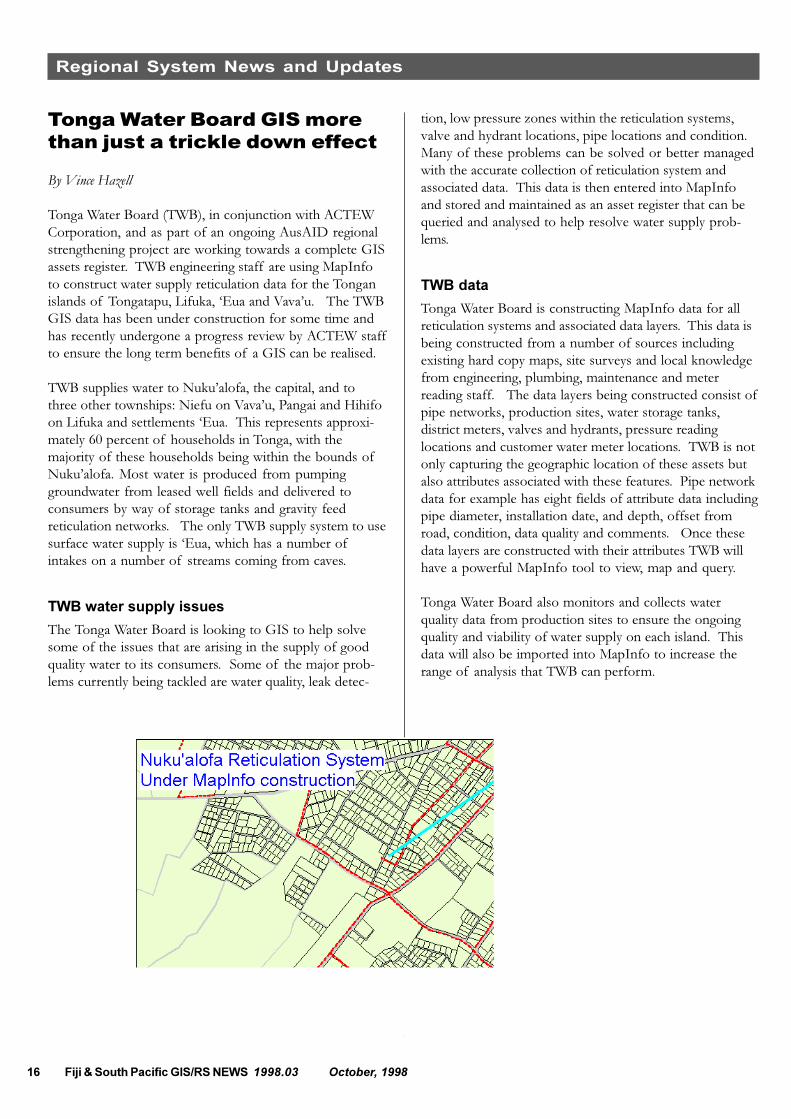
Tonga Water Board GIS morethan just a trickle down effect
By Vince Hazell
Tonga Water Board (TWB), in conjunction with ACTEWCorporation, and as part of an ongoing AusAID regionalstrengthening project are working towards a complete GISassets register. TWB engineering staff are using MapInfoto construct water supply reticulation data for the Tonganislands of Tongatapu, Lifuka, �Eua and Vava�u. The TWBGIS data has been under construction for some time andhas recently undergone a progress review by ACTEW staffto ensure the long term benefits of a GIS can be realised.
TWB supplies water to Nuku�alofa, the capital, and tothree other townships: Niefu on Vava�u, Pangai and Hihifoon Lifuka and settlements �Eua. This represents approxi-mately 60 percent of households in Tonga, with themajority of these households being within the bounds ofNuku�alofa. Most water is produced from pumpinggroundwater from leased well fields and delivered toconsumers by way of storage tanks and gravity feedreticulation networks. The only TWB supply system to usesurface water supply is �Eua, which has a number ofintakes on a number of streams coming from caves.
TWB water supply issues
The Tonga Water Board is looking to GIS to help solvesome of the issues that are arising in the supply of goodquality water to its consumers. Some of the major prob-lems currently being tackled are water quality, leak detec-
tion, low pressure zones within the reticulation systems,valve and hydrant locations, pipe locations and condition.Many of these problems can be solved or better managedwith the accurate collection of reticulation system andassociated data. This data is then entered into MapInfoand stored and maintained as an asset register that can bequeried and analysed to help resolve water supply prob-lems.
TWB data
Tonga Water Board is constructing MapInfo data for allreticulation systems and associated data layers. This data isbeing constructed from a number of sources includingexisting hard copy maps, site surveys and local knowledgefrom engineering, plumbing, maintenance and meterreading staff. The data layers being constructed consist ofpipe networks, production sites, water storage tanks,district meters, valves and hydrants, pressure readinglocations and customer water meter locations. TWB is notonly capturing the geographic location of these assets butalso attributes associated with these features. Pipe networkdata for example has eight fields of attribute data includingpipe diameter, installation date, and depth, offset fromroad, condition, data quality and comments. Once thesedata layers are constructed with their attributes TWB willhave a powerful MapInfo tool to view, map and query.
Tonga Water Board also monitors and collects waterquality data from production sites to ensure the ongoingquality and viability of water supply on each island. Thisdata will also be imported into MapInfo to increase therange of analysis that TWB can perform.

1998.03 October, 1998 Fiji & South Pacific GIS/RS NEWS 17
TWB also intends to link the customer meter MapInfodata layer with its new customer accounts database to helpanalyse customer complaints, unpaid accounts, new con-nections and water consumption data.
How GIS will help improve water supply
Although data collection and construction of the GIS havea way to go, TWB staff are already seeing the benefits GIScan bring to the production and supply of water. Theseearly benefits include accurate mapping of assets and theability to perform spatial queries of geographic features. Agood example of MapInfo use is the identification ofsupply districts with high water loss that are to be targetedin the leak detection/control program. The use ofMapInfo also gives TWB the ability to view the waterreticulation system in conjunction with cadastral data fromthe Ministry of Lands, Survey & Natural Resources andaerial photography supplied by the Tonga Electric PowerBoard. This ability to view and query TWB reticulationdata will prove to be a corporate asset that will help toimprove the efficiency many day-to-day operations andlong term projects undertaken by TWB.
Future TWB GIS developments
It is envisaged that TWB will continue to develop MapInfoapplications and skills that will help solve many of theproblems associated with the suppling Tongan consumerswith potable water. As part of this ongoing process ofdeveloping a GIS we also hope that TWB staff will viewGIS as an integral component of ongoing business im-provement. This hope would also be aided by the forma-tion of closer ties with other organisations using MapInfowithin Tonga and the South Pacific Region.
Land and Marine Resource UsePlanning (LMRUP) in Niue Is-land
By Coral Paisisi
The Environmental Planning Unit, Department of Justice,Lands and Survey (DJLS), is using GIS and GPS in gener-ating a Land and Marine Resource Use Plan for Niue. TheUnit has been using MapInfo 3.0 for GIS, mapping andregistration of aerial photos to the cadastral base. About70% of the aerial photos covering Niue have been regis-tered with all of the coastal areas and more extensivecoverage of the southern end of the Island. This providesa good base on which to Plan and for comparison ofvegetation change over the years. In the centre of theIsland it has been harder to register photos to as there arelimited surveyed points with which to match up thephotos. The GPS units have been used in this instance.GPS is also being used to map out services, conservationareas, vegetation types, heritage sites and developmentareas.
The GPS units being used are Magellan ProMark X,brought into Niue through the AusAID sponsoredLMRUP project. They have a two to five meter accuracyusing differential mode, however combining this data withAshtech data the error can be brought down to one totwo metres accuracy. Post processing is through MSTARv2.06. The Ashtech data is in Rinex format and is fromthe base station set up at the DJLS in conjunction withothers in the Pacific Region for the University of Hawaii to
18 Fiji & South Pacific GIS/RS NEWS 1998.03 October, 1998
Regional System News and Updates
...continued from previous page
monitor the tectonic plate movement of the Tongantrench.
Thanks to SOPAC the Unit now has MapInfo 4.5 which isgoing to make post-processing of GPS data with attributesmuch easier to dump straight into the Map base.
The Unit also have a SPOT image of the whole of Niuefrom 1994 (false colouring) which is registered to thecadastral base. It has 30m resolution and is a good base onwhich to do vegetation classification as Forestry has donesome work on in the past. The Unit is currently experi-menting with IDRISI, however has not found too manyadvantages with it as yet, so if any of you have anythingspecial you�d like to share with us about IDRISI we arekeen to learn.
Staff from DJLS and other government agencies arelooking forward to the SOPAC workshop in Niue aroundthe end of November: no doubt this will make the road alittle clearer.
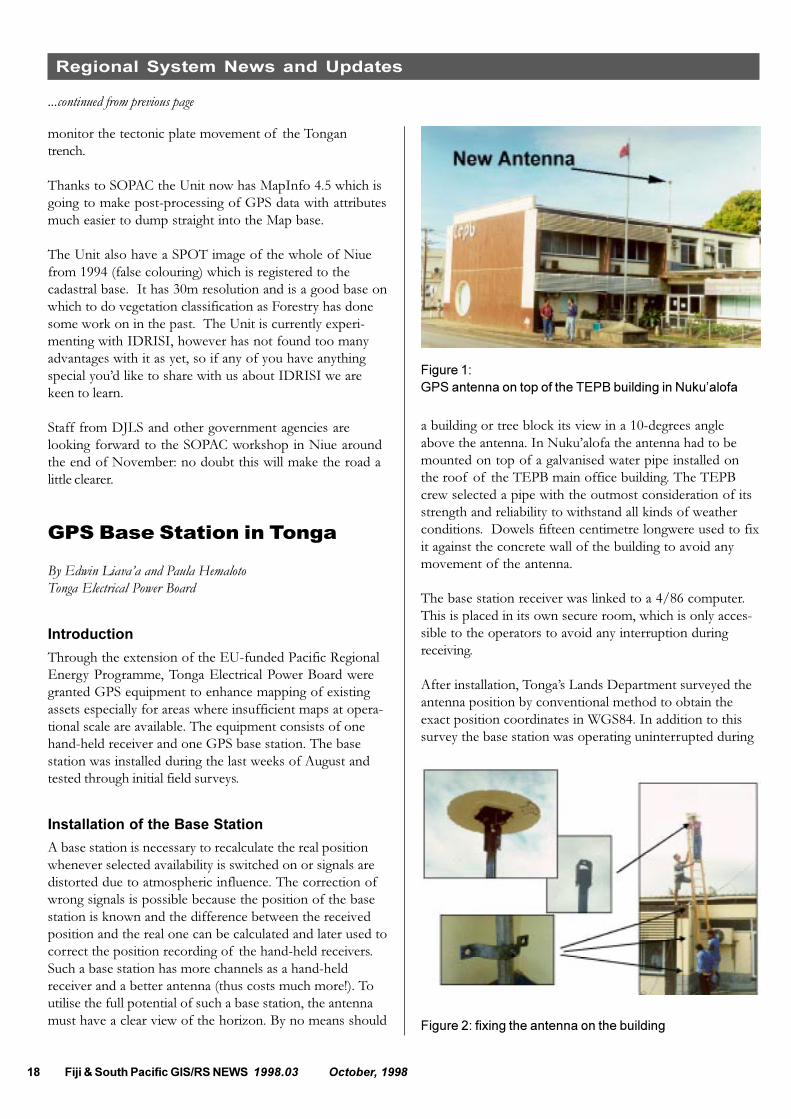
GPS Base Station in Tonga
By Edwin Liava�a and Paula HemalotoTonga Electrical Power Board
Introduction
Through the extension of the EU-funded Pacific RegionalEnergy Programme, Tonga Electrical Power Board weregranted GPS equipment to enhance mapping of existingassets especially for areas where insufficient maps at opera-tional scale are available. The equipment consists of onehand-held receiver and one GPS base station. The basestation was installed during the last weeks of August andtested through initial field surveys.
Installation of the Base Station
A base station is necessary to recalculate the real positionwhenever selected availability is switched on or signals aredistorted due to atmospheric influence. The correction ofwrong signals is possible because the position of the basestation is known and the difference between the receivedposition and the real one can be calculated and later used tocorrect the position recording of the hand-held receivers.Such a base station has more channels as a hand-heldreceiver and a better antenna (thus costs much more!). Toutilise the full potential of such a base station, the antennamust have a clear view of the horizon. By no means should
a building or tree block its view in a 10-degrees angleabove the antenna. In Nuku�alofa the antenna had to bemounted on top of a galvanised water pipe installed onthe roof of the TEPB main office building. The TEPBcrew selected a pipe with the outmost consideration of itsstrength and reliability to withstand all kinds of weatherconditions. Dowels fifteen centimetre longwere used to fixit against the concrete wall of the building to avoid anymovement of the antenna.
The base station receiver was linked to a 4/86 computer.This is placed in its own secure room, which is only acces-sible to the operators to avoid any interruption duringreceiving.
After installation, Tonga�s Lands Department surveyed theantenna position by conventional method to obtain theexact position coordinates in WGS84. In addition to thissurvey the base station was operating uninterrupted during
Figure 1:GPS antenna on top of the TEPB building in Nuku�alofa
Figure 2: fixing the antenna on the building

1998.03 October, 1998 Fiji & South Pacific GIS/RS NEWS 19
the first 12 days. This allowed the averaging of all distor-tions and thus led to an indicated accuracy of about 2meters.
The First Surveys
The TEPB team carried out the first surveys with the hand-held unit along the main road (Taufa�ahau Rd). The soft-ware (pathfinder office) corrected the surveyed position ofpower poles by using the base station data recorded at thesame time from the same satellites. Surprisingly all powerpoles were misplaced with the same shift when displayedthem over the cadastral map, aerial photographs rectified tothe cadastral map or existing digitised poles layers. Later, itwas noticed that even the position of the base station wasdifferent compared to the cadastral map.
Investigation of Error
TEPB informed the Ministry of Lands and Survey andfortunately the source of error could be identified. Thecadastral map is not based on the spheroid indicated. Alltrigonometric points showed the same shift as the surveyedpower poles when imported to the MapInfo display of thecadastral map. The cadastral map showed the coordinatesbased on Hayford 1909 spheroid and not WGS84 asindicated in the map legend.
Another difference was noticed between the surveyedposition of the antenna and the calculated average positionafter 12 days or 1,235,557 positions received by 3 Septem-ber 1998.
The northing or X coordinate cannot be 7 meters out,because the system averages to an accuracy of about 2metres. This error is still under investigation.
Conclusion and Recommendation
TEPB and Lands Department discussed the issue andagreed to base the maps of TEPB on UTM Zone1,WGS84. When the error is identified and all parametersare available to include UTM international spheroid 1924(which is based on Hayford 1909 with a local datum), allmaps can be printed out on the local grid as well. For thetime being, all work will be carried out in relation toWGS84 and using the antenna position coordinates aver-aged from the base station readings.
This situation is normal in South Pacific Island Countries.Most islands were first surveyed during times where theirown positioning capabilities were very weak. It is impor-tant to have a GPS base station and people with geodeticbackground who are able to spot errors, as was the case inTonga.
Figure 3: After importing the GPS surveyed power poles into the cadastral map an off set was visible.
Table 1: Positional values from base station
X-Direction Y-Direction Z-
average position 01.09.98 7,661,500.54 686,598.79 68average position 02.09.98 7,661,500.21 686,598.76 68
average position 03.09.98 7,661,500.25 686,598.76 68
surveyed position 7,661,507.63 686,598.54 65

20 Fiji & South Pacific GIS/RS NEWS 1998.03 October, 1998
Techniques
Image Rectification Using GPS Surveyed GCPs
By Vilisi KalouFEA, Suva,
Introduction
The use of raster images, either from aerial photographsor satellites, as a backdrop for maps is becoming morepopular. Compared to line maps, such as cadastral mapsor road network maps, image backdrops show largeamounts of locational data. This sort of data is veryvaluable in helping utilities to manage their assets. Forexample, planning the location of power lines and trans-formers is easier and more effective when the full range ofpossible surface objects are visible on the map. Many ofthese sorts of features, such as vegetation cover, smallbuildings, garden plots, and drainage ditches do not showup on official maps.
Currently, for local utility mapping, scanned aerial photo-graphs are the only type of image data allowing a displayof 1:5000, or larger, due to the high spatial resolution of
the photographs. However, such scanned aerial photo-graphs have to be rectified and the rectification processrequires Ground Control Points (GCPs). Cadastral mapsnormally provide the information for the identification ofX and Y coordinates of Such GCPs. However, there is aproblem if image backdrop is used to replace cadastralmaps. The following article describes how FEA used GPSsurvey in replacement of cadastral information.
GCP Requirement
Due to its central projection the scale of an aerial photo-graph depends on the location within the image. It provedto be impossible to rectify an aerial photograph in one onlyrectification process using a second degree polynomialrectification method implemented in most image analysissoftware packages. The scanned aerial photographs mustbe cut into several sub-images for which the rectificationhas to be performed independently before these sub-images can be stitched together again. Such a process
Figure 1:aerial photographs have to be cut into several sub-images. Then every sub-image has to be corrected using 6 to 12 GCPs.
1998.03 October, 1998 Fiji & South Pacific GIS/RS NEWS 21
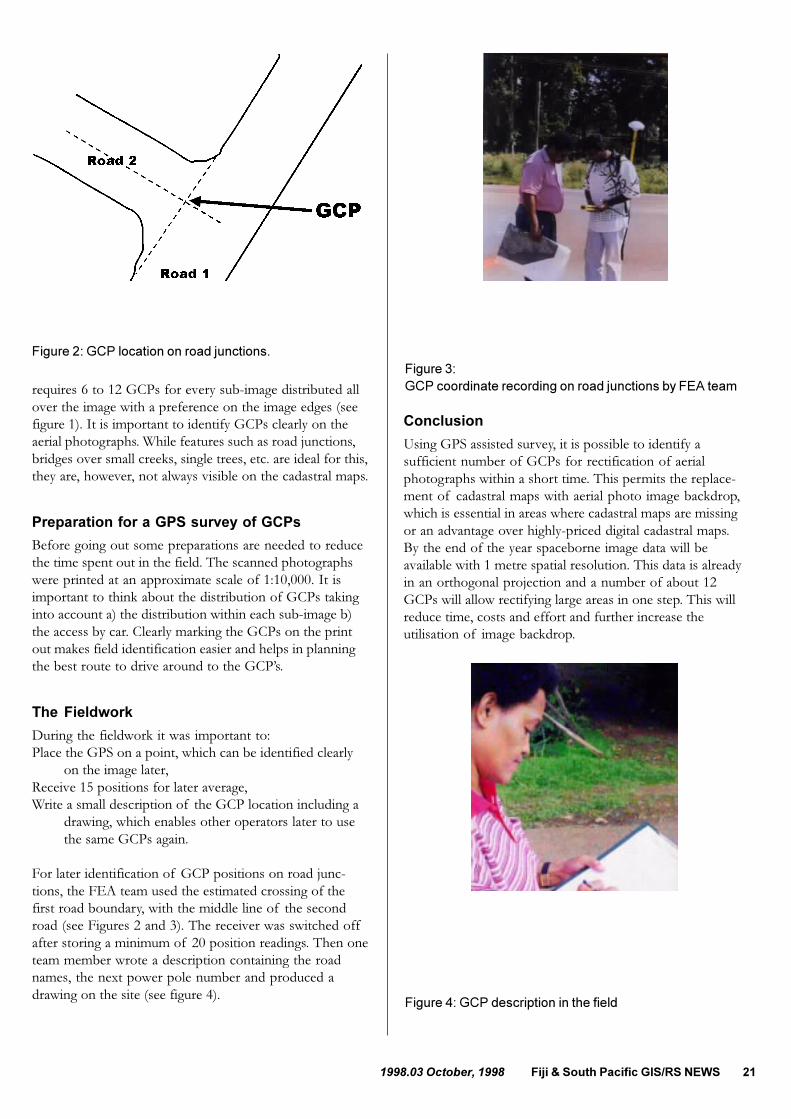
requires 6 to 12 GCPs for every sub-image distributed allover the image with a preference on the image edges (seefigure 1). It is important to identify GCPs clearly on theaerial photographs. While features such as road junctions,bridges over small creeks, single trees, etc. are ideal for this,they are, however, not always visible on the cadastral maps.
Preparation for a GPS survey of GCPs
Before going out some preparations are needed to reducethe time spent out in the field. The scanned photographswere printed at an approximate scale of 1:10,000. It isimportant to think about the distribution of GCPs takinginto account a) the distribution within each sub-image b)the access by car. Clearly marking the GCPs on the printout makes field identification easier and helps in planningthe best route to drive around to the GCP�s.
The Fieldwork
During the fieldwork it was important to:Place the GPS on a point, which can be identified clearly
on the image later,Receive 15 positions for later average,Write a small description of the GCP location including a
drawing, which enables other operators later to usethe same GCPs again.
For later identification of GCP positions on road junc-tions, the FEA team used the estimated crossing of thefirst road boundary, with the middle line of the secondroad (see Figures 2 and 3). The receiver was switched offafter storing a minimum of 20 position readings. Then oneteam member wrote a description containing the roadnames, the next power pole number and produced adrawing on the site (see figure 4).
Conclusion
Using GPS assisted survey, it is possible to identify asufficient number of GCPs for rectification of aerialphotographs within a short time. This permits the replace-ment of cadastral maps with aerial photo image backdrop,which is essential in areas where cadastral maps are missingor an advantage over highly-priced digital cadastral maps.By the end of the year spaceborne image data will beavailable with 1 metre spatial resolution. This data is alreadyin an orthogonal projection and a number of about 12GCPs will allow rectifying large areas in one step. This willreduce time, costs and effort and further increase theutilisation of image backdrop.
Figure 2: GCP location on road junctions.Figure 3:GCP coordinate recording on road junctions by FEA team
Figure 4: GCP description in the field

22 Fiji & South Pacific GIS/RS NEWS 1998.03 October, 1998
Techniques
METADATA construction: MRD case study
By Prakash NarayanMineral Resources Department (MRD)
Introduction
Metadata is �data about data� or more specifically, it isdescriptive information about data and its availability. Thisbroadly defined category of information encompasses awide range of database characteristics, from descriptivesummaries to detailed discussion of attribute codingschemes. Metadata often includes data processing histories,file format specification, as well as instructions for obtain-ing data. The whole purpose of metadata is to facilitateaccess and to guarantee appropriate application of data.
Objective
Large quantities of digital data information are generatedfrom various sources and by various organizations for theland and ocean areas of a particular region or country.Knowing the currently available land and ocean coverage isvery important for it helps to reduce or even eliminateduplicate coverage of a same region or zone. To assist inalleviating these difficulties, Mineral Resources Department(MRD) had embarked on a program to develop formalguidelines and supporting tools for preparing theirmetadata. Metadata can be difficult and time-consuming todevelop, and once complete, may be difficult for otherusers to interpret.
Digital Spatial Data
Simple file directories give incomplete information aboutany kind of digital data. They give a list of file names andsystem specifications. Often, a separate file can be createdin a directory or folder that gives a more detailed descrip-tion of each file, often in more understandable terms. Acommon example of this would be a �readme.txt� filethat accompanies original software or decompressed datafiles. By reading this file, the user will better understandwhat each file contains or does. But in the case of spatialdata, the issue is more complex. We think of a certain areaof coverage, Kadavu Island, for example, as one concep-tual entity��Kadavu Island�. However, in a GIS system,the files that hold data related to Kadavu can, and usuallydo, occur in many files since each type of spatial object (orlayer, if you like) will generally be stored in one file. Inmany cases, even single spatial data layers can be stored inseveral files. So, answering the question, �Which files storedata about Kadavu?�, means examining the descriptions ofmany files, not just searching for one file out of a list.
To access this complex and high volume data, it is clearthat a computer database, with its ability to sort, organise,and query the entire data collection and produce formattedand summary results, is required for effective managementof the spatial data holdings of any organisation or group.This article outlines the approach currently taken at MRDto produce a spatial meta-database.
Case Study: MRD�s Metadata
The aim here is to identify attributes that could significantlydescribe the digital or even hard-copy spatial informationheld within MRD premises. The attributes chosen toDecember 1997 for MRD�s metadata are listed below.
Identification
SearchWord: Words likely to be used when searching by aparticular theme.
Title: This is the name given to the dataset by the custodialorganisation.
Custodian: The organisation responsible for ensuring theaccuracy, currency, storage, security and distributionof the dataset.
Jurisdiction: The place where the custodian of the datasetis kept
Address: MailAddress1, City, Country, PostcodeContact Information: Telephone, Facsimile,
ElectronicMailAddressContactOrganisation: The name of the organisation to
contact in order to obtain the dataset itself, or formore detailed information about the dataset.
ContactPosition: The position title given by the contactorganisation to the holder of the position who isrequired to answer questions about the dataset.
Data Quality
PositionalAccuracy: Is an assessment of the closeness ofthe location of spatial objects in the dataset in relationto their true positions on the earth�s surface.
AttributeAccuracy: An assessment of the reliability ofvalues assigned to features in the dataset in relation totheir �real world� values.
LogicalConsistency: An assessment of how well thelogical relationships between items in the dataset, orspatial objects in the dataset, are maintained.
Completeness: An assessment of the extent and range ofthe dataset with regard to completeness of coverage,

1998.03 October, 1998 Fiji & South Pacific GIS/RS NEWS 23
completeness of classification and completeness ofverification.
Lineage: Is a history of both the source data and theprocessing steps used to produce the dataset.
Access
StoredDataFormat: Description of the format in whichthe dataset is stored by the custodian.
AvailableFormatType: Description of the format inwhich the dataset is available, such as digital or non-digital.
AccessConstraint: Show any restrictions or legal prereq-uisites that may apply to use of the dataset such aslicence or royalty agreement.
ServerFolder: Name under which this information isknown, e.g. the file name.
ServerFileName: The path name leading to the directorywhere this information is located on the server.
BeginningDate: Date at which the phenomena in thedataset actually occurred.
EndingDate: If the dataset is ongoing, use the word�Current� to indicate that no final date is applicable.
MetaDatadate: The date on which custodian authorisedchanges or on which metadata custodian editorial(ifany), were added to the metadata directory item.
AdditionalMetadata: An indication of where additionalmetadata about the dataset may be accessible
Dataset Status
Progress: The status of the process of creation of thedataset. Option �completed� for dataset collectionconcluded, �in progress� if collection underway and�planned� is collection proposed.
MaintenanceUpdateFrequency: The frequency ofchanges or additions that are made to the datasetafter its initial completion.
Descripton
GeographicExtentname: Known geographic objects thatwould reasonably show the extent of geographiccoverage of the dataset.
GeographicExtentPologon: Use a set of at least fourco-ordinates (a closed polygon) to record the latitudeand longitude in decimal degrees of geographicextent of the dataset.
Abstract: A characterisation of the dataset and its con-tents�a brief narrative, a summary, or an abstract.
Tool or Method
Elementary relational database incorporated into a querylanguage such as Sequentially Query Language(SQL) is
powerful enough to answer a great number of queries,even complex ones. An example of such a query is: displaythe list of files containing information at MRD for hydro-geology or seismology.
Microsoft Access, a widely used database package runningunder Window 95 can be used for such a database.Wizards included within the version of Access can belargely exploited.
A very elementary database application software wasdeveloped using the current version (�97) of MicrosoftAccess and this software is currently available to MRDstaff through the existing MRD computer networksystem.
Advanced Metadata Systems
New technologies in GIS and network communicationprovide many opportunities for the development andapplication of metadata resources. One can easily imaginebeing able to browse an organisation�s on-line data cata-logue, or to use an interactive map display on the Internetto determine data availability for a particular area, or toidentify variations in data quality over a database. Theestablishment and adoption of a national metadata stand-ard will help facilitate the development of standardsystems for data exchange.
Conclusion
We at MRD believe that if an easy-to-use standard isdeveloped with supporting tools, users will be more likelyto document their dataset effectively. Data exchangeamong users would be also greatly facilitated by theinclusion of standard metadata reports with data deliveries.
Further Reading:
ANZLIC GUIDELINES: CORE METADATA ELE-MENTS version 1, Metadata for high level land andgeographic data directories in Australia and New Zealand.Prepared for the Australia and New Zealand Land Infor-mation Council by the ANZLIC Working Group onMetadata, July 1996.
Prakash Narayan, April 1998, The Need for Homog-enized and Structured Databases Containing Infor-mation on the Availability, Structure and Characteris-tics of Existing Spatial Data. Fiji GIS/RS User GroupForum newsletter, issue 1998.01 April, pages 12-13.

24 Fiji & South Pacific GIS/RS NEWS 1998.03 October, 1998
Opportunities in GIS
Eco-Consult Pacific Seeks GIS Specialists forFuture Consulting Opportunities
Eco-Consult Pacific is an independent consulting companybased in Suva, Fiji, which aims to provide support tonational and regional authorities and organisations in thedesign, implementation and evaluation of programmestowards integrated sustainable development of naturalresources in its broadest scope. The areas of expertiseinclude primary industries, environmental issues, postharvest technology, marketing and trade, rural develop-ment, institutional management and development andeconomics.
Eco-Consult Pacific is aware that specialist human resourcedevelopment has increased significantly in the last decades,and recognises that this forms the mainstay to sustainableresource management in Pacific Island Countries. Tofacilitate the identification of suitable candidates for con-sulting opportunities, we have established a unique databasewith more than 170 specialists who have extensive exper-tise in the Pacific Islands. A considerable number haveworked for international institutions such as the AsianDevelopment Bank, the World Bank, the European Union,UNDP etc. In addition, we have developed a network ofindividual consulting companies we can combine resourceswith. We believe that the countries and peoples of thePacific are unique to the world, as are many of theirproblems - which provides Eco-Consult Pacific with a distinctadvantage to find the appropriate solutions for specificproblems.
To improve on the distribution of employment opportu-nities for Pacific Island specialists, Eco-Consult Pacific estab-lished �Pacific Vacancies� in March 1998, a unique freeelectronic mail service providing information on forth-coming national and regional vacancies in the areas of ourexpertise. This service, which is aimed at reaching special-ists at remote locations, currently distributes vacanciesfortnightly.
We invite specialists in GIS and other relevant areas toregister with us by submitting your CV and a short sum-mary of expertise. If you include an email address, we willadd you to our �Pacific Vacancies� mailing list. Naturally,registration is free.
For more information please contact:Wilco Liebregts, Managing Director, Eco-Consult Pacific,P.O. Box 5406, Raiwaqa Post Office, Suva, Fiji. Tel./Fax:(679)-302 607; email <[email protected]>.
Techniques
SatelliteUpdate
By Wolf FosrtreuterSOPAC
Since printing the lastnewsletter, there is notmuch update necessary. There is no additional news aboutLandsat including IKONOS. The newly launched SPOT4 recorded the images successfully including the new short-wave infrared band. One proposed satellite was notmentioned in the last newsletter, OrbView-3.
The OrbView-3 satellite will be ORBIMAGE�s first high-resolution satellite and will provide low cost, real-timeimagery. The satellite will orbit at 470km above the earthand its sensor will produce 1m panchromatic and 4mmultispectral images with a standard size of 8 km An on-board tape device will be able to store 4 Gbytes of imagedata, so recording of areas in the South Pacific is possible.The blue portion of the spectrum is covered. The com-pany ORBIMAGE is already experienced in operatingsatellites and it is likely that the company will stick toscheduled launch date, the fall of 1999.
Resolution:blue 0.450 to 0.520µm 4mgreen 0.520 to 0.600µm 4mred 0.625 to 0.695µm 4mnear-infrared 0.760 to 0.900µm 4mpanchromatic 0.450 to 0.900µm 1m
SOPAC is in the process ofordering panchromaticIRS-1C image data forNiue. During this purchase,SOPAC was advised bySpace Imagine EOSATthat this company nolonger handles image datastored on the on-board tape devices. Since August 1998,the company is only distributing data received directly byground antennas outside India. Because nearly all SouthPacific Islands Countries are outside the range of groundantennas, SOPAC is dealing directly with the NationalRemote Sensing Agency (NRSA) in India. Another change:in the past, EOSAT did not charge a fee for special acqui-sition. As long as the customer purchased image dataordered to be recorded on tape, this service was free.Now, SOPAC pays 1500 US$ for the digital image and thesame amount for the special acquisition. However, sincethis gives us a 35 x 35 km coverage of 5m resolution data,this is still less expensive than any photo flight.