Embed Size (px)
Citation preview

GIS: An Introduction
ESP 179April 18, 2007April 25, 2007
Presentation courtesy of Karen Beardsley, Information Center for the Environment

What is GIS?
• Geographic Information SystemGeographic Information System• DefinitionsDefinitions• CapabilitiesCapabilities• Pitfalls...Pitfalls...

Definition of GIS (1)
Geographic Information System:Geographic Information System:
““An organized collection of computer An organized collection of computer hardware, software, geographic data, and hardware, software, geographic data, and personnel designed to efficiently capture, personnel designed to efficiently capture, store, update, manipulate, analyze and display store, update, manipulate, analyze and display all forms of geographically referenced all forms of geographically referenced information.”information.”
from from Understanding GIS--The ARC/INFO MethodUnderstanding GIS--The ARC/INFO Method, , ESRI, 1993ESRI, 1993

Definition of GIS (2)
Geographic Information System:Geographic Information System:
““A set of tools for collecting, storing, A set of tools for collecting, storing, retrieving at will, transforming, and retrieving at will, transforming, and displaying spatial data from the real world displaying spatial data from the real world for a particular set of purposes.”for a particular set of purposes.”
from from Principles of Geographical Information Systems Principles of Geographical Information Systems for Land Resources Assessment, for Land Resources Assessment, P.A. Burrough, P.A. Burrough, 1986.1986.

GIS Components
Hardware
Software
Data
Staffing
GIS

When to use GIS
• To store and update large amounts or To store and update large amounts or complicated spatial datacomplicated spatial data
• For mapping For mapping (especially in conjunction with (especially in conjunction with computerized techniques, e.g remote sensing, GPS)computerized techniques, e.g remote sensing, GPS)
• To query or summarize spatial data already To query or summarize spatial data already in a GIS databasein a GIS database
Spatial Data Storage and ManagementSpatial Data Storage and Management

When to Use GIS
• To make numerous distance and/or area To make numerous distance and/or area calculationscalculations
• To compare several kinds of spatial data To compare several kinds of spatial data from one place or one timefrom one place or one time
• To make selections based on complicated To make selections based on complicated spatial criteriaspatial criteria
Spatial AnalysisSpatial Analysis

When to Use GIS
• To represent spatial patterns and To represent spatial patterns and relationships in dynamic modelsrelationships in dynamic models
• To interpolate information through spaceTo interpolate information through space• To apply understanding in a real, To apply understanding in a real,
complicated, spatially complete worldcomplicated, spatially complete world
Spatial ModelingSpatial Modeling

When Not to Use GIS
• To make a map, if a map is all you wantTo make a map, if a map is all you want• If the data does not exist or is of poor qualityIf the data does not exist or is of poor quality• If you can answer your question in another If you can answer your question in another
wayway• If you need a very quick answerIf you need a very quick answer• If space doesn’t matterIf space doesn’t matter

GIS is a tool
• GIS is a set of computerized tools for GIS is a set of computerized tools for operations on spatial dataoperations on spatial data
• GIS is all about spaceGIS is all about space• GIS is a hammer; it requires a carpenterGIS is a hammer; it requires a carpenter
People
GISGISSpatial Data Information

Geographic Information System
OutputOutputDevicesDevices
InputInputDevicesDevices
ComputerComputerHardwareHardware
GIS SoftwareGIS Software
DataData
InformationInformation

The GIS Process
• 1. Project formulation, 1. Project formulation, i.e. what’s the question?i.e. what’s the question?
• 2. Data acquisition, 2. Data acquisition, i.e. getting the datai.e. getting the data
• 3. Pre-processing, 3. Pre-processing, i.e. getting the data to work i.e. getting the data to work togethertogether
• 4. Data management, 4. Data management, i.e. keeping yourself and your i.e. keeping yourself and your data organizeddata organized
• 5. Manipulation and analysis, 5. Manipulation and analysis, i.e. the fun stuffi.e. the fun stuff
• 6. Product generation, 6. Product generation, i.e. beyond pretty pictures to i.e. beyond pretty pictures to answersanswers
>80% of time and effort!!>80% of time and effort!!

GIS Themes, or LayersGIS Themes, or LayersVegetation
Land Ownership
Roads
Rivers
GIS Data Layers
Special Status Species Locations
AllAll Layers Layers
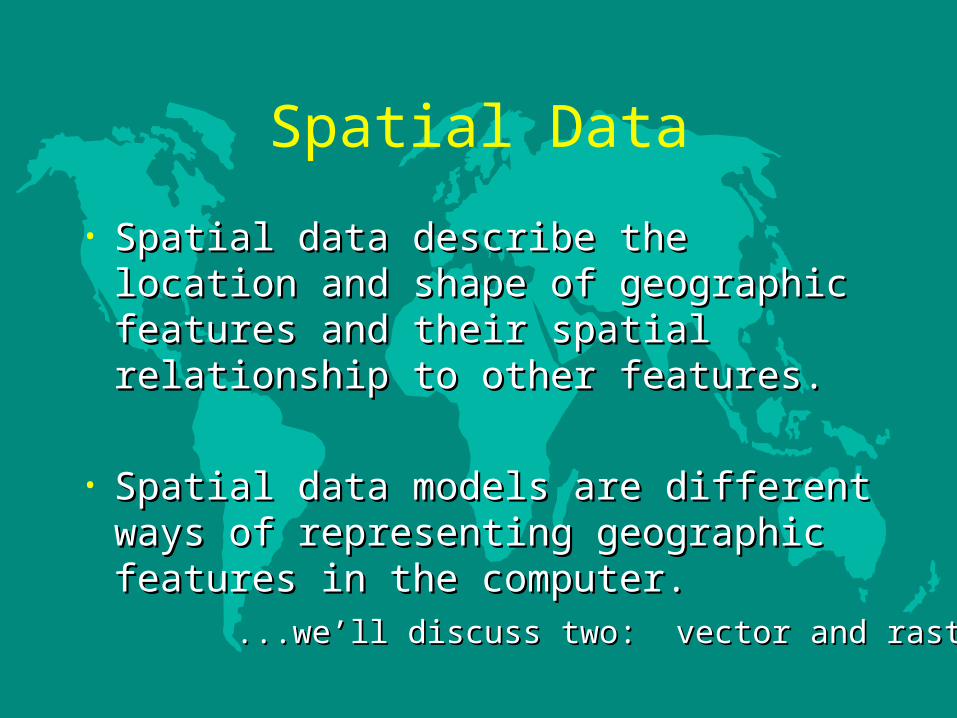
Spatial Data
• Spatial data describe the location and shape Spatial data describe the location and shape of geographic features and their spatial of geographic features and their spatial relationship to other features.relationship to other features.
• Spatial data models are different ways of Spatial data models are different ways of representing geographic features in the representing geographic features in the computer.computer.
...we’ll discuss two: vector and raster...we’ll discuss two: vector and raster

Vector Data Model
• Basic Element: the point (x,y)Basic Element: the point (x,y)• Points connect to make lines.Points connect to make lines.• Lines connect to make polygons.Lines connect to make polygons.• Polygons are grouped to make regions.Polygons are grouped to make regions.
PointPointLineLine PolygonsPolygons
(x,y)(x,y)
(x(x11,y,y11))
(x(x22,y,y22)) (x(x11,y,y11))(x(x22,y,y22))
(x(x33,y,y33))

Vector Data Model
• Best for representing discrete objects, e.g.Best for representing discrete objects, e.g.• observation locationsobservation locations• roadsroads• legal boundarieslegal boundaries
• Most paper maps use the vector data modelMost paper maps use the vector data model

Vector Data Model
• What the computer does:What the computer does:• RemembersRemembers
• (x,y) locations(x,y) locations• which points make which lineswhich points make which lines• which lines make which polygonswhich lines make which polygons• which polygons make which regionswhich polygons make which regions
• Uses Euclidean Geometry Uses Euclidean Geometry to calculate distances, to calculate distances, find areas, compute intersections, etc.find areas, compute intersections, etc.

Raster Data Model
• Basic element: the grid cellBasic element: the grid cell• Geographic features are represented on a Geographic features are represented on a
grid of square cells, all the same size.grid of square cells, all the same size.• What the computer does:What the computer does:
• remembers line, column, valueremembers line, column, value• numeric attribute valuesnumeric attribute values• can calculate all x,y coordinatescan calculate all x,y coordinates
Columns ----->Columns ----->
Lines -------
Lines -------
>>
(x,y)(x,y)Known grid cell size, e.g. 20 mKnown grid cell size, e.g. 20 m

Raster Data Model
• Best for representing gradients.Best for representing gradients.• Data often derived from remote sensing Data often derived from remote sensing
imagery, which are collected in grids.imagery, which are collected in grids.• Important for topographic dataImportant for topographic data
Digital Elevation ModelDigital Elevation Model(DEM)(DEM)

Vector vs. Raster
• Raster: cell-based representation of the real Raster: cell-based representation of the real world, where each cell (pixel) has a value world, where each cell (pixel) has a value for the theme represented.for the theme represented.
• Vector: objects and themes are represented Vector: objects and themes are represented as points, lines, polygons (areas), and as points, lines, polygons (areas), and regions (multiple polygons).regions (multiple polygons).

Vector vs. Raster
• Raster is Raster is computationally efficientcomputationally efficient, , because because computers are good at matricies and because everything computers are good at matricies and because everything lies neatly on top of each other,lies neatly on top of each other,
• butbut Raster Raster generalizesgeneralizes spatial location.spatial location.
• Vector is more Vector is more spatially accuratespatially accurate, , because it because it can place points anywhere,can place points anywhere,
• but but Vector is Vector is slowerslower, because the calculations are , because the calculations are much more intensive.much more intensive.
““Raster is faster, but Vector is correcter”Raster is faster, but Vector is correcter”
In practice, which data model depends on software and data.In practice, which data model depends on software and data.
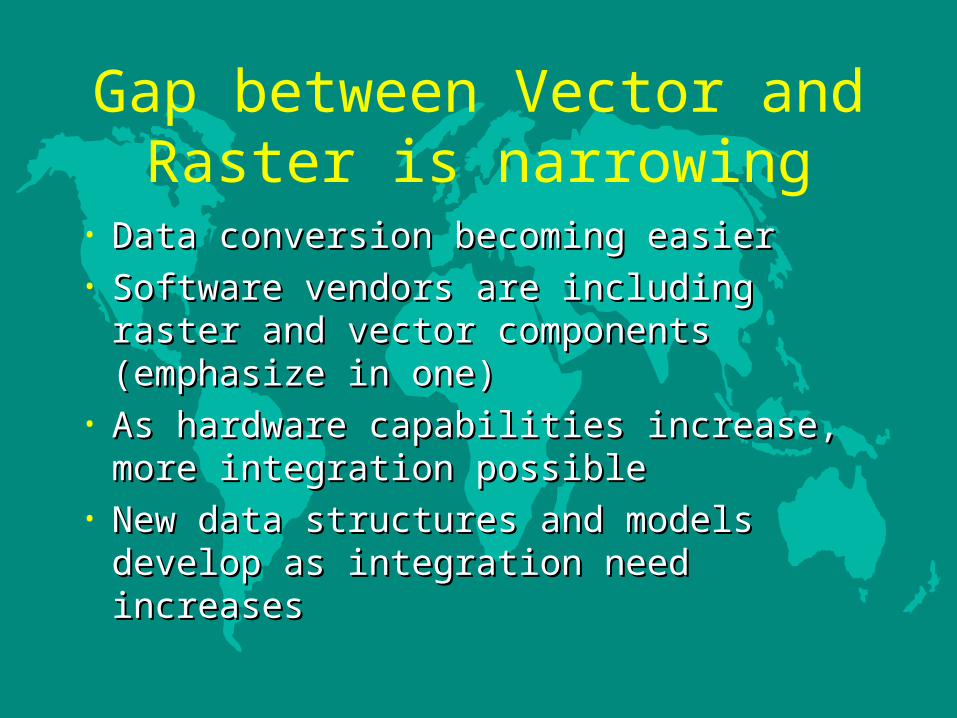
Gap between Vector and Raster is narrowing
• Data conversion becoming easierData conversion becoming easier• Software vendors are including raster and Software vendors are including raster and
vector components (emphasize in one)vector components (emphasize in one)• As hardware capabilities increase, more As hardware capabilities increase, more
integration possibleintegration possible• New data structures and models develop as New data structures and models develop as
integration need increasesintegration need increases

What is a data layer?
• Two componentsTwo components• Spatial data - where something isSpatial data - where something is• Attribute data - describe the somethingAttribute data - describe the something
Special Status Species Observations
IDID DateDate SpeciesSpecies1111 010999010999 TigerTiger1212 030999030999 GuarGuar1414 040999040999 Samba DeerSamba Deer … … …… ......
Spatial andSpatial andattribute dataattribute dataare linkedare linked

Attribute Data
• Tables are defined by Tables are defined by fieldsfields
• Field definitions include the data type (e.g. Field definitions include the data type (e.g. number, string, boolean, date) and the width number, string, boolean, date) and the width of the fieldof the field
IDID DateDate SpeciesSpecies1111 010699010699 TigerTiger1212 030999030999 GuarGuar1414 040999040999 Samba DeerSamba Deer … … …… ......
FieldsFields
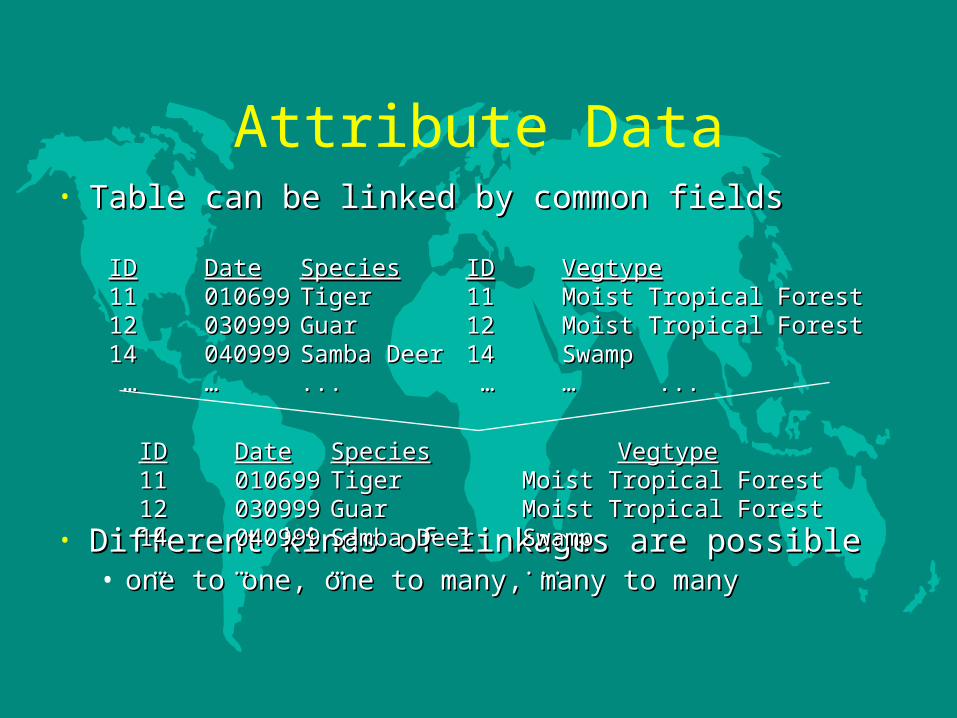
Attribute Data• Table can be linked by common fieldsTable can be linked by common fields
• Different kinds of linkages are possibleDifferent kinds of linkages are possible• one to one, one to many, many to manyone to one, one to many, many to many
IDID VegtypeVegtype1111 Moist Tropical ForestMoist Tropical Forest1212 Moist Tropical ForestMoist Tropical Forest1414 SwampSwamp … … …… ......
IDID DateDate SpeciesSpecies1111 010699010699 TigerTiger1212 030999030999 GuarGuar1414 040999040999 Samba DeerSamba Deer … … …… ......
IDID DateDate SpeciesSpecies VegtypeVegtype1111 010699010699 TigerTiger Moist Tropical ForestMoist Tropical Forest1212 030999030999 GuarGuar Moist Tropical ForestMoist Tropical Forest1414 040999040999 Samba DeerSamba Deer SwampSwamp … … …… …… ......

Attribute Data
• Table OperationsTable Operations– SelectionSelection– SortSort– SummarySummary– CalculateCalculate
IDID DateDate SpeciesSpecies1111 010699010699 TigerTiger1212 030999030999 GuarGuar1414 040999040999 Samba DeerSamba Deer … … …… ......
IDID DateDate SpeciesSpecies1212 030999030999 GuarGuar1414 040999040999 Samba DeerSamba Deer1111 010699010699 TigerTiger … … …… ......
SelectionSelection
SortSort

Cartography
• concerned with the display of spatial dataconcerned with the display of spatial data• currently the main source of input data for GIS is currently the main source of input data for GIS is
mapsmaps• provides long tradition in the design of maps provides long tradition in the design of maps
which is an important form of output from GISwhich is an important form of output from GIS• computer cartography (“digital” cartography) computer cartography (“digital” cartography)
provides methods for digital representation and provides methods for digital representation and manipulation of cartographic features and methods manipulation of cartographic features and methods of visualizationof visualization

The Communication The Communication ChannelChannelREALITYREALITYDATA DATA COLLECTIOCOLLECTIONN
CARTOGRAPHECARTOGRAPHERR
Map
Map
MAP MAP USER’S USER’S
IMAGE OF IMAGE OF REALITYREALITY
??
DATA PRESENTATIONDATA PRESENTATIONSELECTSELECT
SIMPLIFYSIMPLIFYCLASSIFYCLASSIFY
SYMBOLIZESYMBOLIZE
MAP CREATIONMAP CREATIONMAP ELEMENTSMAP ELEMENTSHARDCOPYHARDCOPYPROJECTPROJECT
READREADANALYZEANALYZE
INTERPREINTERPRETT
Cartography slides courtesy of Jonathan Corbridge, ESRICartography slides courtesy of Jonathan Corbridge, ESRI

Practical Applications
• Street network-basedStreet network-based• Natural resource-basedNatural resource-based• Land parcel-basedLand parcel-based• Facilities managementFacilities management

Spatial Operations
• GIS permits GIS permits spatialspatial operations on the data operations on the data• Questions a GIS can answer:Questions a GIS can answer:
• 1. What is at...? (location)1. What is at...? (location)• 2. Where is it? (condition)2. Where is it? (condition)• 3. What has changed since...? (trends)3. What has changed since...? (trends)• 4. What spatial patterns exist? (patterns)4. What spatial patterns exist? (patterns)• 5. What if...? (modeling)5. What if...? (modeling)

forest
grass1 2
1
2
Spatial Analysis--Overlay
=
+
1A 2A
1B 2B
1A2A
2B
1Bprivate land
private land
public land
public land forest
forest
grass
grass
private land
public land
A
B
A
B

Applications
Administrative
Land OwnershipGovernment Jurisdiction
Rights-of-WayMining Claims
Existing Land Use
Infrastructure
Transportation NetworkUtility Corridors
Zoning Restrictions
Possible layers needed when deciding on the location of an airport:
Biotic
Endangered SpeciesVegetation Cover
AbioticSurface GeologySubsurface GeologySurface WaterSubsurface Water
Flood PlainsArchaeological SitesElevation
ClimaticTemperaturePrecipitation
Fog and Wind

• State of California (CaSIL)State of California (CaSIL)• http://http://gis.ca.govgis.ca.gov
• World Wide Web World Wide Web • Data ClearinghousesData Clearinghouses• Public agenciesPublic agencies• CERES (http://ceres.ca.gov)CERES (http://ceres.ca.gov)• Networking!Networking!
Sources of Data

At what scale to use GIS?
• Any scale -- scale is dependent on the data.Any scale -- scale is dependent on the data.• GIS is scale independent.GIS is scale independent.• Questions and answers are scale dependent.Questions and answers are scale dependent.• Applications range from the back of a leaf Applications range from the back of a leaf
to entire planets.to entire planets.

Scale
• ratio between distances on the map and ratio between distances on the map and corresponding distances in the real worldcorresponding distances in the real world
• (i.e. scale of 1:100,000 means 1cm on map represents (i.e. scale of 1:100,000 means 1cm on map represents 100,000 cm, or 1 km on the Earth’s surface)100,000 cm, or 1 km on the Earth’s surface)
• Small scale vs. Large scaleSmall scale vs. Large scale• large scale shows greater detaillarge scale shows greater detail• small scale has larger number in representative fractionsmall scale has larger number in representative fraction
• Scale controls how features are shown and Scale controls how features are shown and what features are shownwhat features are shown
• (i.e. large scale, cities are polys; small scale, they are points)(i.e. large scale, cities are polys; small scale, they are points)

Why Scale is Important
• The question determines what scale of data The question determines what scale of data you need.you need.
• The scale of the data determines the amount The scale of the data determines the amount of informationof information• Too much information = difficult to manage, Too much information = difficult to manage,
slow processing time, confusing detailslow processing time, confusing detail• Too little information = unable to answer Too little information = unable to answer
question, missing important detailquestion, missing important detail
Map Projections and Coordinate Systems
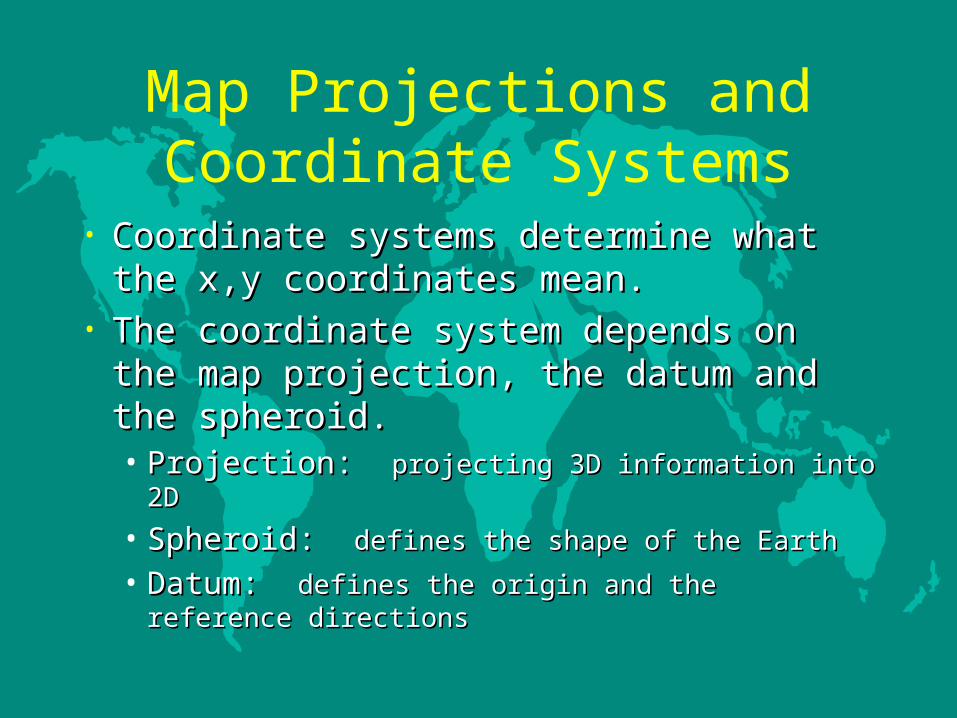
• Coordinate systems determine what the x,y Coordinate systems determine what the x,y coordinates mean.coordinates mean.
• The coordinate system depends on the map The coordinate system depends on the map projection, the datum and the spheroid.projection, the datum and the spheroid.• Projection: Projection: projecting 3D information into 2Dprojecting 3D information into 2D
• Spheroid: Spheroid: defines the shape of the Earthdefines the shape of the Earth
• Datum: Datum: defines the origin and the reference directionsdefines the origin and the reference directions

Multiple Data Layers
• For data layers to be used together, For data layers to be used together, they must be:they must be:• in the same coordinate systemin the same coordinate system
• at comparable scale (similar grain and at comparable scale (similar grain and extent)extent)
• and for some analysis, in the same data and for some analysis, in the same data model (vector or raster)model (vector or raster)

Compatibility Issues
• In GIS, must use data of scale that is In GIS, must use data of scale that is appropriate for the applicationappropriate for the application
• for city planning, you would NOT use 1:1million scale datafor city planning, you would NOT use 1:1million scale data• for global modeling, you would NOT use 1:2,000 scale datafor global modeling, you would NOT use 1:2,000 scale data
• Data of same or similar scale should be Data of same or similar scale should be used for an applicationused for an application
• Do not combine data layers of widely diverse scalesDo not combine data layers of widely diverse scales• If different scale data are combined, analysis and conclusions If different scale data are combined, analysis and conclusions
may be flawedmay be flawed

Data Quality
• Important to keep track of quality of dataImportant to keep track of quality of data• ““Meta data” (data about data) used to store Meta data” (data about data) used to store
information about origin and accuracy of information about origin and accuracy of datadata
• Sometimes only data of questionable Sometimes only data of questionable quality is availablequality is available

Metadata and Data Dictionaries
• Standards for Digital Geospatial MetadataStandards for Digital Geospatial Metadata• Federal Geographic Data CommitteeFederal Geographic Data Committee• 53 pages of standards about metadata53 pages of standards about metadata
• Data DictionaryData Dictionary• description of each field of attributesdescription of each field of attributes• meaning of codes and abbreviationsmeaning of codes and abbreviations• data field definitionsdata field definitions

What Good Are Metadata?• Organize and maintain an organization's Organize and maintain an organization's
internal investment in geospatial data.internal investment in geospatial data.• (Do you know what you've got?)(Do you know what you've got?)
• Provide information about an organization's Provide information about an organization's data to catalogues and clearinghouses.data to catalogues and clearinghouses.• (Can you describe to someone else what you've (Can you describe to someone else what you've
got?)got?)• Provide information during a data transfer.Provide information during a data transfer.
• (Can they figure out what you've done?)(Can they figure out what you've done?)

Examples of MetadataIdentificationIdentification
Title? Area covered? Themes? Currentness? Restrictions?Title? Area covered? Themes? Currentness? Restrictions?
Data QualityData QualityAccuracy? Completeness? Logical Consistency? Lineage?Accuracy? Completeness? Logical Consistency? Lineage?
Spatial Data OrganizationSpatial Data OrganizationIndirect? Vector? Raster? Type of elements? Number?Indirect? Vector? Raster? Type of elements? Number?
Spatial ReferenceSpatial ReferenceProjection? Grid system? Datum? Coordinate system?Projection? Grid system? Datum? Coordinate system?
Entity and Attribute InformationEntity and Attribute InformationFeatures? Attributes? Attribute values?Features? Attributes? Attribute values?
DistributionDistributionDistributor? Formats? Media? Online? Price?Distributor? Formats? Media? Online? Price?
Metadata ReferenceMetadata ReferenceMetadata currentness? Responsible party?Metadata currentness? Responsible party?

More aboutData Sources
• Global Positioning Systems (GPS)Global Positioning Systems (GPS)• Remote Sensing and Aerial PhotographyRemote Sensing and Aerial Photography• Maps (on paper)Maps (on paper)• Graphic file ImagesGraphic file Images• Sharing Existing DataSharing Existing Data
Global Positioning Systems
• System of satellites and handheld receivers System of satellites and handheld receivers for accurately determining geographic for accurately determining geographic locationlocation
• Developed and controlled by US militaryDeveloped and controlled by US military• Source of data for GIS analysisSource of data for GIS analysis

Remote Sensing Data
• Remote Sensing = information acquired Remote Sensing = information acquired (“sensed”) without direct contact (“sensed”) without direct contact (“remotely”)(“remotely”)
• of course, something has contact, usually of course, something has contact, usually some kind of electromagnetic radiationsome kind of electromagnetic radiation• Optical sensorsOptical sensors• Thermal sensorsThermal sensors• Radar sensorsRadar sensors
Each sensor is optimizedEach sensor is optimizedfor collecting in differentfor collecting in differentwavelengths of light.wavelengths of light.
Aerial Photography
• Photographic imageryPhotographic imagery• From airplane (not space)From airplane (not space)• Subject to atmospheric conditionsSubject to atmospheric conditions• Must be corrected for movement of airplane Must be corrected for movement of airplane • Varies in scale based on photographic qualities Varies in scale based on photographic qualities
and altitude of aircraftand altitude of aircraft• Single band, modified by filters.Single band, modified by filters.• Good source of data for change detectionGood source of data for change detection

Digitizing vs. Scanning
• DigitizingDigitizing• requires digitizing tablet and patiencerequires digitizing tablet and patience
• ScanningScanning• best for simple databest for simple data• requires scanner of sufficient resolutionrequires scanner of sufficient resolution• requires vectorizing software and patiencerequires vectorizing software and patience
• Both Both veryvery time consuming and dull time consuming and dull

Integrating GIS Data…you need to know about:
• Scale and Resolution• Map projection, datum, coordinate system• Accuracy and precision• Classification system• Date of data• Error estimates• Data Dictionary• Contact person

Current Directions
• Integration of Integration of technologiestechnologies
• Easier user interfacesEasier user interfaces• More internet access More internet access
to datato data• Less familiarity with Less familiarity with
GIS concepts neededGIS concepts needed
• Consequences:Consequences:• GIS like Word GIS like Word
Processor--on every Processor--on every desktopdesktop
• Tool is in hands of Tool is in hands of inexperienced usersinexperienced users
• Potential for Potential for inappropriate uses, inappropriate uses, poor decisionspoor decisions

Academic Classes at UC Davis
ABT180: Introduction to Geographic Information Systems ABT180: Introduction to Geographic Information Systems ABT182: Environmental Analysis Using GIS ABT182: Environmental Analysis Using GIS ABT185: Concepts and Methods in GIS ABT185: Concepts and Methods in GIS LDA150: GIS for Land PlannersLDA150: GIS for Land Planners SAS18: GIS and SocietySAS18: GIS and Society
ABT=Applied Biological Systems TechnologyABT=Applied Biological Systems Technology
LDA=Landscape ArchitectureLDA=Landscape Architecture
SAS=Science and SocietySAS=Science and Society