1
the polygons representing the areas claimed on land and in the sea. The legally binding international treaties between Guatema- la and Belize provided the geographic locations of the areas claimed, “from the Sibun River to the Sarstoon River”, allowing me to interpret this on the map. The maritime areas claimed by Guatemala also involved modify- ing different data sets to trace territorial waters of 12 nautical miles. Using different geo-processing tools like the “buffer”, “clipping”, or “dissolve” tools, I established a hypothetical mari- time boundary between Belize and the areas claimed by Guate- mala. MAP 2 – This map shows an example of the analysis that map- ping technology can provide, in this case looking at the ethnic composition of Belize’s population, and the location of signiϐicant settlements such as towns of cities. Using different analysis tools this map can contribute to identifying how many people live in the areas claimed by Guatemala, their ethnic composition, and the number of towns. MAP 3 – This map provides an example of analysis on physical attributes of a geographic location. In this case the map looks at the different ecological sub-regions on the mainland and marine protected areas also. By geo-locating these data sets and inte- grating them into the map, a number of useful information can be computed and extracted. For example, it can help to identify the number and nature of each ecological sub-region or protect- ed area, and their territorial extension. While GIS has an enormous potential for dispute resolution, its success depends on the data available. A major challenge in this exercise was acquiring the data to be used in the analysis. Data for Belize is difϐicult to locate, and it is often outdated or poor in quality. Another shortcoming of the map is how the hypothetical mari- time border was created. A better method of determining the midway points between the overlapping maritime claims needs to be explored. In this particular case the boundary was drawn as Geographic Information System (GIS) technology can be useful for resolving territorial disputes, including at the international level. While GIS technology cannot solve territorial disputes by itself, it can be used by the parties involved as a tool for conϐi- dence building, transparency, and information sharing. By clear- ly mapping the areas claimed by one party and overlaying data of all sorts, all stakeholders can acknowledge ‘what is at stake’ in the dispute. A spatial view of all that is claimed by Guatemala is useful for all parties and stakeholders involved in the dispute, for transparency and as a mutually agreed starting point to any negotiations This GIS project provides an example of how mapping technolo- gy can provide essential information useful for negotiations in a territorial dispute. By using techniques to geo-process available data, this exercise illustrates with concrete examples how GIS technology can contribute to resolving disputes. Guatemala and Belize have been embroiled in a territorial and maritime dispute since the 18th century. In October 2013 both countries will hold simultaneous referenda to decide whether to refer the case to the International Court of Justice (ICJ) to settle the dispute once and for all. The maps produced here offer a snapshot of some of the kind of information that can be considered when engaging in a territo- rial dispute. Included in this exercise are three maps showing: (1) the areas of Belize claimed by Guatemala; (2) the popula- tion and its ethnic composition in the areas claimed by Guate- mala; and (3) the location of speciϐic resources found in the claimed areas. A table summarizing the results is also displayed. MAP 1 – The ϐirst map that needed to be produced is the areas claimed by Guatemala over Belize. In order to do this I had to manipulate some of the geospatial information ϐiles to create an example, but it would require a more in-depth look at how it can be marked using more reϐined and speciϐic editing tools. Furthermore, with the proper data sets a GIS analysis of a terri- torial dispute could provide much more complex, complete, and relevant information that in this case were not included. Quality data on economic and other variables such as revenue from tourism would give a greater value to the analysis of a territorial dispute. For the purposes of this map only examples of the types of analyses that can be made were conducted. The following table is a summary of results mixing different da- ta. A policy maker facing negotiations over a territorial dispute could ϐind these results interesting as they show real numbers and data of ‘what is at stake’; all processed through different analysis tools. Overview Geospatial Techniques and Methods Difϐiculties and Limitations Map 1 Claimed Lands in Belize GIS and Territorial Disputes: The Case of Guatemala vs. Belize Conclusions Map 2 Population and Ethnicity in Claimed Map 3 Protected Forests and Marine Areas Data contained within claimed areas Quantity Size of claimed lands 7,574 km 2 Size of claimed sea 10,501 km 2 Marine Protected Areas 21 Size of Marine Protected Areas 1,527 km 2 Protected Forests 40 Size of Protected Forests 2,802 km 2 Ethnic Mayans 77,177 Ethnic Latinos 86,244 Ethnic Creole 58,504 Total Population 246,516 Summary of Results Cartographer: David Mulet Date: 8 May, 2013 Course: GIS for International Applications, The Fletcher School, Tufts University. Coordinate System: NAD_1927_UTM_Zone_16N Projection: Transverse_Mercator Sources: Global Administrative Areas; Flanders Marine Institute; ArcGIS Online; Natural Earth Data; Statistics Belize; Selva Maya Consortium; EROS Data Center, US Geological Survey; Biodiversity and Environmental Resource Data Sys- tem (BERDS) References: Wood, William B. (2000). GIS as a Tool for Territorial Negotiations. IBRU Boundary and Security Bulletin, autumn 2000. World Resources Institute (2008). The Economic Contribution of Belize’s Coral Reefs and Mangroves, 11 Novem- ber 2008. Smith, Jeffrey (2010). The Western Sahara Case: Deϐining Ocean Territory for Africa’s Last Colony. Fletcher School of Law and Diplomacy. Ministry of Foreign Affairs of Guatemala. Historia Diferendo Territorial con Belice, june 2010.

GIS and Territorial Disputes: The Case of Guatemala vs. …sites.tufts.edu/gis/files/2013/11/Mullet_David.pdf · time border was created. ... for resolving territorial disputes

  • Upload
    buianh

  • View
    218

  • Download
    4

Embed Size (px)

Citation preview


thepolygonsrepresentingtheareasclaimedonlandandinthe

sea.ThelegallybindinginternationaltreatiesbetweenGuatema-

laandBelizeprovidedthegeographiclocationsoftheareas

claimed,“fromtheSibunRivertotheSarstoonRiver”,allowing

metointerpretthisonthemap.

ThemaritimeareasclaimedbyGuatemalaalsoinvolvedmodify-

ingdifferentdatasetstotraceterritorialwatersof12nautical

miles.Usingdifferentgeo-processingtoolslikethe“buffer”,

“clipping”,or“dissolve”tools,Iestablishedahypotheticalmari-

timeboundarybetweenBelizeandtheareasclaimedbyGuate-

mala.

MAP2–Thismapshowsanexampleoftheanalysisthatmap-

pingtechnologycanprovide,inthiscaselookingattheethnic

compositionofBelize’spopulation,andthelocationofsigni icant

settlementssuchastownsofcities.Usingdifferentanalysistools

thismapcancontributetoidentifyinghowmanypeoplelivein

theareasclaimedbyGuatemala,theirethniccomposition,and

thenumberoftowns.

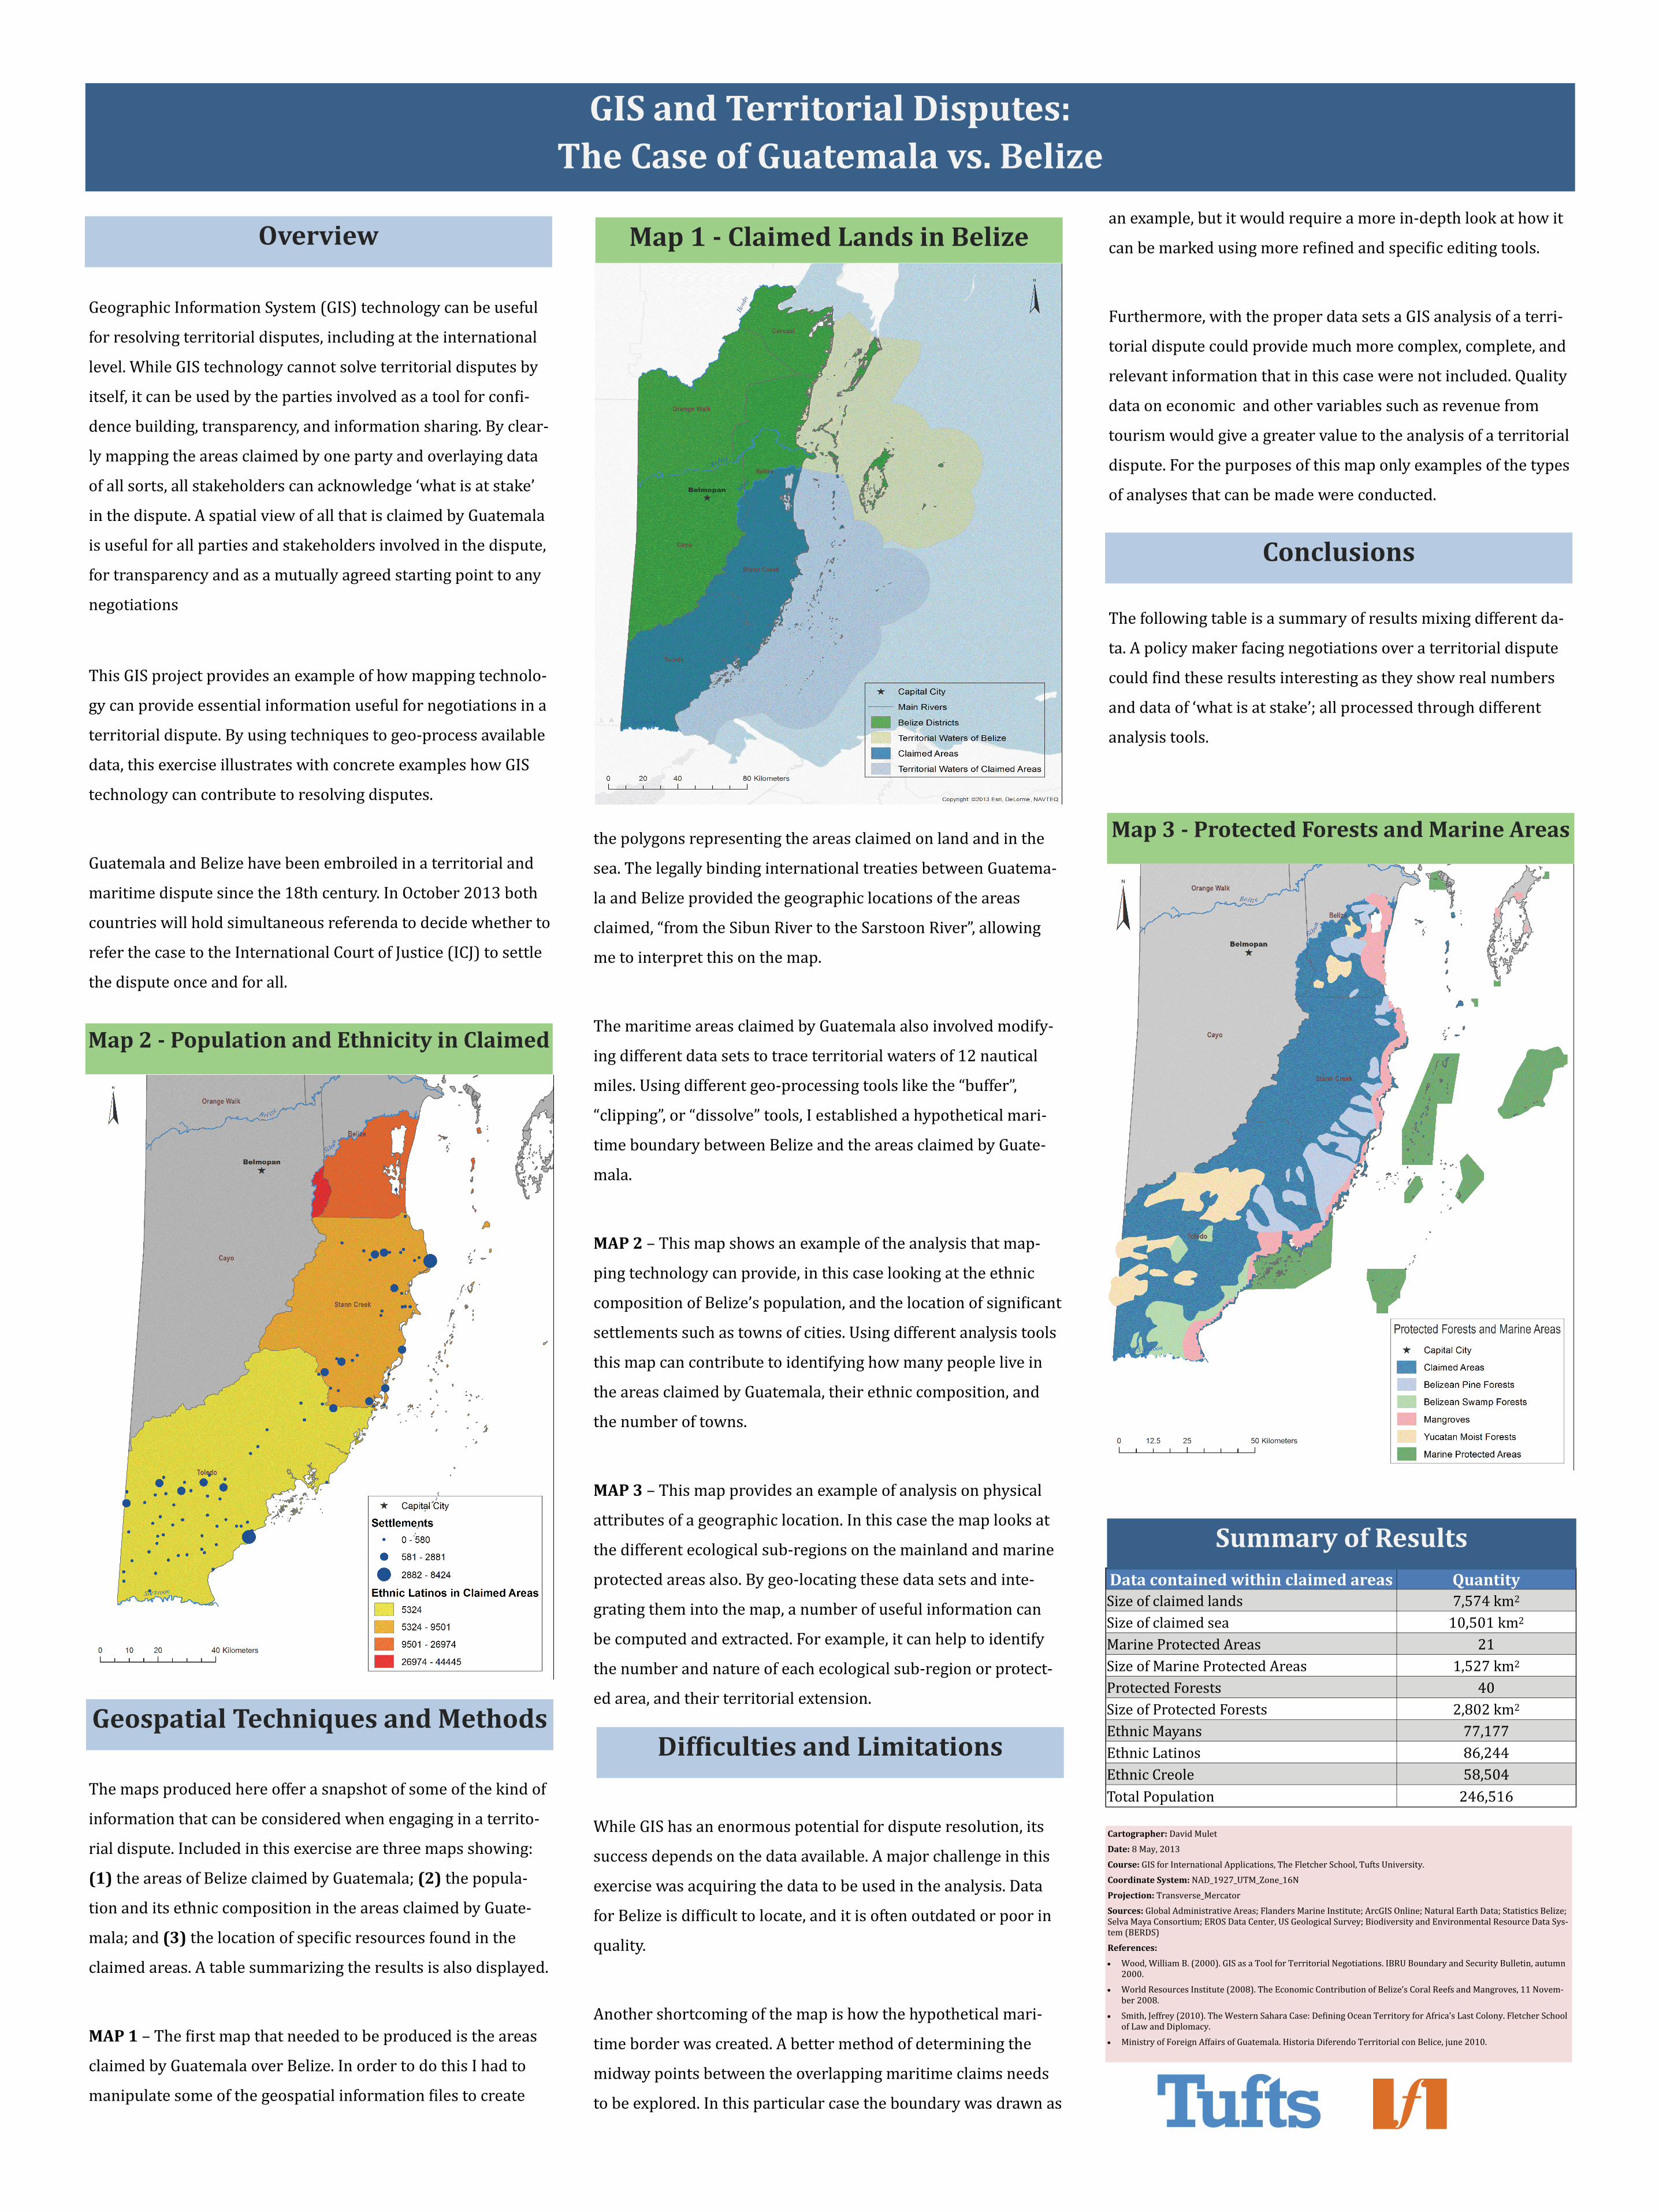
MAP3–Thismapprovidesanexampleofanalysisonphysical

attributesofageographiclocation.Inthiscasethemaplooksat

thedifferentecologicalsub-regionsonthemainlandandmarine

protectedareasalso.Bygeo-locatingthesedatasetsandinte-

gratingthemintothemap,anumberofusefulinformationcan

becomputedandextracted.Forexample,itcanhelptoidentify

thenumberandnatureofeachecologicalsub-regionorprotect-

edarea,andtheirterritorialextension.

WhileGIShasanenormouspotentialfordisputeresolution,its

successdependsonthedataavailable.Amajorchallengeinthis

exercisewasacquiringthedatatobeusedintheanalysis.Data

forBelizeisdif iculttolocate,anditisoftenoutdatedorpoorin

quality.

Anothershortcomingofthemapishowthehypotheticalmari-

timeborderwascreated.Abettermethodofdeterminingthe

midwaypointsbetweentheoverlappingmaritimeclaimsneeds

tobeexplored.Inthisparticularcasetheboundarywasdrawnas


GeographicInformationSystem(GIS)technologycanbeuseful

forresolvingterritorialdisputes,includingattheinternational

level.WhileGIStechnologycannotsolveterritorialdisputesby

itself,itcanbeusedbythepartiesinvolvedasatoolforcon i-

dencebuilding,transparency,andinformationsharing.Byclear-

lymappingtheareasclaimedbyonepartyandoverlayingdata

ofallsorts,allstakeholderscanacknowledge‘whatisatstake’

inthedispute.AspatialviewofallthatisclaimedbyGuatemala

isusefulforallpartiesandstakeholdersinvolvedinthedispute,

fortransparencyandasamutuallyagreedstartingpointtoany

negotiations

ThisGISprojectprovidesanexampleofhowmappingtechnolo-

gycanprovideessentialinformationusefulfornegotiationsina

territorialdispute.Byusingtechniquestogeo-processavailable

data,thisexerciseillustrateswithconcreteexampleshowGIS

technologycancontributetoresolvingdisputes.

GuatemalaandBelizehavebeenembroiledinaterritorialand

maritimedisputesincethe18thcentury.InOctober2013both

countrieswillholdsimultaneousreferendatodecidewhetherto

referthecasetotheInternationalCourtofJustice(ICJ)tosettle

thedisputeonceandforall.

Themapsproducedhereofferasnapshotofsomeofthekindof

informationthatcanbeconsideredwhenengaginginaterrito-

rialdispute.Includedinthisexercisearethreemapsshowing:

(1)theareasofBelizeclaimedbyGuatemala;(2)thepopula-

tionanditsethniccompositionintheareasclaimedbyGuate-

mala;and(3)thelocationofspeci icresourcesfoundinthe

claimedareas.Atablesummarizingtheresultsisalsodisplayed.

MAP1–The irstmapthatneededtobeproducedistheareas

claimedbyGuatemalaoverBelize.InordertodothisIhadto

manipulatesomeofthegeospatialinformation ilestocreate

anexample,butitwouldrequireamorein-depthlookathowit

canbemarkedusingmorere inedandspeci iceditingtools.

Furthermore,withtheproperdatasetsaGISanalysisofaterri-

torialdisputecouldprovidemuchmorecomplex,complete,and

relevantinformationthatinthiscasewerenotincluded.Quality

dataoneconomicandothervariablessuchasrevenuefrom

tourismwouldgiveagreatervaluetotheanalysisofaterritorial

dispute.Forthepurposesofthismaponlyexamplesofthetypes

ofanalysesthatcanbemadewereconducted.

Thefollowingtableisasummaryofresultsmixingdifferentda-

ta.Apolicymakerfacingnegotiationsoveraterritorialdispute

could indtheseresultsinterestingastheyshowrealnumbers

anddataof‘whatisatstake’;allprocessedthroughdifferent

analysistools.

Overview

GeospatialTechniquesandMethodsDif icultiesandLimitations

Map1‐ClaimedLandsinBelize

GISandTerritorialDisputes:TheCaseofGuatemalavs.Belize

Conclusions

Map2‐PopulationandEthnicityinClaimed

Map3‐ProtectedForestsandMarineAreas

Datacontainedwithinclaimedareas QuantitySizeofclaimedlands 7,574km2Sizeofclaimedsea 10,501km2MarineProtectedAreas 21SizeofMarineProtectedAreas 1,527km2ProtectedForests 40SizeofProtectedForests 2,802km2EthnicMayans 77,177EthnicLatinos 86,244EthnicCreole 58,504TotalPopulation 246,516

SummaryofResults

Cartographer:DavidMulet

Date:8May,2013

Course:GISforInternationalApplications,TheFletcherSchool,TuftsUniversity.

CoordinateSystem:NAD_1927_UTM_Zone_16N

Projection:Transverse_Mercator

Sources:GlobalAdministrativeAreas;FlandersMarineInstitute;ArcGISOnline;NaturalEarthData;StatisticsBelize;SelvaMayaConsortium;EROSDataCenter,USGeologicalSurvey;BiodiversityandEnvironmentalResourceDataSys-tem(BERDS)

References:

Wood,WilliamB.(2000).GISasaToolforTerritorialNegotiations.IBRUBoundaryandSecurityBulletin,autumn2000.

WorldResourcesInstitute(2008).TheEconomicContributionofBelize’sCoralReefsandMangroves,11Novem-ber2008.

Smith,Jeffrey(2010).TheWesternSaharaCase:De iningOceanTerritoryforAfrica’sLastColony.FletcherSchoolofLawandDiplomacy.

MinistryofForeignAffairsofGuatemala.HistoriaDiferendoTerritorialconBelice,june2010.