Embed Size (px)
Citation preview

Dow
nloa
ded
By:
[Tuf
ts U
nive
rsity
] At:
21:4
6 9
Apr
il 20
08
GIS Based Marine Platinum Exploration,Goodnews Bay Region, Southwest Alaska
THOMAS OOMMEN1, ANUPMA PRAKASH2,DEBASMITA MISRA3, SATHY NAIDU4, JOHN J.KELLEY4, AND SUKUMAR BANDOPADHYAY3
1Department of Civil and Environmental Engineering, Tufts University,Medford, MA, USA2Geophysical Institute, University of Alaska Fairbanks, Fairbanks,AK, USA3Department of Mining and Geological Engineering, University of AlaskaFairbanks, Fairbanks, AK, USA4Institute of Marine Science, University of Alaska Fairbanks, Fairbanks,AK, USA
Goodnews Bay, southwest Alaska, is known for platinum (Pt) reserve that extendsoffshore in the Bering Sea. To assess the nearshore placer potential we first collatedmarine Pt concentrations available since 1960 in a geographic information system(GIS) database. Subsequently, in 2005, we collected 23 pipe dredge sedimentsamples and 26 vibracores from unexplored sites and analyzed them for Pt. This sam-pling was supplemented by magnetic (Sea Spy) and seismic (side scan, geoacousticand datasonic bubble pulser) surveys. Integrating results of geospatial analysis ofPt concentrations with geophysical analysis using GIS techniques led to delineatefour locations encouraging for further Pt exploration. Of these, two locations fallclose to paleochannels and drowned ultramafic source, while the other two coincidewith high energy environments in the Goodnews Bay and close to the Carter Bay.
Keywords Beringia, geodatabase, glaciation, image analysis, magnetic, seismic,ultramafic
Platinum (Pt) metal has several industrial applications, particularly in the making ofjewelery and use in electronics and strategic military components. Pt resources in theUnited States (US) are very limited. One of the largest resources is the alluvial placer
Manuscript received 6 July 2007; accepted 9 September 2007.The financial support for this work was provided by the Minerals Management Service
(MMS) of US Department of Interior under the cooperative agreement # 1435-01-02-CA-85124. The authors are grateful to all who helped to gather data from various research worksdone in this region for the past five decades. The authors thank Jim Barker for his commentsand assistance in sample collection; Golders Associates, Seattle, for collection and synthesis ofthe geophysical data; and Crayton Fenn (Inner Space Exploration, Seattle) for the assistancein the vibracore sampling. The discussions with Darrell Kaufman in the formulating stage ofthe study are appreciated.
Address correspondence to Thomas Oommen, Department of Civil and EnvironmentalEngineering, 200 College Avenue, Tufts University, Medford, MA 02155. E-mail: [email protected]
Marine Georesources and Geotechnology, 26:1–18, 2008Copyright # Taylor & Francis Group, LLCISSN: 1064-119X print/1521-0618 onlineDOI: 10.1080/10641190701706270
1

Dow
nloa
ded
By:
[Tuf
ts U
nive
rsity
] At:
21:4
6 9
Apr
il 20
08
deposit in the Red Mountain region and Goodnews Bay, in southwest Alaska(Figure 1), from which at least 22 tons of Pt have been recovered (Barker, 1986).The Red Mountain dunite is considered the primary source of Pt in this region(Harrington, 1919; Hoare and Coonrad, 1961; Mertie, 1969). Due to depletion ofthe shallow economic reserves, this area has not been mined since the 1980’s.
The United States Geological Survey (USGS) estimated the marine Pt placerpotential for the Goodnews Bay region at 155 metric tons (Page et al., 1973; Barker,1986). Several investigations for government agencies, individuals, and corporationshave tried to assess the marine Pt resource in offshore of Goodnews Bay. However,these assessments have not incisively estimated the resource potential. The first objec-tive of this study is to integrate all marine Pt placer related data for the Goodnews
Figure 1. Map showing the study area boundary and the bathymetric contours. Inset showsthe location of Goodnews Bay in south west Alaska.
2 T. Oommen et al.

Dow
nloa
ded
By:
[Tuf
ts U
nive
rsity
] At:
21:4
6 9
Apr
il 20
08
Bay coastal area with the intent to identify data gaps. The second objective is to aug-ment the Pt assessments, especially from areas where there is a paucity of data, and tointegrate all available information in a GIS database. Additional aim is to analyze theentire dataset using GIS techniques to identify potential sites for further exploitationand=or in-depth exploration for marine Pt placer deposits in the study area.
The selection of the study area (Figure 1) for Pt placer resource estimation isbased on three major reasons. One, that the area is adjacent to Red Mountain, whichis long known to be the source of Pt in the adjacent coastal region. Two, the recentpaleoenvironmental history of the area could have been favorable for placerevolution. A third reason is the occasional report of Pt occurrence in the GoodnewsBay offshore. During the Pleistocene the eustatic sea level in this region fluctuated,with the glacial sea level about 120 m below the present level �21 ky B.P (Hopkins,1967; Manley, 2002). During this time, there existed a land bridge, the Beringia,connecting Alaska and Russia. The post-glacial transgression that occurred�5-3 ky B.P closely defined the present coastline. The isobath map of the study areareveals presence of several sand bars, aligned parallel or sub-parallel to the presentcoastline (Figure 1). Presumably, the sand bars are submerged paleobeaches, anenvironment generally characterized by intensified wave sorting and concentrationof heavy minerals (with possible entrained Pt grains). An analogous scenario isthe offshore (and onshore) paleo-marine gold placers of the Nome region (Nelsonet al., 1972).
The Pt that has been mined from the hinterland of the Goodnews Bay region isconfined mostly to Salmon River and its tributaries draining the Red Mountain(Figure 1). The Red Mountain is a large sill like dunite mass that is repeatedlyexposed by one or more north-south (N-S) trending folds or faults, and at placescovered by a thin layer of country rock and surface sediments (Barker, 1986). There-fore, there is a probability of the presence of buried folded or faulted ultramafics inthe offshore region. The paleochannels draining these ultramafics, and the ancientanalog of the Salmon River now submerged, are potential locations for Pt explo-ration (Mertie, 1940).
In this study, we have collated all Pt-placer related information, available since1960, into a geodatabase, have identified data gaps, and followed by collection ofnew geophysical and Pt data on sediments from the offshore region. Finally, we haveanalyzed all this data, using GIS techniques, to delineate offshore areas of potentialPt resource accumulation.
Geodatabase
Geodatabase, the database behind a GIS, offers a practical solution to integrate datawith reference to its geographic location. Using inbuilt GIS tools, these data can thenbe effectively managed, analyzed and visualized to understand complex processes.The power of the GIS lies in its potential to query the database, generate thematicmaps, and to serve as a decision support system. The Goodnews Bay region geoda-tabase included existing Pt concentrations; geophysical data; new data acquired by usduring the ‘‘Platinum Cruise 2005’’; available bathymetry data; satellite image data;published glacial extent information; geologic maps; and limited interpretationsfrom earlier researcher. The most important of these datasets are briefly describedin the following sections. The Goodnews Bay region geodatabase is hosted athttp://mms-goodnewsbay.gina.alaska.edu/.
GIS Based Marine Exploration 3

Dow
nloa
ded
By:
[Tuf
ts U
nive
rsity
] At:
21:4
6 9
Apr
il 20
08
Platinum Concentrations
Prior to our investigation, four agencies together assessed the Pt values for 428 loca-tions for the study area (Figure 2). Of these 428 data points, 316 were collected bythe Inlet Oil Corporation, Alaska (Conwell, 1976); 31 were contributed by theUSGS; 54 were reported by the United States Bureau of Mines (USBM); and theremaining 27 came from Western Gold Exploration and Mining Limited Partnership(WestGold) (Howkins, 1988; Barker and Lamal, 1989; Oommen, 2006).
However, the inventory of the Pt data from these agencies revealed that most ofthe data were within the 4.8 km state offshore jurisdiction, and that there was apaucity of data from farther offshore region (Figure 2).
Figure 2. Location of available platinum and geophysical data from the study area obtainedby several different agencies in the past. There are 77 samples within the Goodnews Bay 400outside the bay.
4 T. Oommen et al.

Dow
nloa
ded
By:
[Tuf
ts U
nive
rsity
] At:
21:4
6 9
Apr
il 20
08
Geophysical Data
The USBM in 1988 conducted a geophysical survey in the study area and indicatedthe possible presence of drowned ultramafic rocks offshore (Figure 2). The majorfindings of their study are:
1. The magnetic anomalies immediately south of Red Mountain (offshore, Figure 2)reflect an extension of the Goodnews Bay ultramafic complex (Barker et al.,1988; Barker and Lamal, 1989).
2. The magnetic anomalies northwest of Red Mountain (Figure 2) in the offshoreare possibly displaced by a fault or a convoluted fold similar to the one onshorebetween the Red and Susie mountains (Southworth and Foley, 1986; Barker et al.,1988).
3. The structure of the ultramafic complex northwest of Red Mountain appears toextend farther west beyond the survey lines of 1988. However, these are inter-preted from widely spaced transects and needed further investigations (Barkeret al., 1988; Barker and Lamal, 1989).
Zelenka (1988) interpreted the offshore seismic data collected by the USGS in1969 and identified three possible buried paleochannels (Figure 2). However, hestated that ‘‘these channel locations are approximate and high resolution data isrequired to verify and define their locations.’’
Platinum Cruise 2005 and Sample Processing for Pt Contents
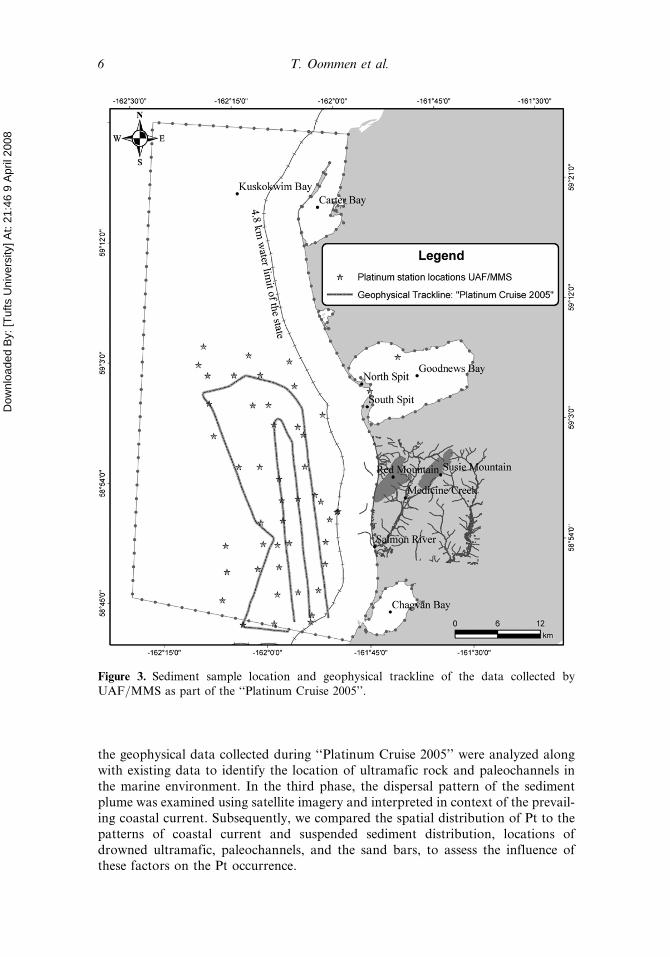
The ‘‘Platinum Cruise 2005’’ was conducted in summer 2005 to fill in data gaps forthe comprehensive analysis of the Pt resource potential in the study area. The specificactivities of the cruise included collection of 23 pipe dredge sediments and 26 vibra-core samples from unexplored sites off Goodnews Bay (Figure 3). This sampling wassupplemented by magnetic (Sea Spy) and seismic (side scan, Geoacoustic and Data-sonic bubble pulser) surveys. The details of the cruise, instrumentation used and onsediment collection are addressed in Oommen (2006). The sediment samples for Ptestimation were processed following the method outlined by the USBM (Barkeret al., 1988). Briefly, each of the short (1–3 m long) vibracore samples were extrudedinto a trough to make a gross sample. So was each of the pipe dredge samples. Fromthe individual gross sample �750 g of sand and silt fraction was separated by wetsieving using a nest of screens followed by repeated washing out fraction after clay.From known weights of each of the dried sand and silt fraction the heavy mineralfraction was separated, using methylene iodide (specific gravity: 3.2), and weighed.About 20–30 g aliquot of the heavy mineral concentrate was taken for Pt analysisby fire assay (ALS Chemex, 2005). Assuming negligible Pt present in the graveland clay size, the Pt concentrations in the sand and silt fractions were combinedand prorated to the gross sediment.
Analysis
We analyzed all available data for the Goodnews Bay region in three phases to delin-eate the potential locations for marine Pt resource. The first phase was to include thePt values in the geodatabase to model their spatial distribution. In the second phase,
GIS Based Marine Exploration 5
Dow
nloa
ded
By:
[Tuf
ts U
nive
rsity
] At:
21:4
6 9
Apr
il 20
08
the geophysical data collected during ‘‘Platinum Cruise 2005’’ were analyzed alongwith existing data to identify the location of ultramafic rock and paleochannels inthe marine environment. In the third phase, the dispersal pattern of the sedimentplume was examined using satellite imagery and interpreted in context of the prevail-ing coastal current. Subsequently, we compared the spatial distribution of Pt to thepatterns of coastal current and suspended sediment distribution, locations ofdrowned ultramafic, paleochannels, and the sand bars, to assess the influence ofthese factors on the Pt occurrence.
Figure 3. Sediment sample location and geophysical trackline of the data collected byUAF=MMS as part of the ‘‘Platinum Cruise 2005’’.
6 T. Oommen et al.
Dow
nloa
ded
By:
[Tuf
ts U
nive
rsity
] At:
21:4
6 9
Apr
il 20
08
Phase I: ‘‘Precious Metal Analysis’’
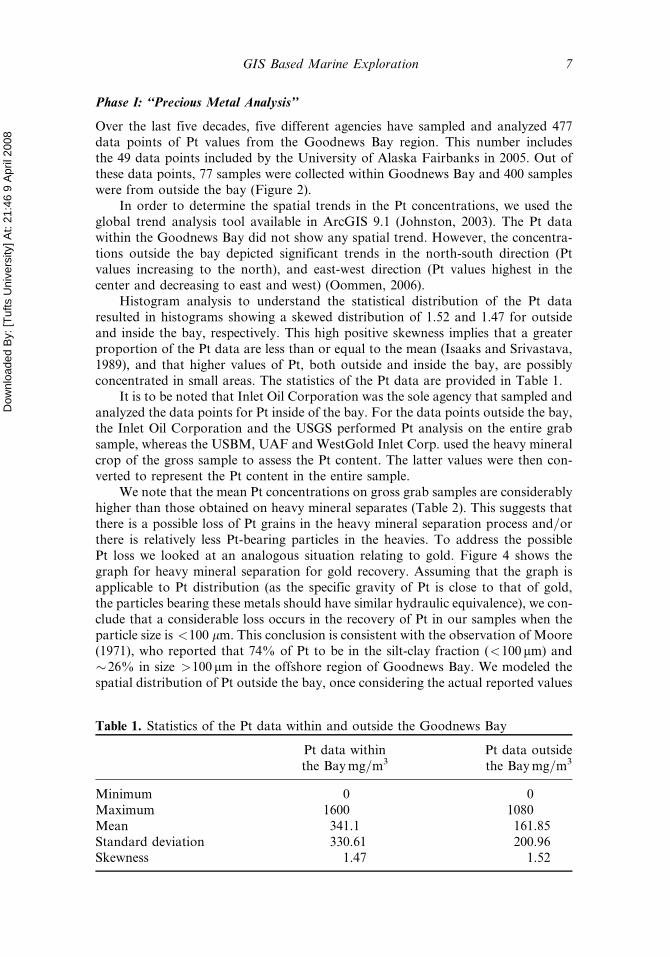
Over the last five decades, five different agencies have sampled and analyzed 477data points of Pt values from the Goodnews Bay region. This number includesthe 49 data points included by the University of Alaska Fairbanks in 2005. Out ofthese data points, 77 samples were collected within Goodnews Bay and 400 sampleswere from outside the bay (Figure 2).
In order to determine the spatial trends in the Pt concentrations, we used theglobal trend analysis tool available in ArcGIS 9.1 (Johnston, 2003). The Pt datawithin the Goodnews Bay did not show any spatial trend. However, the concentra-tions outside the bay depicted significant trends in the north-south direction (Ptvalues increasing to the north), and east-west direction (Pt values highest in thecenter and decreasing to east and west) (Oommen, 2006).
Histogram analysis to understand the statistical distribution of the Pt dataresulted in histograms showing a skewed distribution of 1.52 and 1.47 for outsideand inside the bay, respectively. This high positive skewness implies that a greaterproportion of the Pt data are less than or equal to the mean (Isaaks and Srivastava,1989), and that higher values of Pt, both outside and inside the bay, are possiblyconcentrated in small areas. The statistics of the Pt data are provided in Table 1.
It is to be noted that Inlet Oil Corporation was the sole agency that sampled andanalyzed the data points for Pt inside of the bay. For the data points outside the bay,the Inlet Oil Corporation and the USGS performed Pt analysis on the entire grabsample, whereas the USBM, UAF and WestGold Inlet Corp. used the heavy mineralcrop of the gross sample to assess the Pt content. The latter values were then con-verted to represent the Pt content in the entire sample.
We note that the mean Pt concentrations on gross grab samples are considerablyhigher than those obtained on heavy mineral separates (Table 2). This suggests thatthere is a possible loss of Pt grains in the heavy mineral separation process and=orthere is relatively less Pt-bearing particles in the heavies. To address the possiblePt loss we looked at an analogous situation relating to gold. Figure 4 shows thegraph for heavy mineral separation for gold recovery. Assuming that the graph isapplicable to Pt distribution (as the specific gravity of Pt is close to that of gold,the particles bearing these metals should have similar hydraulic equivalence), we con-clude that a considerable loss occurs in the recovery of Pt in our samples when theparticle size is <100 lm. This conclusion is consistent with the observation of Moore(1971), who reported that 74% of Pt to be in the silt-clay fraction (<100 mm) and�26% in size >100 mm in the offshore region of Goodnews Bay. We modeled thespatial distribution of Pt outside the bay, once considering the actual reported values
Table 1. Statistics of the Pt data within and outside the Goodnews Bay
Pt data withinthe Bay mg=m3
Pt data outsidethe Bay mg=m3
Minimum 0 0Maximum 1600 1080Mean 341.1 161.85Standard deviation 330.61 200.96Skewness 1.47 1.52
GIS Based Marine Exploration 7

Dow
nloa
ded
By:
[Tuf
ts U
nive
rsity
] At:
21:4
6 9
Apr
il 20
08
of Pt concentrations, and a second time with adjusted Pt values to account for theloss factor (Oommen, 2006).
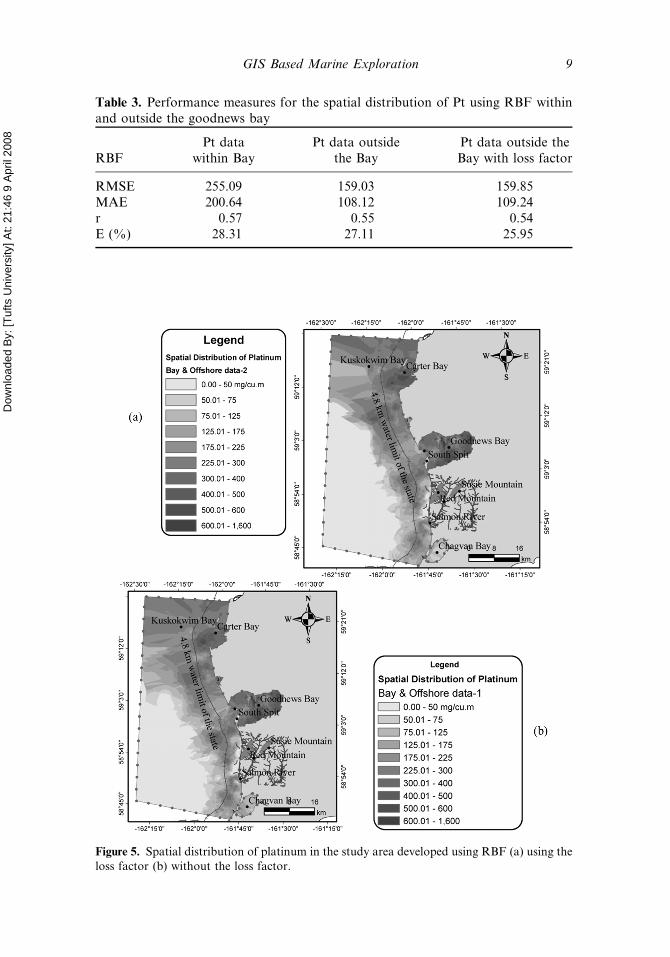
In our study the spatial distribution of Pt concentrations was analyzed by apply-ing a radial basis function (RBF) model, using ArcGIS 9.1 (Johnston, 2003). Prior tothe model development, we split the available data into two random subsets. The lar-ger subset comprising 80% of the data was used as a ‘training data’ for developing themodel, while the smaller 20% subset served as the testing data to verify the reliabilityof the results based on the first subset. Using the larger 80% subset for trainingensures that there are sufficient data points for the model development. To assessand validate the developed model, we subsequently used standard performancemeasures such as root mean square error (RMSE), mean absolute error (MAE),correlation coefficient (r) and coefficient of efficiency (E) (Nash and Sutcliffe,1970). Table 3 shows the performance measures obtained for the validation of theRBF model using the testing data.
Table 2. Minimum, maximum and mean value of Pt obtained by different agenciesin the study area
AgenciesMinimum
pt (mg=m3)Maximumpt (mg=m3)
Meanpt (mg=m3)
Sample fractionanalyzed
Inlet Oil corp 20 1600 270 Whole sampleUSGS 10 700 120 Whole sampleUSBM 0 180 7 Heavy mineral concentrateWestGold 0 40 2 Heavy mineral concentrateUAF=MMS 0 70 5 Heavy mineral concentrate
Figure 4. Plot of gold recovery vs. grain size during heavy mineral separation. Adapted fromODM laboratories, Ontario, Canada (agency who carried out heavy mineral separation forsediment samples collected from ‘‘Platinum Cruise 05’’).
8 T. Oommen et al.
Dow
nloa
ded
By:
[Tuf
ts U
nive
rsity
] At:
21:4
6 9
Apr
il 20
08
Table 3. Performance measures for the spatial distribution of Pt using RBF withinand outside the goodnews bay
RBFPt data
within BayPt data outside
the BayPt data outside theBay with loss factor
RMSE 255.09 159.03 159.85MAE 200.64 108.12 109.24r 0.57 0.55 0.54E (%) 28.31 27.11 25.95
Figure 5. Spatial distribution of platinum in the study area developed using RBF (a) using theloss factor (b) without the loss factor.
GIS Based Marine Exploration 9

Dow
nloa
ded
By:
[Tuf
ts U
nive
rsity
] At:
21:4
6 9
Apr
il 20
08
The models developed for the prediction of Pt inside and outside the GoodnewsBay were combined to develop the prediction map for the entire study area. The Ptdistribution map for the study area developed using the data from inside the bay andoutside bay with and without loss factor is given in Figures 5(a) and 5(b). A compari-son of Figures 5(a) and 5(b) reveals that there was no significant change in the spatialdistribution pattern of Pt by incorporating the loss factor.
Phase II: Geophysical Analysis
Magnetic Data Analysis
Using a nearest neighbor interpolator, we interpolated and contoured the magneticdata obtained from the ‘‘Platinum Cruise 05’’. A magnetic value exceeding �500gamma from the mean (53581 gamma) was symbolized as a magnetic anomaly, asshown in Figure 6. This was the same procedure that USBM had adopted for marinemagnetic data analysis in this region in 1988 (Barker et al., 1988; Barker et al., 1989).The contour map shows several magnetic anomalies on the near shore transects.These anomalous values, which ranged 2000–3000 gammas (Figure 6), are usuallyassociated with ultramafic rocks (Dyment et al., 2005).
We studied and compared the results of the magnetic data obtained from ‘‘Plati-num Cruise 05’’ in light of the geology, structure of the ultramafics and the recordsof the past magnetic surveys in this region. Overlaying the marine magnetic datarecorded by the USBM on the magnetic anomalies mapped by us (Figure 6) revealsthat the ultramafics extend farther west of the location mapped by the USBM in1988.
Seismic Data Analysis
In order to map the subsurface geologic features and verify the extension ofsubmerged paleochannels in the offshore of Goodnews Bay, we visually analyzedthe seismic reflection data from ‘‘Platinum Cruise 05’’. This analysis identified twopaleochannels; one west of Red Mountain, and the other towards the south of thestudy area (Figure 7). We also compared these channels to the ones identified byUSGS (Zelenka, 1988) (Figure 7). Of the three paleochannels identified by theUSGS, the channel in the north closely coincides with the findings of the ‘‘PlatinumCruise 05.’’ The paleochannel identified south of the study area seems to be acontinuation of the paleochannel identified by the USGS (Figure 7), and is possiblyan extension of the Salmon River analog, which flowed into the Chagvan Bay area inlast glacial interval (Mertie, 1940).
Overlaying the paleochannel locations on the inferred magnetic anomalies(Figure 8) reveals that the paleochannel west of Red Mountain passed in betweenthe magnetic anomalies (inferred drowned ultramafic: ‘‘Platinum Cruise 05’’,Figure 6). At the present time the Salmon River, which runs in the proximity ofthe ultramafic rocks (Red and Susie Mountains), has entrained most of the alluvialplacer Pt that has been locally mined. Figure 8 shows that a condition analogous tothat observed onshore (Salmon River) exists offshore, suggesting that the paleo-channel identified near the buried ultramafics is a location for rich resource potentialfor placer Pt.
10 T. Oommen et al.

Dow
nloa
ded
By:
[Tuf
ts U
nive
rsity
] At:
21:4
6 9
Apr
il 20
08
Phase III: Assessment of Suspended Sediment Distribution
We used a natural color composite image from Landsat 7 Enhanced ThematicMapper (ETM), acquired on 27 September 2000, to understand the suspended sedi-ment distribution pattern (Edwards and Mumby, 1999), the transportation processesof the suspensates, and to deduce from the distribution low and high energy deposi-tional environments in context of placer Pt deposits. In order to obtain a bettervisualization of the sediment plume, a contrast stretching image enhancement wasapplied. The intent of contrast stretching was to broaden the narrow range of reflec-tance values typically present in an input image over a wider range of grey values(Lillesand et al., 2004). Figure 9 shows the enhanced image overlaid with the direc-tion of longshore sediment transport as determined by the USGS (Hunter et al.,1979). The enhanced image shows that there is a relatively larger sediment load
Figure 6. A comparison of the magnetic interpretation from USBM (Barker et al., 1988) to themagnetic data collected from ‘‘Platinum Cruise 05’’.
GIS Based Marine Exploration 11

Dow
nloa
ded
By:
[Tuf
ts U
nive
rsity
] At:
21:4
6 9
Apr
il 20
08
inside Goodnews Bay and the area close to Carter Bay in the north. The largeamount of suspended sediment load reflects either or both of two possibilities.One, that the area is subjected locally to greater suspension of particles from rework-ing of bottom sediments by site-specific intense nearshore currents. The alternativeexplanation is that the area has larger input of terrigenous suspended sedimentplume which has not settled out to the bottom because of high turbulence. In eithercase the area reflects presence of relatively high energy depositional environment.
Integrated Analysis
Finally, we used GIS techniques to integrate maps showing the inferred spatialdistribution of Pt, drowned ultramafic, paleochannels, coastal current direction,
Figure 7. A comparison of the paleochannels identified by USGS (Zelenka, 1988) with thechannels identified from the seismic data obtained from ‘‘Platinum Cruise 05’’.
12 T. Oommen et al.

Dow
nloa
ded
By:
[Tuf
ts U
nive
rsity
] At:
21:4
6 9
Apr
il 20
08
sediment distribution pattern and the sand bars in a geographically consistentmanner (Figure 10), in an attempt to find correlations and to better constrainthe factors influencing the Pt distribution pattern. However, Figure 10 shows noparticular correlation between drowned ultramafics, paleochannels and high Ptconcentrations. The probable reason for this is that the seismic data analysishad identified the bottom of these channels to be about 20–40 m deep and thatthey are covered with modern sediments. It is likely that in these sites, at depthsgreater than what we sampled in the ‘‘Platinum Cruise 2005’’, higher Pt concentra-tions occur.
The comparison of the spatial distribution pattern of Pt and the sediments(Figures 9 and 10) in the study area suggests that both Pt and the suspendedsediments are high inside the Goodnews Bay and regions close to Carter Bay in
Figure 8. A comparison of the magnetic and seismic data interpretation from the study area.
GIS Based Marine Exploration 13

Dow
nloa
ded
By:
[Tuf
ts U
nive
rsity
] At:
21:4
6 9
Apr
il 20
08
the North. Earlier we had suggested that the regions of high loads of suspended sedi-ments are local areas with intense current turbulence Thus, it is implied that thedepositional pattern of Pt in the study area is influenced by hydraulic sorting ofPt-bearing particles by coastal currents.
We also examined the possibility of placer Pt concentration associated withpaleo sandbars which generally have an origin in high energy environment such asa beach. The spatial distribution pattern of Pt and the sand bars observed in thestudy area is shown in Figure 10. Out of the four sand bars identified in the studyarea, the one in the north closer to the shoreline shows some promising Pt deposits.The other three sand bars do not show sufficient evidence for lag deposits. Thiscould be because of either insufficient data from areas close to these sand bars orburial of the lag deposits by modern sediments.
Figure 9. Landsat image enhanced by contrast stretching showing the sediment loaded areas,it is overlaid by the direction of longshore sediment transport due to coastal currents by USGS(Hunter et al., 1979).
14 T. Oommen et al.

Dow
nloa
ded
By:
[Tuf
ts U
nive
rsity
] At:
21:4
6 9
Apr
il 20
08
Conclusions
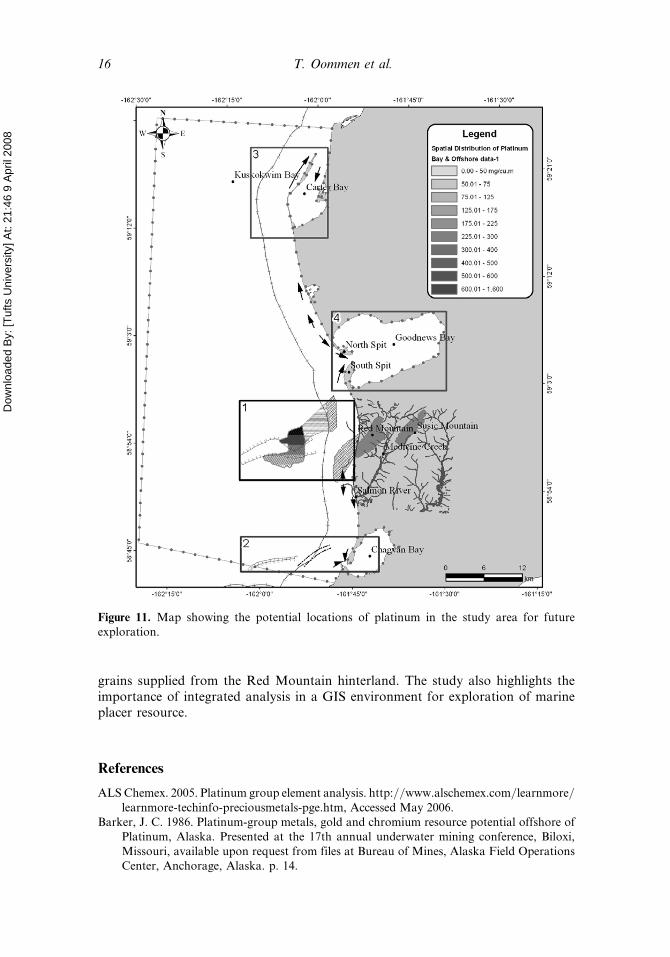
To assess the marine Pt placer resource potential for the Goodnews Bay offshore,a geodatabase was developed by integrating all relevant data available for theregion. The analysis of the geophysical data (both seismic and magnetic) ident-ified drowned ultramafics and adjacent to it two paleochannels (possible ancientanalog of the present Salmon River entrained with Pt placer) (Figure 11: inset 1and 2). These deeply buried paleochannels are potential areas for Pt placerconcentrates.
The spatial distribution of Pt indicates relatively elevated concentrations of Pt attwo locations, proximal to Carter Bay and Goodnews Bay (Figure 11: inset 3 and 4).High Pt concentrations coinciding with dense suspended sediment plume suggeststhat the two areas are local high energy environments characterized by intensecoastal and tidal currents, conducive for hydraulic sorting and concentration of Pt
Figure 10. A comparison of the spatial distribution of platinum with possible drowned ultra-mafic rocks, paleochannels, coastal current direction and sand bars.
GIS Based Marine Exploration 15
Dow
nloa
ded
By:
[Tuf
ts U
nive
rsity
] At:
21:4
6 9
Apr
il 20
08
grains supplied from the Red Mountain hinterland. The study also highlights theimportance of integrated analysis in a GIS environment for exploration of marineplacer resource.
References
ALS Chemex. 2005. Platinum group element analysis. http://www.alschemex.com/learnmore/learnmore-techinfo-preciousmetals-pge.htm, Accessed May 2006.
Barker, J. C. 1986. Platinum-group metals, gold and chromium resource potential offshore ofPlatinum, Alaska. Presented at the 17th annual underwater mining conference, Biloxi,Missouri, available upon request from files at Bureau of Mines, Alaska Field OperationsCenter, Anchorage, Alaska. p. 14.
Figure 11. Map showing the potential locations of platinum in the study area for futureexploration.
16 T. Oommen et al.

Dow
nloa
ded
By:
[Tuf
ts U
nive
rsity
] At:
21:4
6 9
Apr
il 20
08
Barker, J. C., K. Lamal, C. L. Mardock, and W. C. Hirt. 1988. Placer platinum-group metalsoff shore of the Goodnews Bay, ultramafic complex, Southwest Alaska. Bureau of LandManagement, Open File Report 53–88, Anchorage, Alaska, p. 60.
Barker, J. C. and K. Lamal. 1989. Offshore extension of platiniferous bedrock and associated
Barker, J. C., M. S. Robinson, and T. K. Bundtzen. 1989. Marine placer development andopportunities in Alaska. Mining Engineering 42: 551–558.
Conwell, C. N. 1976. Progress and prospects in marine mining in Alaska. Information Circular22, Department of Natural Resources, Alaska.
Dyment, J., K. Tamaki, H. Horen, Y. Fouquet, K. Nakase, M. Yamamoto, M. Ravilly, and M.Kitazawa. 2005. A positive magnetic anomaly at Rainbow hydrothermal site in ultramaficenvironment. International Association of Geomagnetism and Aeronomy Conference,Abstract number IAGA2005-A-01529, http://www.cosis.net/abstracts/IAGA2005/01529/IAGA2005-A-01529-1.pdf?PHPSESSID=60d2e85ef6f8f78edff6ef8cd3caaa8b.Accessed July 2006.
Edwards, A. J. and P. J. Mumby. 1999. Bathymetric mapping using Landsat TM imagery:Applications of satellite and airborne image data to coastal management. A. J. Edwards(ed.), UNESCO: Paris, France.
Harrington, G. L. 1919. Mineral resources of the Goodnews Bay region. United StatesGeological Survey Bulletin 714: 207–228.
Hoare, J. M. and W. L. Coonrad. 1961. Geologic map of the Hagmeister Island quadrangle,Alaska. United States Geological Survey Miscellaneous, Geological Invest, Map I-321.
Hopkins, D. M. 1967. The cenozoic history of Beringia – a synthesis. Pp. 451–484in D. M. Hopkins (ed.), The Bering Land Bridge. Stanford, CA: Stanford UniversityPress.
Howkins, C. A. 1988. An analysis of platinum and gold within coastal sedimentary facies,Platinum, Alaska. Report Western Gold Exploration and Mining Limited Partnership,Englewood, Colorado, p. 46.
Hunter, R. E., A. H. Sallenger, and W. R. Dupre. 1979. Maps showing direction of longshoresediment transport along the Alaska Bering Sea coast. United States Geological SurveyMiscellaneous Field Studies Map MF-1049, 5 sheets scale 1:250,000, p. 7.
Isaaks, E. H. and R. M. Srivastava. 1989. An introduction to applied geostatistics. New York:Oxford University Press, p. 561.
Johnston, K. 2003. Using ArcGIS geostatistical analyst. Redlands, California: ESRI Press,p. 316.
Lillesand, T. M., R. W. Kiefer, and J. W. Chipman. 2004. Remote sensing and image interpret-ation. New York: Wiley, 5th Edition, p. 784.
Manley, W. F. 2002. Postglacial flooding of the Bering land bridge. A Geospatial Animation:Institute of Arctic and Alpine Research, University of Colorado, v. 1, http://instaar.colorado.edu/QGISL/bering land bridge. Accessed July 2006
Mertie, J. B. Jr. 1940. The Goodnews platinum deposits. United States Geological SurveyBulletin 918, p. 97.
Mertie, J. B. Jr. 1969. Economic geology of platinum metals. United States Geological SurveyProfessional Paper 630, p. 120.
Moore, J. R. 1971. [Letter written by Moore, J. R., to Thompson, R. M., Archived in theThompson collection at Keith B. Mather Library: Contact person, Librarian, KeithB. Mather Library, Fairbanks, Alaska 99775] Unpublished raw data.
Nash, J. E., and Sutcliffe, J. V. 1970. River flow forecasting through conceptual models.Part I – A discussion of principles. Journal of Hydrology 10(3): 282–290.
Nelson, H. C., D. M. Hopkins, and D. W. Scholl. 1972. Cenozoic sedimentary and tectonichistory of the Bering Sea. Pp. 485–516 in D. W. Hood and E. J. Kelley (eds.),Oceanography of Bering Sea. Fairbanks, AL: Institute of Marine Science, University ofAlaska.
GIS Based Marine Exploration 17
sedimentation of the Goodnews Bay ultramafic complex, Alaska. Marine Mining 8(4).

Dow
nloa
ded
By:
[Tuf
ts U
nive
rsity
] At:
21:4
6 9
Apr
il 20
08
Oommen, T. 2006. Geodatabase development and GIS based analysis for resource assessmentof placer platinum in the offshore region of Goodnews Bay, Alaska, Masters Thesis,University of Alaska Fairbanks, Fairbanks, p. 198.
Page, N. J., A. L. Clark, G. A. Desborough, and R. L. Parker. 1973. Platinum group metals inUnited States mineral resources. United States Geological Survey Professional Paper 820,pp. 537–545.
Southworth, D. D. and J. Y. Foley. 1986. Lode platinum-group metals potential of the Good-news Bay ultramafic complex, Alaska. United States Bureau of Mines Open-File Report51–86, p. 82.
Zelenka, B. R. 1988. A review of favorable offshore and coastal depositional sites forplatinum- group metals in the Goodnews Bay mining district, Alaska. Bureau of Mines,Open-File Report 11–88, p. 25.
18 T. Oommen et al.