Embed Size (px)
Citation preview
Page 1 of51
GIS 1study industrial estates with water-dependent activities
&
public quay walls
Final report
Christine De Groef External transport expert COM department March 2020
1 Geographical Information Systems
page 2 of 51
Table of contents 1 INTRODUCTION ............................................................................................................................................... 7
1.1 Background .............................................................................................................................................. 7
1.1.1 Societal context ............................................................................................................................... 7
1.1.2 Industrial estates with water-dependent potential ........................................................................ 7
1.1.3 Public quay walls ............................................................................................................................. 8
1.1.4 Expected added value of this study ................................................................................................. 8
1.2 Scope ..................................................................................................................................................... 10
1.3 Reading guide ........................................................................................................................................ 10
2 METHODOLOGY ............................................................................................................................................. 11
2.1 Step 1: GIS analysis ................................................................................................................................ 11
2.1.1 Methodology for industrial estates situated along navigable waterways .................................... 11
2.1.2 Public quay walls methodology ..................................................................................................... 12
2.1.3 Advantages and limitations of this method .................................................................................. 12
2.2 Step 2: Assignment of tonnages ............................................................................................................ 13
2.2.1 Determination of future potential ................................................................................................. 14
2.3 Step 3: Visualisation .............................................................................................................................. 15
3 DISCUSSION ................................................................................................................................................... 16
3.1 Industrial estates with and without transhipment infrastructure ........................................................ 16
3.1.1 GIS analysis .................................................................................................................................... 16
3.1.2 Patterns in the geographic distribution of BTMO’s and BTZO’s .................................................... 21
3.1.3 Patterns in the size of the industrial estates ................................................................................. 23
3.1.4 Comments...................................................................................................................................... 25
3.2 Tonnages per industrial estate .............................................................................................................. 26
3.2.1 BTMO with tonnage = 0 ................................................................................................................. 28
3.2.2 Industrial estates with tonnage of up to 100,000 tonnes ............................................................. 30
3.2.3 Industrial estates with tonnage of 100,000 – 500,000 tonnes ...................................................... 33
3.2.4 Industrial estates with tonnage of 500,000 – 1,000,000 tonnes ................................................... 35
3.2.5 Industrial estates with tonnage > 1,000,000 tonnes ..................................................................... 36
3.2.6 Connection between surface area and tonnage ........................................................................... 36
3.2.7 Conclusion ..................................................................................................................................... 38
3.3 Public quay walls ................................................................................................................................... 38
4 Criteria of potential future estates – public quay walls ................................................................................ 43
4.1 Introduction ........................................................................................................................................... 43
4.2 Criteria for the selection of non-water-dependent estates .................................................................. 43
4.2.1 Surface area ................................................................................................................................... 43

page 3 of 51
4.2.2 Proximity to other BTMO’s ............................................................................................................ 44
4.2.3 Type of waterway .......................................................................................................................... 44
4.2.4 Regional land plan ......................................................................................................................... 44
4.2.5 Existing access ............................................................................................................................... 44
4.2.6 Responding to future spatial developments ................................................................................. 44
4.3 Optimisation of existing BTMO’s ........................................................................................................... 48
4.4 Criteria to determine additional public quay walls ............................................................................... 49
4.5 Determination of future tonnage potential .......................................................................................... 50
5 CONCLUSION ................................................................................................................................................. 51
page 4 of 51
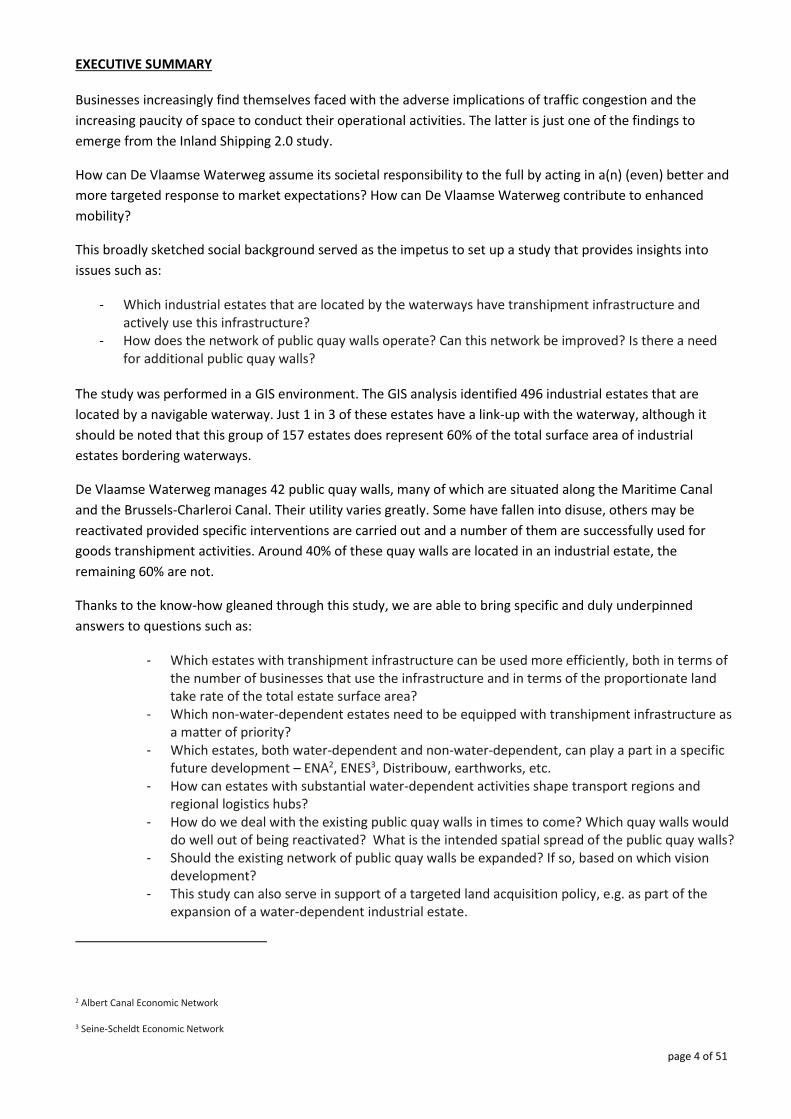
EXECUTIVE SUMMARY Businesses increasingly find themselves faced with the adverse implications of traffic congestion and the
increasing paucity of space to conduct their operational activities. The latter is just one of the findings to
emerge from the Inland Shipping 2.0 study.
How can De Vlaamse Waterweg assume its societal responsibility to the full by acting in a(n) (even) better and
more targeted response to market expectations? How can De Vlaamse Waterweg contribute to enhanced
mobility?
This broadly sketched social background served as the impetus to set up a study that provides insights into
issues such as:
- Which industrial estates that are located by the waterways have transhipment infrastructure and actively use this infrastructure?
- How does the network of public quay walls operate? Can this network be improved? Is there a need for additional public quay walls?
The study was performed in a GIS environment. The GIS analysis identified 496 industrial estates that are
located by a navigable waterway. Just 1 in 3 of these estates have a link-up with the waterway, although it
should be noted that this group of 157 estates does represent 60% of the total surface area of industrial
estates bordering waterways.
De Vlaamse Waterweg manages 42 public quay walls, many of which are situated along the Maritime Canal
and the Brussels-Charleroi Canal. Their utility varies greatly. Some have fallen into disuse, others may be
reactivated provided specific interventions are carried out and a number of them are successfully used for
goods transhipment activities. Around 40% of these quay walls are located in an industrial estate, the
remaining 60% are not.
Thanks to the know-how gleaned through this study, we are able to bring specific and duly underpinned
answers to questions such as:
- Which estates with transhipment infrastructure can be used more efficiently, both in terms of the number of businesses that use the infrastructure and in terms of the proportionate land take rate of the total estate surface area?
- Which non-water-dependent estates need to be equipped with transhipment infrastructure as a matter of priority?
- Which estates, both water-dependent and non-water-dependent, can play a part in a specific future development – ENA2, ENES3, Distribouw, earthworks, etc.
- How can estates with substantial water-dependent activities shape transport regions and regional logistics hubs?
- How do we deal with the existing public quay walls in times to come? Which quay walls would do well out of being reactivated? What is the intended spatial spread of the public quay walls?
- Should the existing network of public quay walls be expanded? If so, based on which vision development?
- This study can also serve in support of a targeted land acquisition policy, e.g. as part of the expansion of a water-dependent industrial estate.
2 Albert Canal Economic Network 3 Seine-Scheldt Economic Network
page 5 of 51
Many of the topics presented in this summary are also featured in the action plan of the Inland Shipping 2.0.
study for that matter:
- A_I.04: devising a widely supported vision and action plan at Flemish level for the relocation of businesses that have not yet taken to embracing the waterways as part of their operations, but which are located at water-dependent industrial estates;
- A_I.05: focusing on a higher uptake rate of under-used PPP and public quay walls; - A_I.08: the communication and operationalisation of the small inland waterways action plan; - A_BD.01: continued support for businesses to effectively take to using inland waterway
shipping by performing potential analyses for goods flows which could be useful for inland shipping;
- A_BD.02: updating the Masterplan 2020 for new/multimodal transhipment infrastructure and technology in Flanders.
As such, the present report can be used as a source to further flesh out the action plan set out in Inland
Shipping 2.0.
This study can also be used as input for European projects like IWTS 2.0 (Inland Waterways Transport
Solutions), a European Interreg project promoting inland navigation on a European scale.
Lastly, this study may prove to be of substantial added value for water-dependent projects and assignments,
especially when combined with studies or models such as Inland Shipping 2.0, Distribouw, earthworks, the
LAMBIT4model, Transport-Bis, etc.
4 Location Analysis Model for Belgian Intermodal Terminals, developed by the Vrije Universiteit Brussel
page 6 of 51
LIST OF ABBREVIATIONS BTMO: Industrial estates with transhipment infrastructure [Bedrijventerrein Met Overslaginfrastructuur] BTZO: Industrial estates without transhipment infrastructure [Bedrijventerrein Zonder Overslaginfrastructuur] CEMT- class: classification of waterways according to the European Conference of Transport Ministers 1992 DVW: Flemish Waterways plc (De Vlaamse Waterweg NV) ENA: Albert Canal Economic Network [Economisch Netwerk Albertkanaal] ENES: Seine-Scheldt Economic Network [Economisch Netwerk Seine-Schelde] FRISbi: Flanders RIS (River Information System) business intelligence GIS: Geographical Information Systems Lambit: Location Analysis Model for Belgian Intermodal Terminals MER: Environmental Effects Report [Milieu Effecten Rapport] MOBER: Mobility Effects Report [Mobiliteits Effecten Rapport] NSTR: Classification of goods – Uniform nomenclature of goods for transport statistics, revised RIS: River Information System ROC: Regional Transhipment Centre [Regionaal Overslag Centrum] TEU: Twenty Equivalent Unit VLAIO: Flanders Innovation & Entrepreneurship Agency [Vlaams Agentschap voor Innoveren en Ondernemen]
page 7 of 51
1 INTRODUCTION
1.1 Background
1.1.1 Societal context
The mobility issue is increasingly becoming a matter of prime concern. Traffic queue records are being broken
in increasingly quicker succession[...]. Traffic congestion has a suffocating impact on our economy. It casts a
shadow on our quality of life. A wide number of measures have been implemented to call a halt to congestion
and to improve the quality of the road environment. In spite of these efforts, congestion levels are continuing
to steadily rise.
Also, there is increasingly a view that there is a dire lack of space in Flanders, with the various actors vying for
space, including housing, work, open space, etc., showing little understanding for one another. It is becoming
an increasingly challenging to commit the scarce amount of space that is available for the objective pursued in
a way that is both smart and purposeful.
The Flemish world of trade and industry is not only grappling with local sore points such as mobility and the
lack of space, it also needs to be equipped to deal with a globalised economy. This is possible only if the
enabling conditions make it appealing to invest and do business in Flanders.
In this regard, De Vlaamse Waterweg must and should assume societal responsibility. First and foremost by
working towards a maximum uptake of the waterways as a means of transporting goods. This needs to be
associated with a duly considered and underpinned spatial policy. If the intention is to sustainably embed the
presence of trade and industry in Flanders, we will need to offer quality estates that also allow for water-
dependent activities to develop without obstacles being put in the way. So as not to needlessly take up the
scarce open space, an economic and optimised use of the available space is advisable more than ever (cfr.
Actiepunt A_I.04 van Binnenvaart 2.0).
1.1.2 Industrial estates with water-dependent potential
Bearing in mind this societal framework limned in broad outlines, the Commercial Management department at
De Vlaamse Waterweg has a concrete need for insights into water-dependent activities in the world of trade
and industry. These insights manifest themselves in queries such as:
- which industrial estates are located by navigable waterways? - which of these industrial estates have a link-up with the waterway? - which of these industrial estates actively use this link-up; i.e. effect transhipment tonnages?
As the insights sought involve both a quantitative and a spatial component, this study was conducted using a
GIS application.
In addition to obtaining insights into the existing water-dependent offering (both estates and transhipment
infrastructure), in a second step, these research efforts may be used to take a duly underpinned approach to
page 8 of 51
industrial estates that either make no or only limited use of the link-up infrastructure that is in place, or that
do not yet have a water-dependent link-up. In doing so, extra goods flows could be lured to the waterways.
1.1.3 Public quay walls
Independently of the above, on the initiative of a working group on quay walls (of the former Waterwegen en
Zeekanaal NV) it was proposed to chart the potential of the existing public quay walls. This question was
prompted by the fact that the unbridled addition of quay walls to the existing infrastructure is neither
financially nor spatially desirable, despite the fact that a PPP arrangement exists for the construction of
loading and unloading facilities.
After all, it would be no more than logical to first ask oneself whether the existing infrastructure can be used
to more efficient effect before considering additional infrastructure. To do so, two avenues are open to us that
are worth exploring.
The first of which is to encourage the shared use of private quays, even though this option is feasible only if
the businesses concerned are prepared to get behind the idea, and where it is practically achievable to ensure
the smooth-paced mutual alignment of the goods flows and logistical operations of both parties. This option
may be accomplished by way of financial incentives, or by assigning comparatively greater weight to the
tonnages of third parties in the assessment of the total tonnage commitment5, for instance.
The second avenue is to encourage the use of public quays. Public quays are loading and unloading
installations available to by private companies for transshipment purposes under the terms of an agreement
or a licence. To date, the emphasis in putting in place the transhipment infrastructure particularly rested with
the construction of quay walls as part of the PPP arrangement. However, public quay walls may act as a
worthy alternative, especially for businesses who do not wish to use the waterways quite that intensively.
To map out the potentials of the public quay walls, we also used the GIS application referenced above.
1.1.4 Expected added value of this study
The underlying core philosophy of this study is the societal role of the waterway manager in the use of space,
mobility, and the economic cementation that follows on from this. How do we acting in (even) better and
more targeted response to demand from the market? How do we suitably act in anticipation of future
developments? How do we contribute to enhanced mobility?
From this angle, this study is expected to deliver the following added value:
1) Inventory of estates with water-dependent potential, in terms of: o numbers; o locations;
5 In the event the company is bound by a tonnage commitment as part of a concession agreement or a PPP arrangement
page 9 of 51
o surface areas; o transhipment tonnages;
which will enable us to bring answers with full knowledge of the facts to queries such as:
To what extend does this existing offering of water-dependent infrastructure meet the requirements of future spatial developments?
Which non-water-dependent estates can be committed to meet future developments such as ENA, ENES, Distribouw, etc.?
Which water-dependent estates can be used to more optimum effect by way of targeted schemes such as estate compaction, more intensive use of the transhipment infrastructure, attracting new water-dependent activities, etc.
Are there opportunities to increase access to the waterways for second and third-line water-dependent businesses through shared use?
2) Inventory of public quay walls, in terms of: o numbers; o locations; o transhipment tonnages;
which will enable us to bring answers with full knowledge of the facts to queries such as:
Which public quay walls can be used to more optimum effect by nearby businesses? Is there a need for extra public quay walls? If so, where? How can public quay walls raise accessibility to the waterways for second and third-line water-
dependent businesses?
3) Based on the existing water-dependent industrial estates, which criteria enable us to select non-water-dependent estates which, in our view, merit priority action for a water-dependent link-up? Examples include the size of the industrial estates, the type of waterway where these estates are situated, the location, the designated purpose in the regional land use plan, etc.
4) This study can also offer scope to support a targeted land acquisition policy, e.g. as part of the expansion of water-dependent industrial estates.
5) Linkage with other studies, with a view to the creation of synergies. The first and foremost includes the action plan of Inland Shipping 2.0 , as well as the Mineral Resources study, and the LAMBIT6model devised by MOBI7. This study could also serve to highlight the role of inland water transport in the context of transport regions and regional logistics hubs.
6) In parallel therewith, results of this GIS-study can also be serviceably used in as part of MERs8 and MOBERs9, for which key data are required to determine and assess the impact of the cargo traffic.
6 Location Analysis Model for Belgian Intermodal Terminals 7 Mobility, Logistics and Automotive Technology Research Centre (VUB) 8 Environmental Impact Assessment Report 9 Mobility Impact Assessment Reports

page 10 of 51
1.2 Scope
The present study covers two topics.
The first topic deals with the industrial estates located by a navigable waterway. The idea is to determine for
these estates which of them have a waterway link-up. The industrial estates that have a water-dependent link-
up are to be assigned a transhipment tonnage. For the industrial estates that do not have a waterway link-up,
criteria are being examined which can help us to establish how these estates may contribute to water-
dependent developments.
The second topic dilates on the public quays, whereby an inventory is compiled of the existing public quays
and their annual transhipment tonnage. Based on this information, and combined with the data obtained via
the “industrial estates with water-dependent link-up” topic, criteria are explored which may help to determine
how the network of public quays may be optimised.
The reason why these two seemingly different topics, i.e. industrial estates with water-dependent link-up and
public quay walls are dealt with in one and the same study, is twofold. To begin with, the same GIS
environment and source data are used for both topics, and the industrial estates and the public quays alike are
assigned a transhipment tonnage. Alongside one and the same study environment, this approach also comes
with a substantive added value, in that water-dependent industrial estates and public quays can be mutually
complementary and reinforce each other in working up a diversified offering of water-dependent potentials.
By way of an example, in case of a lack of water-dependent industrial estates in a given region, building public
quay can bring genuine added value in terms of the local mobility as well as serving local businesses.
1.3 Reading guide
The next chapter (2) sets out the methodology and the GIS application for the industrial estates as well as the
public quays. This is followed by a discussion of the results (chapter 3). Chapter four dilates on the criteria that
may be used in the approach to non-water-dependent industrial estates and the optimisation of the public
quay walls, after which the report is brought to a close with a conclusion (chapter 5).
This study is based on figures from 2018.
page 11 of 51
2 METHODOLOGY
The present study adopts a three-step approach:
Step 1: the performance of a GIS analysis in order to identify the industrial estates which do or do not have
transhipment infrastructure, as well as the public quays;
Step 2: the assignment of transhipment tonnages to industrial estates with transhipment infrastructure and
the public quays;
Step 3: visualisation of the results;
Step 4: discussion of criteria to establish:
- for which industrial estates without transhipment infrastructure a future water-dependent link-up delivers added value;
- the optimisation of the network of public quays.
This chapter discusses steps 1, 2 and 3. The fourth step is reviewed in chapter 4.
2.1 Step 1: GIS analysis
2.1.1 Methodology for industrial estates situated along navigable waterways
A GIS environment not only enables us to visualise data with a spatial component, but also allows for analyses
in which different map layers interact.
For the present study, the open source GIS software suite Q-GIS is used.
The following map layers are used:
- GRB (Large-scale Reference File): topographical background map (2018); - industrial estates (source: VLAIO - Vlaams Agentschap voor Innoveren en Ondernemen [Flanders
Innovation & Entrepreneurship Agency], 2018); These are the estates (earmarked according to regional plans, Special Zoning Plan - BPAs, and Spatial Implementation Plans - RUPs) as they actually exist.
- Flemish waterways from the VISURIS GDB file (2018); - Terminals (source: Vlaamse Waterweg 2018).
Please note: the sea port area is located outside of the operating territory of De Vlaamse Waterweg NV and is
not included in this study.
The following algorithm is used to ascertain which industrial estates are or are not linked to a waterway:
1) Selection of all industrial estates situated within a 2 km radius of a navigable waterway. These estates are not necessarily water-dependent, but these estates can be assumed to have a certain connection to, or affinity with, the waterway.
page 12 of 51
These estates can for example be used in the follow-up process to develop third-line water-dependent activities.
2) Selection of all industrial estates of (1) adjacent to a navigable waterway. It can be assumed that these estates have the potential for a water-dependent link-up A distance of 150m was used as a criterion. This distance was empirically determined and takes into account the fact that the GIS data of a waterway is a line representing the fairway. Too small a distance will therefore overlook estates adjacent to waterways in those higher CEMT categories, particularly when it comes to tidal rivers such as the Zeeschelde.
3) Selection of all industrial estates of (2) with direct access to a quay wall. A search radius of 50 m was set for
this purpose. All estates within a search radius of 50m of a quay wall are selected. These estates are given the “with transhipment infrastructure” label in the study (BTMO).
This 50m radius was empirically determined. Too small a search radius overlooks industrial estates that are separated from the quay wall by a road or a wide grass verge. If the search radius is too big there is a risk that a quay wall located on the opposite bank of a small waterway will be erroneously assigned to the industrial estate.
4) Selection of all industrial estates of (2) adjacent to a navigable waterway but without direct access to a quay wall. The same search radius of 50m from step 3 was used here. These estates are given the “without transhipment infrastructure” label in the study (BTZO).
5) For the industrial estates without transhipment infrastructure (4) a final step can be used to determine which spatial planning has been assigned to them by the regional land use plan. The zoning of the regional land use plan can be used as a criterion in the prioritisation of the estates that are to be given a waterway link-up in the future. This aspect will only be discussed in the follow-up process (chapter 4).
2.1.2 Public quay walls methodology
The attribute table of the map layer of the terminals contains the attribute “function”, which describes the
type of quay wall (bulk, container, public). This attribute can be used to distinguish public quay walls from
others.
2.1.3 Advantages and limitations of this method
A GIS analysis enables the uniform application of the desired analysis to a large quantity of spatial data, and
the combination of data from different (map) files. Moreover, the results can be displayed in both map form
and in table form.
Manual corrections and adjustments were however required. For example, it appears that some transhipment
infrastructure such as pipelines or suction systems, sometimes located far inland, fall outside the 50m search
radius of an industrial estate, from which it could be deduced that the estate is non-water-dependent. This is
also possible if a wide road or verge (>50m) has been built between the quay and the estate.
Some industrial estates functionally form one contiguous area, although they are separated from each other
administratively by a different numbering. They are therefore regarded as separate spatial objects in the GIS
analysis, which may result in one estate being labelled as having transhipment infrastructure and the
neighbouring estate as not having transhipment infrastructure, even though they functionally form a single
page 13 of 51
entity. Therefore, the interpretation of the results requires a certain level of pragmatism, as well as an
additional field visit in order to avoid drawing premature conclusions.
The map layer with the industrial estates contains all the plots in the regional land plan, the Special Zoning
Plan and the spatial implementation plans with an economic use, regardless of the subdivision into industrial
estate, regional industrial estate, retail area, etc.) It is therefore possible that industrial estates located along
the waterway are selected in this study, but are not eligible for water-dependent activities.
An industrial estate is assigned the label “BTMO” (Industrial Estate with Transhipment Infrastructure) once
transhipment infrastructure is detected within a search radius of 50m. This study does not however take into
account the functional use of the industrial estate, i.e. the proportion of businesses present there that actually
use this infrastructure. It is therefore possible that only one of the companies present effectively makes use of
inland navigation.
This study also does not allow any pronouncements on second- or third-line water-dependency, because we
do not know, respectively, how an estate is used and who is still making use of the transhipment infrastructure
in addition to the companies on that estate.
The map layer displaying the terminals contains neither technical information about the quay wall (length,
surface, type, etc.), nor information about the condition of the quay wall.
Finally, generally speaking, the quality of the results obviously depends to a large extent on the accuracy and
correctness of the source files.
2.2 Step 2: Assignment of tonnages
Upon identification of the water-dependent estates (BTMO’s) a transhipment tonnage is assigned to each of
these estates that make active use of the transhipment infrastructure. To this end, use is predominantly made
of FRISbi, which stands for Flanders RIS (River Information System) business intelligence. This DVW tool for
traffic figures was launched in 2019 and allows, among other things, information to be obtained on loading
and unloading activities at three different levels (fairway - sailing segment - quay wall). A navigation segment is
essentially a piece of a waterway. Segments are defined and numbered in the RIS. One segment may contain
one, multiple or no quay walls.
Traffic figures for 2018 were used. The tonnages were assigned on the basis of the navigation segment where
possible. If this turned out to be impossible (e.g. in the case of multiple estates on a navigation segment), a
greater level of detail (quay walls) was added.
The assignment of tonnages had to be done manually, given that there is rarely an unambiguous
correspondence between industrial estate and segment. For example, some segments contain several estates,
while some very large industrial estates extend over multiple segments.
This tool uses data collected by the RIS. It is important to note that the RIS does not currently record
transhipment activities in fairway stretches that do not pass through a lock. This explains why tonnages could
not be assigned to estates located on the Lower Zeeschelde (municipalities of Schelle, Kruibeke, Hemiksem,
Hoboken, Zwijndrecht). There may also be estates, more specifically along the Upper Zeeschelde) where the
tonnage has been underestimated as a result of this (e.g. Briel te Baasrode estate).
page 14 of 51
For verification purposes, these data were compared to tonnages reported by companies to DVW in the context of concessions, PPS quay walls or support measures.
This study makes no distinction at product level (NSTR10 codes).
Here, too, the algorithm does not allow any pronouncements on second- and third-line water-dependency.
The transhipment values were manually added to the GIS attribution table of the industrial estates with
transhipment infrastructure. Although there is a large variation of transhipment values, ranging from 0 to
almost 4 million tonnes, it was deliberately chosen to display these in only five categories:
- Category 1: 0 - Category 2: 1,000 to 100,000 tonnes - Category 3: 100,001 – 500,000 tonnes - Category 4: 500,001 – 1,000,000 tonnes - Category 5: 1,000,001 – 3,800,000 tonnes
There are various reasons for this:
- Excessively detailed tonnage information could be interpreted as a breach of confidentiality. - The transhipment values were determined on the basis of 2018 data. Tonnages are however
subject to macro- and micro-economic fluctuations and evolutions. These tonnages can therefore be regarded as a snapshot. While using a longer time period may provide a more reliable picture, it proved too time-consuming at this stage of the study. A longer time period would offer added value, provided that this process can be automated.
- Most companies express their transhipment activity in tonnes. Some use m³ and container terminals use TEU’s11. Others use project cargo (transport of large indivisible pieces). This complicates interpretation of the data, particularly as FRISbi does not allow these nuances to be taken into account. Everything was therefore expressed in tonnes12.
- The RIS13 only records cargo that passes through locks. Transhipment values for industrial estates located on, for example, the Zeeschelde and which are supplied by the port of Antwerp, are therefore not recorded (unless a certain tonnage has been declared as part of the concession).
- The accuracy of the transhipment values depends to a large extent on the accuracy of the basic data entered. These proved to not always be reliable (errors or inaccuracies in the assignment of cargo to a segment, etc.)
- Finally, unambiguously assigning a segment tonnage to an estate proved to be impossible.
FRISbi was also used to assign tonnages to public quays. This was easy, given that the tool allows for the retrieval of information at quay wall level for a given segment.
2.2.1 Determination of future potential
It is important to note that at this stage of the GIS study this concerns the assignment of realised tonnages and not potential or future tonnages. In order to be able to make an estimation of future tonnage potential or the
10Classification of goods – Uniform nomenclature of goods for transport statistics, revised 11 Twenty Equivalent Unit 12 For the containers, the tonnage was approximated by multiplying the number of containers by 25 tonnes (= net cargo) and then dividing it by two (full + empty). 13 River Information Systems

page 15 of 51
tonnage potential of a non water-dependent estate, a combination of different sources appears to be most appropriate; the extrapolation of the data from this study is an example of this. We will return to this in chapter 4.5.
2.3 Step 3: Visualisation
The GIS tool enables the spatial and tabular visualisation of the results, in both analogue and digital form (via Intranet GIS).
page 16 of 51
3 DISCUSSION
3.1 Industrial estates with and without transhipment infrastructure
3.1.1 GIS analysis
All the steps of the algorithm are reviewed and illustrated here with the map layers used.
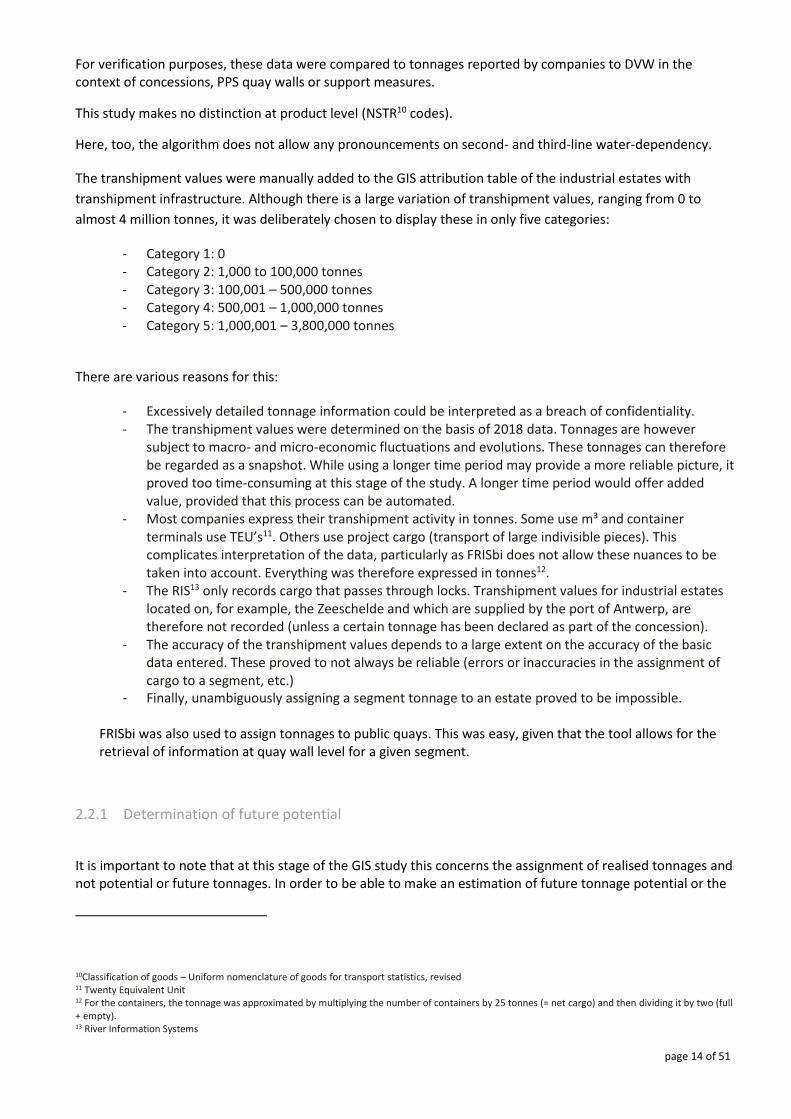
Vlaamse Vaarwegen
Figure1: Vlaamse vaarwegen [Flemish waterways]
page 17 of 51
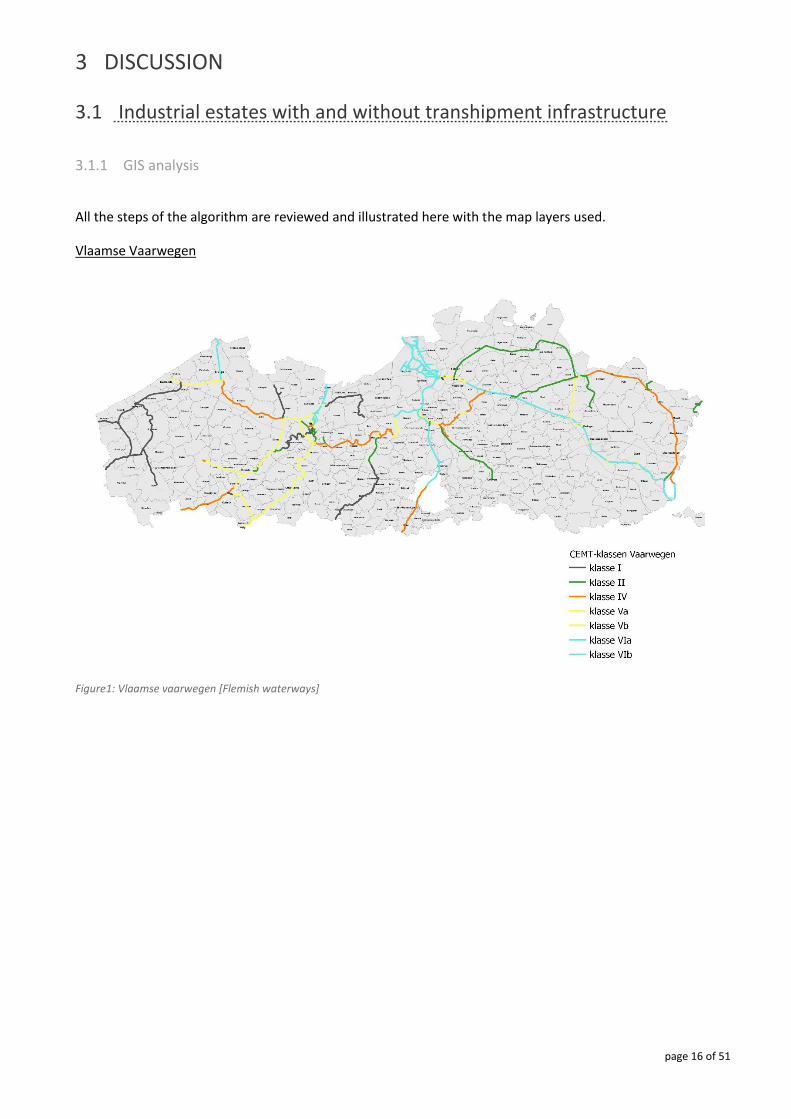
Flanders industrial estates
Figure2: Industrial estates in Flanders (outlined in blue)
According to VLAIO, Flanders has a total of 6,012 industrial estates14, with a total surface area of 66,107ha. The
average surface area per estate is approx. 11ha. The port areas are by far the largest estates.
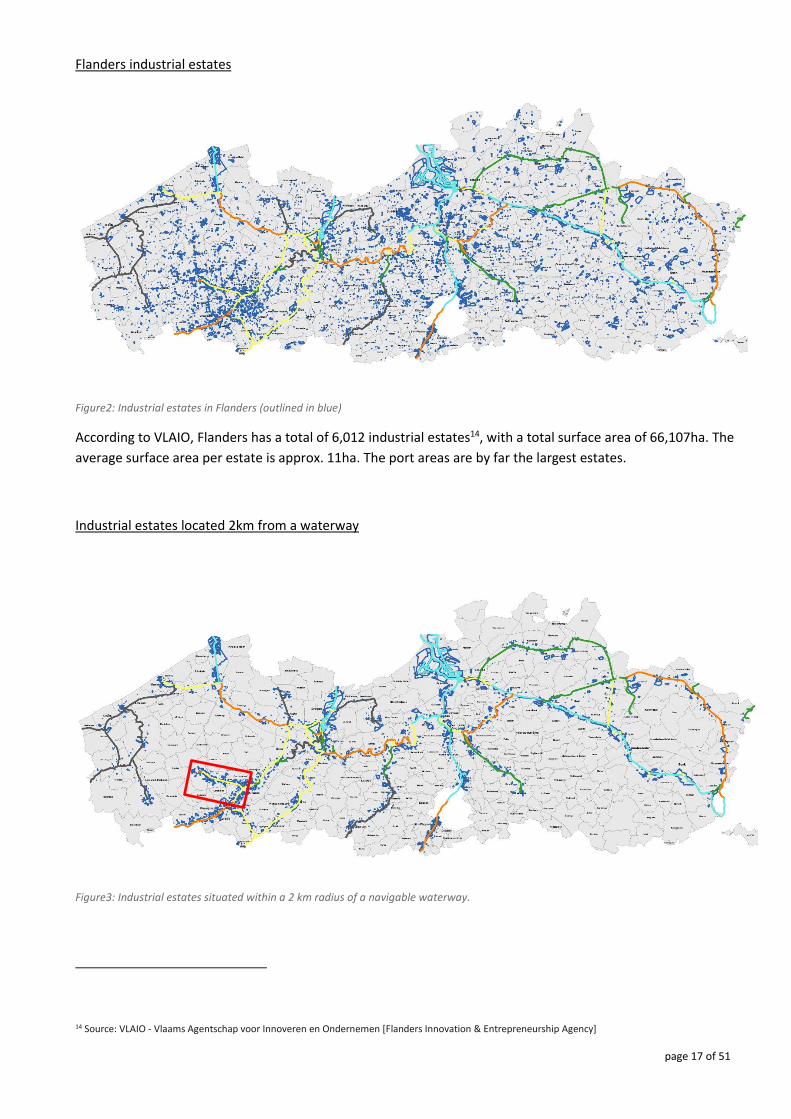
Industrial estates located 2km from a waterway
Figure3: Industrial estates situated within a 2 km radius of a navigable waterway.
14 Source: VLAIO - Vlaams Agentschap voor Innoveren en Ondernemen [Flanders Innovation & Entrepreneurship Agency]
page 18 of 51
A total of 2,255 estates were selected. The total surface area of these estates is 45,000ha. The average surface
area per estate is approx. 20ha.
We can deduce from this that a considerable part of Flemish industrial estate surface area is located near a
waterway: 37.5% of the number of estates and no less than 68% in surface area.
In order to make the following steps as clear as possible, each step is illustrated with an excerpt of the map
above (the excerpt corresponds to the red rectangle).
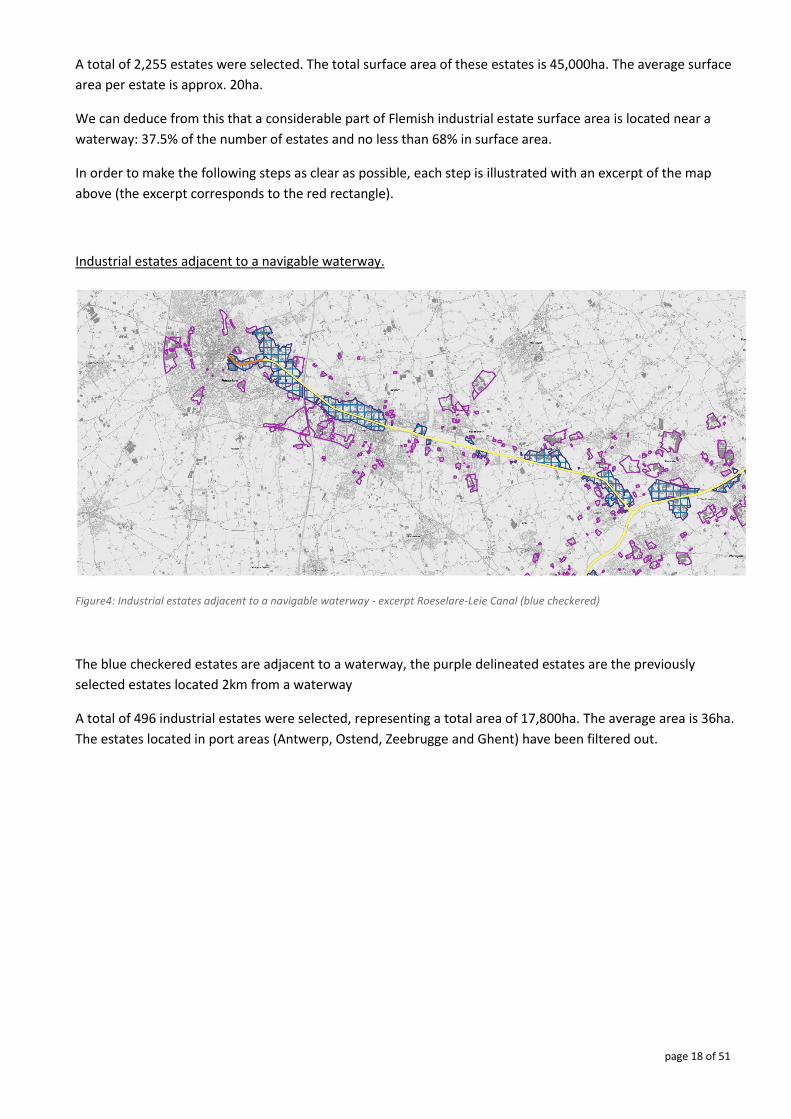
Industrial estates adjacent to a navigable waterway.
Figure4: Industrial estates adjacent to a navigable waterway - excerpt Roeselare-Leie Canal (blue checkered)
The blue checkered estates are adjacent to a waterway, the purple delineated estates are the previously
selected estates located 2km from a waterway
A total of 496 industrial estates were selected, representing a total area of 17,800ha. The average area is 36ha.
The estates located in port areas (Antwerp, Ostend, Zeebrugge and Ghent) have been filtered out.
page 19 of 51
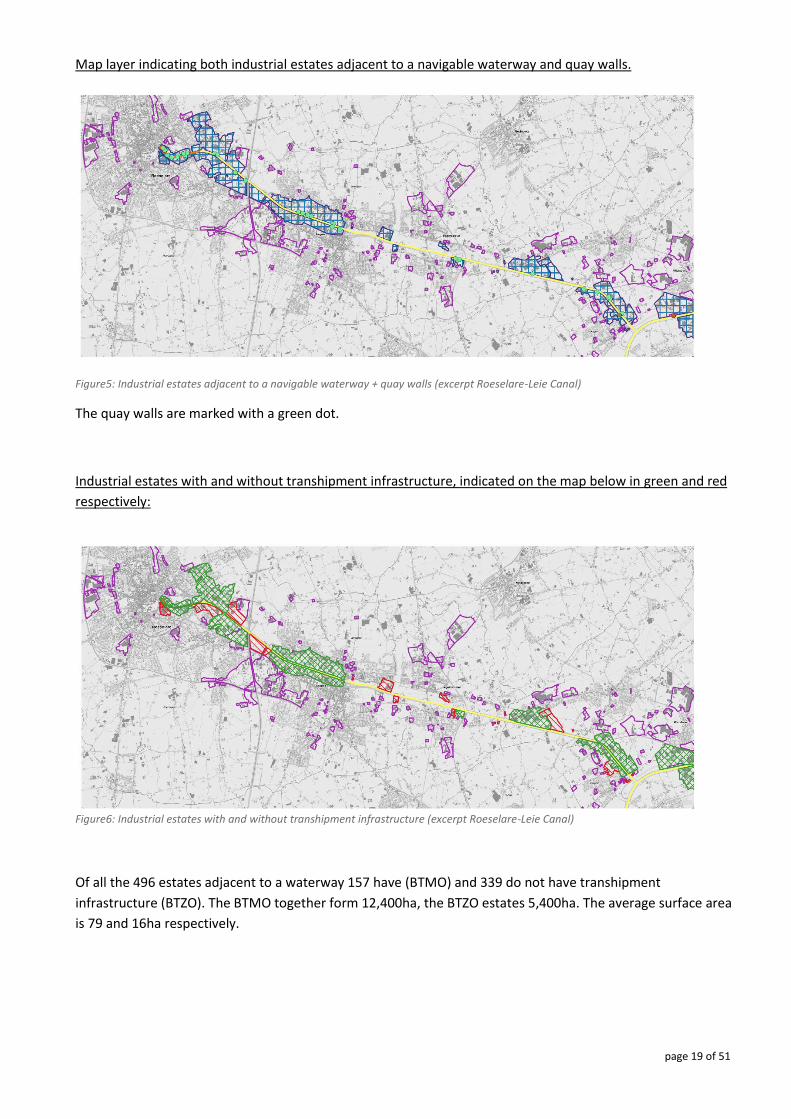
Map layer indicating both industrial estates adjacent to a navigable waterway and quay walls.
Figure5: Industrial estates adjacent to a navigable waterway + quay walls (excerpt Roeselare-Leie Canal)
The quay walls are marked with a green dot.
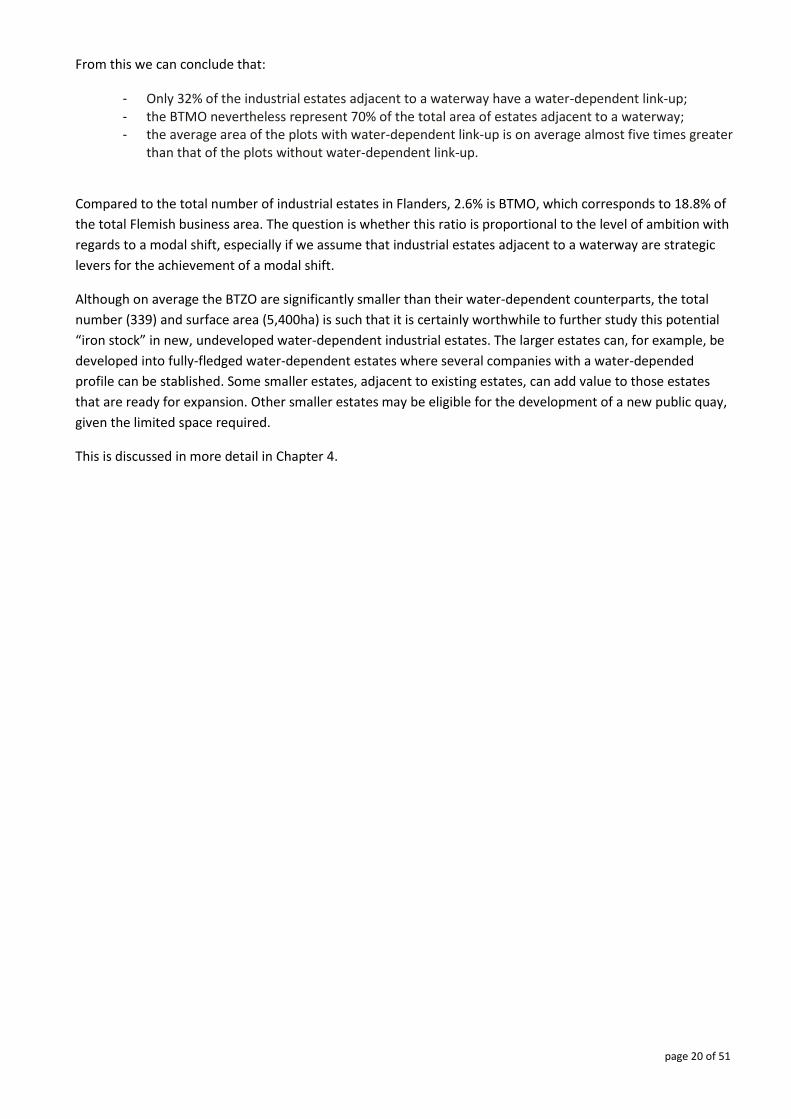
Industrial estates with and without transhipment infrastructure, indicated on the map below in green and red
respectively:
Figure6: Industrial estates with and without transhipment infrastructure (excerpt Roeselare-Leie Canal)
Of all the 496 estates adjacent to a waterway 157 have (BTMO) and 339 do not have transhipment
infrastructure (BTZO). The BTMO together form 12,400ha, the BTZO estates 5,400ha. The average surface area
is 79 and 16ha respectively.
page 20 of 51
From this we can conclude that:
- Only 32% of the industrial estates adjacent to a waterway have a water-dependent link-up; - the BTMO nevertheless represent 70% of the total area of estates adjacent to a waterway; - the average area of the plots with water-dependent link-up is on average almost five times greater
than that of the plots without water-dependent link-up.
Compared to the total number of industrial estates in Flanders, 2.6% is BTMO, which corresponds to 18.8% of
the total Flemish business area. The question is whether this ratio is proportional to the level of ambition with
regards to a modal shift, especially if we assume that industrial estates adjacent to a waterway are strategic
levers for the achievement of a modal shift.
Although on average the BTZO are significantly smaller than their water-dependent counterparts, the total
number (339) and surface area (5,400ha) is such that it is certainly worthwhile to further study this potential
“iron stock” in new, undeveloped water-dependent industrial estates. The larger estates can, for example, be
developed into fully-fledged water-dependent estates where several companies with a water-depended
profile can be stablished. Some smaller estates, adjacent to existing estates, can add value to those estates
that are ready for expansion. Other smaller estates may be eligible for the development of a new public quay,
given the limited space required.
This is discussed in more detail in Chapter 4.
page 21 of 51
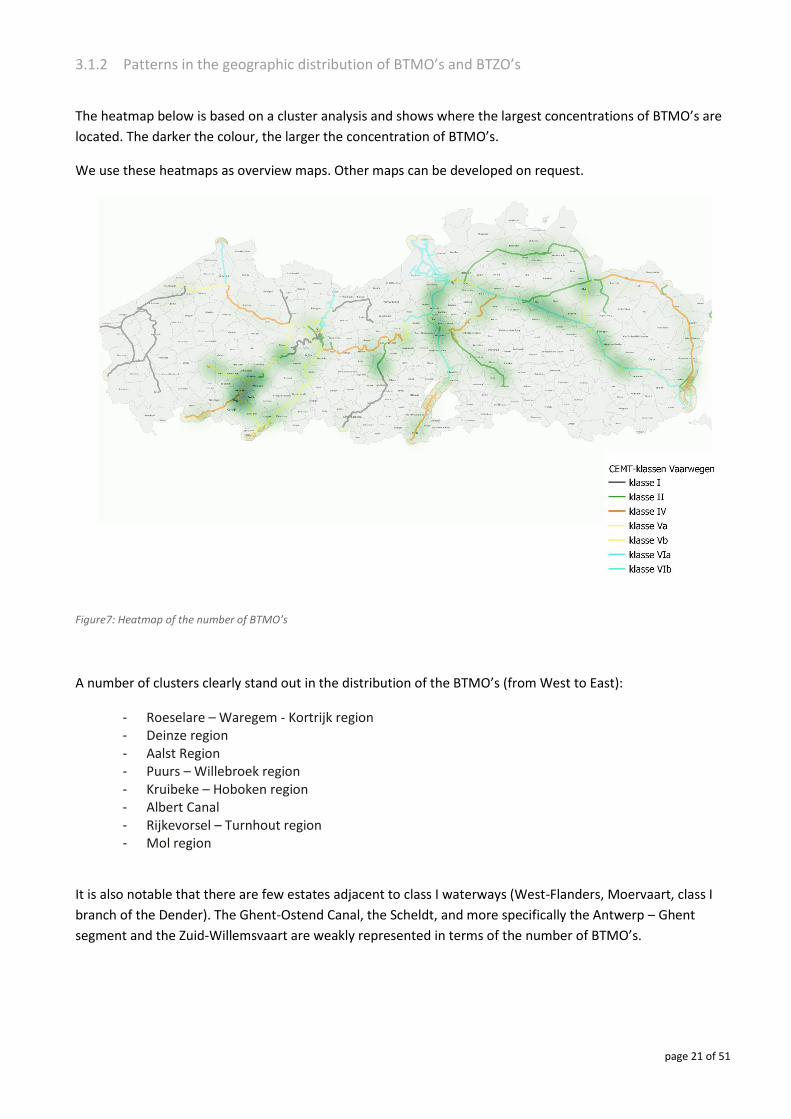
3.1.2 Patterns in the geographic distribution of BTMO’s and BTZO’s
The heatmap below is based on a cluster analysis and shows where the largest concentrations of BTMO’s are
located. The darker the colour, the larger the concentration of BTMO’s.
We use these heatmaps as overview maps. Other maps can be developed on request.
Figure7: Heatmap of the number of BTMO’s
A number of clusters clearly stand out in the distribution of the BTMO’s (from West to East):
- Roeselare – Waregem - Kortrijk region - Deinze region - Aalst Region - Puurs – Willebroek region - Kruibeke – Hoboken region - Albert Canal - Rijkevorsel – Turnhout region - Mol region
It is also notable that there are few estates adjacent to class I waterways (West-Flanders, Moervaart, class I
branch of the Dender). The Ghent-Ostend Canal, the Scheldt, and more specifically the Antwerp – Ghent
segment and the Zuid-Willemsvaart are weakly represented in terms of the number of BTMO’s.
page 22 of 51
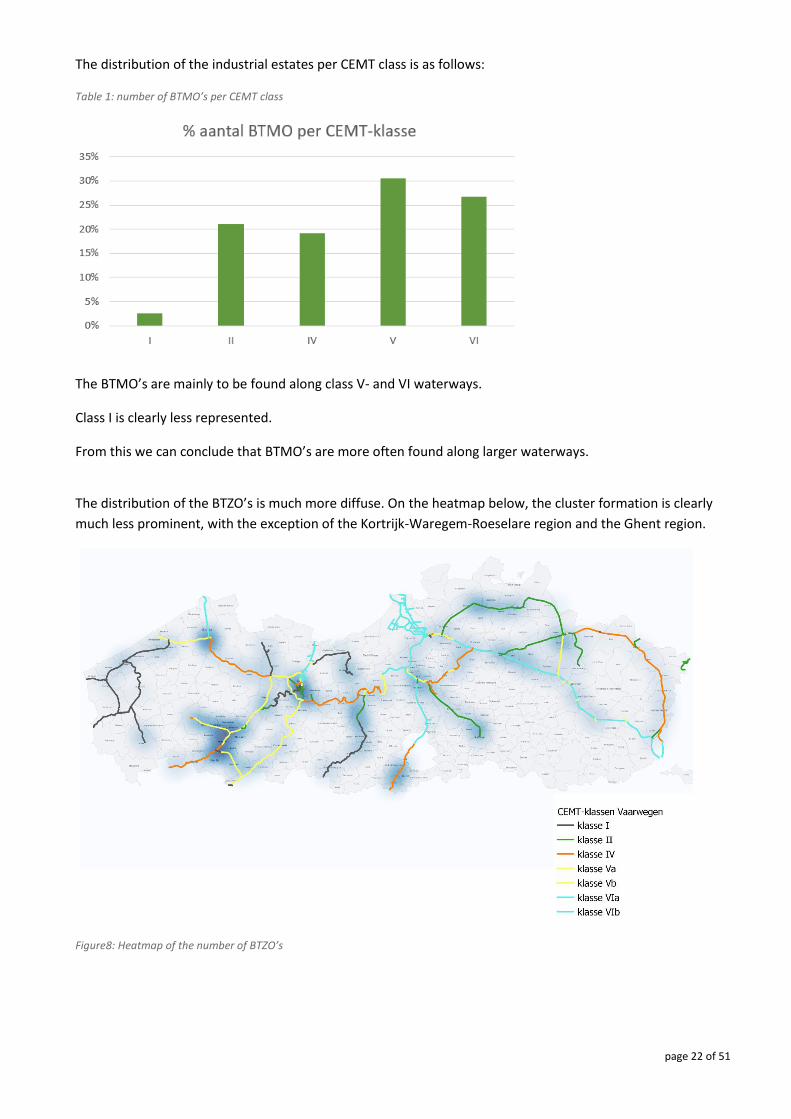
The distribution of the industrial estates per CEMT class is as follows:
Table 1: number of BTMO’s per CEMT class
The BTMO’s are mainly to be found along class V- and VI waterways.
Class I is clearly less represented.
From this we can conclude that BTMO’s are more often found along larger waterways.
The distribution of the BTZO’s is much more diffuse. On the heatmap below, the cluster formation is clearly
much less prominent, with the exception of the Kortrijk-Waregem-Roeselare region and the Ghent region.
Figure8: Heatmap of the number of BTZO’s
page 23 of 51
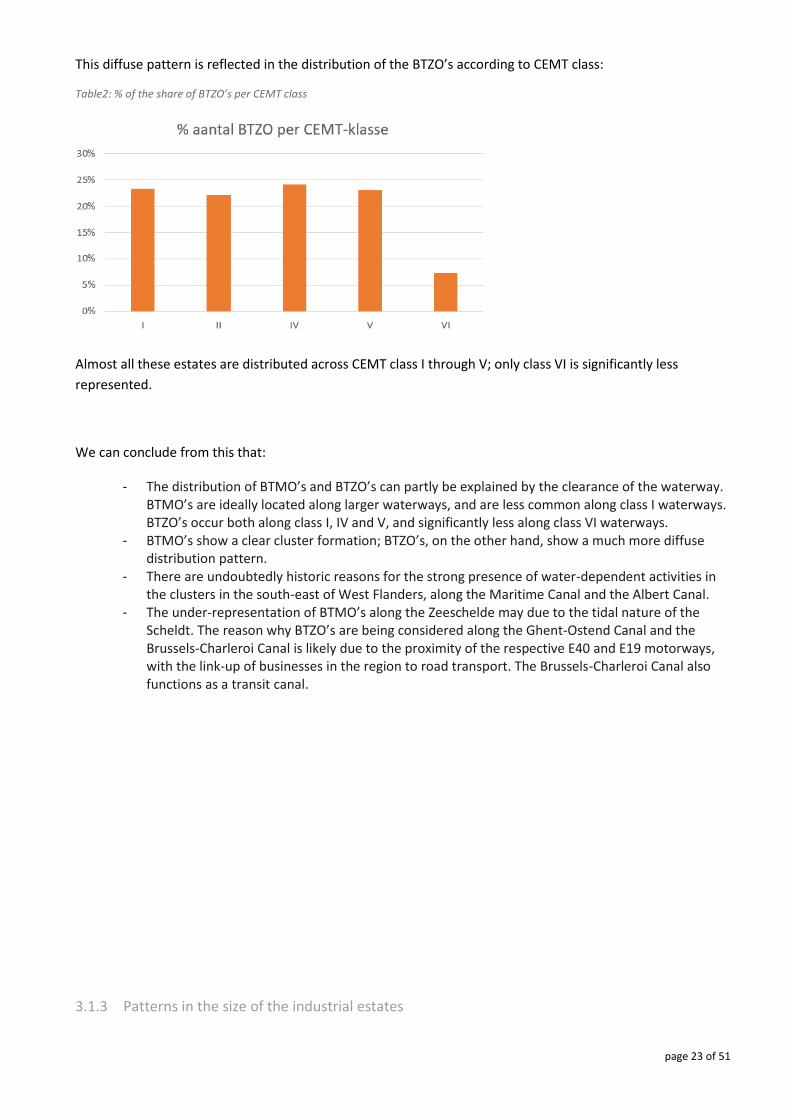
This diffuse pattern is reflected in the distribution of the BTZO’s according to CEMT class:
Table2: % of the share of BTZO’s per CEMT class
Almost all these estates are distributed across CEMT class I through V; only class VI is significantly less
represented.
We can conclude from this that:
- The distribution of BTMO’s and BTZO’s can partly be explained by the clearance of the waterway. BTMO’s are ideally located along larger waterways, and are less common along class I waterways. BTZO’s occur both along class I, IV and V, and significantly less along class VI waterways.
- BTMO’s show a clear cluster formation; BTZO’s, on the other hand, show a much more diffuse distribution pattern.
- There are undoubtedly historic reasons for the strong presence of water-dependent activities in the clusters in the south-east of West Flanders, along the Maritime Canal and the Albert Canal.
- The under-representation of BTMO’s along the Zeeschelde may due to the tidal nature of the Scheldt. The reason why BTZO’s are being considered along the Ghent-Ostend Canal and the Brussels-Charleroi Canal is likely due to the proximity of the respective E40 and E19 motorways, with the link-up of businesses in the region to road transport. The Brussels-Charleroi Canal also functions as a transit canal.
3.1.3 Patterns in the size of the industrial estates
page 24 of 51
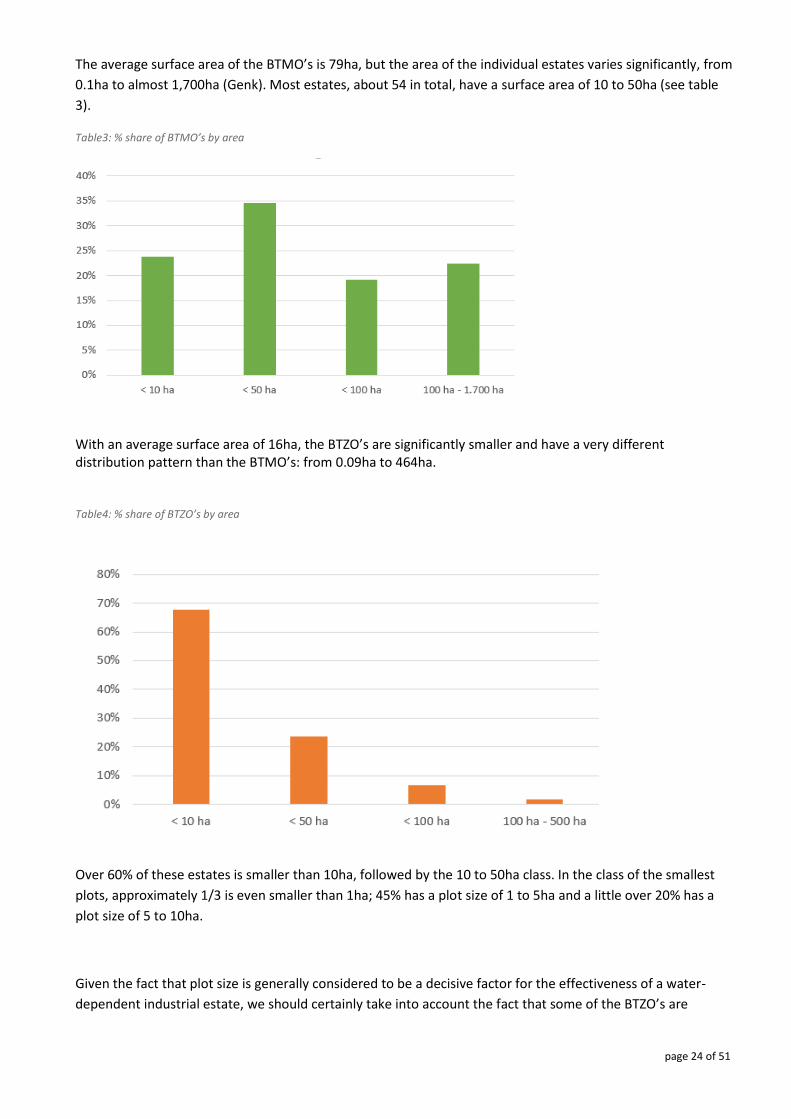
The average surface area of the BTMO’s is 79ha, but the area of the individual estates varies significantly, from
0.1ha to almost 1,700ha (Genk). Most estates, about 54 in total, have a surface area of 10 to 50ha (see table
3).
Table3: % share of BTMO’s by area
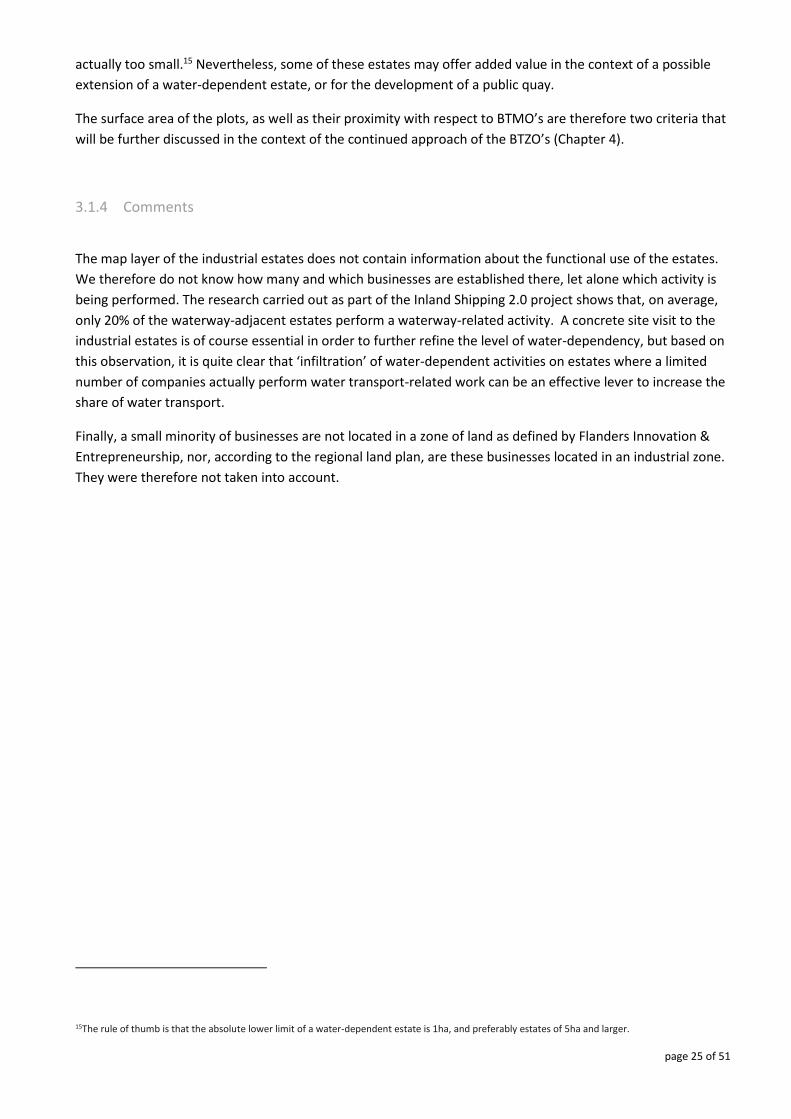
With an average surface area of 16ha, the BTZO’s are significantly smaller and have a very different distribution pattern than the BTMO’s: from 0.09ha to 464ha. Table4: % share of BTZO’s by area
Over 60% of these estates is smaller than 10ha, followed by the 10 to 50ha class. In the class of the smallest
plots, approximately 1/3 is even smaller than 1ha; 45% has a plot size of 1 to 5ha and a little over 20% has a
plot size of 5 to 10ha.
Given the fact that plot size is generally considered to be a decisive factor for the effectiveness of a water-
dependent industrial estate, we should certainly take into account the fact that some of the BTZO’s are
page 25 of 51
actually too small.15 Nevertheless, some of these estates may offer added value in the context of a possible
extension of a water-dependent estate, or for the development of a public quay.
The surface area of the plots, as well as their proximity with respect to BTMO’s are therefore two criteria that
will be further discussed in the context of the continued approach of the BTZO’s (Chapter 4).
3.1.4 Comments
The map layer of the industrial estates does not contain information about the functional use of the estates.
We therefore do not know how many and which businesses are established there, let alone which activity is
being performed. The research carried out as part of the Inland Shipping 2.0 project shows that, on average,
only 20% of the waterway-adjacent estates perform a waterway-related activity. A concrete site visit to the
industrial estates is of course essential in order to further refine the level of water-dependency, but based on
this observation, it is quite clear that ‘infiltration’ of water-dependent activities on estates where a limited
number of companies actually perform water transport-related work can be an effective lever to increase the
share of water transport.
Finally, a small minority of businesses are not located in a zone of land as defined by Flanders Innovation &
Entrepreneurship, nor, according to the regional land plan, are these businesses located in an industrial zone.
They were therefore not taken into account.
15The rule of thumb is that the absolute lower limit of a water-dependent estate is 1ha, and preferably estates of 5ha and larger.
page 26 of 51
3.2 Tonnages per industrial estate
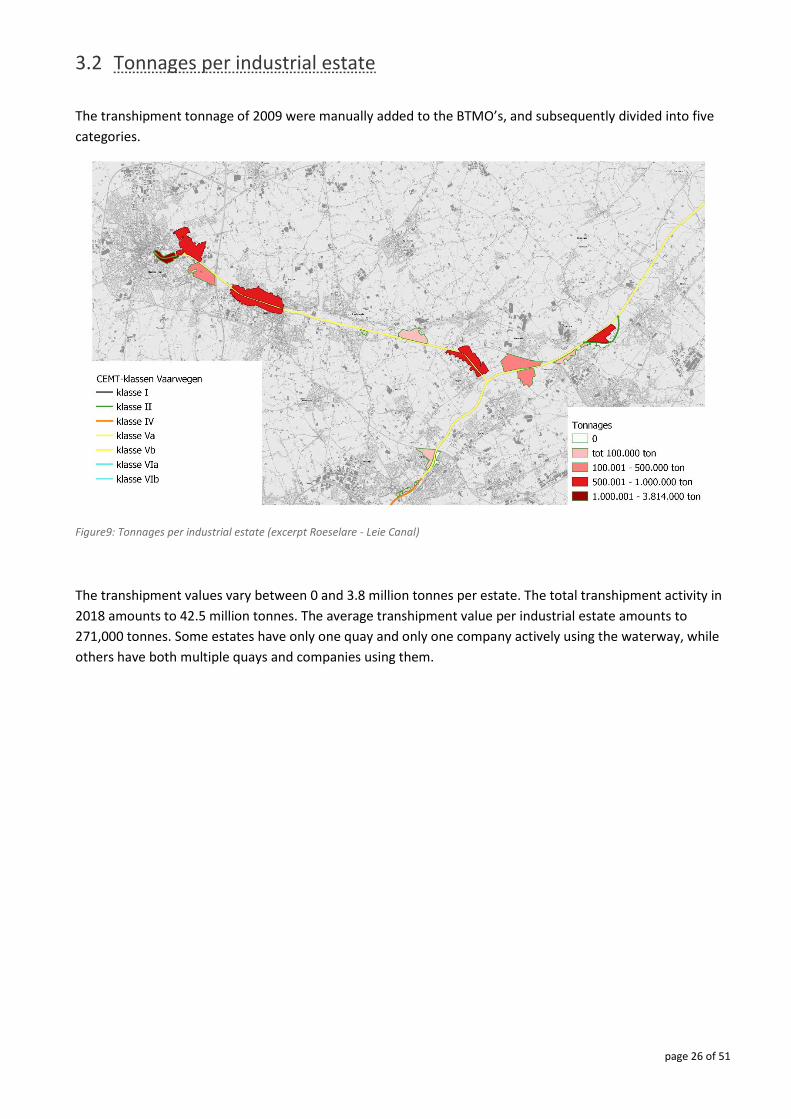
The transhipment tonnage of 2009 were manually added to the BTMO’s, and subsequently divided into five
categories.
Figure9: Tonnages per industrial estate (excerpt Roeselare - Leie Canal)
The transhipment values vary between 0 and 3.8 million tonnes per estate. The total transhipment activity in
2018 amounts to 42.5 million tonnes. The average transhipment value per industrial estate amounts to
271,000 tonnes. Some estates have only one quay and only one company actively using the waterway, while
others have both multiple quays and companies using them.
page 27 of 51
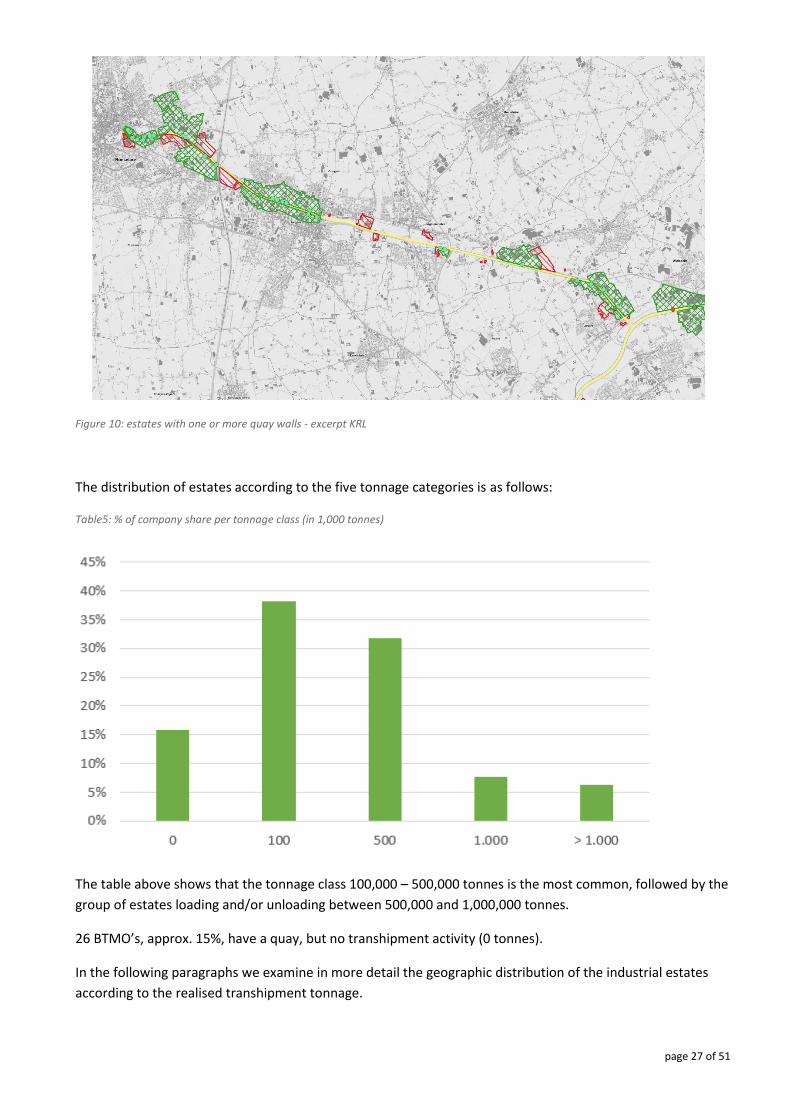
Figure 10: estates with one or more quay walls - excerpt KRL
The distribution of estates according to the five tonnage categories is as follows:
Table5: % of company share per tonnage class (in 1,000 tonnes)
The table above shows that the tonnage class 100,000 – 500,000 tonnes is the most common, followed by the
group of estates loading and/or unloading between 500,000 and 1,000,000 tonnes.
26 BTMO’s, approx. 15%, have a quay, but no transhipment activity (0 tonnes).
In the following paragraphs we examine in more detail the geographic distribution of the industrial estates
according to the realised transhipment tonnage.
page 28 of 51
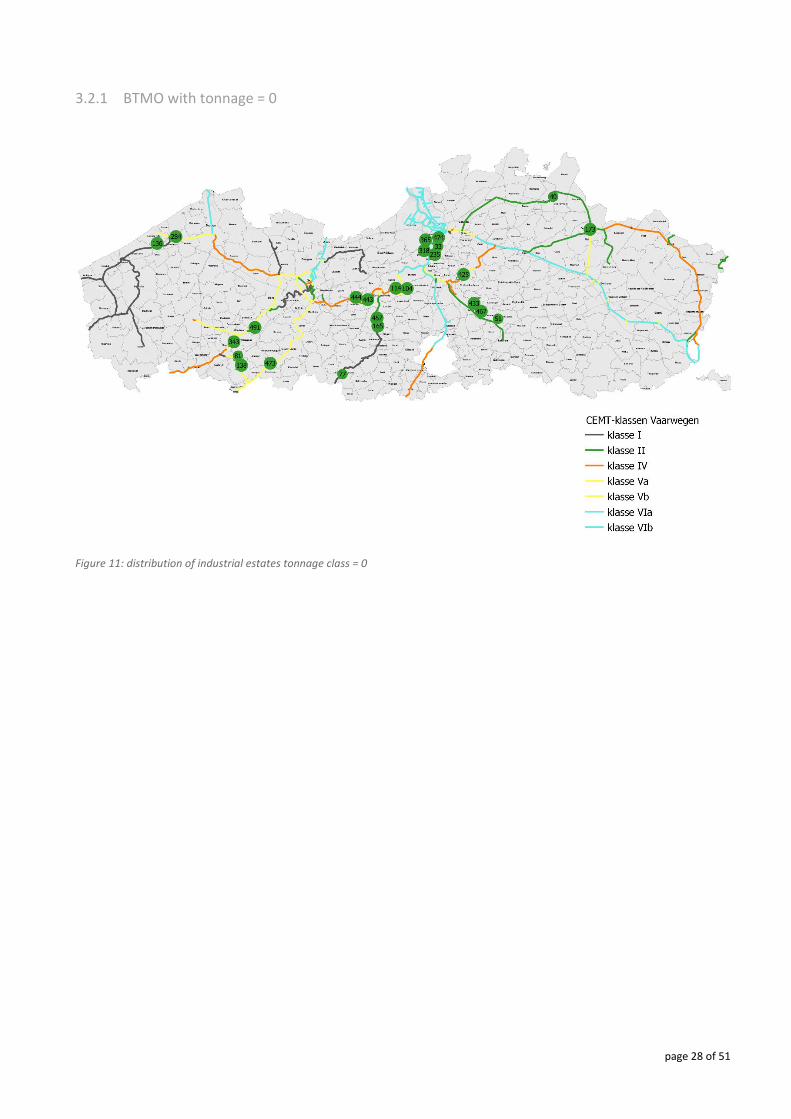
3.2.1 BTMO with tonnage = 0
Figure 11: distribution of industrial estates tonnage class = 0
page 29 of 51
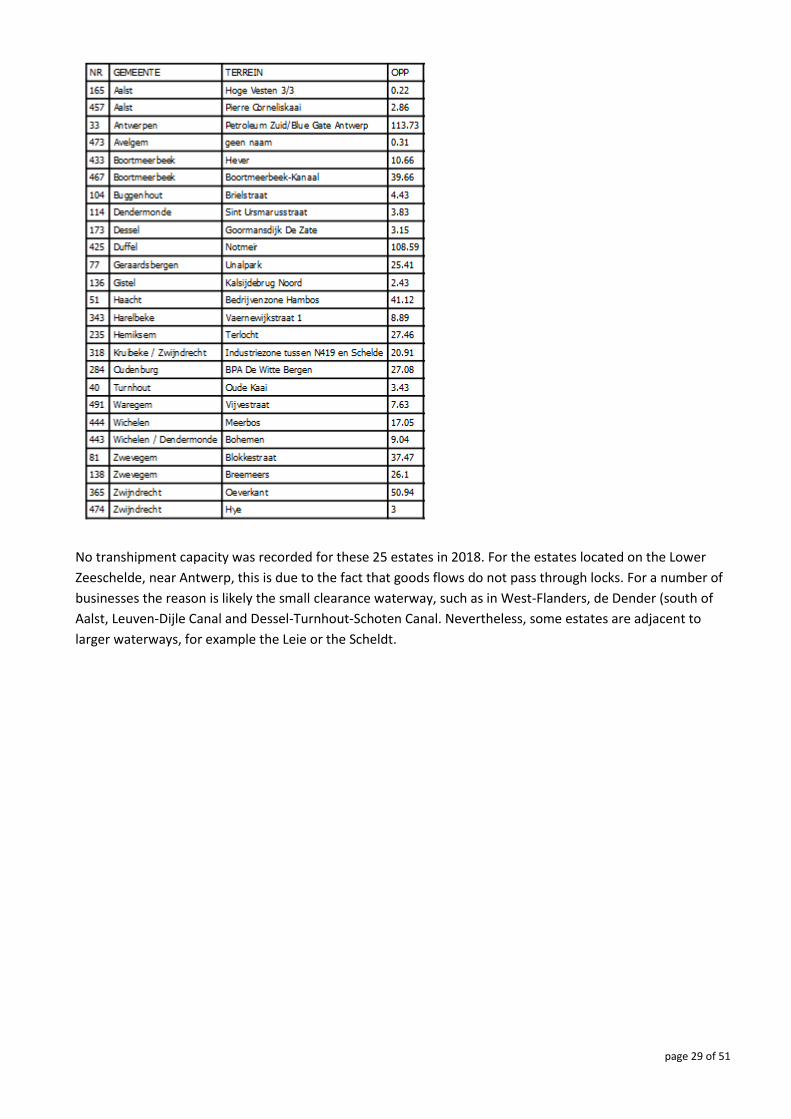
No transhipment capacity was recorded for these 25 estates in 2018. For the estates located on the Lower
Zeeschelde, near Antwerp, this is due to the fact that goods flows do not pass through locks. For a number of
businesses the reason is likely the small clearance waterway, such as in West-Flanders, de Dender (south of
Aalst, Leuven-Dijle Canal and Dessel-Turnhout-Schoten Canal. Nevertheless, some estates are adjacent to
larger waterways, for example the Leie or the Scheldt.
page 30 of 51
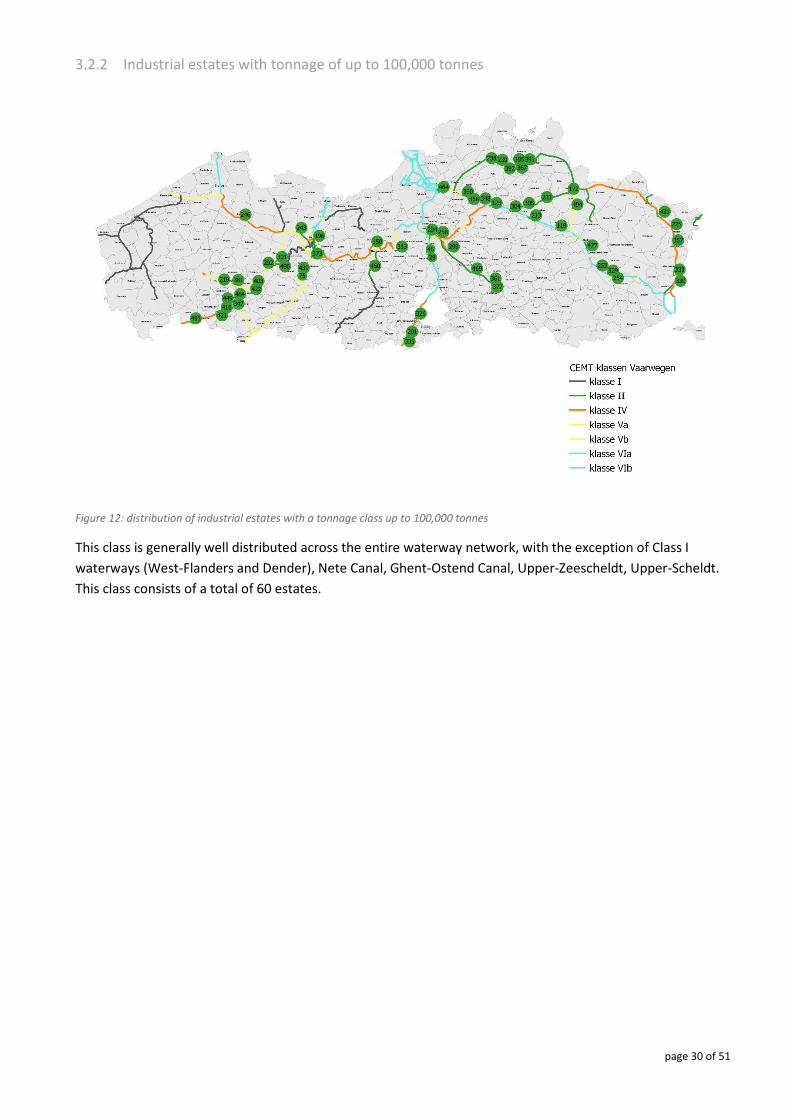
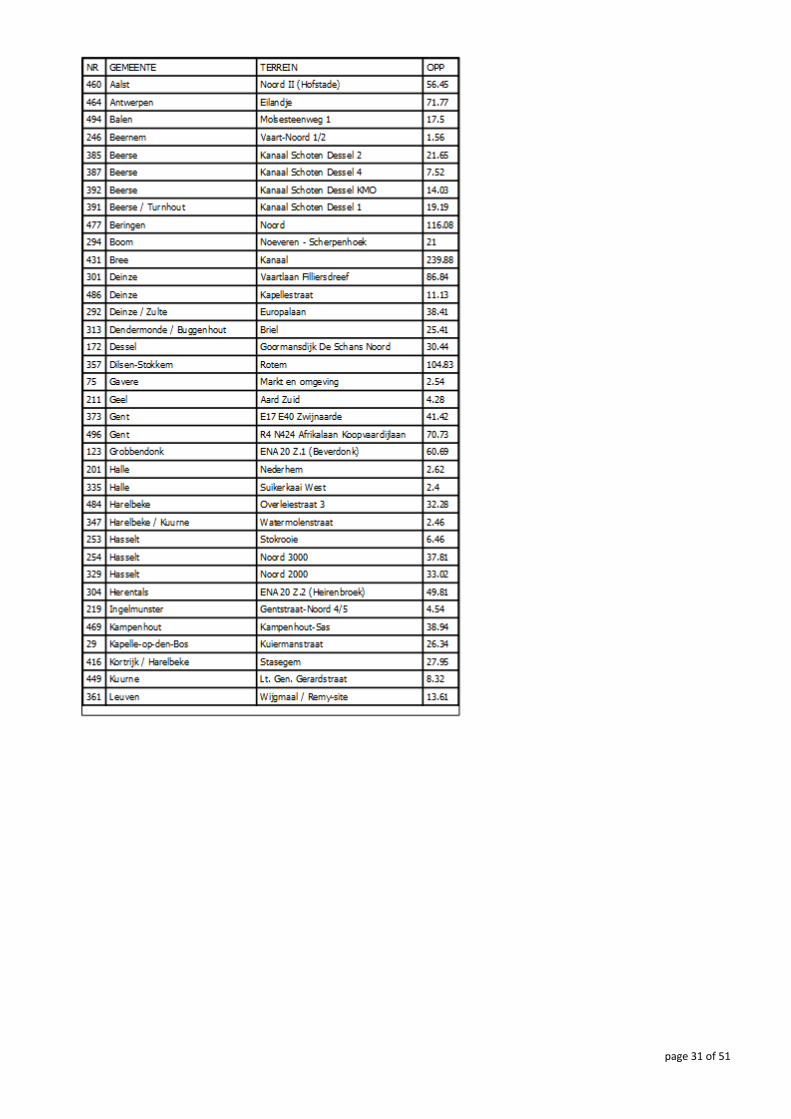
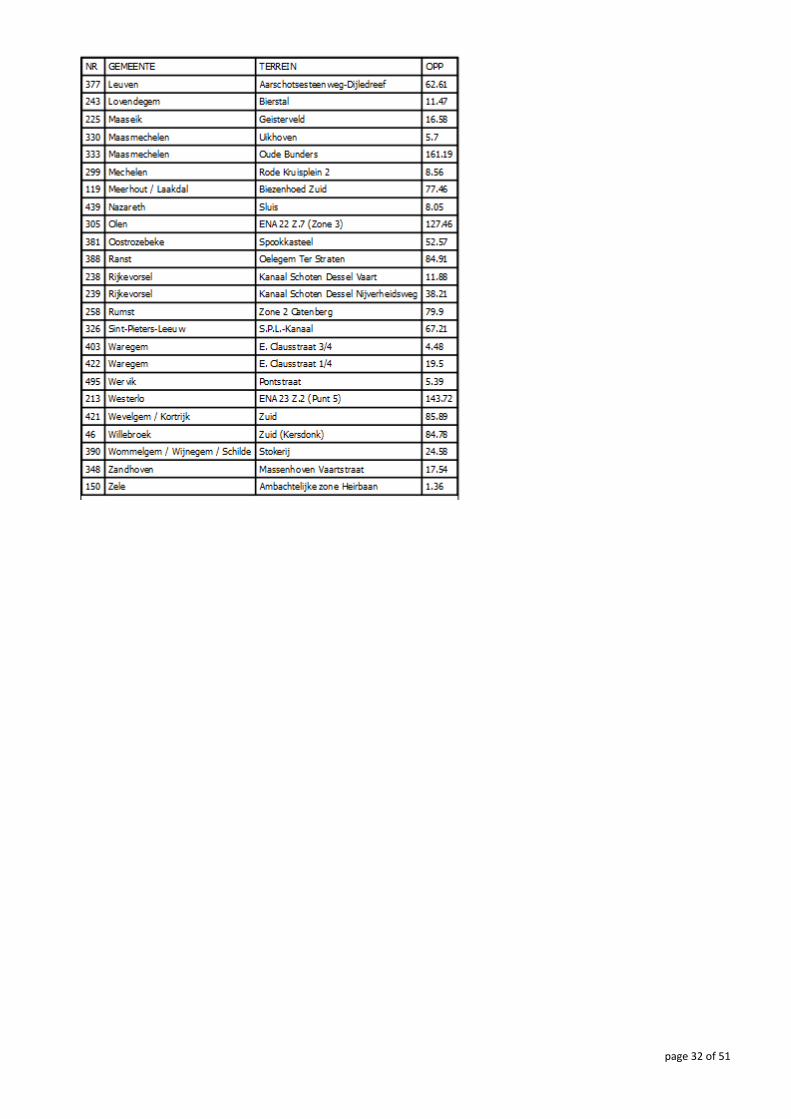
3.2.2 Industrial estates with tonnage of up to 100,000 tonnes
Figure 12: distribution of industrial estates with a tonnage class up to 100,000 tonnes
This class is generally well distributed across the entire waterway network, with the exception of Class I
waterways (West-Flanders and Dender), Nete Canal, Ghent-Ostend Canal, Upper-Zeescheldt, Upper-Scheldt.
This class consists of a total of 60 estates.
page 31 of 51
page 32 of 51
page 33 of 51
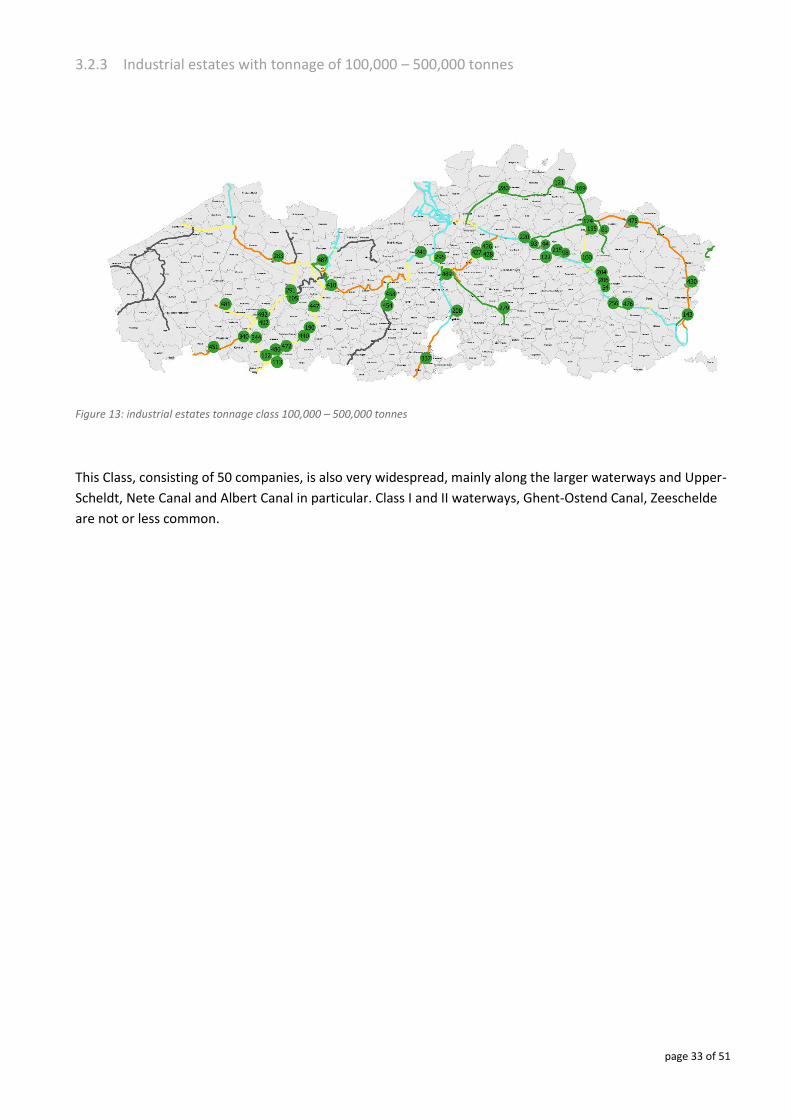
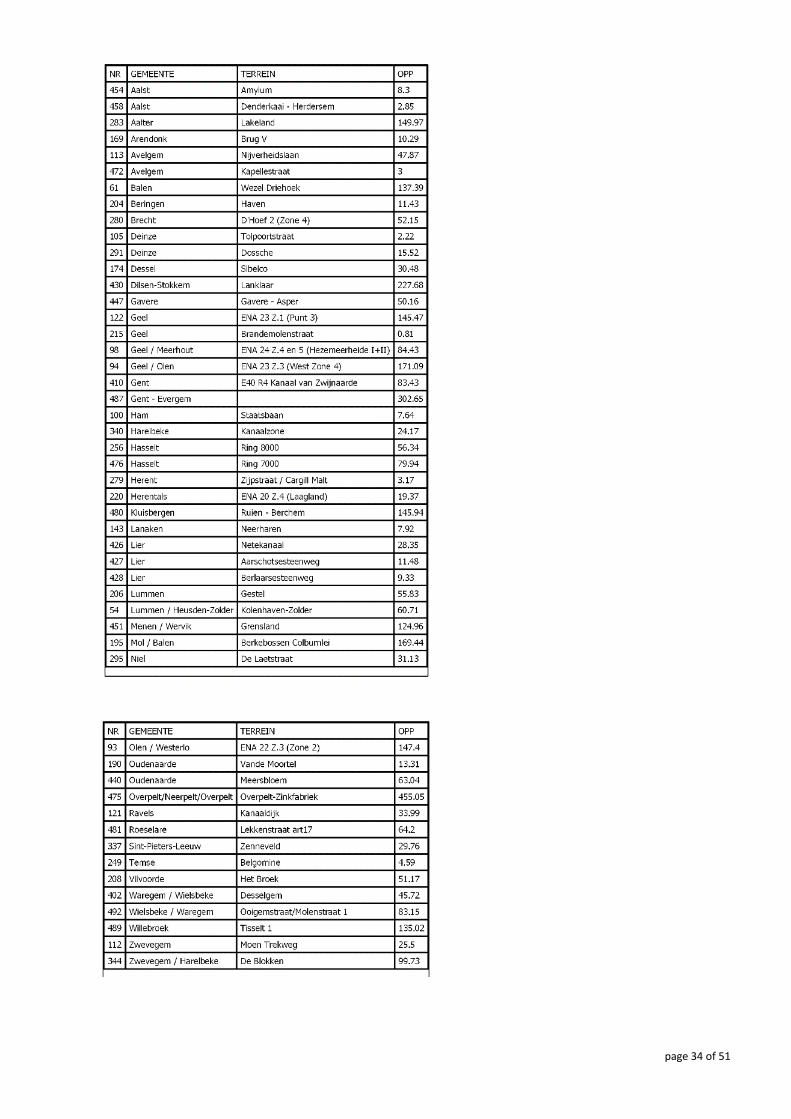
3.2.3 Industrial estates with tonnage of 100,000 – 500,000 tonnes
Figure 13: industrial estates tonnage class 100,000 – 500,000 tonnes
This Class, consisting of 50 companies, is also very widespread, mainly along the larger waterways and Upper-
Scheldt, Nete Canal and Albert Canal in particular. Class I and II waterways, Ghent-Ostend Canal, Zeeschelde
are not or less common.
page 34 of 51
page 35 of 51
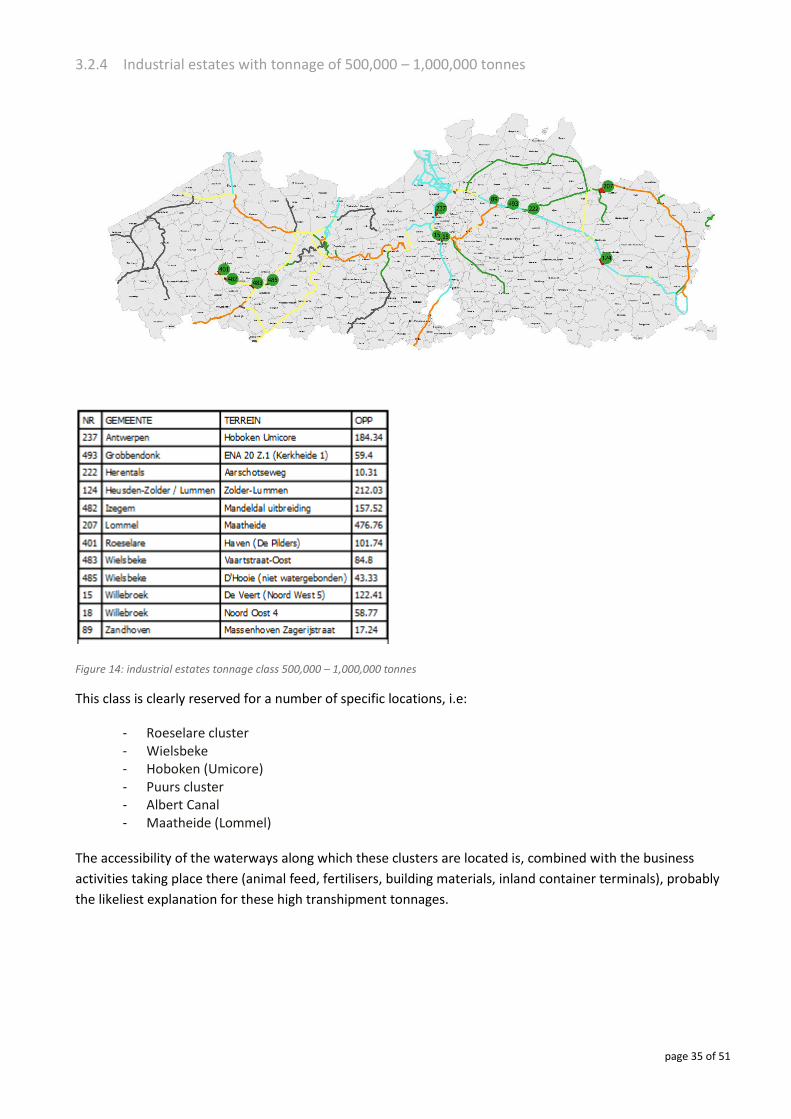
3.2.4 Industrial estates with tonnage of 500,000 – 1,000,000 tonnes
Figure 14: industrial estates tonnage class 500,000 – 1,000,000 tonnes
This class is clearly reserved for a number of specific locations, i.e:
- Roeselare cluster - Wielsbeke - Hoboken (Umicore) - Puurs cluster - Albert Canal - Maatheide (Lommel)
The accessibility of the waterways along which these clusters are located is, combined with the business
activities taking place there (animal feed, fertilisers, building materials, inland container terminals), probably
the likeliest explanation for these high transhipment tonnages.
page 36 of 51
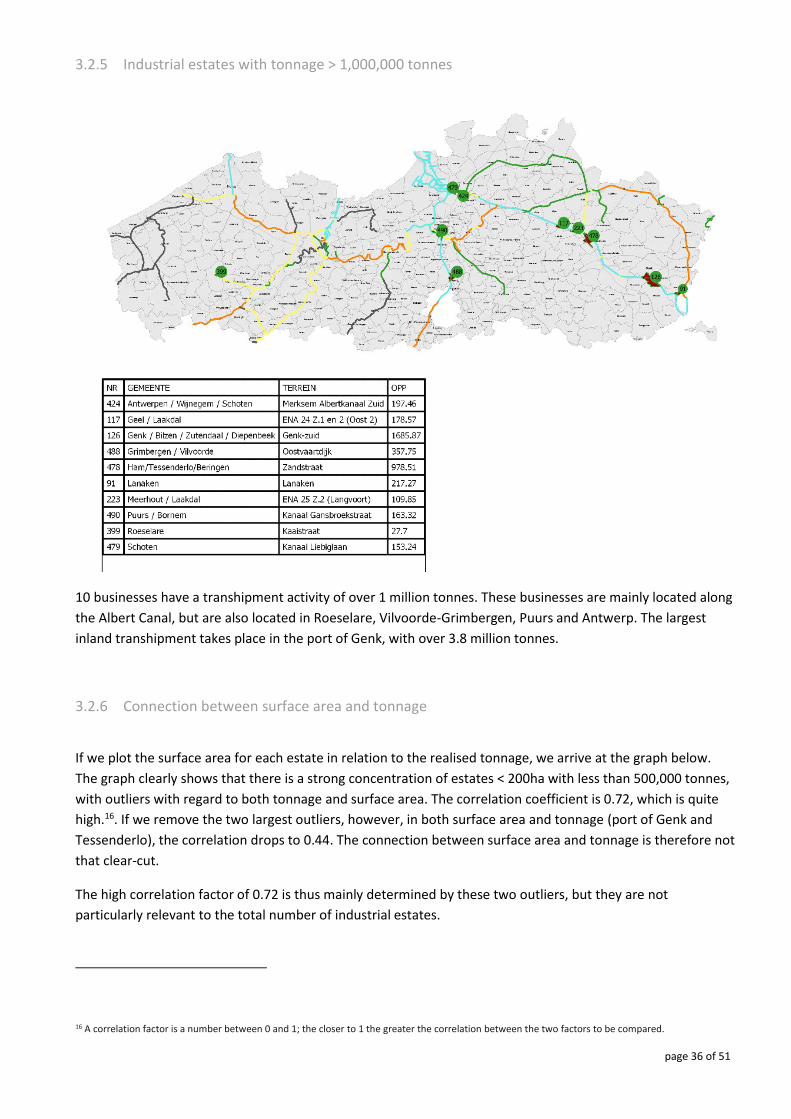
3.2.5 Industrial estates with tonnage > 1,000,000 tonnes
10 businesses have a transhipment activity of over 1 million tonnes. These businesses are mainly located along
the Albert Canal, but are also located in Roeselare, Vilvoorde-Grimbergen, Puurs and Antwerp. The largest
inland transhipment takes place in the port of Genk, with over 3.8 million tonnes.
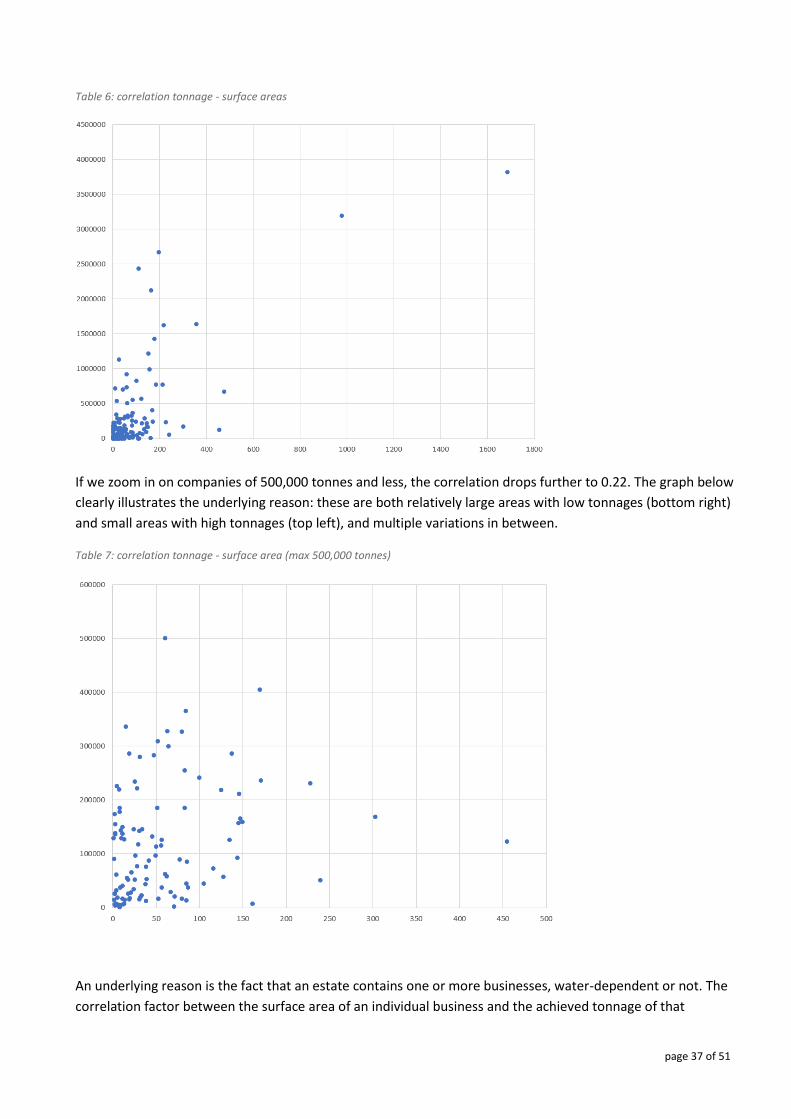
3.2.6 Connection between surface area and tonnage
If we plot the surface area for each estate in relation to the realised tonnage, we arrive at the graph below.
The graph clearly shows that there is a strong concentration of estates < 200ha with less than 500,000 tonnes,
with outliers with regard to both tonnage and surface area. The correlation coefficient is 0.72, which is quite
high.16. If we remove the two largest outliers, however, in both surface area and tonnage (port of Genk and
Tessenderlo), the correlation drops to 0.44. The connection between surface area and tonnage is therefore not
that clear-cut.
The high correlation factor of 0.72 is thus mainly determined by these two outliers, but they are not
particularly relevant to the total number of industrial estates.
16 A correlation factor is a number between 0 and 1; the closer to 1 the greater the correlation between the two factors to be compared.
page 37 of 51
Table 6: correlation tonnage - surface areas
If we zoom in on companies of 500,000 tonnes and less, the correlation drops further to 0.22. The graph below
clearly illustrates the underlying reason: these are both relatively large areas with low tonnages (bottom right)
and small areas with high tonnages (top left), and multiple variations in between.
Table 7: correlation tonnage - surface area (max 500,000 tonnes)
An underlying reason is the fact that an estate contains one or more businesses, water-dependent or not. The
correlation factor between the surface area of an individual business and the achieved tonnage of that
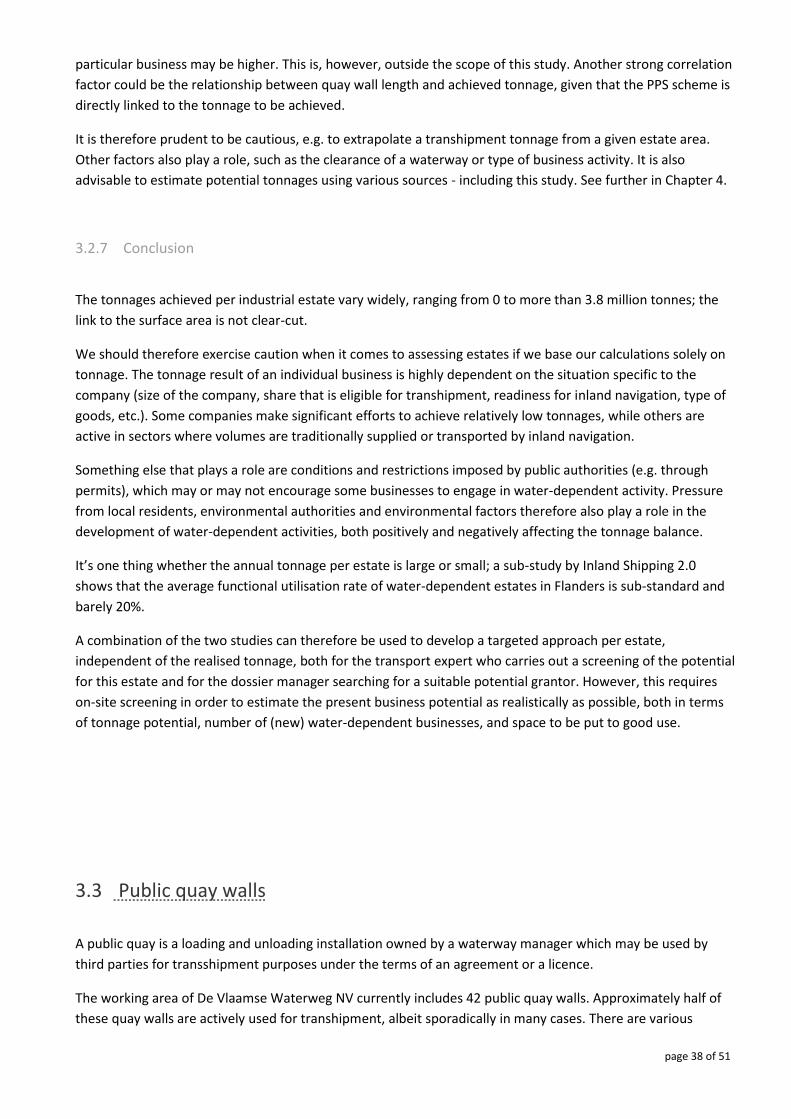
page 38 of 51
particular business may be higher. This is, however, outside the scope of this study. Another strong correlation
factor could be the relationship between quay wall length and achieved tonnage, given that the PPS scheme is
directly linked to the tonnage to be achieved.
It is therefore prudent to be cautious, e.g. to extrapolate a transhipment tonnage from a given estate area.
Other factors also play a role, such as the clearance of a waterway or type of business activity. It is also
advisable to estimate potential tonnages using various sources - including this study. See further in Chapter 4.
3.2.7 Conclusion
The tonnages achieved per industrial estate vary widely, ranging from 0 to more than 3.8 million tonnes; the
link to the surface area is not clear-cut.
We should therefore exercise caution when it comes to assessing estates if we base our calculations solely on
tonnage. The tonnage result of an individual business is highly dependent on the situation specific to the
company (size of the company, share that is eligible for transhipment, readiness for inland navigation, type of
goods, etc.). Some companies make significant efforts to achieve relatively low tonnages, while others are
active in sectors where volumes are traditionally supplied or transported by inland navigation.
Something else that plays a role are conditions and restrictions imposed by public authorities (e.g. through
permits), which may or may not encourage some businesses to engage in water-dependent activity. Pressure
from local residents, environmental authorities and environmental factors therefore also play a role in the
development of water-dependent activities, both positively and negatively affecting the tonnage balance.
It’s one thing whether the annual tonnage per estate is large or small; a sub-study by Inland Shipping 2.0
shows that the average functional utilisation rate of water-dependent estates in Flanders is sub-standard and
barely 20%.
A combination of the two studies can therefore be used to develop a targeted approach per estate,
independent of the realised tonnage, both for the transport expert who carries out a screening of the potential
for this estate and for the dossier manager searching for a suitable potential grantor. However, this requires
on-site screening in order to estimate the present business potential as realistically as possible, both in terms
of tonnage potential, number of (new) water-dependent businesses, and space to be put to good use.
3.3 Public quay walls
A public quay is a loading and unloading installation owned by a waterway manager which may be used by
third parties for transshipment purposes under the terms of an agreement or a licence.
The working area of De Vlaamse Waterweg NV currently includes 42 public quay walls. Approximately half of
these quay walls are actively used for transhipment, albeit sporadically in many cases. There are various
page 39 of 51
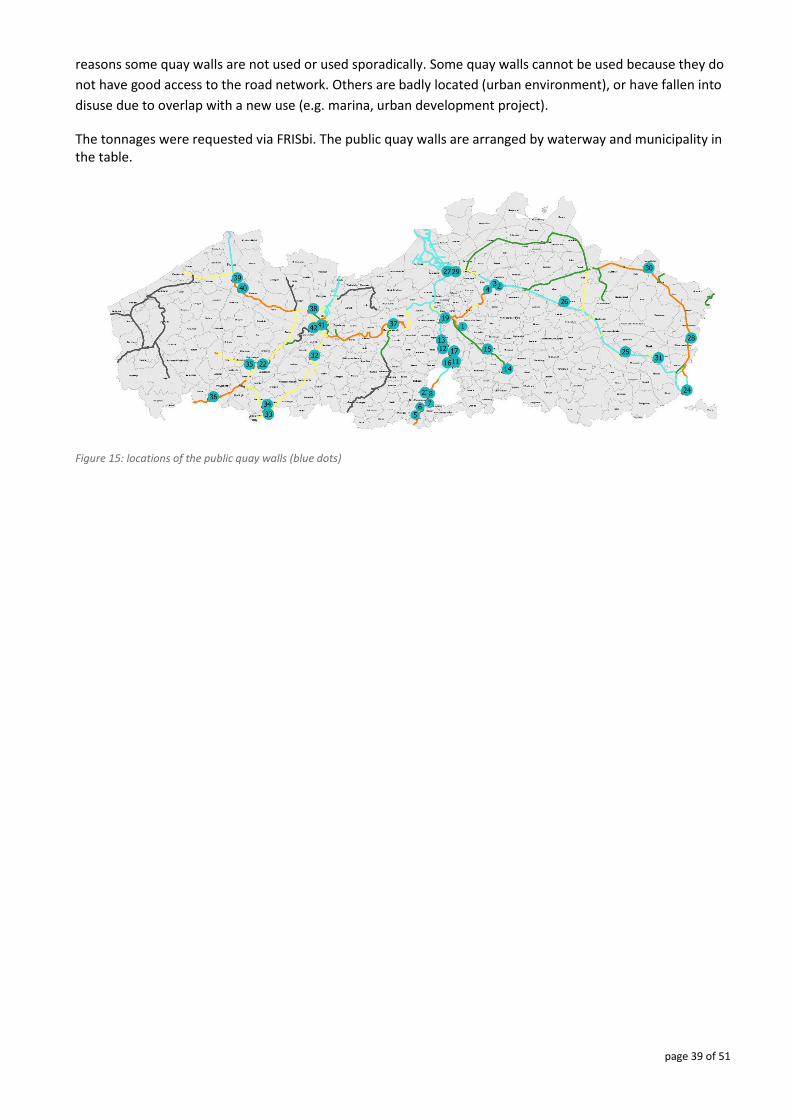
reasons some quay walls are not used or used sporadically. Some quay walls cannot be used because they do
not have good access to the road network. Others are badly located (urban environment), or have fallen into
disuse due to overlap with a new use (e.g. marina, urban development project).
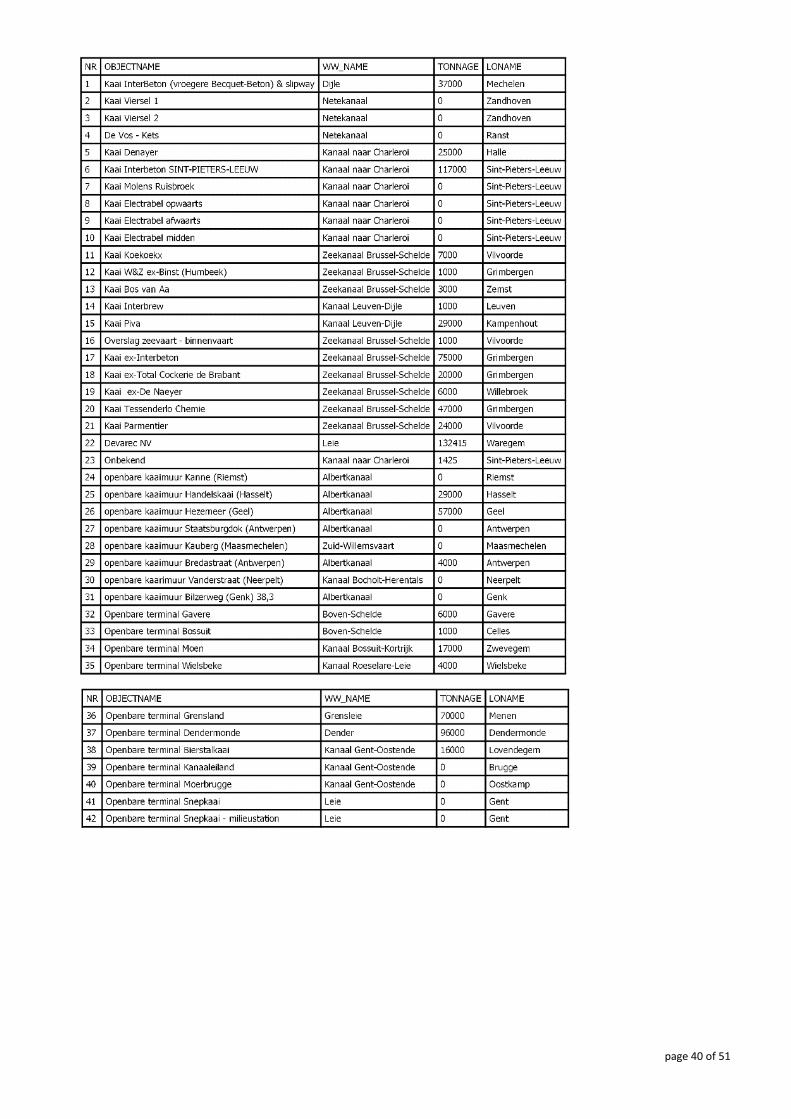
The tonnages were requested via FRISbi. The public quay walls are arranged by waterway and municipality in the table.
Figure 15: locations of the public quay walls (blue dots)
page 40 of 51
page 41 of 51
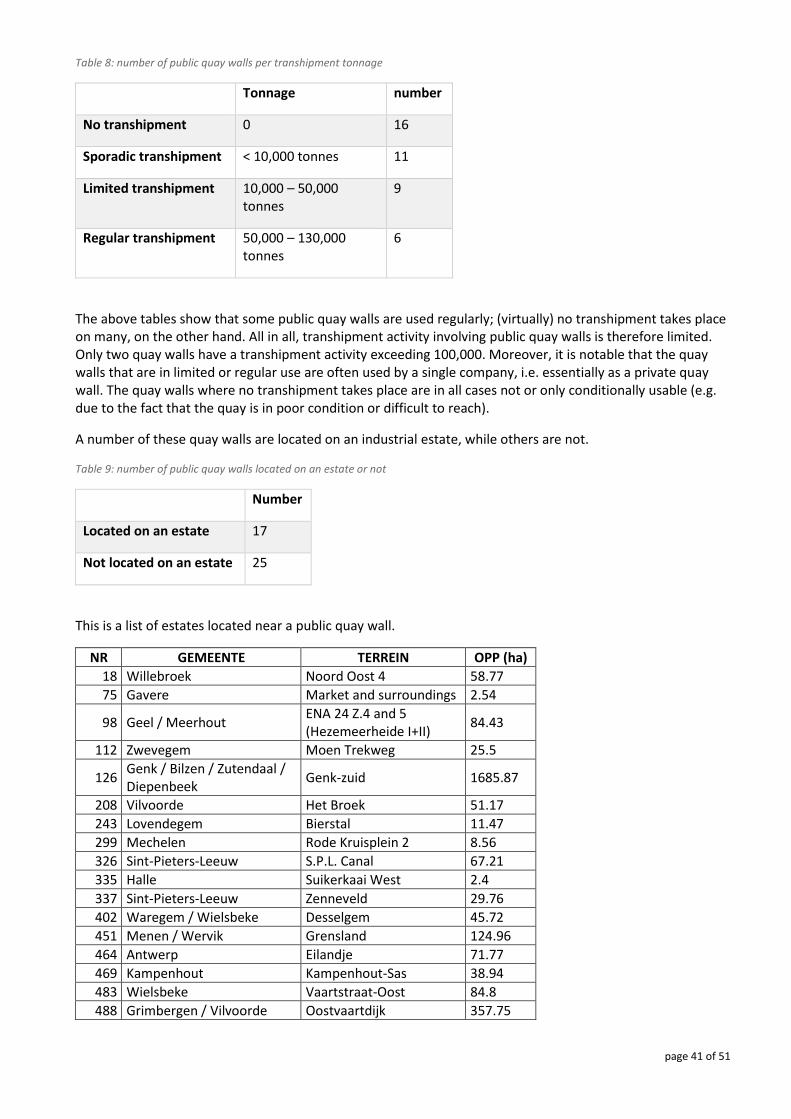
Table 8: number of public quay walls per transhipment tonnage
Tonnage number
No transhipment 0 16
Sporadic transhipment < 10,000 tonnes 11
Limited transhipment 10,000 – 50,000 tonnes
9
Regular transhipment 50,000 – 130,000 tonnes
6
The above tables show that some public quay walls are used regularly; (virtually) no transhipment takes place on many, on the other hand. All in all, transhipment activity involving public quay walls is therefore limited. Only two quay walls have a transhipment activity exceeding 100,000. Moreover, it is notable that the quay walls that are in limited or regular use are often used by a single company, i.e. essentially as a private quay wall. The quay walls where no transhipment takes place are in all cases not or only conditionally usable (e.g. due to the fact that the quay is in poor condition or difficult to reach).
A number of these quay walls are located on an industrial estate, while others are not.
Table 9: number of public quay walls located on an estate or not
Number
Located on an estate 17
Not located on an estate 25
This is a list of estates located near a public quay wall.
NR GEMEENTE TERREIN OPP (ha)
18 Willebroek Noord Oost 4 58.77
75 Gavere Market and surroundings 2.54
98 Geel / Meerhout ENA 24 Z.4 and 5 (Hezemeerheide I+II)
84.43
112 Zwevegem Moen Trekweg 25.5
126 Genk / Bilzen / Zutendaal / Diepenbeek
Genk-zuid 1685.87
208 Vilvoorde Het Broek 51.17
243 Lovendegem Bierstal 11.47
299 Mechelen Rode Kruisplein 2 8.56
326 Sint-Pieters-Leeuw S.P.L. Canal 67.21
335 Halle Suikerkaai West 2.4
337 Sint-Pieters-Leeuw Zenneveld 29.76
402 Waregem / Wielsbeke Desselgem 45.72
451 Menen / Wervik Grensland 124.96
464 Antwerp Eilandje 71.77
469 Kampenhout Kampenhout-Sas 38.94
483 Wielsbeke Vaartstraat-Oost 84.8
488 Grimbergen / Vilvoorde Oostvaartdijk 357.75
page 42 of 51
Almost all waterways have public quay walls, with the exception of class I waterways, Dessel-Turnhout-Schoten Canal, Bocholt-Herentals Canal and Dessel-Kwaadmechelen Canal. The Maritime Canal/Canal to Charleroi is the axis with the most quay walls.
Conclusion:
- Some public quay walls are used regularly; most have however fallen into disuse or could be used more optimally if a number of preconditions were met. In those cases, road access often proves to be a hindrance.
- A number of public quay walls are linked to an industrial estate and are used by a specific company. The question is whether shared used by other nearby companies is an option.
- The function of some public quay walls is compromised by the fact that this activity is not compatible with another activity located there, such as urban development or the development of a marina; or there is inadequate road access. The question is which policy options De Vlaamse Waterweg wants to employ.
- Public quay walls can be a valuable addition to existing private and PPP quay walls. After all, public quay walls offer businesses the opportunity to use the motorway, even if they can’t afford their own quay wall, e.g. because they have excessively low or irregular tonnages, or because they are not linked to a waterway. Vision development is needed in order to be able to make full use of this role, based on the following key questions:
o What is the intended geographic distribution of the public quay walls? o What are the quality requirements of the design: accessibility, possibility of temporary
storage, quay wall surface area and length? o How and according to which rules is the use of public quay walls managed and organised,
particularly in the case of multiple users? o What synergies are possible with other, modal shift stimulating projects, such as
Binnenvaart 2.0, Distribouw, the LAMBIT-model, etc.? o How is the use of public quay walls stimulated (communication, support measures, etc.)?
page 43 of 51
4 CRITERIA OF POTENTIAL FUTURE ESTATES – PUBLIC QUAY WALLS
4.1 Introduction
We cannot equip all estates adjacent to a navigable waterway with transhipment infrastructure. Some are too
small, or not optimally located, or are located near another, well-connected estate or public quay wall. We do,
however, know that some estates can play a strategic role, for example in the creation of the ENA or the ENES,
or other future developments.
The purpose of this fourth chapter is to discuss a number of criteria in order to deal with the following in a
well-founded manner:
1) industrial estates not equipped for water-dependent activities; 2) industrial estates which, although water-dependent, are assumed to be ripe for optimisation
and/or improvement in the use of transhipment infrastructure; 3) the use and expansion of public quay walls.
4.2 Criteria for the selection of non-water-dependent estates
We propose using the following criteria:
- surface areas; - proximity to other water-dependent estates; - type of waterway; - regional land plan; - access; - future developments.
4.2.1 Surface area
The present study shows that the average area of the BTMO’s is 79ha, and that around 35% of these estates
has a surface area of 10 to 50ha.
However, it appears that the BTZO’s are often smaller (over 60% are smaller than 10ha). These estates may be
sufficient for the water-dependent development of one or at least a limited number of businesses. A larger
surface area is more appropriate in case of large-scale development. Smaller plots, on the other hand can add
value to the expansion of existing estates.
The surface area of an industrial estate cannot be separated from the development density of the estate. As
previously mentioned, this study does not allow any pronouncements on the number of businesses located on
a water-dependent industrial estate, let alone the number of businesses using water-dependent facilities.
However, the GIS tool does allow the selection of industrial estates that meet specific surface area criteria (e.g.
all estates larger than x ha).
page 44 of 51
4.2.2 Proximity to other BTMO’s
Information on the proximity of other BTMO’s can be used in the following way:
- adjacent plots can be used as part of the expansion of an existing BTMO; - BTZO’s in the area can be used to encourage shared use.
The GIS tool enables the drawing up of criteria for the selection of industrial estates in the vicinity of water-
dependent estates.
4.2.3 Type of waterway
This study shows that BTMO’s are most common along larger waterways. This does not alter the fact that De
Vlaamse Waterweg actively promotes the use of smaller waterways. The development of new estates must
therefore take into account the pursued objective.
The GIS tool allows targeted selections to be made per type of waterway.
4.2.4 Regional land plan
The regional land plan of any estate can be requested in the GIS file. In most cases, the zoning of a non-water-
dependent estate is compatible with a water-dependent development, but not always. It was deliberately
chosen to leave this open, because in certain cases the zoning of the regional land plan can be changed.
The GIS tool makes it possible to combine information from the industrial estates with input from the regional
land plan.
4.2.5 Existing access
The term ‘access’ refers to both the road and the quay infrastructure. In addition to data that can be obtained
via the district, field research is required in order to be able to make a correct assessment of the existing
situation and the way in which it can/should be improved.
4.2.6 Responding to future spatial developments
page 45 of 51
To what extent does the existing offer of BTMO’s meet the expected future developments?
Regardless of whether an estate is actively used for transhipment or not, it is worth examining our “iron stock”
of water-dependent infrastructure (in which we also include public quay walls) in light of future developments.
This includes issues such as:
- project-based developments at De Vlaamse Waterweg NV (ROC’s17, estate development, etc.); - Inland Shipping 2.0 study; - ENA; - ENES; - Distribouw within the framework of construction logistics; - localisation of TOP’s, DOP’s and CGR’s (respectively Temporary and Final Storage Sites, Soil
Cleaning Centres) within the framework of excavated soil; - potential studies carried out by transport experts (Oude Briel, Leuven-Dijle Canal, Roeselare-
Leie Canal, etc.); - transport regions; - regional logistics hubs.
This list can be further complemented by other studies and projects that benefit from a geographical
approach, such as the Mineral Resources study.
4.2.6.1 Development projects of De Vlaamse Waterweg
Upon request, the current project developments of De Vlaamse Waterweg can be added to the GIS database.
For example, the GIS tool makes it possible to select industrial estates that fall within the sphere of influence
of a ROC.
4.2.6.2 Inland Shipping 2.0
The Inland Shipping 2.0 study indicated per region where the greatest growth in water-related volumes can be
expected. The results of this study can be used to determine where the future development of water-
dependent infrastructure is of strategic importance.
This study also provides insights into the degree of completion of the BTMO’s.
4.2.6.3 ENA
17Regionaal Overslag Centrum [Regional Transhipment Centre]
page 46 of 51
Is a spatially coherent network of Flemish municipalities situated along the Albert Canal. The objective of the
network is to align the economic strengths of the area and to provide a structured response to economic
growth.
4.2.6.4 ENES
The realisation of the Seine-Scheldt connection is expected to have a major impact on the growth of inland
shipping volumes in East and West Flanders. Waterways linked to this project (Upper-Scheldt, Roeselare-Leie
Canal, Leie, Ringvaart Gent) have the highest growth expectations18.
4.2.6.5 Distribouw
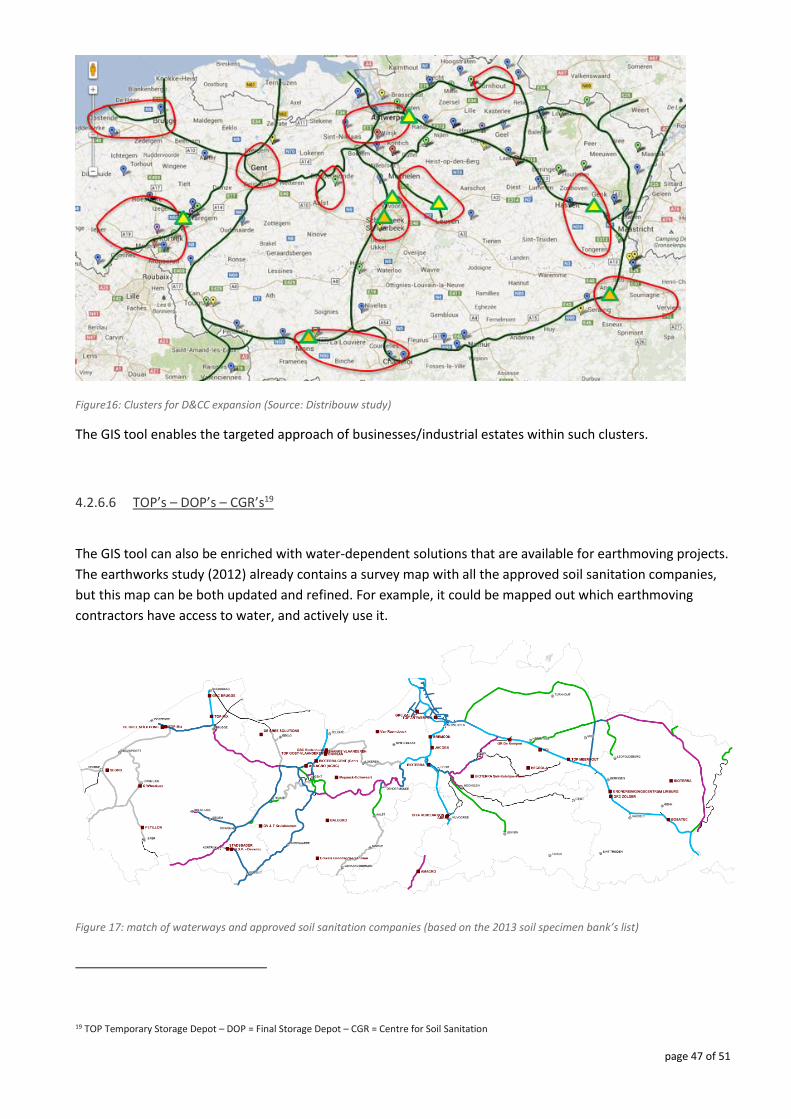
Within the framework of the Distribouw project, the final report identified 14 geographical clusters with
potential for the establishment of a Distribution and Consolidation Centre (D&CC). 11 fall within the scope of
Waterwegen en Zeekanaal:
- Aalst/Dendermonde - Antwerp - Bergen/Charleroi - Bruges/Ostend - Brussels/Halle - Ghent - Hasselt/Genk - Kortrijk/Ieper/Roeselare - Luik/Verviers - Mechelen/Leuven - Turnhout
18 Source: Inland Shipping 2.0
page 47 of 51
Figure16: Clusters for D&CC expansion (Source: Distribouw study)
The GIS tool enables the targeted approach of businesses/industrial estates within such clusters.
4.2.6.6 TOP’s – DOP’s – CGR’s19
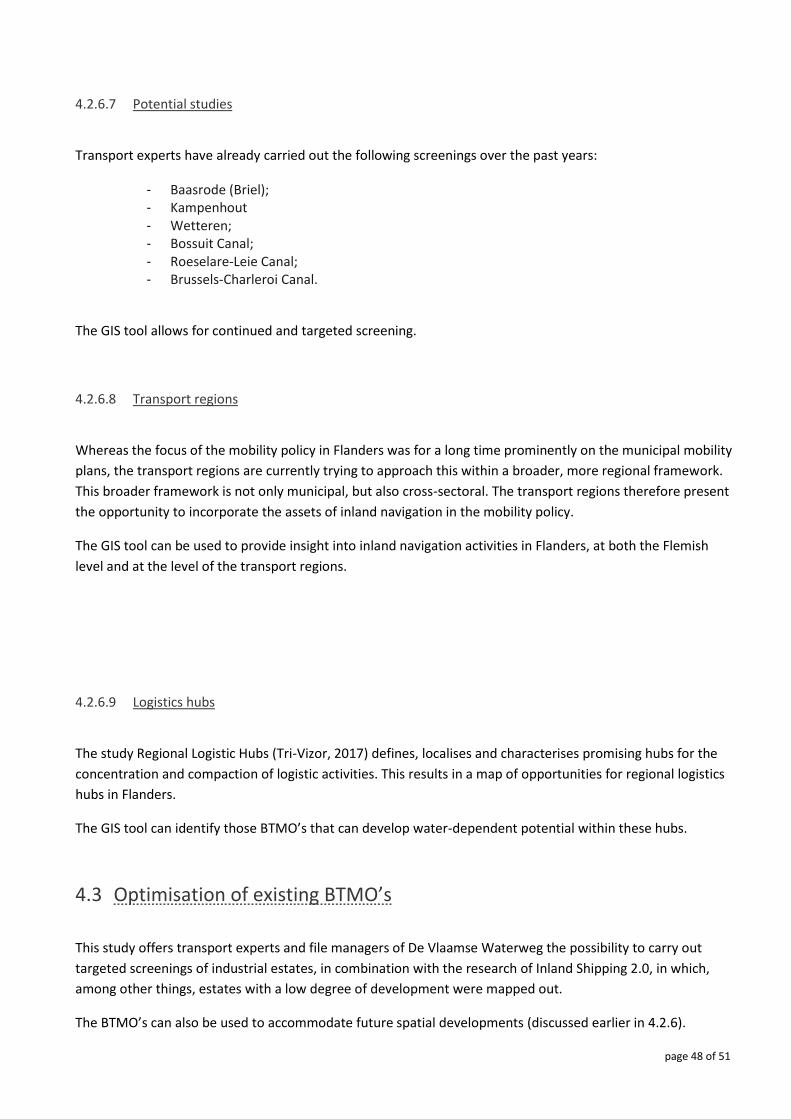
The GIS tool can also be enriched with water-dependent solutions that are available for earthmoving projects.
The earthworks study (2012) already contains a survey map with all the approved soil sanitation companies,
but this map can be both updated and refined. For example, it could be mapped out which earthmoving
contractors have access to water, and actively use it.
Figure 17: match of waterways and approved soil sanitation companies (based on the 2013 soil specimen bank’s list)
19 TOP Temporary Storage Depot – DOP = Final Storage Depot – CGR = Centre for Soil Sanitation
page 48 of 51
4.2.6.7 Potential studies
Transport experts have already carried out the following screenings over the past years:
- Baasrode (Briel); - Kampenhout - Wetteren; - Bossuit Canal; - Roeselare-Leie Canal; - Brussels-Charleroi Canal.
The GIS tool allows for continued and targeted screening.
4.2.6.8 Transport regions
Whereas the focus of the mobility policy in Flanders was for a long time prominently on the municipal mobility
plans, the transport regions are currently trying to approach this within a broader, more regional framework.
This broader framework is not only municipal, but also cross-sectoral. The transport regions therefore present
the opportunity to incorporate the assets of inland navigation in the mobility policy.
The GIS tool can be used to provide insight into inland navigation activities in Flanders, at both the Flemish
level and at the level of the transport regions.
4.2.6.9 Logistics hubs
The study Regional Logistic Hubs (Tri-Vizor, 2017) defines, localises and characterises promising hubs for the
concentration and compaction of logistic activities. This results in a map of opportunities for regional logistics
hubs in Flanders.
The GIS tool can identify those BTMO’s that can develop water-dependent potential within these hubs.
4.3 Optimisation of existing BTMO’s
This study offers transport experts and file managers of De Vlaamse Waterweg the possibility to carry out
targeted screenings of industrial estates, in combination with the research of Inland Shipping 2.0, in which,
among other things, estates with a low degree of development were mapped out.
The BTMO’s can also be used to accommodate future spatial developments (discussed earlier in 4.2.6).
page 49 of 51
4.4 Criteria to determine additional public quay walls
A clearly expressed policy vision is required if we want to exploit the full potential of the existing public quay walls. The basic principles of such a policy were mentioned earlier in 3.3.
The following can be researched on the basis of this vision:
- which quay walls can be reactivated; - are additional quay walls required?
This can be done on the basis of the following criteria:
- proximity of industrial estates (both BTMO’s and BTZO’s); - proximity of other public quay walls/water-dependent industrial estates; which must feature a
well-considered distribution; - potential compared to expected developments (see 4.2.6) - road access; - local factors; - potential study, field research
page 50 of 51
4.5 Determination of future tonnage potential
One of the conditions for investment in water-dependent infrastructure is the guarantee of sufficient
tonnages. The question is how reliable, future tonnage can be determined.
In the case of PPP quay walls, the tonnage is linked to the amount of the investment, and thus to the subsidy.
The longer, larger and more expensive the quay, the higher the investment and consequently the higher the
tonnage commitment.
This question is also reflected in many studies, such as MOBERs (Mobility Impact Assessment), or studies that
study certain aspects of modal shift. In these studies, key figures are used in which the number of movements
is related to the surface area of the estate studied.
In this GIS study, tonnage was linked to each water-dependent industrial estate. There is strong temptation to
use these data to calculate the future potential of an industrial estate. This could be done simply by calculating
an average tonnage of existing estates and then extrapolating on the basis of certain criteria such as surface
area and clearance. However, Chapter 3.2 has shown that some caution is needed. For example, the
relationship between surface area and tonnage is not so clear-cut, and the type of business, activity and type
of goods, all three factors that cannot be included in this study, also play a role.
If a future tonnage potential of a certain industrial estate is desired, we are more inclined to make use of a
combination of sources:
- Top-down approaches based on macroeconomic trends and large-scale statistics. - Bottom-up approaches, such as a screening of an existing industrial estate. These are based on
the existing situation. The advantage of this method is that it takes into account the real, current context. The disadvantage is that it loses sight of macro-economic trends (growth, long-term developments).
- Models that allow for the targeted use of modal shift potential, such as the LAMBIT model. - Studies that identify the potential of a specific economic sector, such as palletised building
materials, or earthmoving.
page 51 of 51
5 CONCLUSION This study provides interesting insights regarding the current water-dependent infrastructure in the operating
territory of De Vlaamse Waterweg NV. Which estates are located by a navigable waterway and actually use
this waterway? Which are the public quay walls, where are they located and how are they being used?
The study was performed in a GIS environment. The GIS analysis identified 496 industrial estates that are
located by a navigable waterway. Just 1 in 3 of these estates have a link-up with the waterway, although it
should be pointed out that this group of 157 estates does represent 70% of the total surface area of industrial
estates bordering on waterways.
There are 42 public quay walls, nearly half of which are situated along the Maritime Canal and the Brussels-
Charleroi Canal. Their utility varies greatly. Some have fallen into disuse, others may be reactivated provided
specific interventions are carried out and a number of them are successfully used for goods transhipment
activities. Around 40% of these quay walls are located in an industrial estate, the remaining 60% are not.
FRISbi also enabled us to assign a transhipment tonnage to each industrial estate and public quay wall, in the
awareness that hitherto this exercise could only be performed for businesses that have concluded one or
other tonnage commitment (PPP, support measure, concession) with De Vlaamse Waterweg.
The GIS environment in which the present study was conducted also allowed us to bring a number of spatial
insights into clearer focus, notably the connection between estate surface area and tonnage, or the role
played by the size of the waterway.
The know-how gleaned through this study may deliver substantial added value for other water-dependent
projects and assignments (especially when combined with studies such as Inland Shipping 2.0, Distribouw,
earthworks, etc.) in general, and the development of a targeted policy in favour of inland navigation and
modal shift in particular:
- Which BTMO’s can be used more efficiently, both in terms of the number of businesses that use the infrastructure and in terms of the proportionate land take rate of the total estate surface area (to be combined with Inland Shipping 2.0)?
- Which industrial estates without transhipment infrastructure need to be given transhipment infrastructure as a matter of priority?
- Which estates, both water-dependent and non-water-dependent, can play a part in a specific future development – ENA, ENES, Distribouw, earthworks, etc.
- Which BTMO’s can help shape transport regions and regional logistics hubs? - How do we deal with the existing public quay walls in times to come? Which quay walls would
do well out of being reactivated? What is the intended spatial spread of the public quay walls? - Should the existing network of public quay walls be expanded? If so, based on which vision
development? - This study can also serve in support of a targeted, proactive land acquisition policy, e.g. as part
of the expansion of a water-dependent industrial estate.