Embed Size (px)
Citation preview
GIS Work Book
( Fundamental Course )
written by Shunji Murai
© Shunji Murai 1999.
1
GIS Work Book (Fundamental Course)
Written by : Published by :Shunji Murai, Professor Japan Association of Surveyors (JAS)Institute of Industrial Science, 1-3-4 Koishigawa, Bunkyo-kuUniversity of Tokyo Tokyo 112, -Japan-7-22-1 Roppongi, Minatoku, Telephone 3-5684-3354Tokyo 106, Japan Fax 3-3816-6870Telephone 3-3402-6231 Price : 20 US DollarsFax 3-3479-2762
Published October 1996 (Fundamental Course), January 1997 ( Technical Course)
Reedited August 1998
Copyright for the materials is held by Shunji Murai. Permission to use these materials for any purpose must be obtained in writing from Japan Association of Surveyors or Shunji Murai. Permission is granted provided the source is clearly acknowledged together with the mark as given below.
© Shunji Murai 1998
2
CONTENTS
Fundamental Course
PrefaceResume of the author
Chapter 1 What is the GIS?
1.1 Defination of GIS1.2 Why is a GIS needed?1.3 Required Functions for GIS1.4 Computer System for GIS1.5 GIS as a Multidisciplinary Science1.6 Areas of GIS Applications1.7 GIS as an Information Infrastructure1.8 GIS for Decision Support
Chapter 2 Data Model and Structure
2.1 Data Model2.2 Geometry and Topology of Vector Data2.3 Topological Data Structure2.4 Topological Relationships between Spatial Objects2.5 Geometry and Topology of Raster Data 2.6 Topological Features of Raster Data2.7 Thematic Data Modeling2.8 Data Structure for Continous Surface Model
Chapter 3 Input of Geospatial Data
3.1 Required Data Sources for GIS3.2 Digitizers for Vector Data Input3.3 Scanner for Raster Data Input3.4 Digital Mapping by Aerial Photogrammetry3.5 Remote Sensing with Satellite Imagery3.6 Rasterization3.7 Vectorization3.8 Advanced Technologies for Primary Data Acquisition
Chapter 4 Spatial Database
4.1 Concept of Spatial Database4.2 Design of Spatial Database4.3 Database Management System4.4 Hierachical Model4.5 Relational Database4.6 Object Oriented Database
Chapter 5 Required Hardware and Software for GIS
5.1 Required Computer System5.2 Required Functions of GIS Software5.3 PC Based GIS for Education5.4 Image Diplay
3
5.5 Color Hard Copy Machine5.6 Pen Computer
Chapter 6 Installation of GIS
6.1 Plan for GIS Installation6.2 Considerations for Installation of GIS6.3 Keys for Successful GIS6.4 Reasons for Unsuccessful GIS6.5 Required Human Resource for GIS6.6 Cost Analysis of GIS Project
4
PrefaceShunji Murai Professor and Doctor of EngineeringInstitute of Industrial ScienceUniversity of Tokyo, JapanChair Professor, STAR ProgramAsian Institute of Technology, Thailand
Geographic Information System (GIS) has undergone a sort of boom all around the world in this decade as personal computers and engineering workstations have become available at reasonable prices. There were and are so many applications of GIS on various levels of central governments, local governments, utility service corporations, distribution service companies, car navigation systems, marketing strategies etc., but unfortunately not all them are successful. For successful GIS one of the keys is education and training, particularly with well organized teaching materials.
When I was teaching at the Asian Institute of Technology (AIT), Bangkok, Thailand for three years between 1992 and 1995, and also when I organized an international symposium on AM/FM GIS ASIA'95 in Bangkok, Thailand, August 1995, I was strongly requested by many people in the developing countries in Asia to publish a GIS text book, which is easily understandable in not only theory and principle but also in planning and application for a successful GIS. If you look at the exiting text books, most of them are not very much unified because some are collection of articles written by multiple authors, some are too thick and too expensive for educational purposes, some are too conceptual and theoretical background. Thus I have attempted to write an easily understood text with short explanation in not more than a page for each item on the left together with another page of only figures, tables and/or pictures on the right page, in organized manner.
In 1996 and 1997, I published GIS Work Book- Fundamental Course and Technical Course respectively with bi-lingal of English and Japanese. As some readers request me to publish only English version, I reedited the two volumes into a book with only English version.
I believe that this text book with its two parts ; "fundamental course" and "technical course" would be useful and helpful to not only students, trainees, engineers, salesmen but also to top managers or decision makers.
I would like to thank Mr. Minoru Tsuzura, Japan Association of Surveyors for his administrative support to make this English version possible.
August, 1998 Tokyo, Japan
The production of this CD-ROM was funded by National Space Development Agency of Japan (NASDA) Remote Sensing Technology Center of Japan (RESTEC). The conversion into electronic form was implemented by Asian Center for Research on Remote Sensing (ACRoRS) of Asian Institute of Technology (AIT), Thailand in March 1999. The editing team members were Professor Shunji Murai (Team Leader), Mr. Tin Aung Moe, Ms. Wandee Kijpoovadol and Mrs. Nancy Canisius.
March, 1999AIT, Thailand
Resume of the Author
5
Shunji Murai, Professor and Dr. Eng.
Born in Tokyo, Japan in 1939
Professional Career :
1997-Present Chair Professor, STAR Program, Asian Institute of Technology1995-1997 Professor, Institute of Industrial Science, University of Tokyo1992-1995 Professor, Asian Institute of Technology1983-1992 Professor, Institute of Industrial Science, University of Tokyo1971-1992 Associate Professor, Institute of Industrial Science, Univ. of Tokyo1970 Awarded Doctor of Engineering, University of Tokyo1963 Graduated from Civil Engineering Department, University of Tokyo
International Activities :
1996-2000First Vice President, International Society for Photogrammetry and Remote Sensing (ISPRS)
1992-1996 President, International Society for Photogrammetry and Remote Sensing (ISPRS)1981-Present
General Secretary, Asian Association on Remote Sensing (AARS)
1992-Present
President, Japan Association of Remote Sensing (JARS)
1979-Present
Executive Board Member, Japan Association of Surveyors (JAS)
1989-Present
Editor in Chief, The Journal of Survey, Japan Association of Surveyors
1997.7 Academician, International Eurasian Academy of Sciences
1994.10Honorary Professor, Wuhan Technical University of Surveying and Mapping, China
1993.4Honorary Fellow, International Institute of Aerospace Survey and Earth Sciences (ITC), The Netherlands
Publications :
Three Dimensional Measurement by Photogrammetry, Editor, Japan Society of Photogrammetry and Remote Sensing, Kyoritsu Publishing Co., (Japanese version) 1983
Applications of Remote Sensing in Asia and Oceania, Editor, AARS, Geocartos International, Hong Kong 1992
Remote Sensing Note, Editor, JARS, JAS 1992
The World of Geoinformatics, Author, JAS, 1995 (Japanese Version)
Toward Global Planning for Sustainable Use of the Earth ; Proceedings of the 8th TOYOTA Conference, Editor, Elsevier Science, 1995
Survey High Technologies-100 Collections, Editor, JAS, 1996 (Japanese Version)
6
Chapter 1 What is GIS?
1-1 Definition of GIS
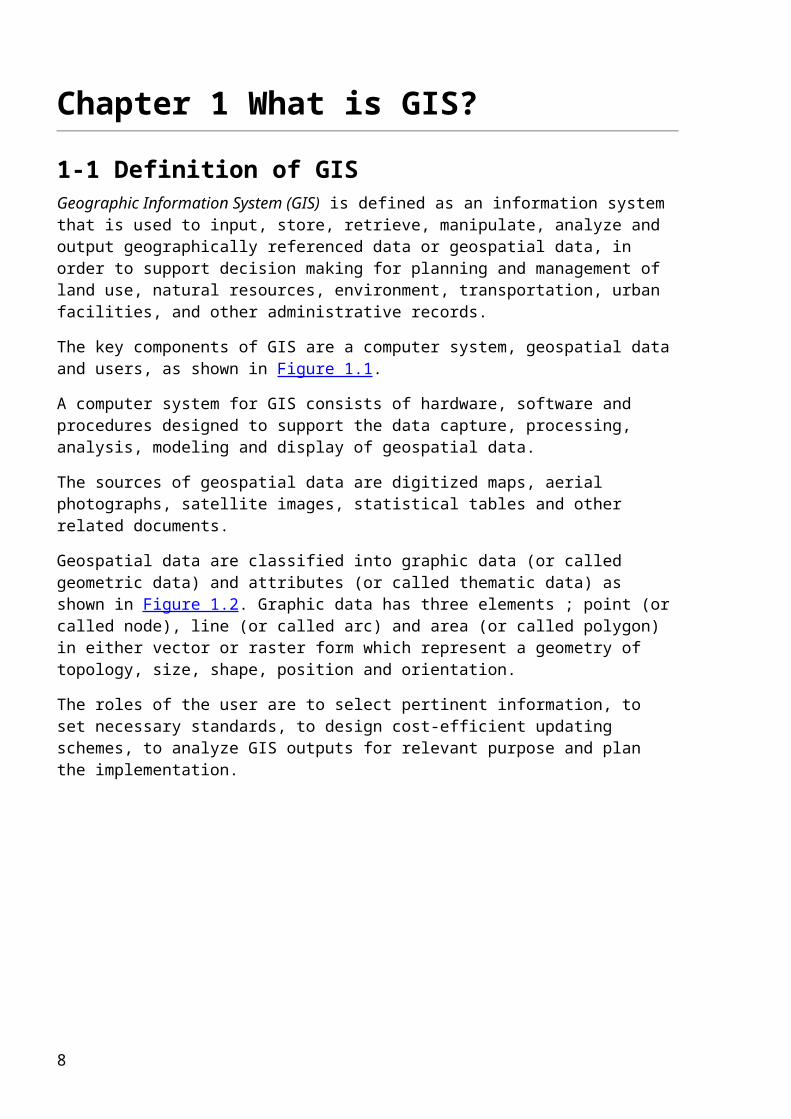
Geographic Information System (GIS) is defined as an information system that is used to input, store, retrieve, manipulate, analyze and output geographically referenced data or geospatial data, in order to support decision making for planning and management of land use, natural resources, environment, transportation, urban facilities, and other administrative records.
The key components of GIS are a computer system, geospatial data and users, as shown in Figure 1.1.
A computer system for GIS consists of hardware, software and procedures designed to support the data capture, processing, analysis, modeling and display of geospatial data.
The sources of geospatial data are digitized maps, aerial photographs, satellite images, statistical tables and other related documents.
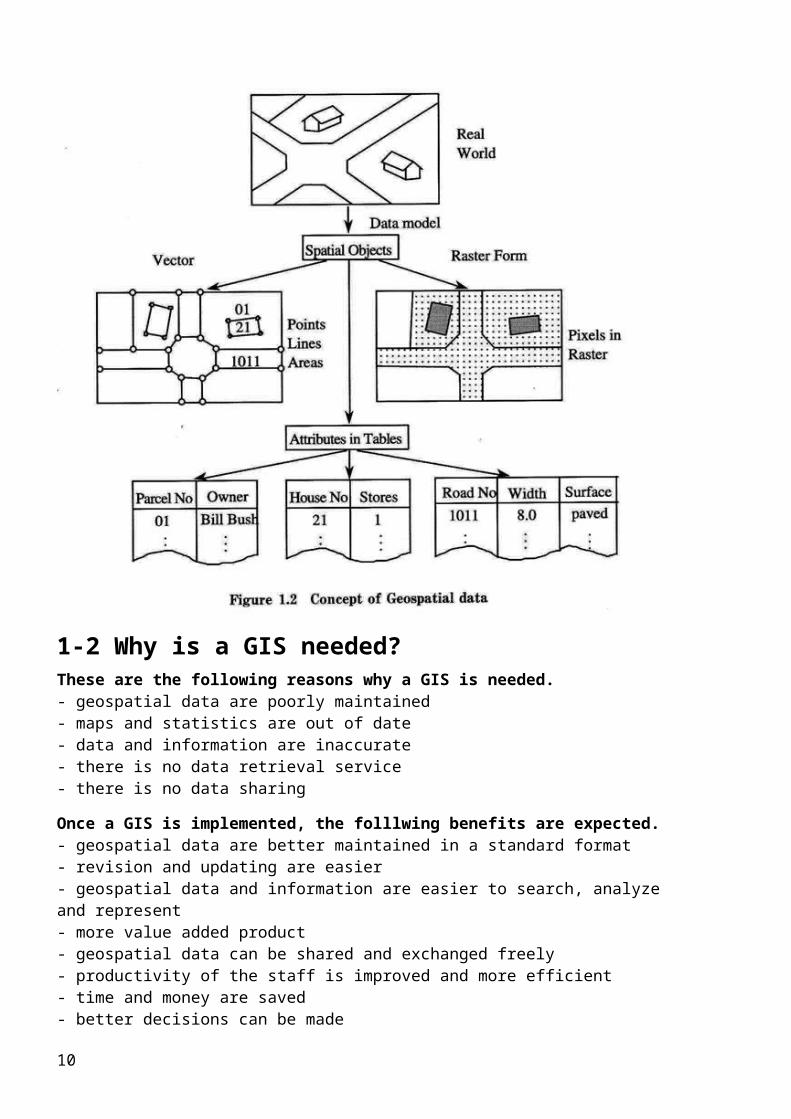
Geospatial data are classified into graphic data (or called geometric data) and attributes (or called thematic data) as shown in Figure 1.2. Graphic data has three elements ; point (or called node), line (or called arc) and area (or called polygon) in either vector or raster form which represent a geometry of topology, size, shape, position and orientation.
The roles of the user are to select pertinent information, to set necessary standards, to design cost-efficient updating schemes, to analyze GIS outputs for relevant purpose and plan the implementation.
7
1-2 Why is a GIS needed?
These are the following reasons why a GIS is needed.- geospatial data are poorly maintained- maps and statistics are out of date- data and information are inaccurate- there is no data retrieval service- there is no data sharing
Once a GIS is implemented, the folllwing benefits are expected.- geospatial data are better maintained in a standard format- revision and updating are easier- geospatial data and information are easier to search, analyze and represent- more value added product- geospatial data can be shared and exchanged freely- productivity of the staff is improved and more efficient - time and money are saved- better decisions can be made
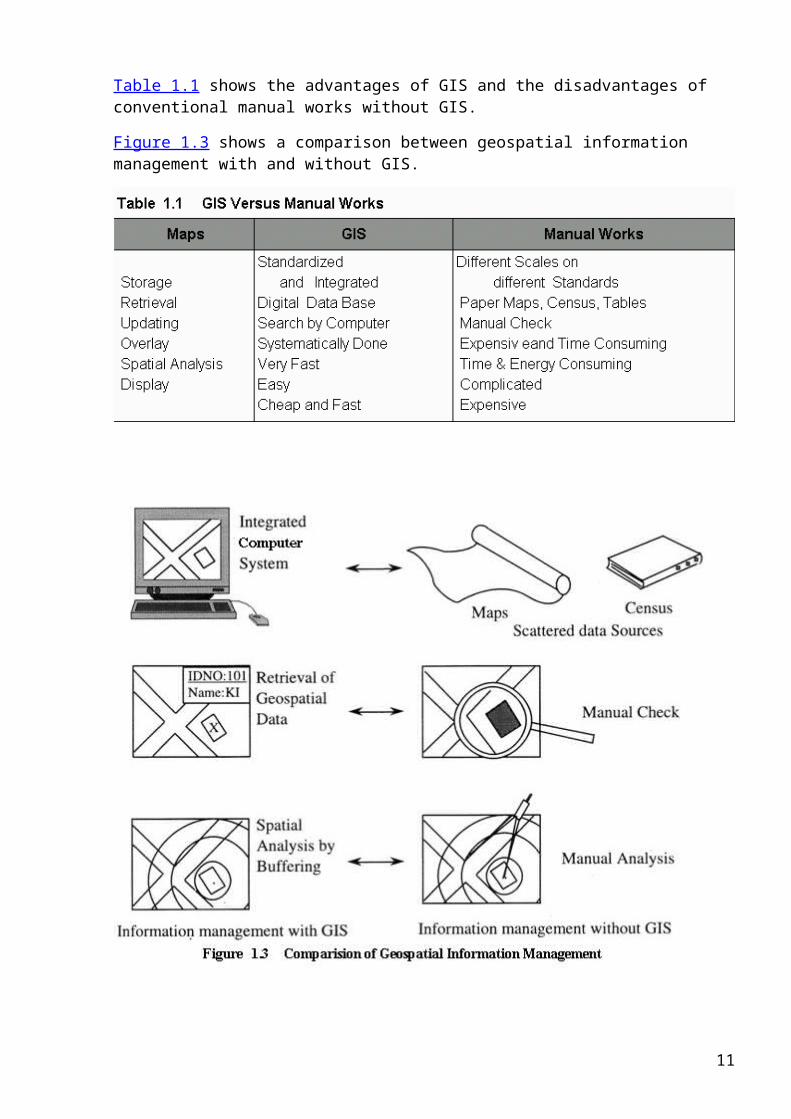
Table 1.1 shows the advantages of GIS and the disadvantages of conventional manual works without GIS.
8

Figure 1.3 shows a comparison between geospatial information management with and without GIS.
9
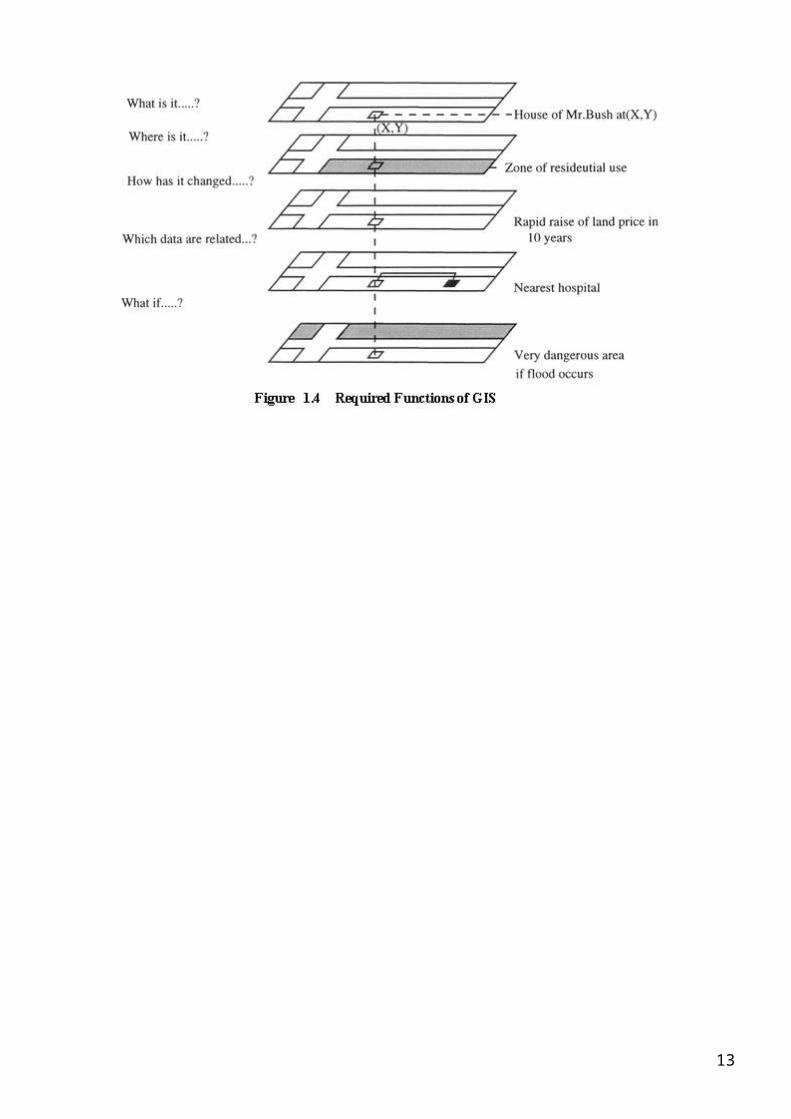
1-3 Required Functions for GIS
The questions that a GIS is required to answer are mainly as follows :
What is at......? (Locational question ; what exists at a particular location)
Where is it.....? (Conditional question ; which locations satisfy certain conditions)
How has it changed........? (Trendy question ; identifies geographic occurrence or trends that have changed or in the process of changing)
Which data are related ........? (Relational question : analyzes the spatial relationship between objects of georaphic features)
What if.......? (Model based question ; computers and displays an optimum path, a suitable land, risky area against disasters etc. based on model)
Figure 1.4 shows examples of questions to be answered by GIS.
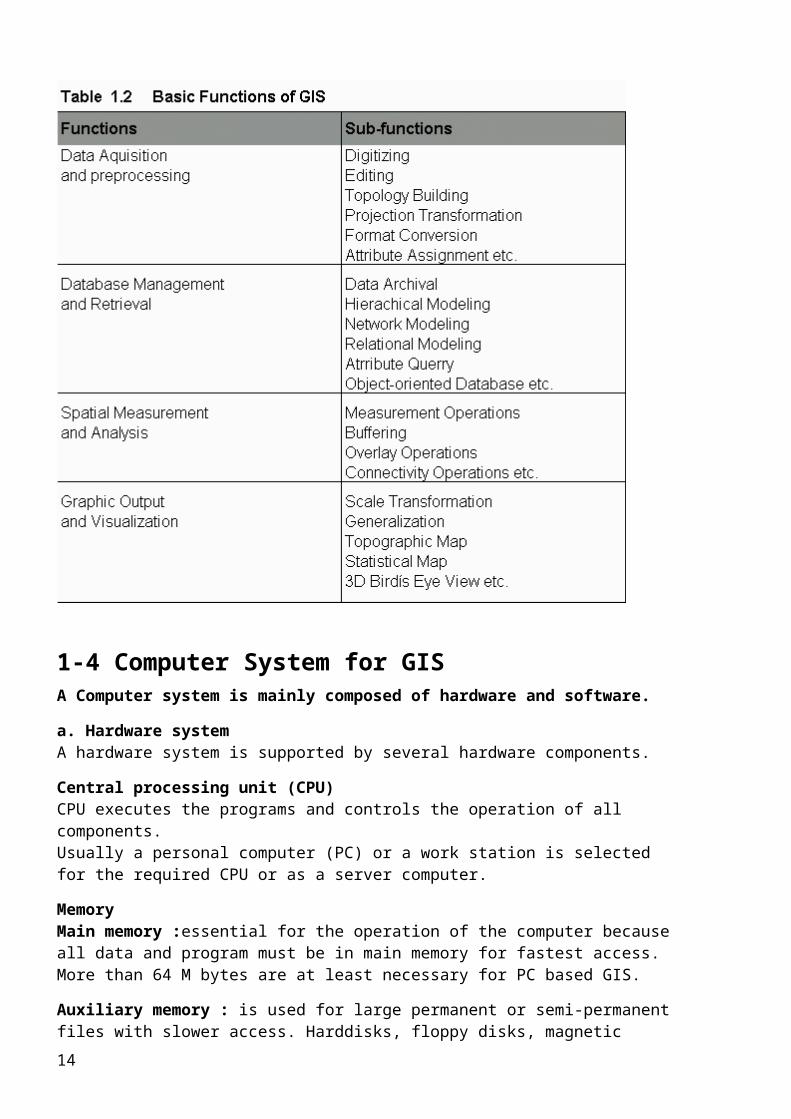
In order to meet the above requirements, the following functions are necessary for GIS (see Table 1.2)
- data acquisition and pre-processing- data based management and retrieval- spatial measurement and analysis- graphic output and visualization
10
1-4 Computer System for GIS
A Computer system is mainly composed of hardware and software.
a. Hardware systemA hardware system is supported by several hardware components.
Central processing unit (CPU)CPU executes the programs and controls the operation of all components. Usually a personal computer (PC) or a work station is selected for the required CPU or as a server computer.
MemoryMain memory :essential for the operation of the computer because all data and program must be in main memory for fastest access. More than 64 M bytes are at least necessary for PC based GIS.
Auxiliary memory : is used for large permanent or semi-permanent files with slower access. Harddisks, floppy disks, magnetic tapes, or optical compact disks (CD-ROM) are used. At least more than 1 G bytes is required for hard disk in GIS.
11
PeripheralsInput devices : key board, mouse, digitizers, image scanners, digital cameras, digital photogrammetric workstations etc.
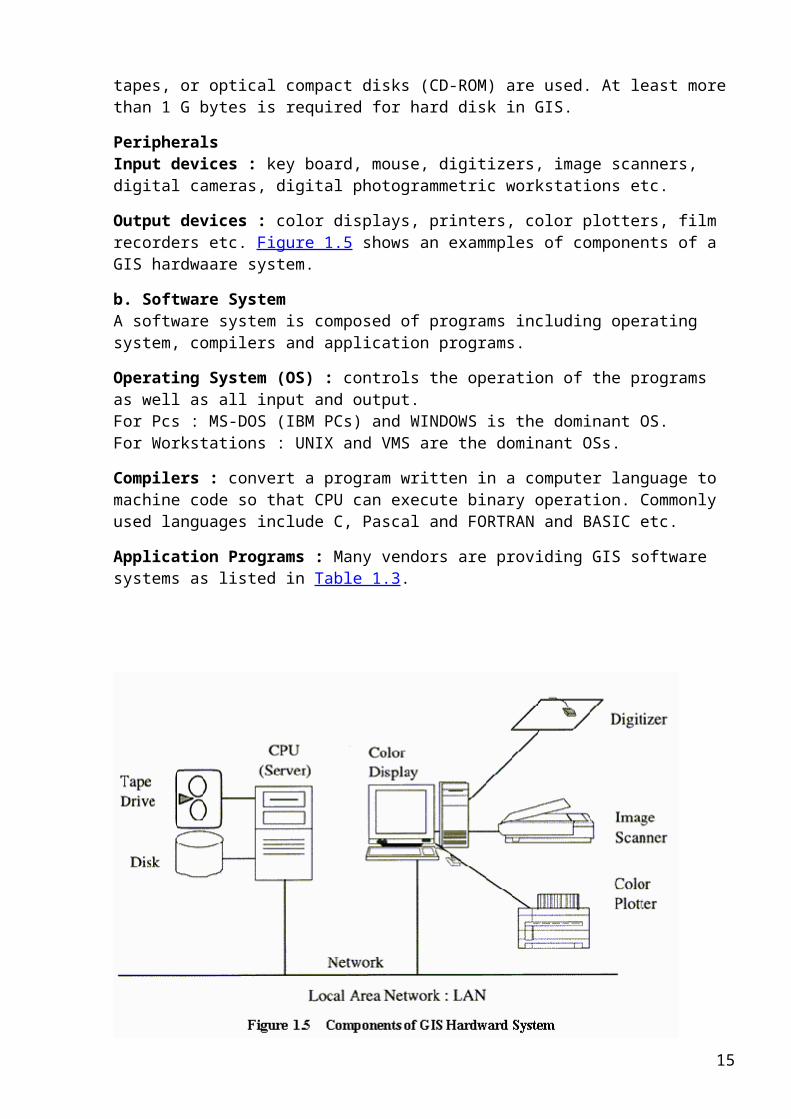
Output devices : color displays, printers, color plotters, film recorders etc. Figure 1.5 shows an exammples of components of a GIS hardwaare system.
b. Software SystemA software system is composed of programs including operating system, compilers and application programs.
Operating System (OS) : controls the operation of the programs as well as all input and output.For Pcs : MS-DOS (IBM PCs) and WINDOWS is the dominant OS.For Workstations : UNIX and VMS are the dominant OSs.
Compilers : convert a program written in a computer language to machine code so that CPU can execute binary operation. Commonly used languages include C, Pascal and FORTRAN and BASIC etc.
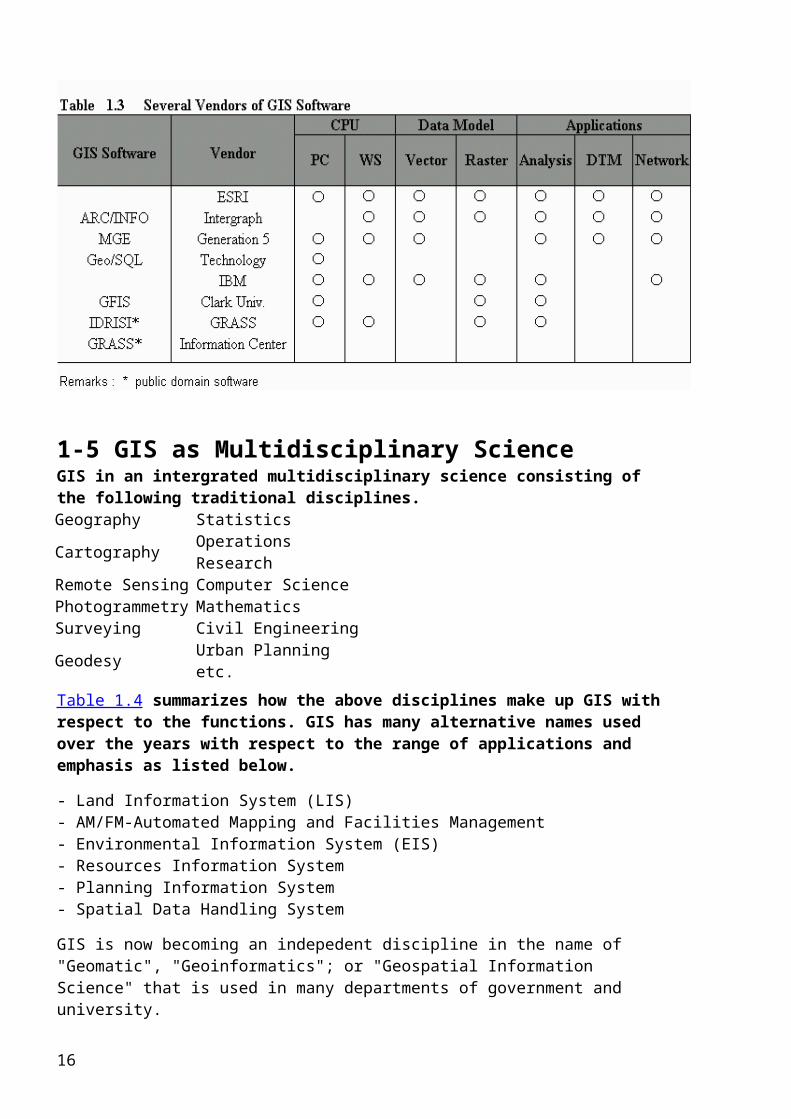
Application Programs : Many vendors are providing GIS software systems as listed in Table 1.3.
12
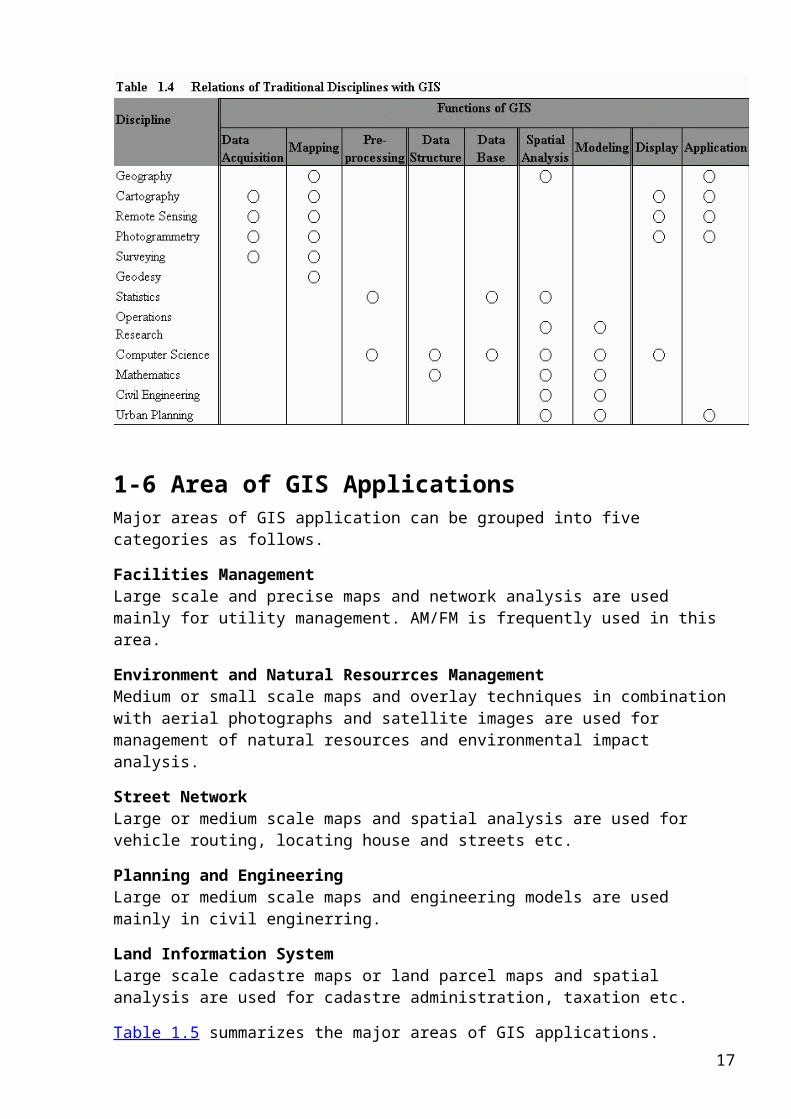
1-5 GIS as Multidisciplinary Science GIS in an intergrated multidisciplinary science consisting of the following traditional disciplines.Geography StatisticsCartography Operations ResearchRemote Sensing Computer SciencePhotogrammetry MathematicsSurveying Civil EngineeringGeodesy Urban Planning etc.
Table 1.4 summarizes how the above disciplines make up GIS with respect to the functions. GIS has many alternative names used over the years with respect to the range of applications and emphasis as listed below.
- Land Information System (LIS)- AM/FM-Automated Mapping and Facilities Management- Environmental Information System (EIS)- Resources Information System- Planning Information System- Spatial Data Handling System
GIS is now becoming an indepedent discipline in the name of "Geomatic", "Geoinformatics"; or "Geospatial Information Science" that is used in many departments of government and university.
13
1-6 Area of GIS Applications
Major areas of GIS application can be grouped into five categories as follows.
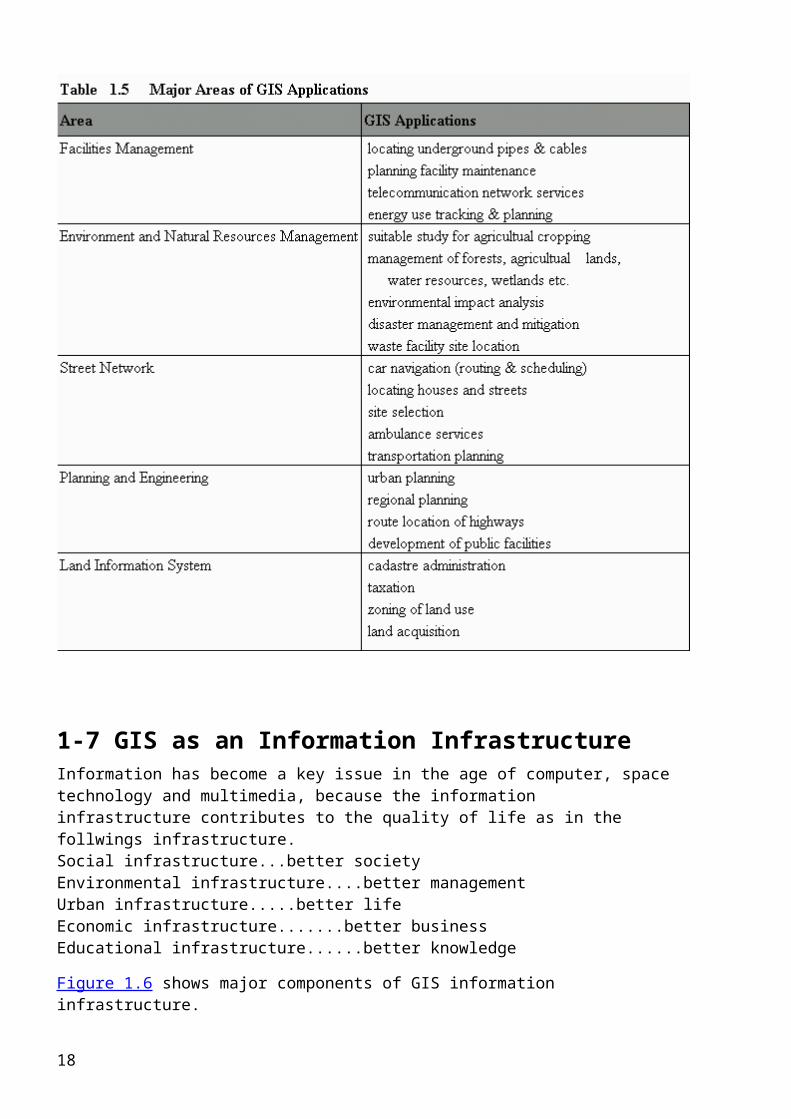
Facilities ManagementLarge scale and precise maps and network analysis are used mainly for utility management. AM/FM is frequently used in this area.
Environment and Natural Resourrces ManagementMedium or small scale maps and overlay techniques in combination with aerial photographs and satellite images are used for management of natural resources and environmental impact analysis.
Street NetworkLarge or medium scale maps and spatial analysis are used for vehicle routing, locating house and streets etc.
Planning and EngineeringLarge or medium scale maps and engineering models are used mainly in civil enginerring.
Land Information SystemLarge scale cadastre maps or land parcel maps and spatial analysis are used for cadastre administration, taxation etc.
Table 1.5 summarizes the major areas of GIS applications.
14
1-7 GIS as an Information Infrastructure
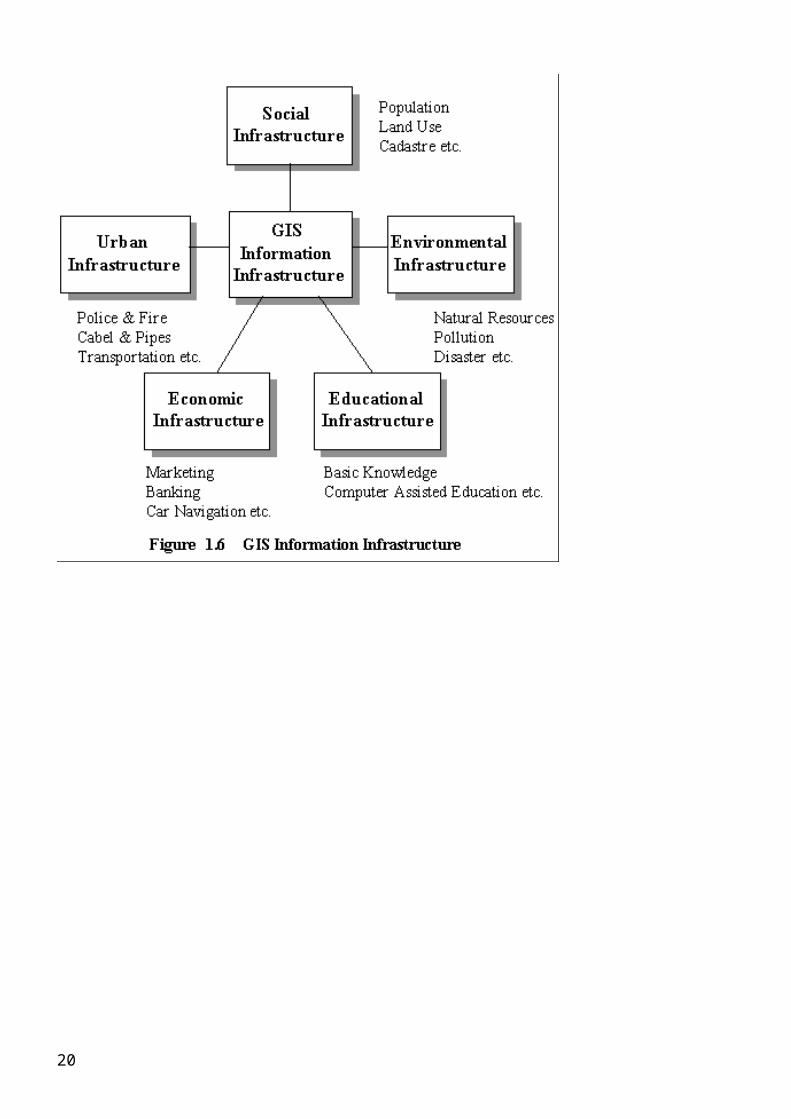
Information has become a key issue in the age of computer, space technology and multimedia, because the information infrastructure contributes to the quality of life as in the follwings infrastructure.Social infrastructure...better societyEnvironmental infrastructure....better managementUrban infrastructure.....better lifeEconomic infrastructure.......better businessEducational infrastructure......better knowledge
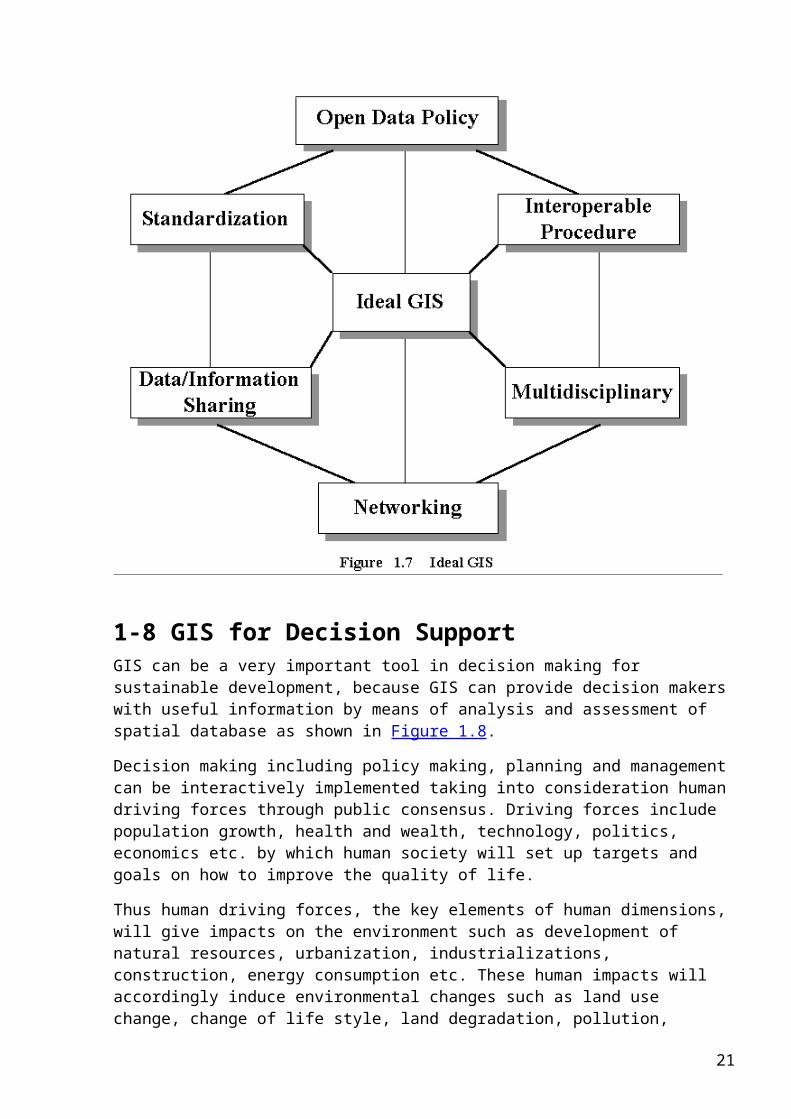
Figure 1.6 shows major components of GIS information infrastructure.In order to achieve the GIS information infrastructure, the following issues should be solved and promoted (see Figure 1.7)
Open data policyGIS data and information should be accessible by any user, freely or at inexpensive costs and without restriction.
15
StandardizationStandards for data format and structure should be developed to enable transfer and exchange of geospatial data.
Data/Information sharingIn order to save cost and time for dizitization, data sharing should be promoted. In order to foster operational use of geospatial data, information and experience should be shared among users.
NetworkingDistributed computer systems as well as databases should be linked to each other to a network for better access as well as better service.
Multi-disciplinary approachBecause GIS is a multi-disciplinary science, scienctists, engineers, technicians and administrators of different fields of study should cooperate with each other to achieve the comman goals.
Interoperable procesureGIS should be interwoven with other proceduces such as CAD, computer graphics, image processing, DEM etc.
16
1-8 GIS for Decision Support
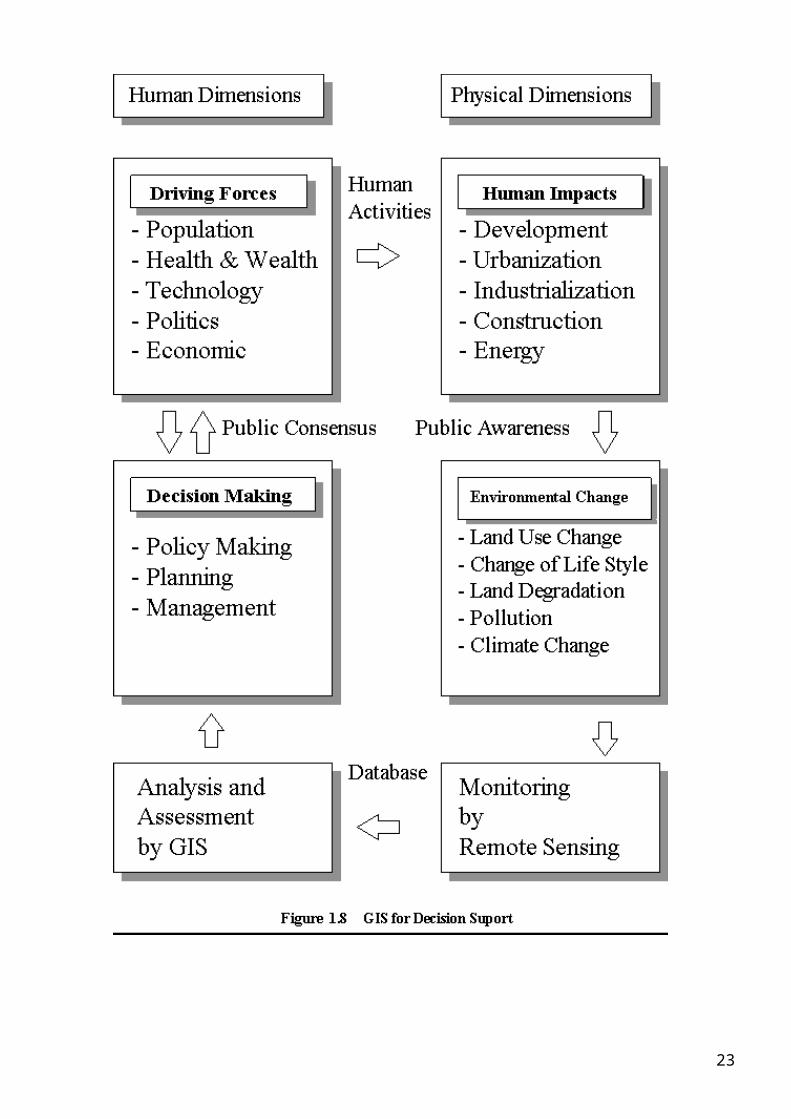
GIS can be a very important tool in decision making for sustainable development, because GIS can provide decision makers with useful information by means of analysis and assessment of spatial database as shown in Figure 1.8.
Decision making including policy making, planning and management can be interactively implemented taking into consideration human driving forces through public consensus. Driving forces include population growth, health and wealth, technology, politics, economics etc. by which human society will set up targets and goals on how to improve the quality of life.
Thus human driving forces, the key elements of human dimensions, will give impacts on the environment such as development of natural resources, urbanization, industrializations, construction, energy consumption etc. These human impacts will accordingly induce environmental changes such as land use change, change of life style, land degradation, pollution, climate change etc. Such environmental change should be timely monitored to increase public awareness. Remote sensing can be very useful for better understanding of relationship between human impacts and the environmental change as well as for building databases.
Physical dimensions monitored by remote sensing can be fed back to human dimensions through analysis and assessment by GIS in order to support better decision. In this sense, remote sensing should be integrated with GIS.
17
Chapter 2 Data Model and Structure
18
2-1 Data Model
The data model represents a set of guidelines to convert the real world (called entity) to the digitally and logically represented spatial objects consisting of the attributes and geometry. The attributes are managed by thematic or semantic structure while the geometry is represented by geometric-topological structure.
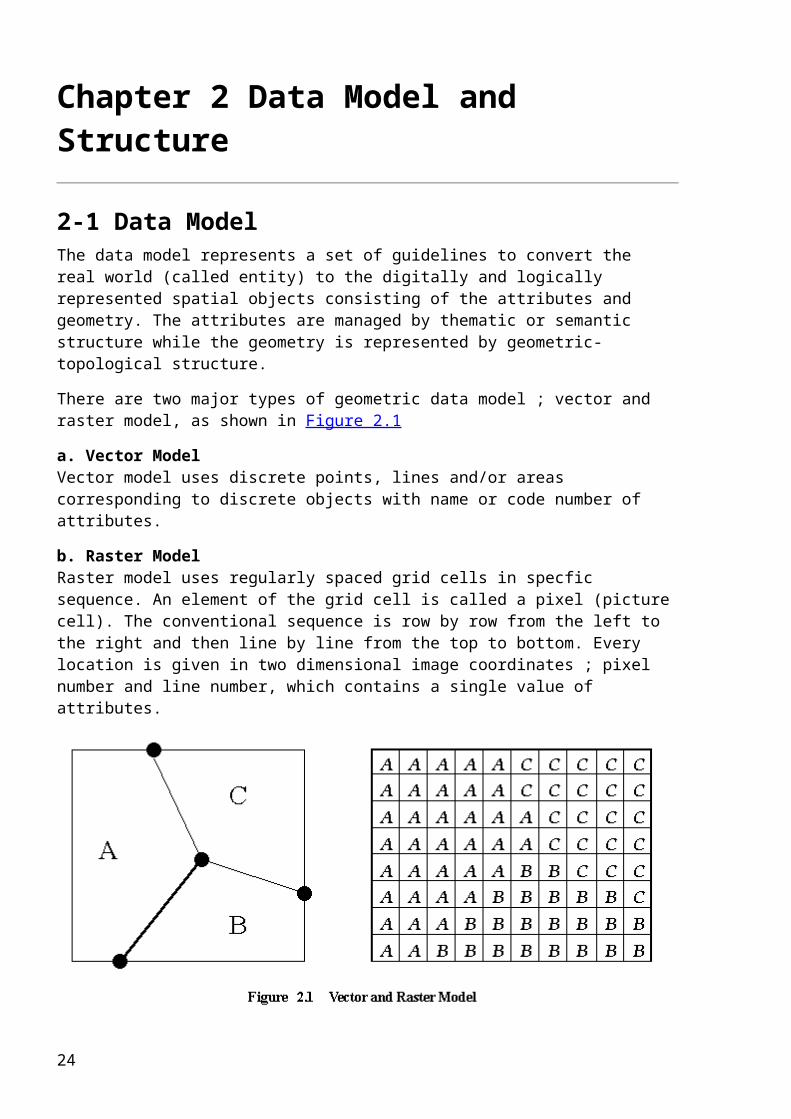
There are two major types of geometric data model ; vector and raster model, as shown in Figure 2.1
a. Vector ModelVector model uses discrete points, lines and/or areas corresponding to discrete objects with name or code number of attributes.
b. Raster ModelRaster model uses regularly spaced grid cells in specfic sequence. An element of the grid cell is called a pixel (picture cell). The conventional sequence is row by row from the left to the right and then line by line from the top to bottom. Every location is given in two dimensional image coordinates ; pixel number and line number, which contains a single value of attributes.
2-2 Geometry and Topology of Vector Data
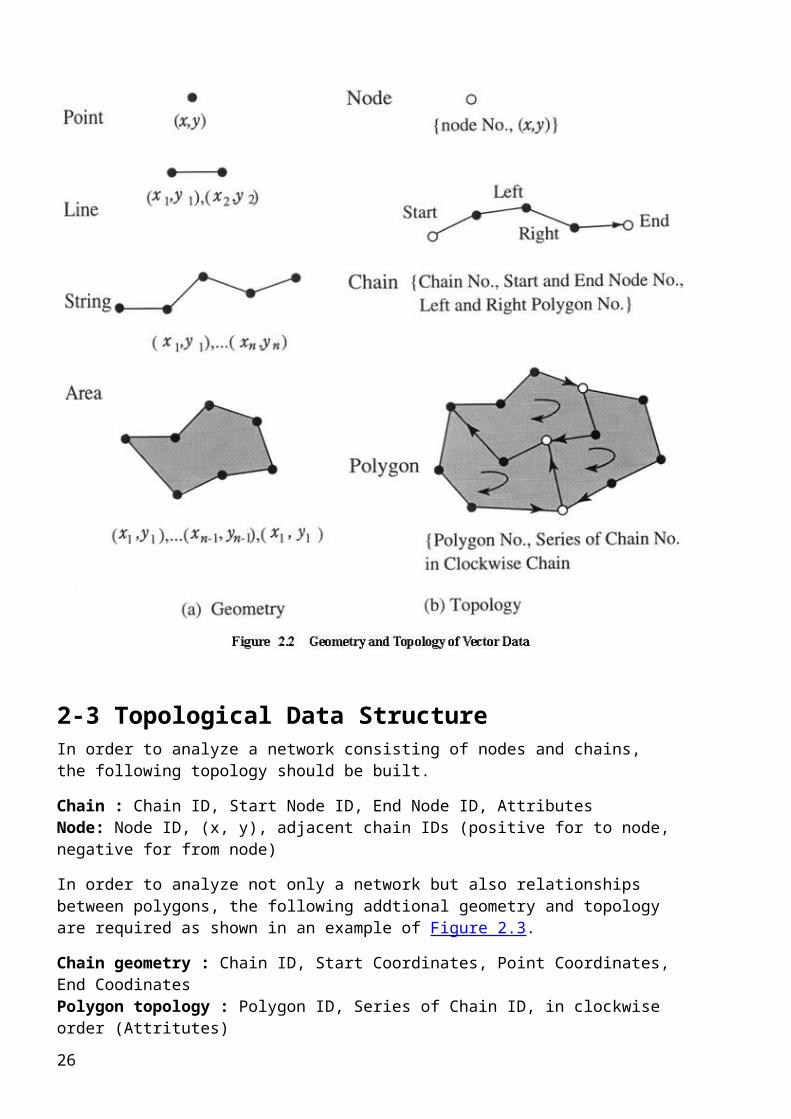
Spatial objects are classfied into point object such as meteorological station, line object such as highway and area object such as agricultural land, which are represented geometrically by point, line and area respectively. For spatial analysis in GIS, only the geometry with the position, shape and size in a coordinate system is not enough but the topology is also required.
Topology refers to the relationships or connectivity between spatial objects.
The geometry of a point is given by two dimensional coordinates (x, y), while line, string and area are given by a series of point coordinates, as shown in Figure 2.2 (a). The topology however defines additional structure as follows (see Figure 2.2 (b)).
Node : an intersect of more than two lines or strings, or start and end point of string with node number
Chain : a line or a string with chain number, start and end node number, left and right neighbored polygons
19
Polygon : an area with polygon number, series of chains that form the area in clockwise order (minus sign is assigned in case of anti-clockwise order).
2-3 Topological Data Structure
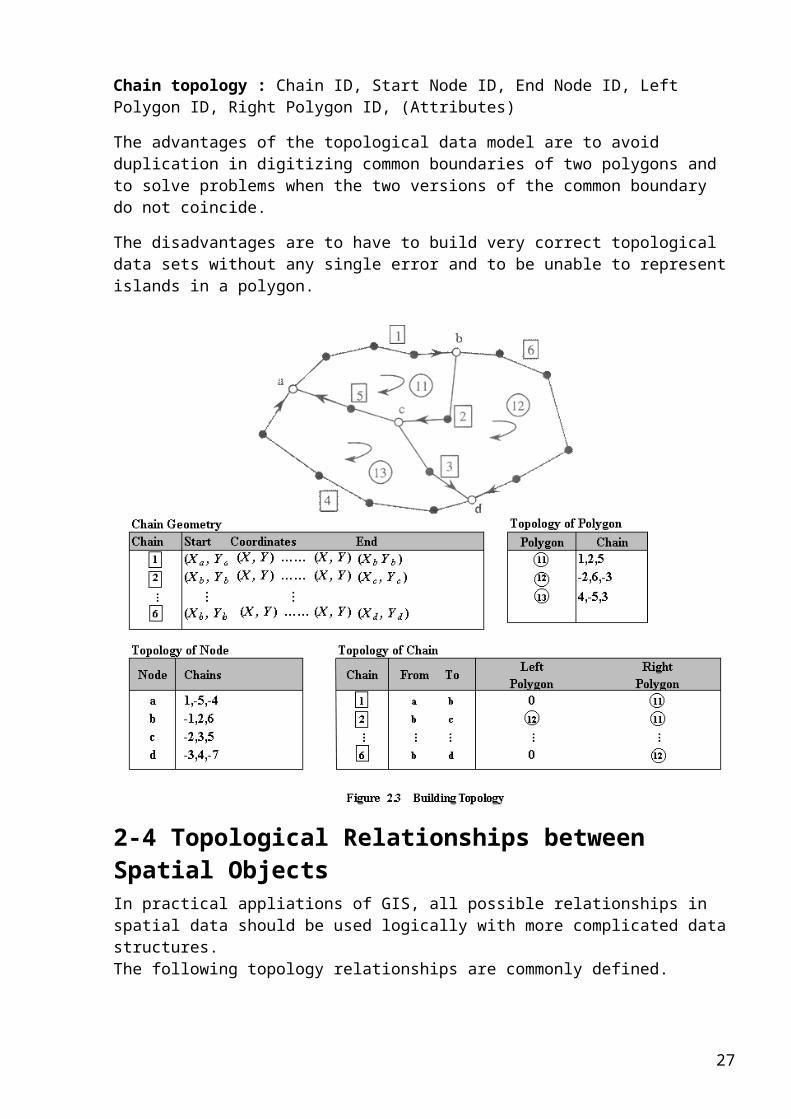
In order to analyze a network consisting of nodes and chains, the following topology should be built.
Chain : Chain ID, Start Node ID, End Node ID, AttributesNode: Node ID, (x, y), adjacent chain IDs (positive for to node, negative for from node)
In order to analyze not only a network but also relationships between polygons, the following addtional geometry and topology are required as shown in an example of Figure 2.3.
Chain geometry : Chain ID, Start Coordinates, Point Coordinates, End CoodinatesPolygon topology : Polygon ID, Series of Chain ID, in clockwise order (Attritutes)
20
Chain topology : Chain ID, Start Node ID, End Node ID, Left Polygon ID, Right Polygon ID, (Attributes)
The advantages of the topological data model are to avoid duplication in digitizing common boundaries of two polygons and to solve problems when the two versions of the common boundary do not coincide.
The disadvantages are to have to build very correct topological data sets without any single error and to be unable to represent islands in a polygon.
2-4 Topological Relationships between Spatial Objects
In practical appliations of GIS, all possible relationships in spatial data should be used logically with more complicated data structures.The following topology relationships are commonly defined.
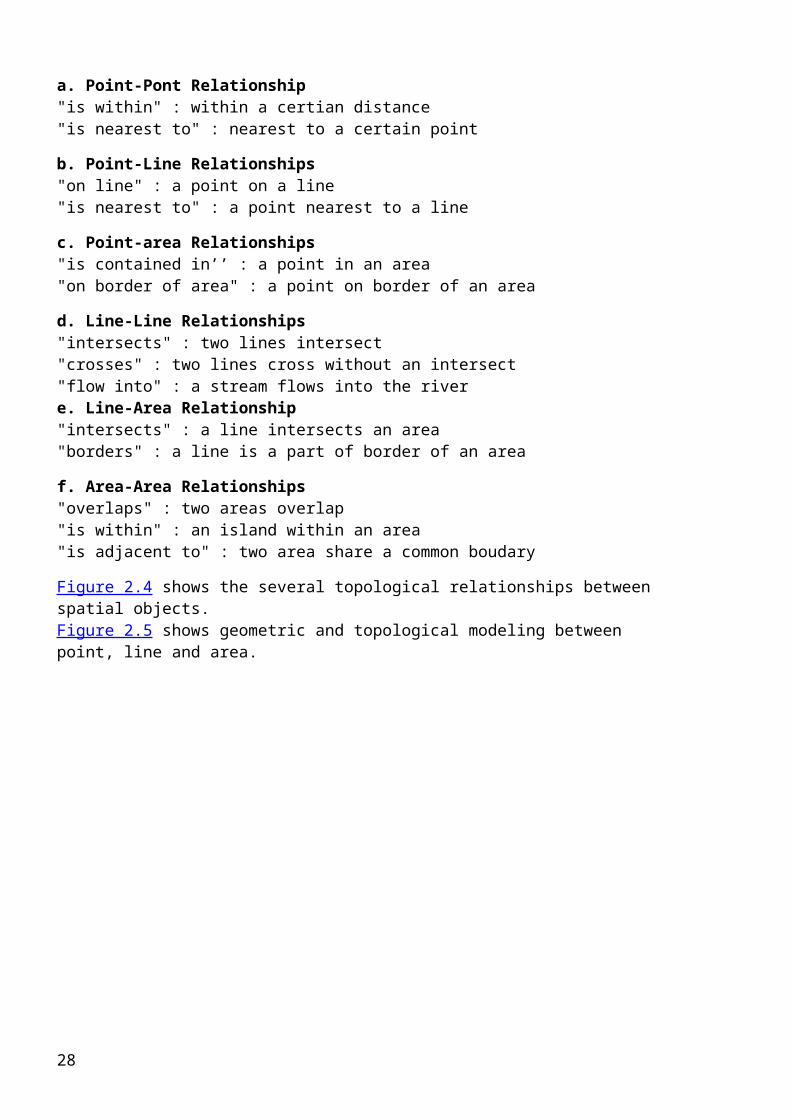
a. Point-Pont Relationship"is within" : within a certian distance"is nearest to" : nearest to a certain point
b. Point-Line Relationships"on line" : a point on a line"is nearest to" : a point nearest to a line
21

c. Point-area Relationships"is contained in’’ : a point in an area"on border of area" : a point on border of an area
d. Line-Line Relationships"intersects" : two lines intersect"crosses" : two lines cross without an intersect"flow into" : a stream flows into the rivere. Line-Area Relationship"intersects" : a line intersects an area"borders" : a line is a part of border of an area
f. Area-Area Relationships"overlaps" : two areas overlap"is within" : an island within an area"is adjacent to" : two area share a common boudary
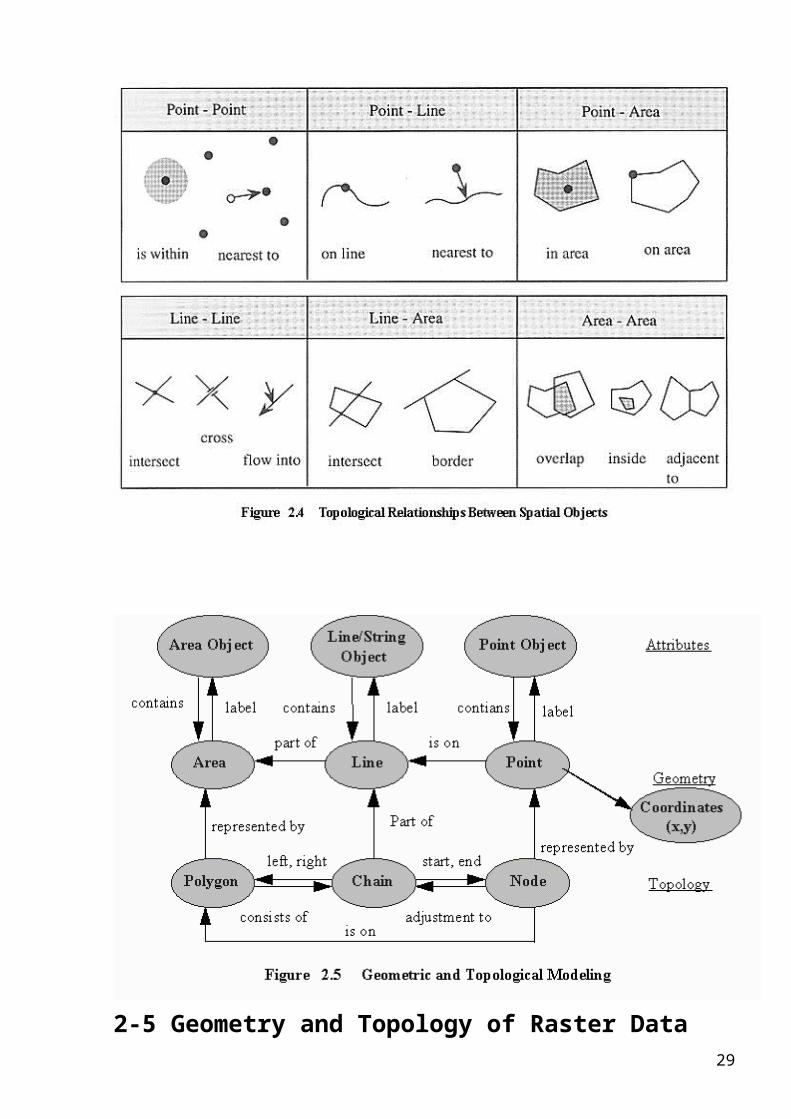
Figure 2.4 shows the several topological relationships between spatial objects.Figure 2.5 shows geometric and topological modeling between point, line and area.
22
2-5 Geometry and Topology of Raster Data
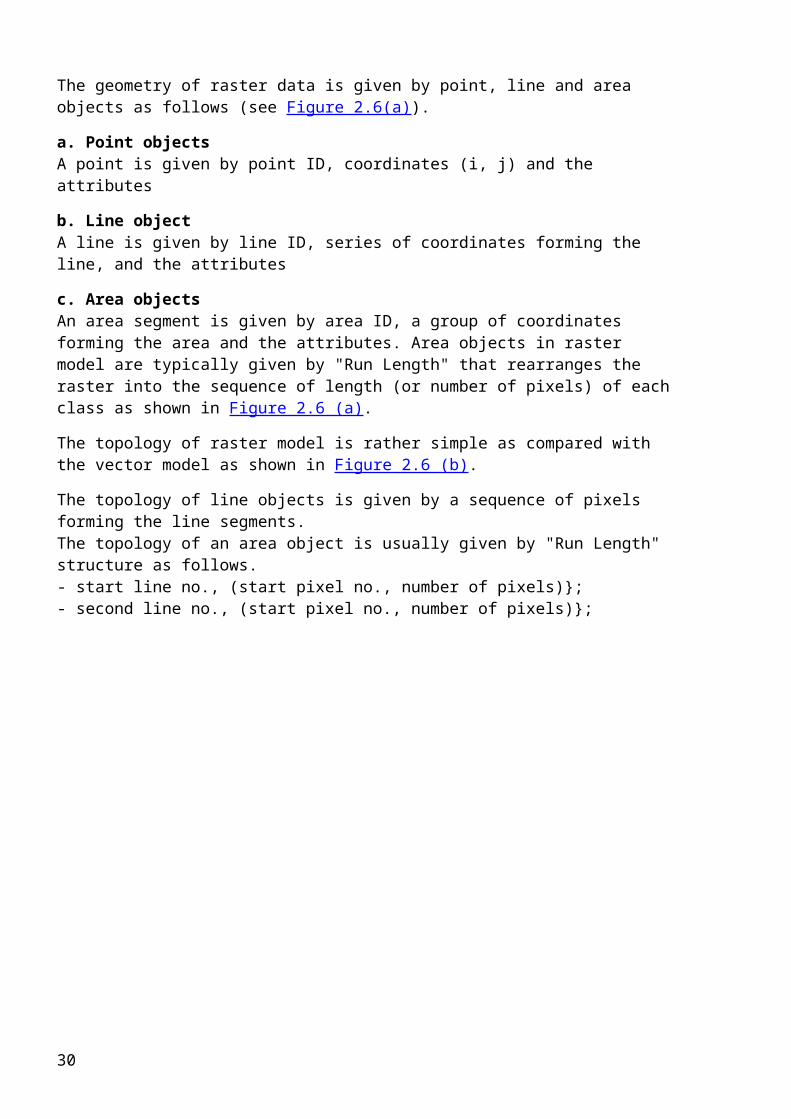
The geometry of raster data is given by point, line and area objects as follows (see Figure 2.6(a)).
a. Point objectsA point is given by point ID, coordinates (i, j) and the attributes
b. Line objectA line is given by line ID, series of coordinates forming the line, and the attributes
c. Area objectsAn area segment is given by area ID, a group of coordinates forming the area and the attributes. Area objects in raster model are typically given by "Run Length" that rearranges the raster into the sequence of length (or number of pixels) of each class as shown in Figure 2.6 (a).
The topology of raster model is rather simple as compared with the vector model as shown in Figure 2.6 (b).
The topology of line objects is given by a sequence of pixels forming the line segments.The topology of an area object is usually given by "Run Length" structure as follows.- start line no., (start pixel no., number of pixels)};- second line no., (start pixel no., number of pixels)};
23
24
2-6 Topological Features of Raster Data
One of the weak points in raster model is the difficulty in network and spatial analysis as compared with vector model.
For example, though a line is easily identified as a group of pixels which form the line, the sequence of connecting pixels as a chain would be a little difficult in tracing. In case of polygons in raster model, each polygon is easily indentified but the boundary and the node (when at least more than three polygons intersect) should be traced or detected.
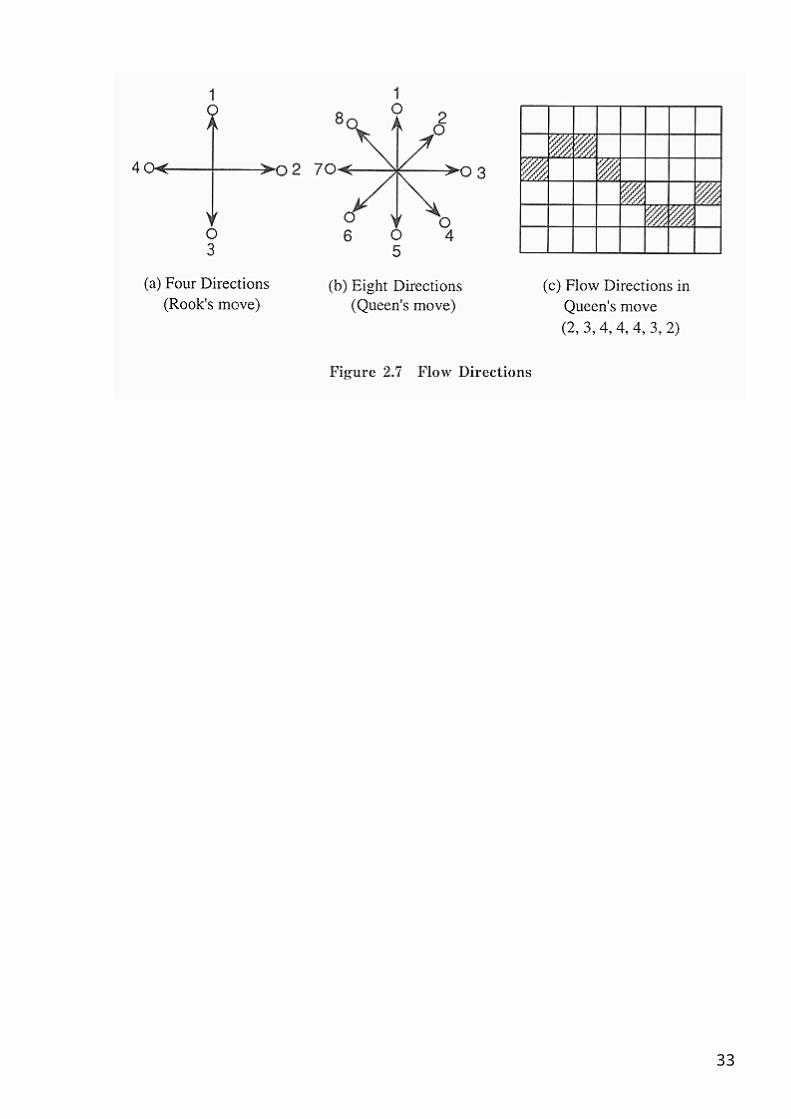
a. Flow directionsA line with directions can be represented by four directions called as the Rook's move in the chess game or eight directions called as the Queenís move, as shown in Figure 2.7 (a) and (b).Figure 2.7 (c) shows an example of flow directions in the Queen's move. Water flow, links of a network, roads etc. can be represented by the flow directions (or called Freeman chain code).
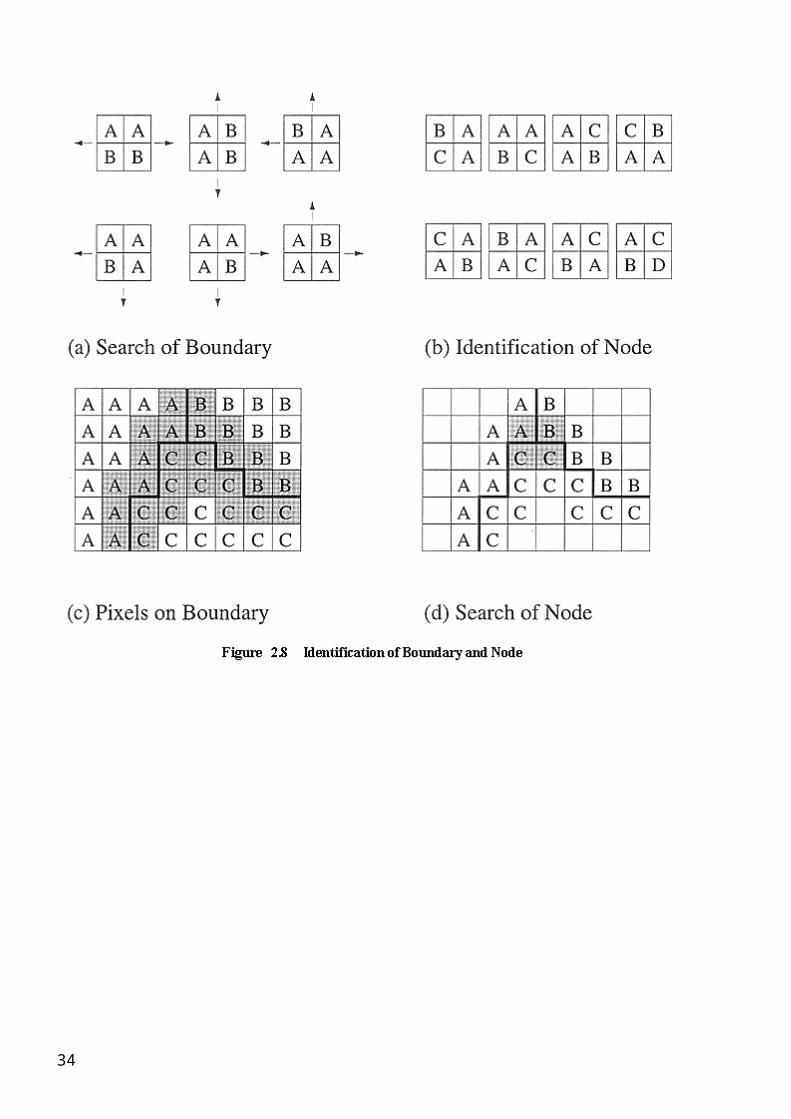
b. Topological Features of Raster DataBoundary is defined as 2 x 2 pixel window that has two different classes as shown in Figure 2.8 (a). If a window is traced in the direction shown in Figure 2.8 (a), the boundary can be indentified.
c. NodeA node in polygon model can be defined as a 2 x 2 window that has more than three different classes as shown inFigure 2.8 (b).Figure 2.8 (c) and (d) show an example of identification of pixels on boundary and node.
25
26
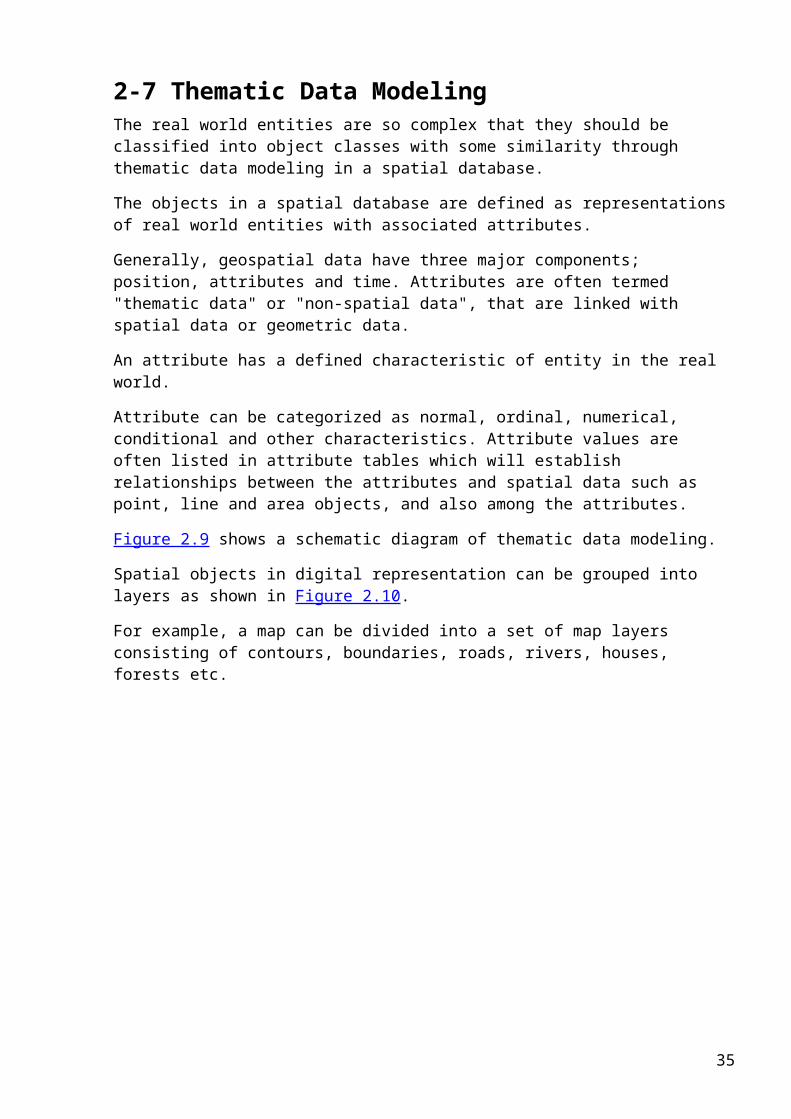
2-7 Thematic Data Modeling
The real world entities are so complex that they should be classified into object classes with some similarity through thematic data modeling in a spatial database.
The objects in a spatial database are defined as representations of real world entities with associated attributes.
Generally, geospatial data have three major components; position, attributes and time. Attributes are often termed "thematic data" or "non-spatial data", that are linked with spatial data or geometric data.
An attribute has a defined characteristic of entity in the real world.
Attribute can be categorized as normal, ordinal, numerical, conditional and other characteristics. Attribute values are often listed in attribute tables which will establish relationships between the attributes and spatial data such as point, line and area objects, and also among the attributes.
Figure 2.9 shows a schematic diagram of thematic data modeling.
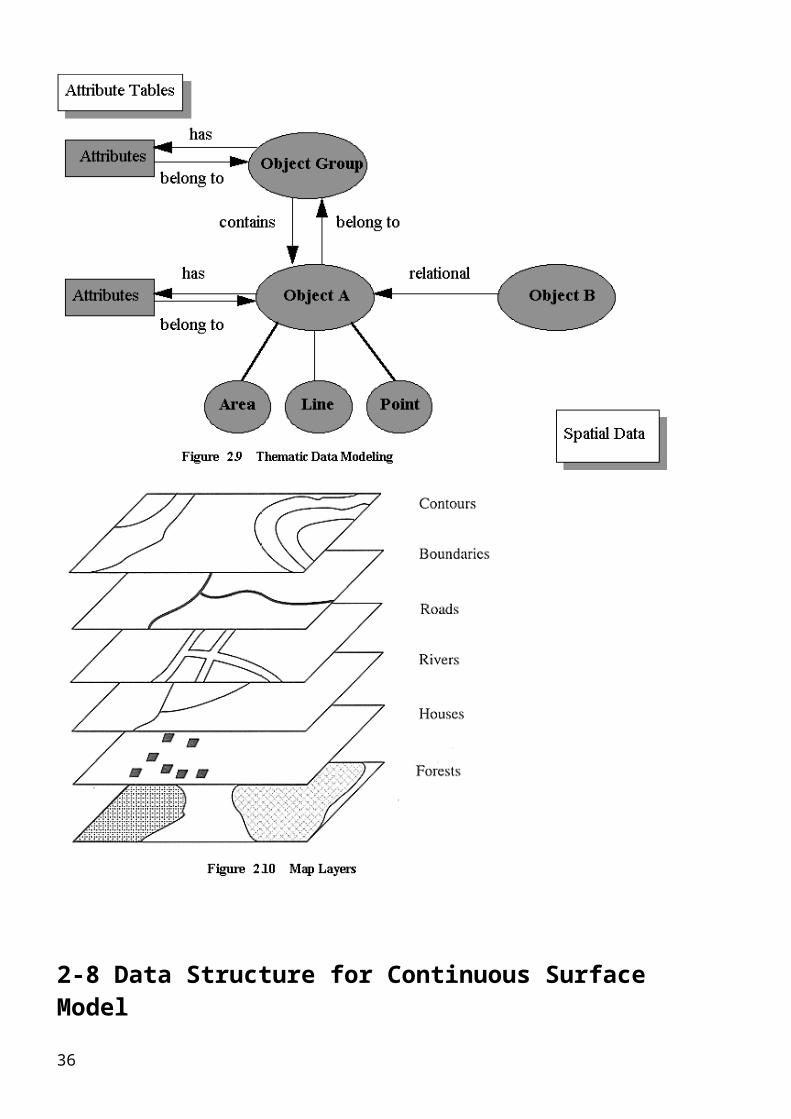
Spatial objects in digital representation can be grouped into layers as shown in Figure 2.10.
For example, a map can be divided into a set of map layers consisting of contours, boundaries, roads, rivers, houses, forests etc.
27
2-8 Data Structure for Continuous Surface Model
In GIS, continuous surface such as terrain surface, meteorolgical observation (rain fall, temperature, pressure etc.) population density and so on should be modeled. As sampling points are observed at discrete interval, a surface model to present the three dimensional shape ; z = f (x, y) should be built to allow the interpolation of value at arbitrary points of interest.
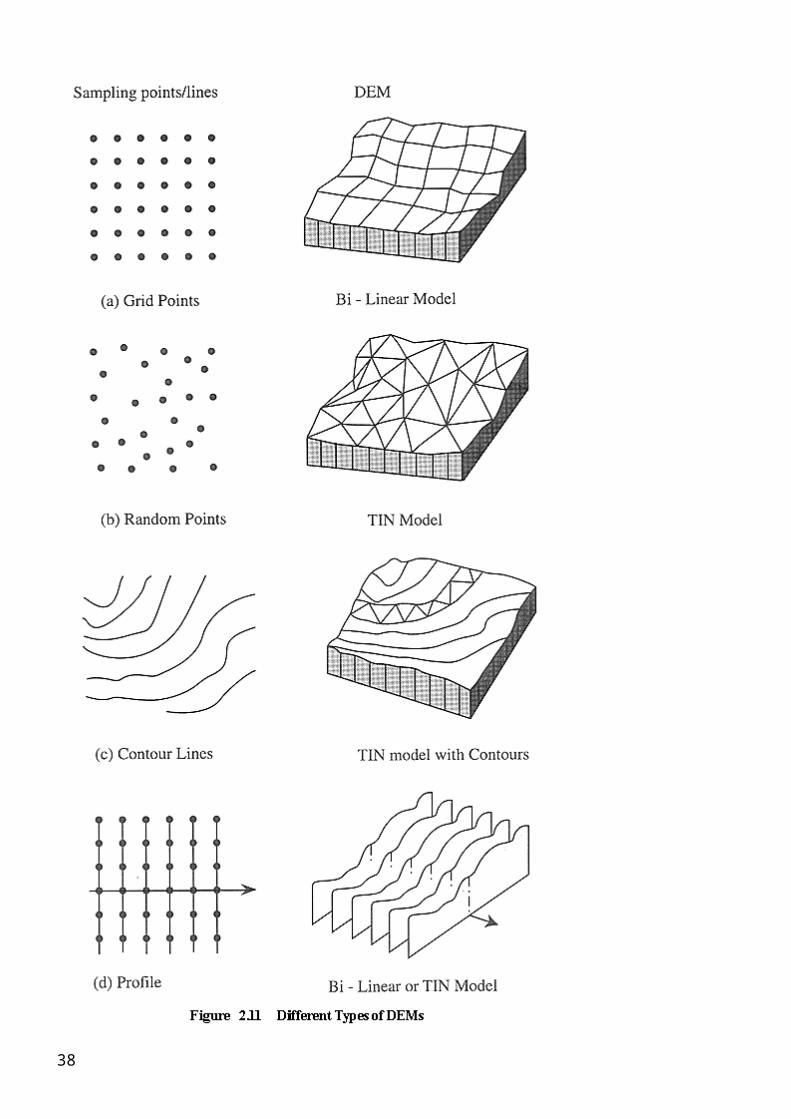
Usually the following four types of sampling point structure are modeled into DEM.
Grid at regular intervals :Bi-linear surface with four points or bi-cubic surface with sixteen points is commonly used
Random points :Triangulated irregular network (TIN) is commonly used. Interpolation by wieghted polynomails is also used.
Contour lines :Interpolation based on proportional distance between adjacent conmtours is used. TIN is also used.
Profile :Profiles are observed perpendicular to an alignment or a curve such as high ways. In case the alignment is a straight line, grid points will be interpolated. In case the alignment is a curve, TIN will be generated.
Figure 2.11 shows different types of DEMs.
28
29
Chapter 3 Input of Geospatial Data
3-1 Required Data Sources for GIS
As data acquisition or data input of geospatial data in digital format is most expensive (about 80% of the total GIS project cost) and procedures are time consuming in GIS, the data sources for data acquisitions should be carefully selected for specific purposes.
The following data sources are widely used.
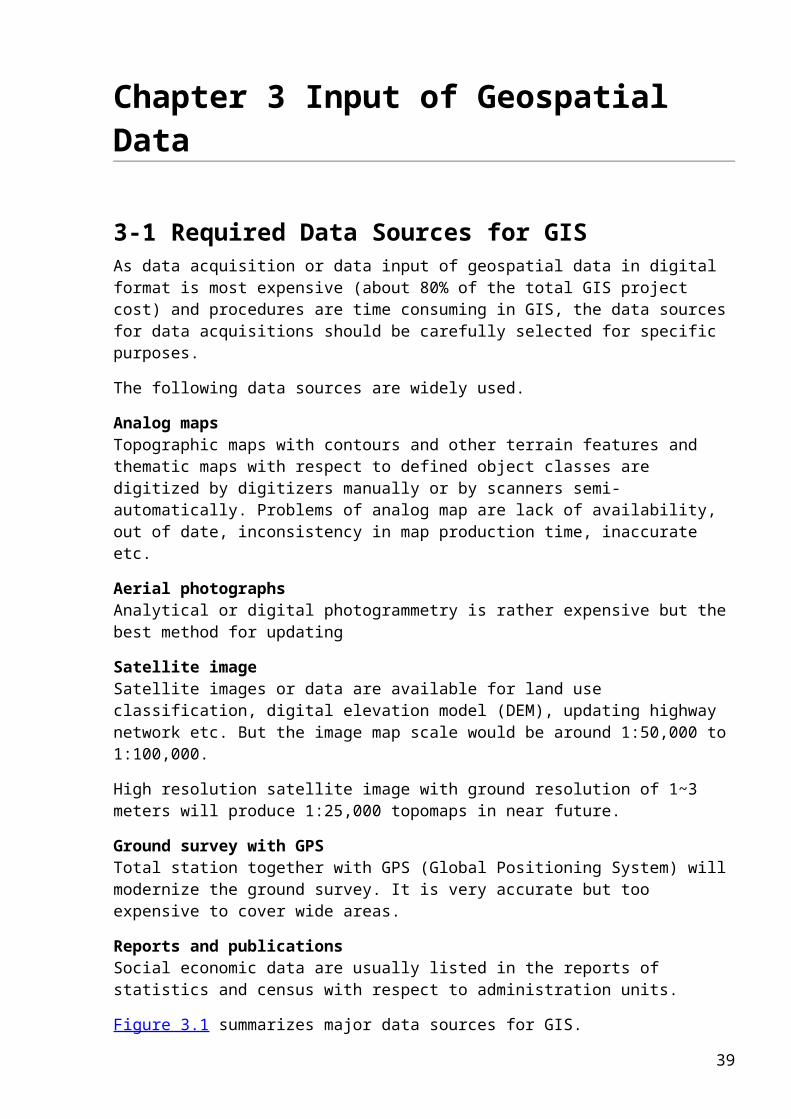
Analog mapsTopographic maps with contours and other terrain features and thematic maps with respect to defined object classes are digitized by digitizers manually or by scanners semi-automatically. Problems of analog map are lack of availability, out of date, inconsistency in map production time, inaccurate etc.
Aerial photographsAnalytical or digital photogrammetry is rather expensive but the best method for updating
Satellite imageSatellite images or data are available for land use classification, digital elevation model (DEM), updating highway network etc. But the image map scale would be around 1:50,000 to 1:100,000.
High resolution satellite image with ground resolution of 1~3 meters will produce 1:25,000 topomaps in near future.
Ground survey with GPSTotal station together with GPS (Global Positioning System) will modernize the ground survey. It is very accurate but too expensive to cover wide areas.
Reports and publicationsSocial economic data are usually listed in the reports of statistics and census with respect to administration units.
Figure 3.1 summarizes major data sources for GIS.
Table 3.1 shows method, equipments, accuracy and cost for different data sources.
30
3-2 Digitizers for Vector Data Input
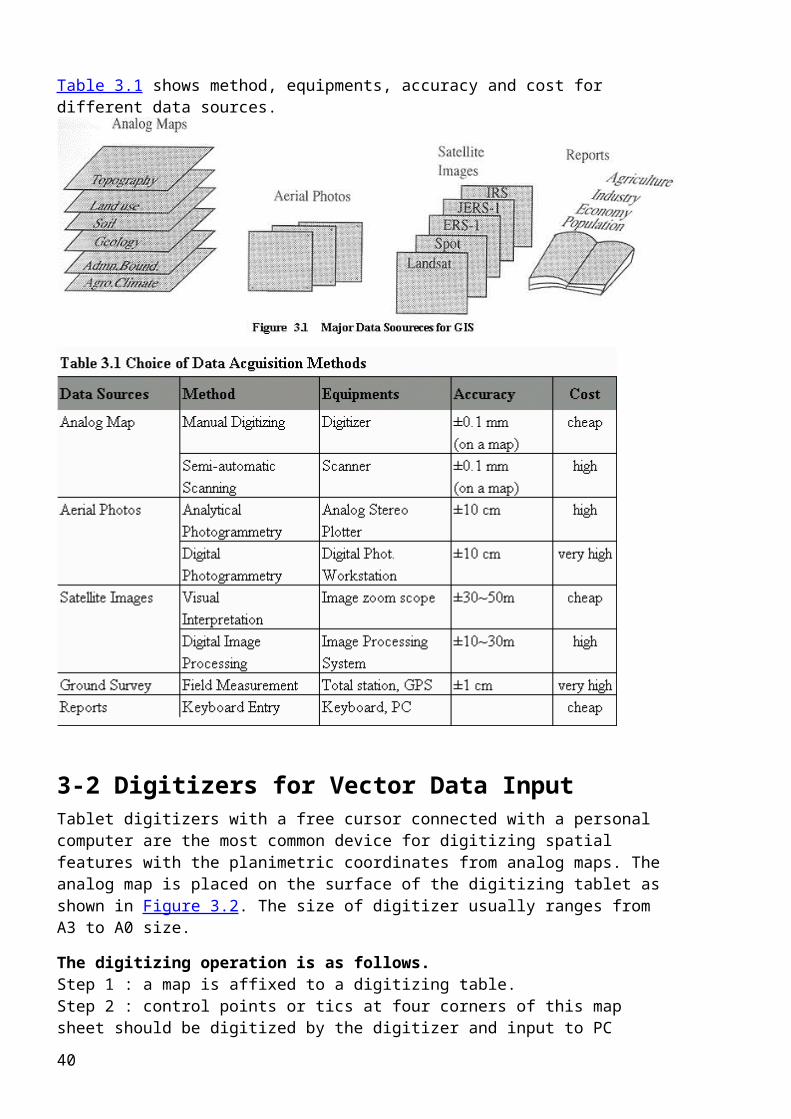
Tablet digitizers with a free cursor connected with a personal computer are the most common device for digitizing spatial features with the planimetric coordinates from analog maps. The analog map is placed on the surface of the digitizing tablet as shown in Figure 3.2. The size of digitizer usually ranges from A3 to A0 size.
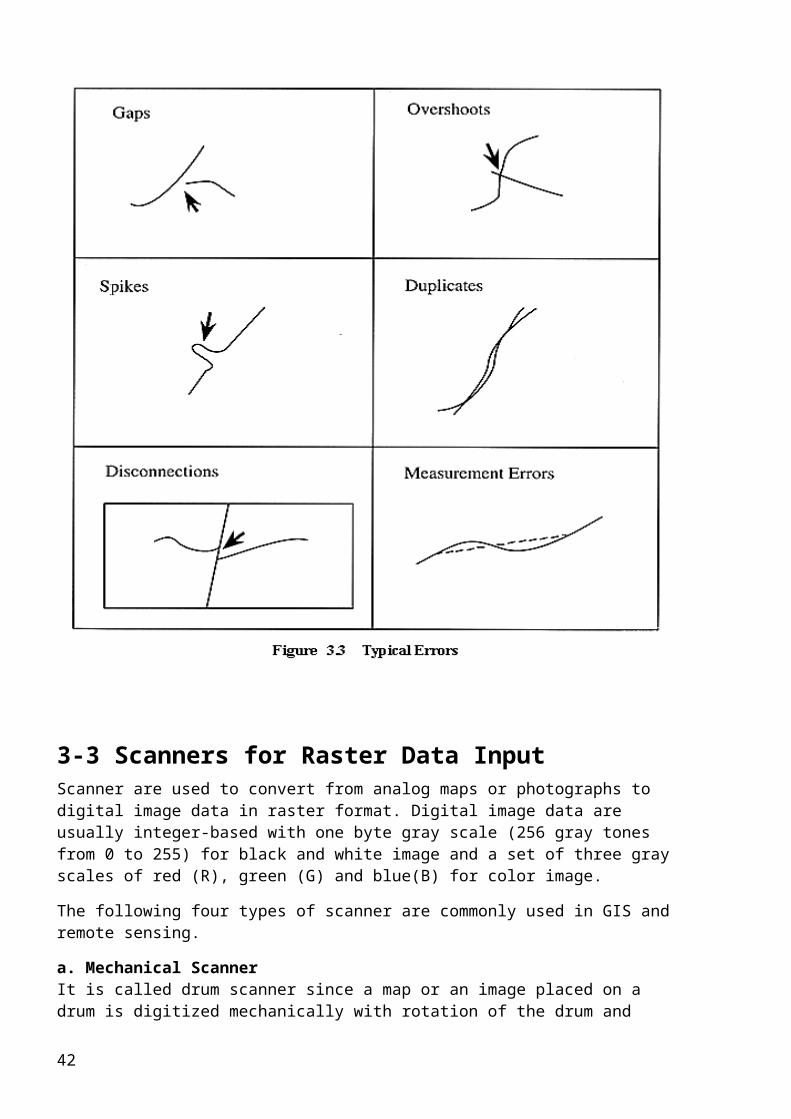
The digitizing operation is as follows.Step 1 : a map is affixed to a digitizing table.Step 2 : control points or tics at four corners of this map sheet should be digitized by the digitizer and input to PC together with the map coordinates of the four corners.Step 3 : map contents are digitized according to the map layers and map code system in either point mode or stream mode at short time interval.Step 4 : editing errors such as small gaps at line junctions, overshoots, duplicates etc. should be made for a clean dataset without errors.Step 5 : conversion from digitizer coordinates to map coordinates to store in a spatial database.
Major problems of map digitization are :- the map will stretch or shrink day by day which makes the newly digitized points slightly off from the previous points.- the map itself has errors- discrepancies across neighboring map sheets will produce disconnectivity.
operators will make a lot of errors and mistakes while digitizing as shown in Figure 3.3.
31
32
3-3 Scanners for Raster Data Input
Scanner are used to convert from analog maps or photographs to digital image data in raster format. Digital image data are usually integer-based with one byte gray scale (256 gray tones from 0 to 255) for black and white image and a set of three gray scales of red (R), green (G) and blue(B) for color image.
The following four types of scanner are commonly used in GIS and remote sensing.
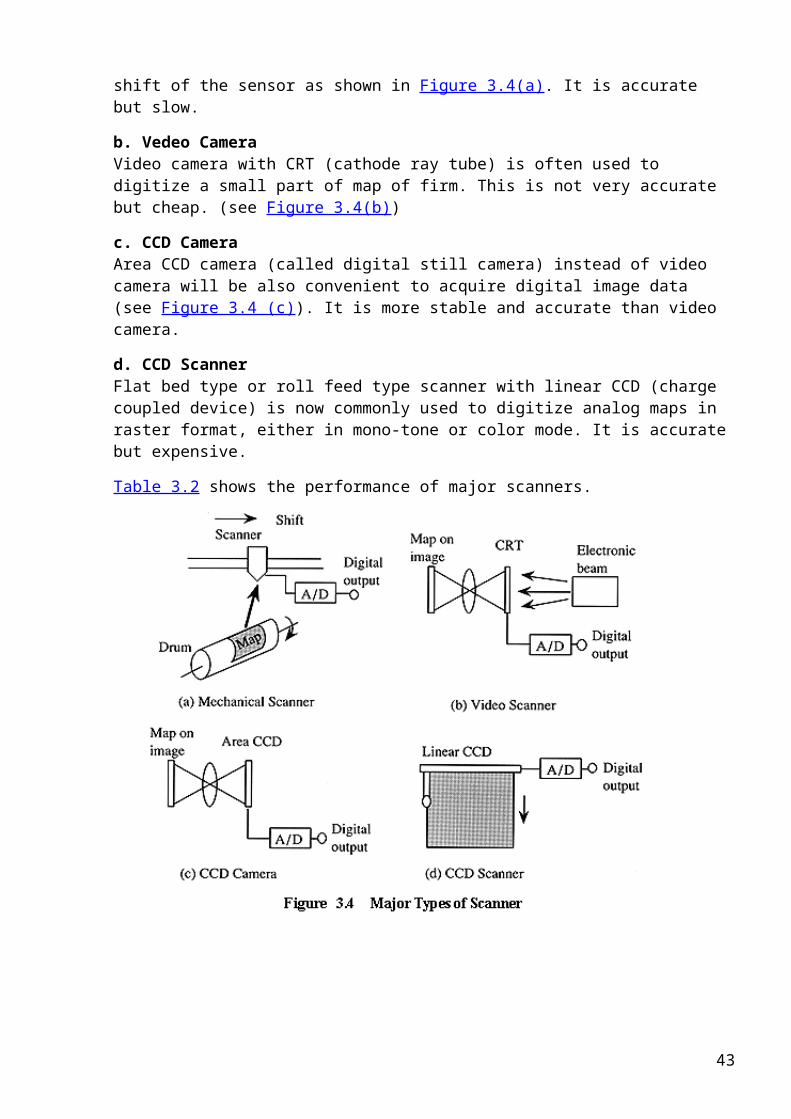
a. Mechanical ScannerIt is called drum scanner since a map or an image placed on a drum is digitized mechanically with rotation of the drum and shift of the sensor as shown in Figure 3.4(a). It is accurate but slow.
b. Vedeo CameraVideo camera with CRT (cathode ray tube) is often used to digitize a small part of map of firm. This is not very accurate but cheap. (see Figure 3.4(b))
c. CCD CameraArea CCD camera (called digital still camera) instead of video camera will be also convenient to acquire digital image data (see Figure 3.4 (c)). It is more stable and accurate than video camera.
d. CCD ScannerFlat bed type or roll feed type scanner with linear CCD (charge coupled device) is now commonly used to digitize analog maps in raster format, either in mono-tone or color mode. It is accurate but expensive.
Table 3.2 shows the performance of major scanners.
33
3-4 Digital Mapping by Aerial Photogrammetry
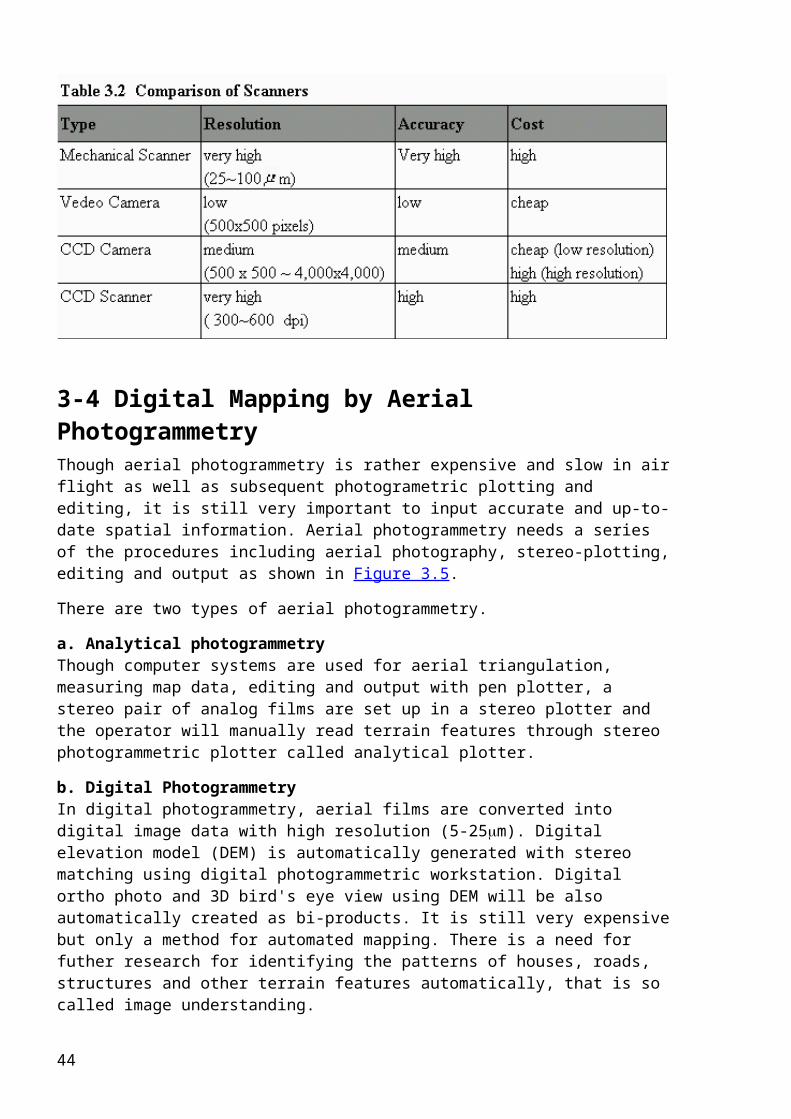
Though aerial photogrammetry is rather expensive and slow in air flight as well as subsequent photogrametric plotting and editing, it is still very important to input accurate and up-to-date spatial information. Aerial photogrammetry needs a series of the procedures including aerial photography, stereo-plotting, editing and output as shown in Figure 3.5.
There are two types of aerial photogrammetry.
a. Analytical photogrammetryThough computer systems are used for aerial triangulation, measuring map data, editing and output with pen plotter, a stereo pair of analog films are set up in a stereo plotter and the operator will manually read terrain features through stereo photogrammetric plotter called analytical plotter.
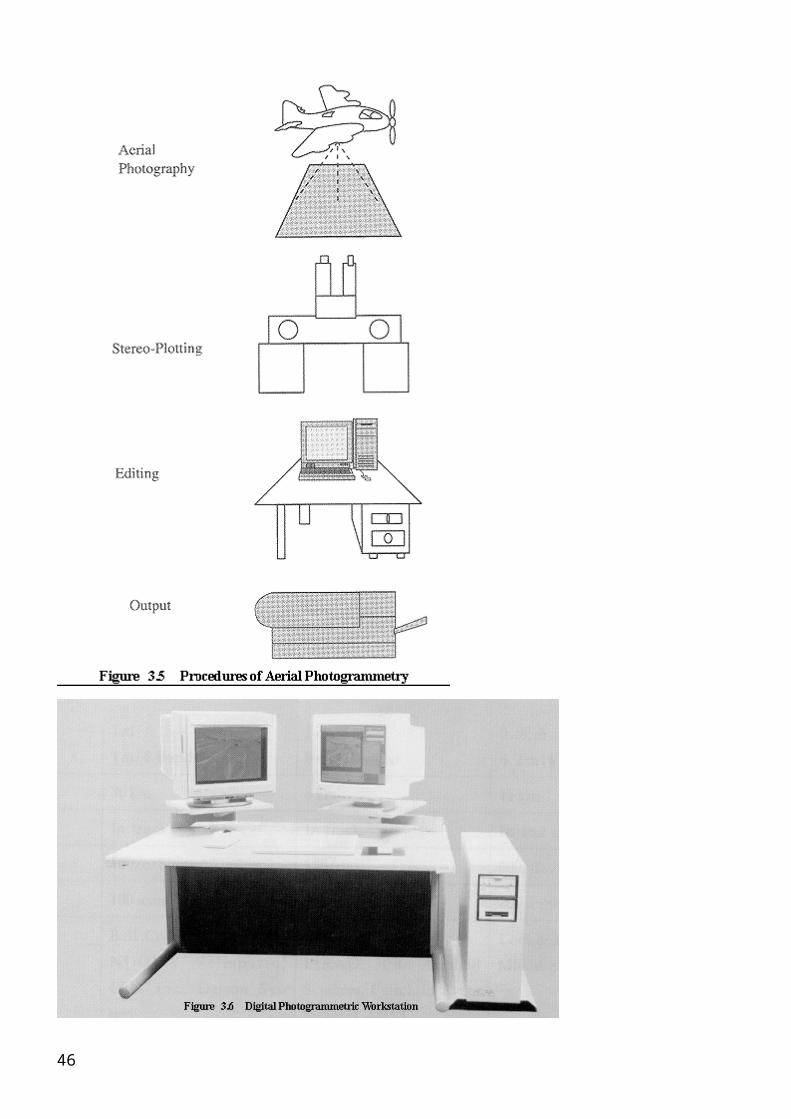
b. Digital PhotogrammetryIn digital photogrammetry, aerial films are converted into digital image data with high resolution (5-25m). Digital elevation model (DEM) is automatically generated with stereo matching using digital photogrammetric workstation. Digital ortho photo and 3D bird's eye view using DEM will be also automatically created as bi-products. It is still very expensive but only a method for automated mapping. There is a need for futher research for identifying the patterns of houses, roads, structures and other terrain features automatically, that is so called image understanding.
Figure 3.6 shows a digital photogrammetric workstation.
34
35
3-5 Remote Sensing with Satellite Imagery
Satellite remote sensing is a modern technology to obtain digital image data of the terrain surface in the eletro-magnetic region of visible, infrared and microwave.
Multi-spectral bands including visible, near-infrared and/or thermal infrared are most commonly used for production of land use map, soil map, geological map, agricultureal map, forest map etc. at the scale of 1:50,000 ~ 250,000. A lot of earth observation satellites for example landsat, SPOT, ERS-1, JERS-1, IRS, Radarsat etc. are available.
Synthetic aperture radar (SAR) is now becoming a new technology in remote sensing because SAR can penetrate through clouds, which enables cloud free imagery in all weather conditions.
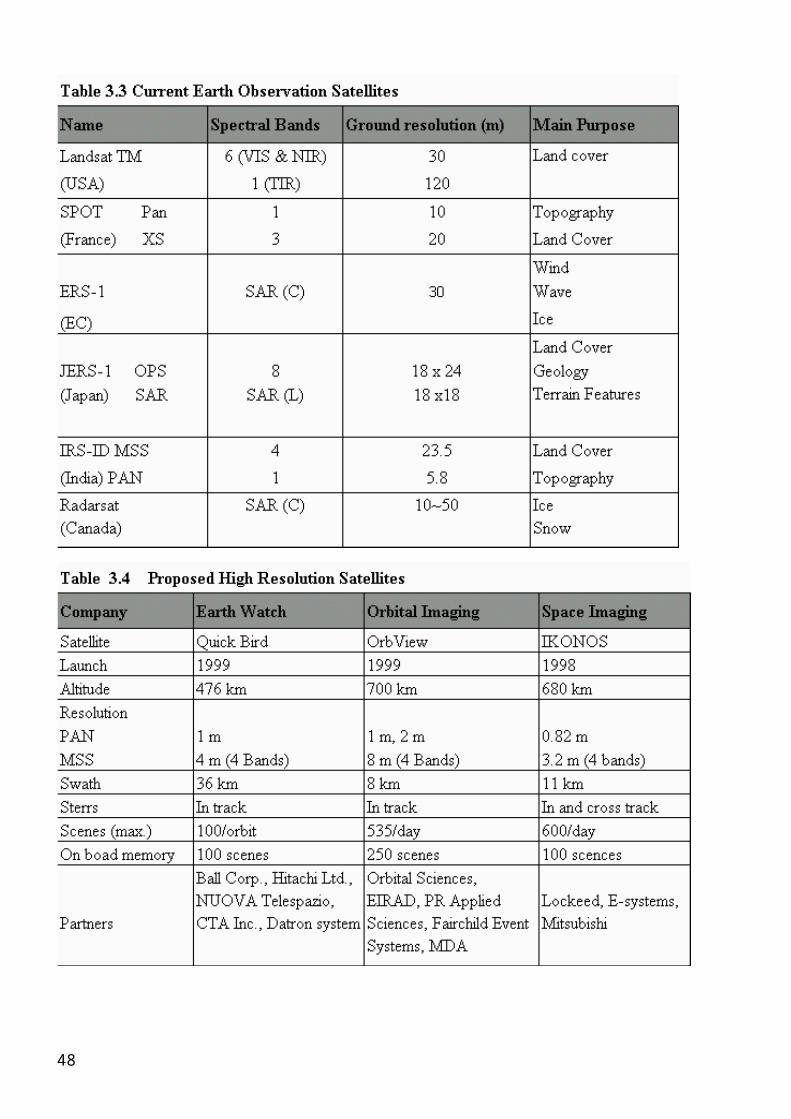
Satellite images have different ground resolutions depending on the sensors used as listed in Table 3.3.
Since the cold war was over in 1990's, very high resolution satellite imagery with ground resolution of 1 to 3 meters will become available from 1998. Such high resolution satellite images are expected to identify individual houses in urban area. Table 3.4 shows high resolution satellites proposed to be launched by three US commercial companies.
The high resolution satellite images are highly expected to apply to urban GIS.
36
3-6 Rasterization
Conversion between raster and vector data is very useful in practical applications of GIS. Rasterization refers to conversion from vector to raster data. Raster format is more convennient to produce color coded polygon maps such as color coded land use map, while map digitizing in vector format is more easier to trace only the boundary. Rasterization is also useful to integrate GIS with remote sensing becaues remote sensing images are in raster format.
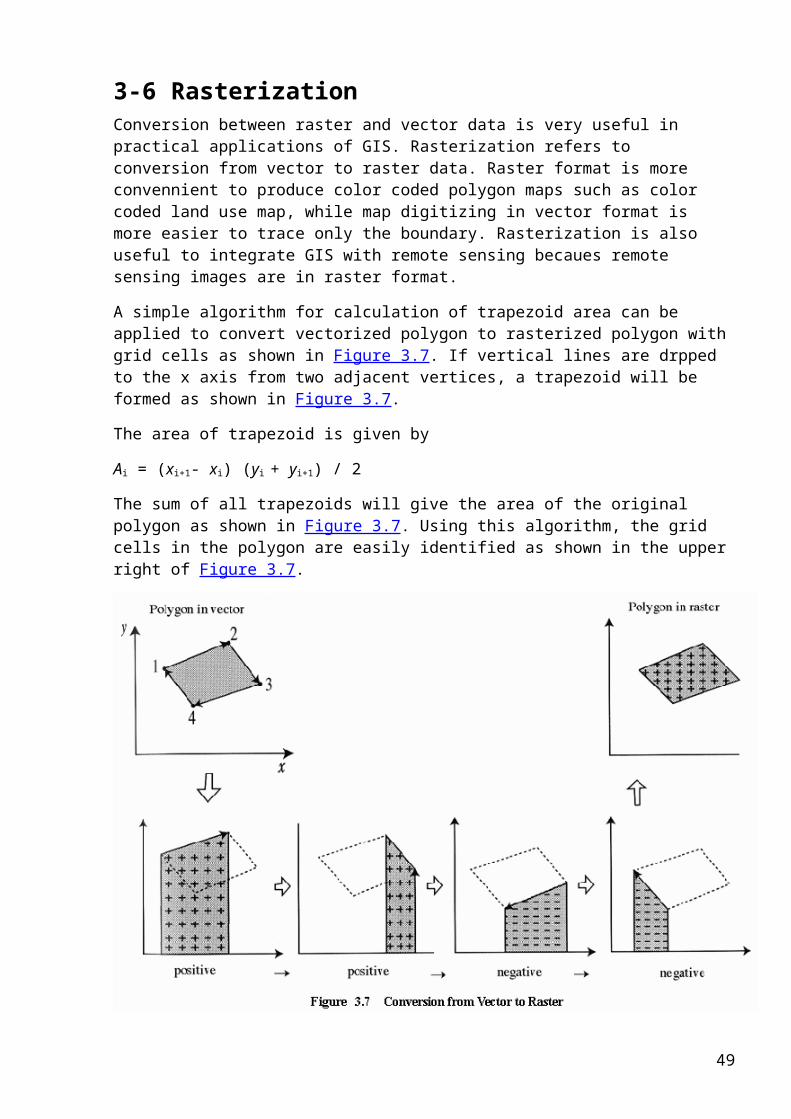
A simple algorithm for calculation of trapezoid area can be applied to convert vectorized polygon to rasterized polygon with grid cells as shown in Figure 3.7. If vertical lines are drpped to the x axis from two adjacent vertices, a trapezoid will be formed as shown in Figure 3.7.
The area of trapezoid is given by
Ai = (xi+1- xi) (yi + yi+1) / 2
The sum of all trapezoids will give the area of the original polygon as shown in Figure 3.7. Using this algorithm, the grid cells in the polygon are easily identified as shown in the upper right of Figure 3.7.
37
3-7 Vectorization
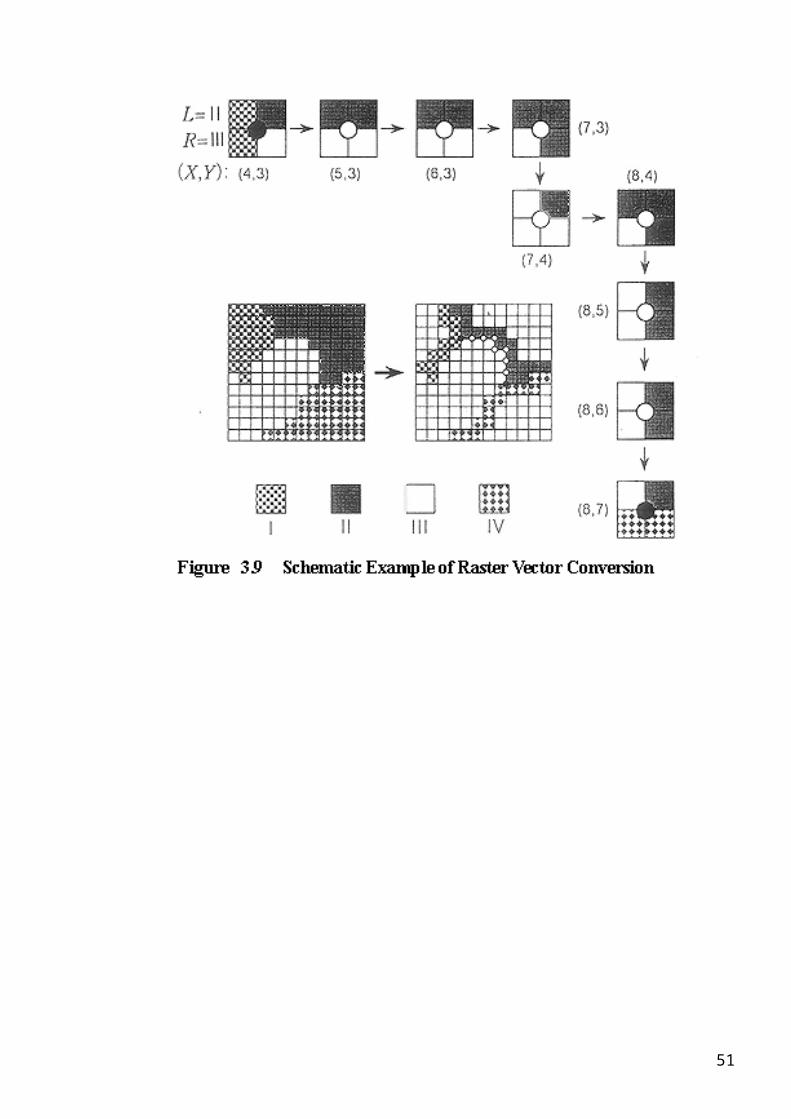
Vectorization refers to conversion from raster to vector data, which is often called raster vector conversion. Vectorization is not very easy as compared with rasterization, because vector format needs topological structure, for example, direction of line or chain, boundaris and nodes of polygons, order of series of chains that form a polygon, left and right polygons ID of a chain and so on.
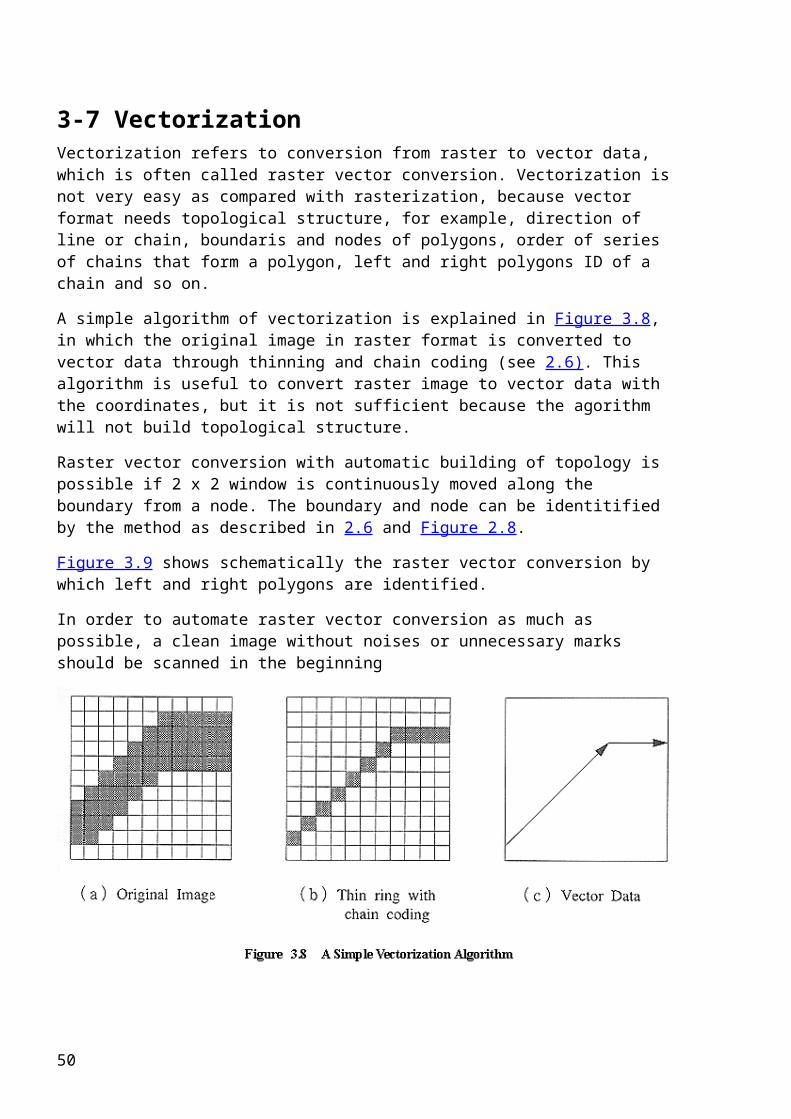
A simple algorithm of vectorization is explained in Figure 3.8, in which the original image in raster format is converted to vector data through thinning and chain coding (see 2.6). This algorithm is useful to convert raster image to vector data with the coordinates, but it is not sufficient because the agorithm will not build topological structure.
Raster vector conversion with automatic building of topology is possible if 2 x 2 window is continuously moved along the boundary from a node. The boundary and node can be identitified by the method as described in 2.6 and Figure 2.8.
Figure 3.9 shows schematically the raster vector conversion by which left and right polygons are identified.
In order to automate raster vector conversion as much as possible, a clean image without noises or unnecessary marks should be scanned in the beginning
38
39
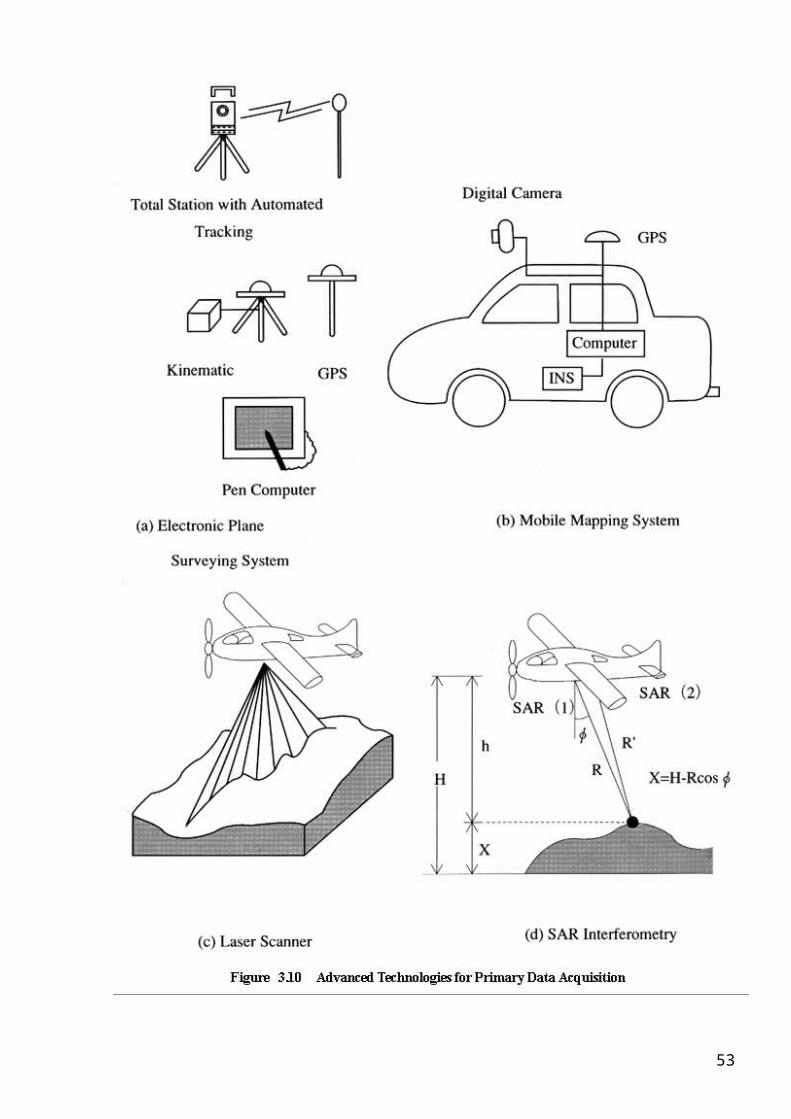
3-8 Advanced Technologies for Primary Data Acquisition
Several advanced technologies have become available for primary data acquisition of geospatial data as well as digital elevation model (DEM).
Following advanced technologies will be useful for future GIS.
a. Electronic Plane Surveying SystemAn integrated system of total station with automated tracking function, kinematic global positioning system (GPS) and a pen computer (see Figure 3.10 (a)) will replace the conventional plane surveying. Direct data acquisition in digital form, at the field site will be very useful for large scale GIS data set, for example in the application to cadastre, utility facilities, urban structures etc.
b. Mobile Mapping SystemDifferent sensors such as GPS, INS (inertia navigation system), more than two digital cameras, voice recorder etc. are fixed on a vehicle as shown in Figure 3.10 (b) in order to map objects in close range. For example center line of highways, utility lines, railways etc. as well as to determine trajectory of the moving vehicle.
c. Laser ScannerAirborne laser scanner together with GPS and INS will measure directly the terrain releif or DEM as shown in Figure 3.10 (c) with the height accuracy of 10 cm up to the altitude of 1,000 m.
d. SAR InterferometrySAR (synthetic apperture radar) inter-ferometry is a new technology to produce DEM automatically by special interferometric processing of a pair of SAR images. Airborne and space borne SAR interferometry are now available if the inter-ferometric condition meets the standard
40
41
Chapter 4 Spatial Database
4-1 Concept of Spatial Database
A spatial database is defined as a collection of inter-related geodspatial data, that can handle and maintain a large amout of data which is shareable between different GIS applications.
Required functions of a spatial database are as follows.
- consistency with little or no redundancy- maintenance of data quality including updating- self descriptive with metadata- high performance by database mangement system with database langauage- security including access control
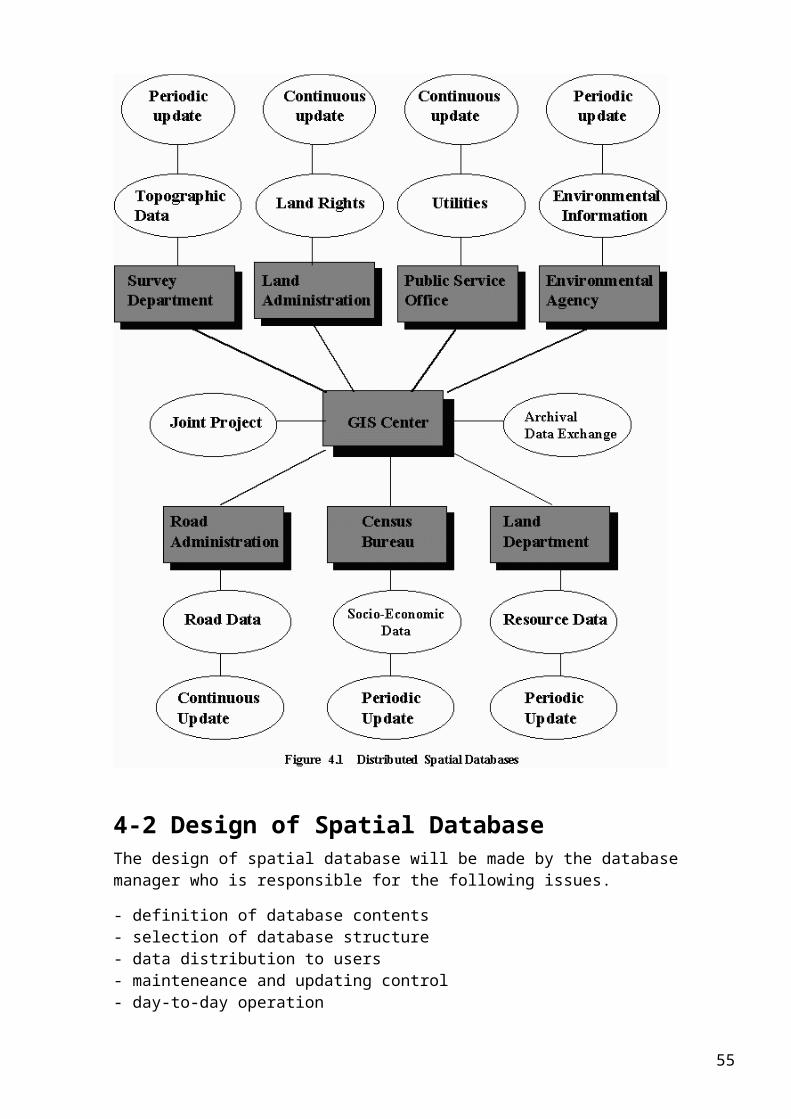
In 1980's, GIS institution was centralized with a centralized spatial database. But in 1990's, the network concept arose, whice will be more convenient to meet user needs with distributed databases as shown in Figure 4.1. Such distributed databases in a network structure have the following benefits.
- better data storage and updating- more efficient retrieval- more efficient output
42
4-2 Design of Spatial Database
The design of spatial database will be made by the database manager who is responsible for the following issues.
- definition of database contents- selection of database structure- data distribution to users- mainteneance and updating control- day-to-day operation
For the design of detail items, the following parameters should be well designed.
43
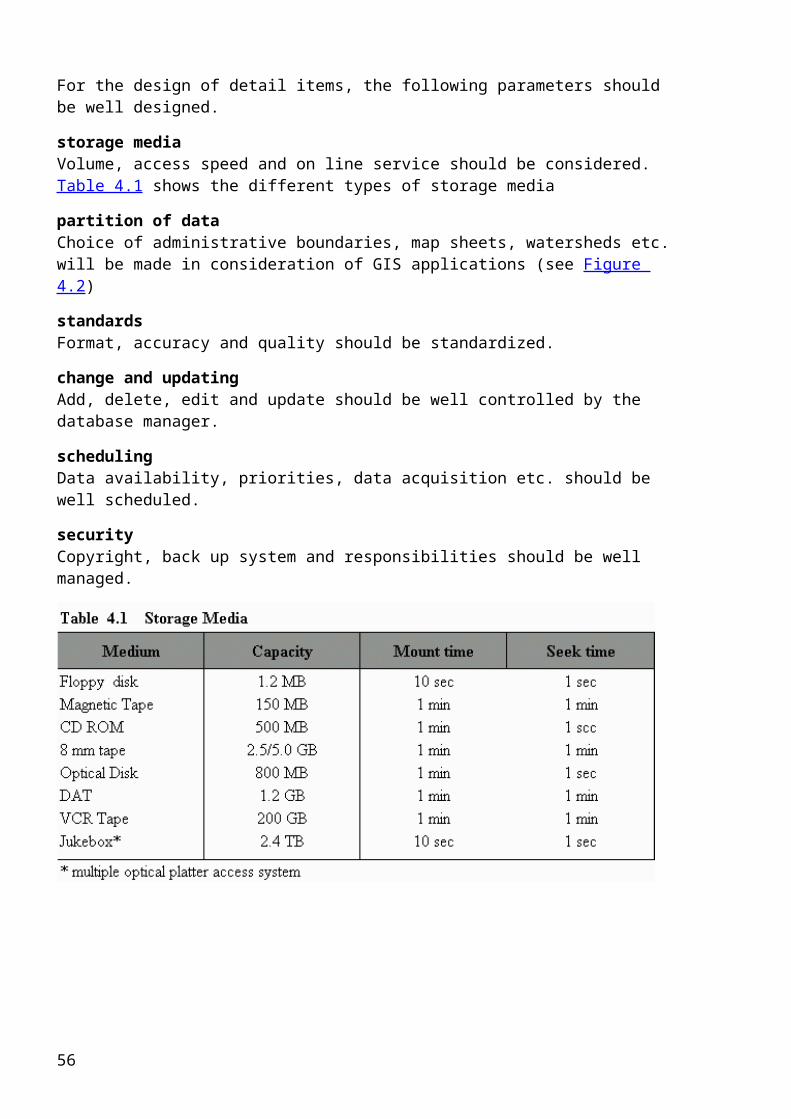
storage mediaVolume, access speed and on line service should be considered. Table 4.1 shows the different types of storage media
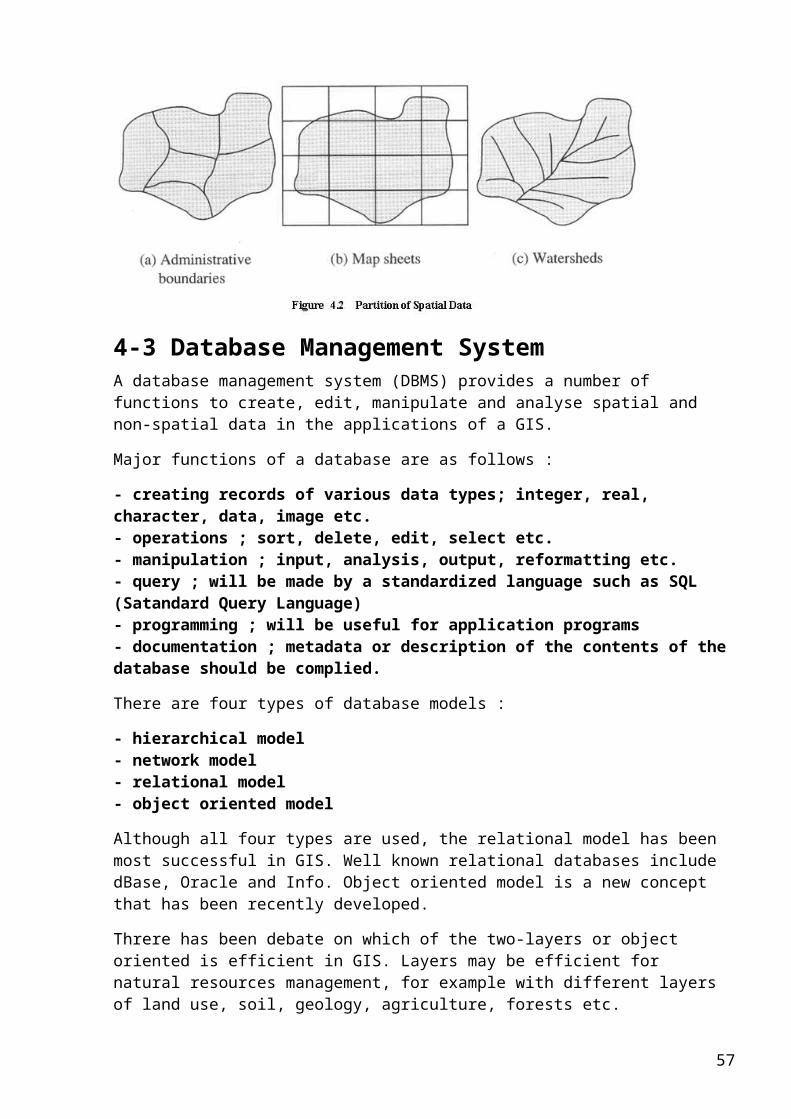
partition of dataChoice of administrative boundaries, map sheets, watersheds etc. will be made in consideration of GIS applications (see Figure 4.2)
standardsFormat, accuracy and quality should be standardized.
change and updatingAdd, delete, edit and update should be well controlled by the database manager.
schedulingData availability, priorities, data acquisition etc. should be well scheduled.
securityCopyright, back up system and responsibilities should be well managed.
4-3 Database Management System
A database management system (DBMS) provides a number of functions to create, edit, manipulate and analyse spatial and non-spatial data in the applications of a GIS.
44

Major functions of a database are as follows :
- creating records of various data types; integer, real, character, data, image etc.- operations ; sort, delete, edit, select etc.- manipulation ; input, analysis, output, reformatting etc.- query ; will be made by a standardized language such as SQL (Satandard Query Language)- programming ; will be useful for application programs- documentation ; metadata or description of the contents of the database should be complied.
There are four types of database models :
- hierarchical model- network model- relational model- object oriented model
Although all four types are used, the relational model has been most successful in GIS. Well known relational databases include dBase, Oracle and Info. Object oriented model is a new concept that has been recently developed.
Threre has been debate on which of the two-layers or object oriented is efficient in GIS. Layers may be efficient for natural resources management, for example with different layers of land use, soil, geology, agriculture, forests etc.
On the other hand object orientation may be more convenient for facility management with grouped attributes.
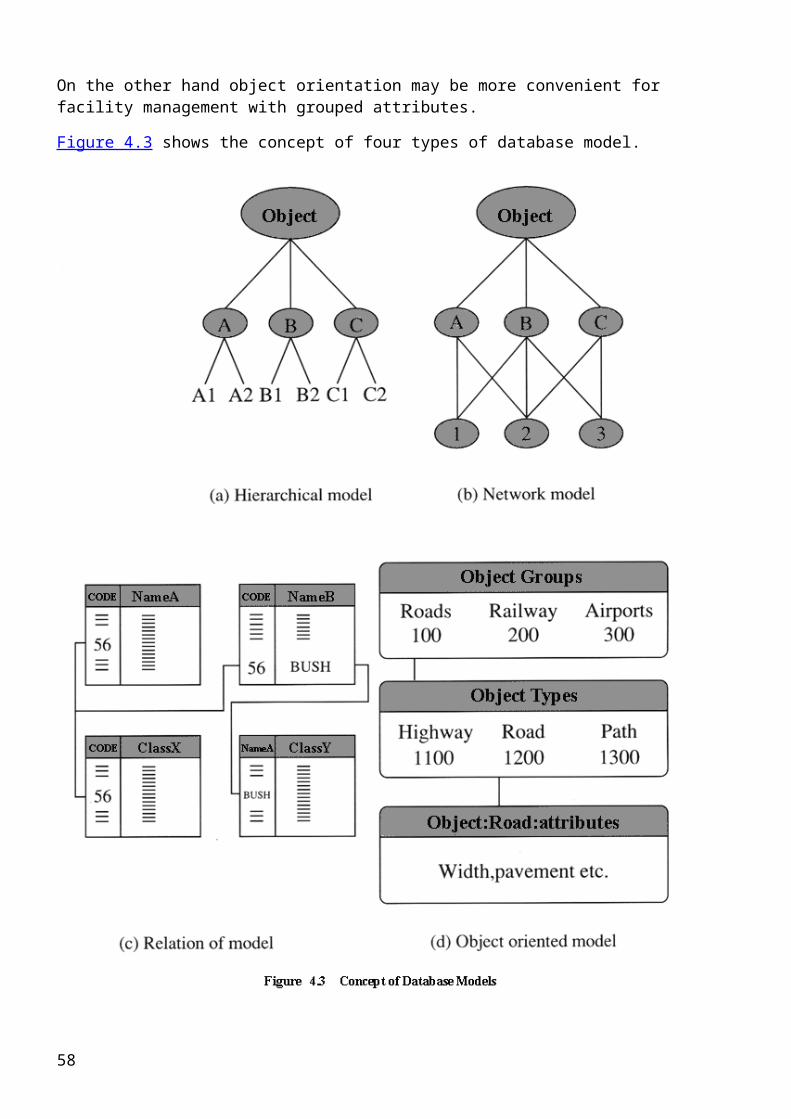
Figure 4.3 shows the concept of four types of database model.
45
46
4-4 Hierarchical Model
Several records or files are hierachically related with each other. For example, an organization has several departments, each of which has attributes such as name of director, number of staffs, annual products etc.
Each department has several divisions with attributes of name of manager, number of staffs, annual products etc.
Then each division has several sections with attributes such as name of head, number of staff, number of PCs etc.
Hierachical model is a type of tree structure as shown already in Figure 4.3 (a). A set of links connect all record types in a tree structure.
The advantages of hierachical model are high speed of access to large datasets and eases of updating. However the disadvantage is that linkages are only possible vertically but not horizontally or diagonally, that means there is no relation between different trees at the same level unless they share the same parent.
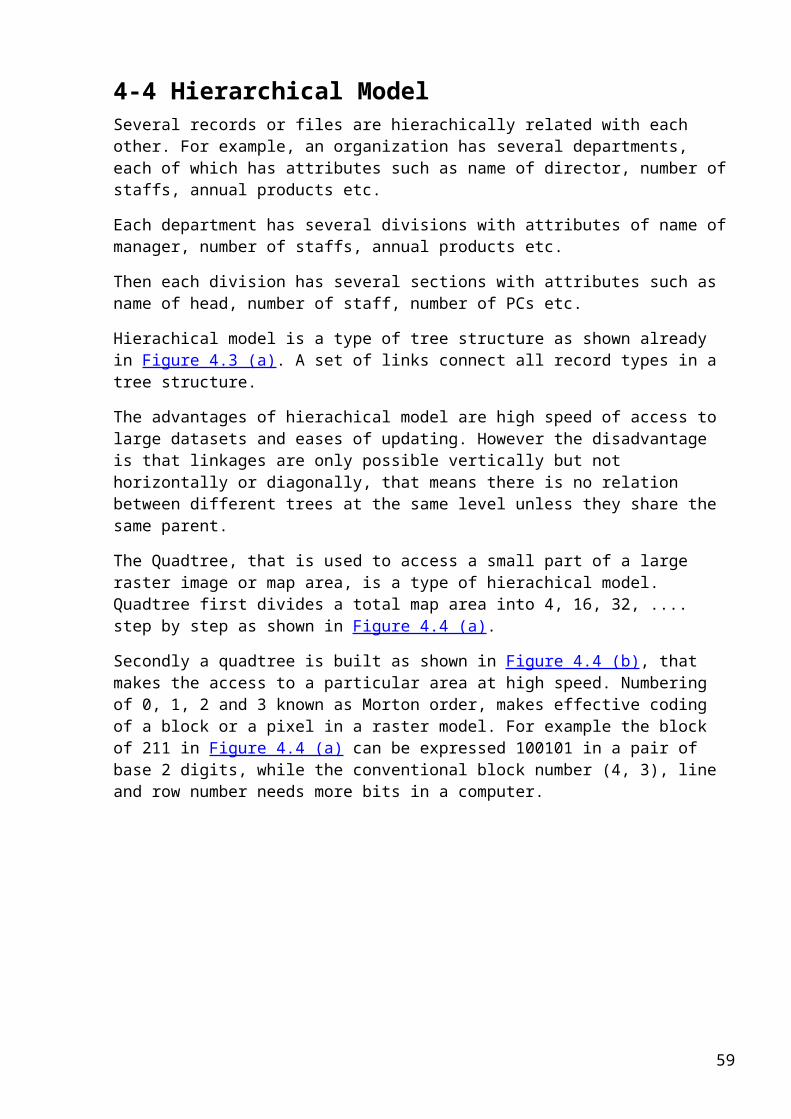
The Quadtree, that is used to access a small part of a large raster image or map area, is a type of hierachical model. Quadtree first divides a total map area into 4, 16, 32, .... step by step as shown in Figure 4.4 (a).
Secondly a quadtree is built as shown in Figure 4.4 (b), that makes the access to a particular area at high speed. Numbering of 0, 1, 2 and 3 known as Morton order, makes effective coding of a block or a pixel in a raster model. For example the block of 211 in Figure 4.4 (a) can be expressed 100101 in a pair of base 2 digits, while the conventional block number (4, 3), line and row number needs more bits in a computer.
47
48
4-5 Relational Database
Relational database is the most popular model for GIS. For example, the following relational database softwares are widely used.
- INFO in ARC/INFO- DBASE III for several PC-based GIS- ORACLE for several GIS uses
Relational database is a model to link the complex spatial relationships between objects.
The spatial objects are tabulated in tables consisting of records with a set of attributes as shown already in Figure 4.3 (c). Each table (called relation) consists of different number of attributes, which is called the degree. The degree of an attributes refers to n-ary (ex. unary, binary etc.) relation.
In a relational model, the following two important concepts should be defined.
Key of relation ; a subset of attributesUnique identification ; e.g. the key attributes is a phone directory in a set of last name, first name and address.
non redundancy ; any key attribute selected and tabulated should keep the key's uniqueness. e.g. address can not be dropped from telephone address, because there may be many with the same names.
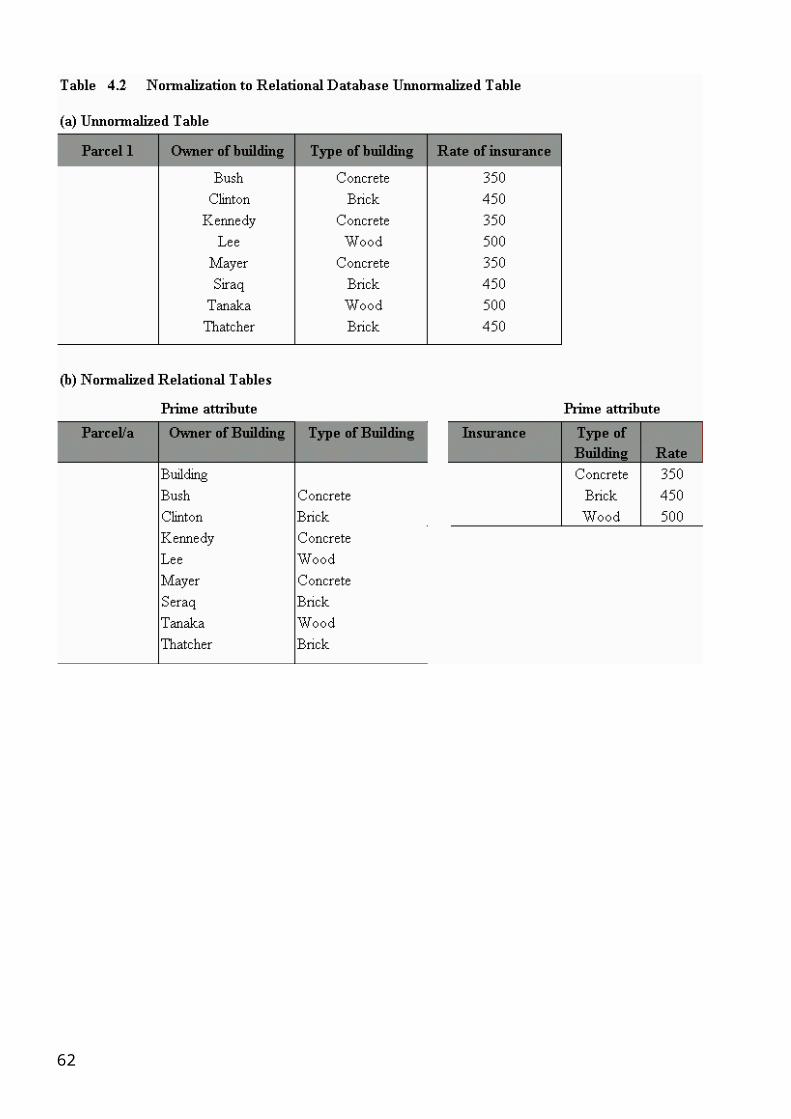
Prime attribute : an atribute listed in at least one key.The most important point of the relational database design is to build a set of key attributes with a prime attribute, so as to allow dependence between attributes as well as to avoid loss of general information when records are inserted or deleted.
Table 4.2 shows how to build the relational database by normalizing an unstructured table.
The advantages of the relational database are as follows.
- there is no redundancy.- type of building of an owner can be changed without destroying the relation between type and rate.- a new type of building for example "Clay" can be inserted.
49
50
4-6 Object Oriented Database
An Object Oriented model uses functions to model spatial and non-spatial relationships of geographic objects and the attributes.
An object is an encapsulated unit which is characterized by attributes, a set of orientations and rules.
An object oriented model has the following characteristics.
generic properties : there should be an inheritance relationship.abtraction : objects, classes and super classes are to be generated by classification, generalization, association and aggregation.adhoc queries : users can order spatial operations to obtain spatial relationships of geographic objects using a special language.
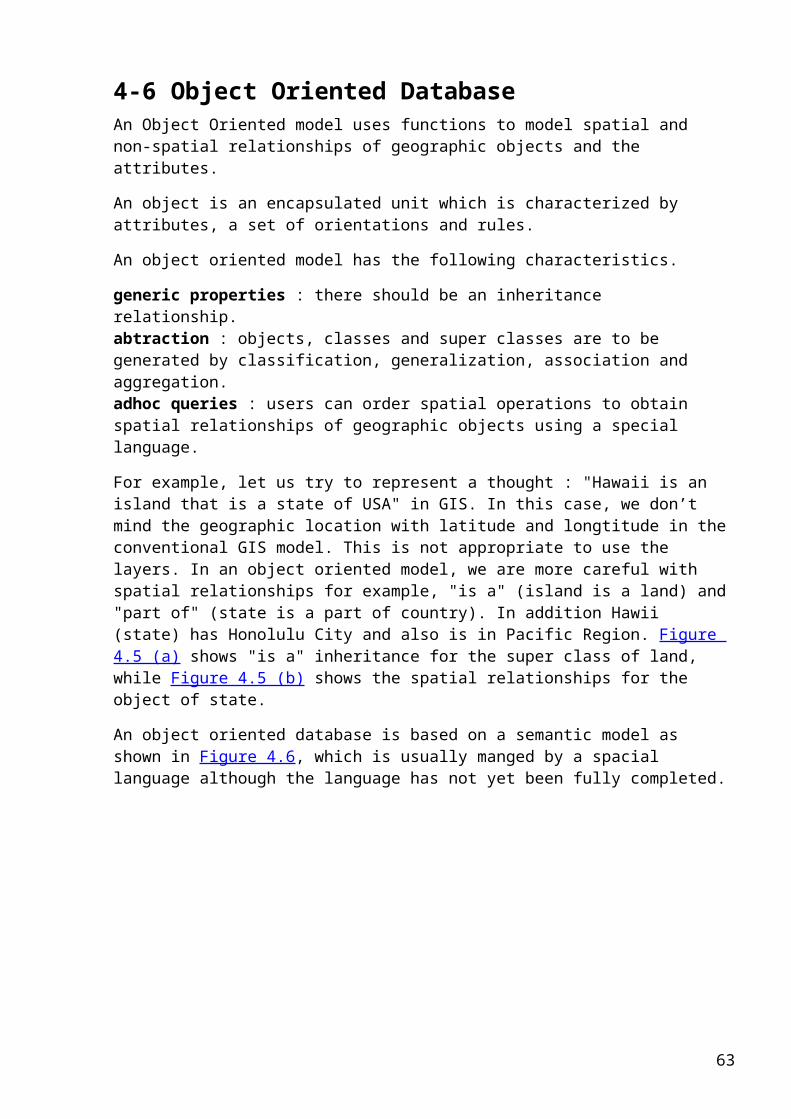
For example, let us try to represent a thought : "Hawaii is an island that is a state of USA" in GIS. In this case, we don’t mind the geographic location with latitude and longtitude in the conventional GIS model. This is not appropriate to use the layers. In an object oriented model, we are more careful with spatial relationships for example, "is a" (island is a land) and "part of" (state is a part of country). In addition Hawii (state) has Honolulu City and also is in Pacific Region. Figure 4.5 (a) shows "is a" inheritance for the super class of land, while Figure 4.5 (b) shows the spatial relationships for the object of state.
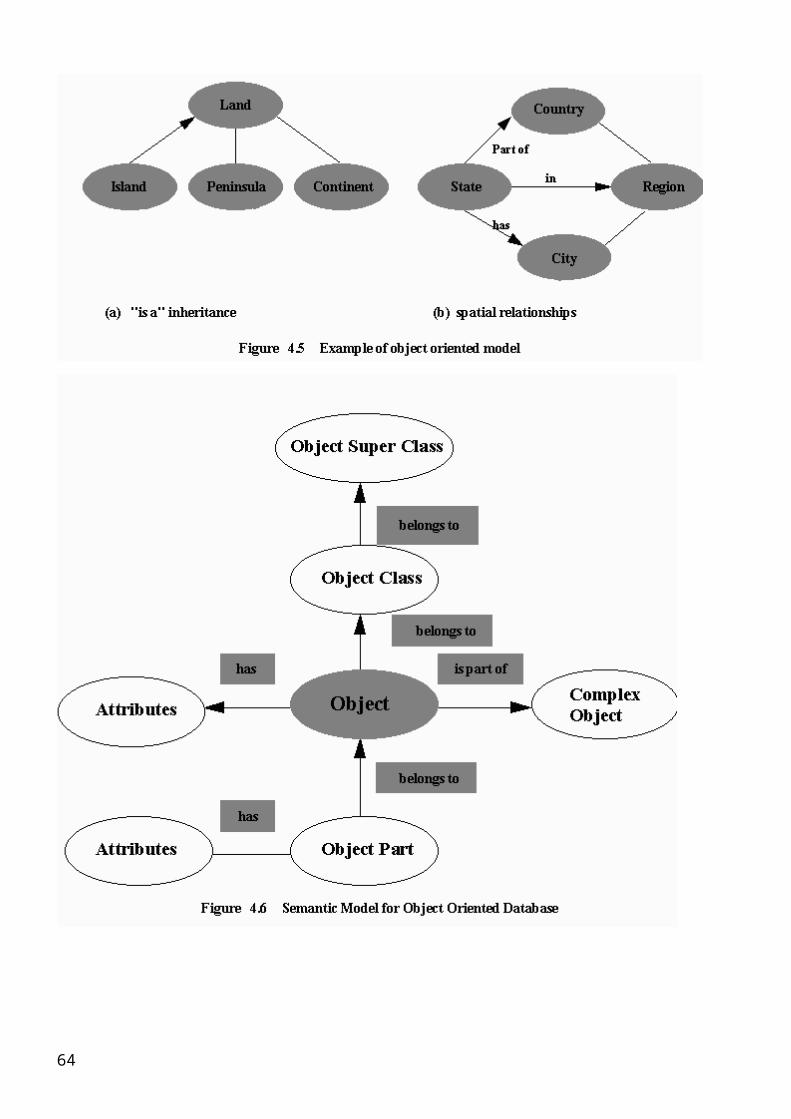
An object oriented database is based on a semantic model as shown in Figure 4.6, which is usually manged by a spacial language although the language has not yet been fully completed.
51
52
Chapter 5 Required Hardware and Software for GIS
5-1 Required Computer System
In 1990’s, a distributed processing system having the functions of networking with other computer systems has been a technical trend, particularly in GIS. This is often called "Client Server Architecture" or "Computing Network". Networks can be linked with LAN (Local Area Network) using optical fiber or coaxial cables, WAN (Wide Area Netrwork) or Internet.
Users can select an optimal combination of computers such as personal computers and UNIX workstations which can be connected to each other even at different locations.
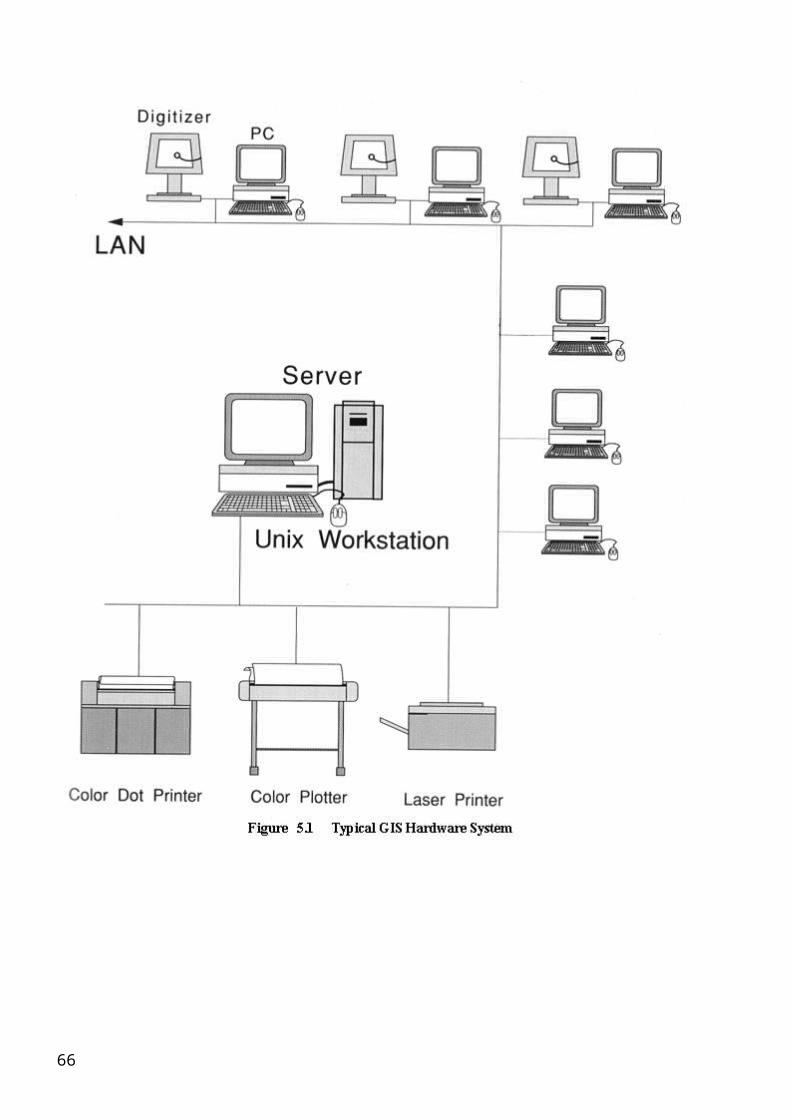
There should be a rather powerful computer (usually UNIX workstation) as so called "client server" with big memory and disk capacity, that can be shared with many other computers connected in the network. LAN can be also connected with input and output machines as well as with public telephone lines, mobile telephones, microwave and private telephone lines.
Although personal computers (PCs) had a lot of limitation in memory capacity, processing speed and functions , PCs have become powerful with 32 - bit microprocessor, bigger memory size (64 MB) and bigger hard disk (1 GB) available at very reasonable costs (about 2,000 US dollars depending on the configuration). PCs are useful to control printers, digitizers and color plotters.
UNIX workstations with the function of multi-processing are of course more powerful than PCs in memory size, processing speed and other functions.
A UNIX workstation as a client server can be connected with PCs or X terminals as a controller of input and output devices in GIS.
Figure 5.1 shows a typical GIS computer system.
53
54
5-2 Required Functions of GIS Software
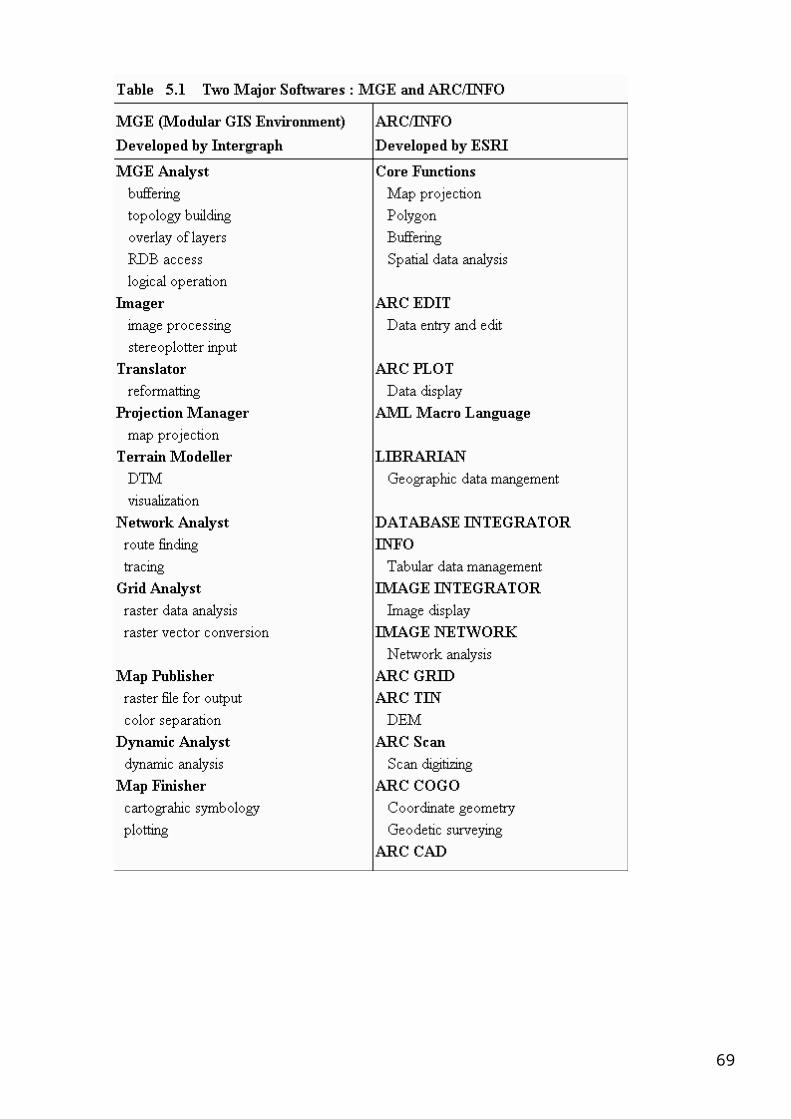
In practical GIS applications, a lot of software are required for input, manipulation, processing, analysis and output of spatial data, both in vector and raster format. The following functions are required for rather wide GIS applications (see Table 5.1)
Operating System (OS)Unix for workstation, MS-DOSWINDOWS for PC
Data InputMap digitizing and editing for vector based GISMap/Photo scanning for raster based GISColor separation
Database ManagementRelational database softwareDatabase integrator for data exchange through network
Spatial AnalysisVector Data Analysisbuilding topologyspatial querybufferingmixing layersoverlay of layersnetwork analysis (route finding, tracing etc.)
Digital Terrain Model (DTM)Overlays of layersbufferingraster vector conversionTIN Grid based DEMDrainage AnalysisShadingOblique Views of Bird’s Eye Views
Image ProceessingImage EnhancementColor ManipulationClassificationImage Analysis/MeasurementMathematical Morphology
Mapping System/Data OutputMap ProjectionGraphic RepresentationCartographic OutputVector raster conversionRaster Data Analysis
Table 5.1 shows a comparison between two major GIS softwares ; MGE of Intergragh and ARC/INFO of ESRI.
55
56
5-3 PC Based GIS for for Education
PC based GIS is necessary for education and training with minimum functions at inexpensive rate, particularly in developing countries.
The following PC based GIS will be recommendable.
Hardware- PC : Pentium : 32 bits microprocessor- 64 M bytes memory- 1 G bytes and more hard disk - Floppy disk- CD-ROM driver- Color Graphic Monitor (17 inches is preferable)- Digitizer (A3 size at minimum)- Laser Printer- Color Ink Jet Plotter- UPS (power stabilizer)
Software- OS : WINDOWS- Compiler : C, FORTRAN etc.- Public domain or cheaper GIS software ; GRASS (free), IDRISI (560 US$), PC ARC/INFO (500 US$ only for education) For education and training, a PC will be better, shared by two students or trainees at maximum. Therefore 10 PC’s are required for a maximum capacity of 20 students or trainees.- Teaching materials such as text books, manual of software, educational dataset for map digitizing and analysis etc. should be well organized and prepared. For hands-on-training (HOT) with PC based GIS, at least two- week long courses (three weeks are preferable) should be planned.
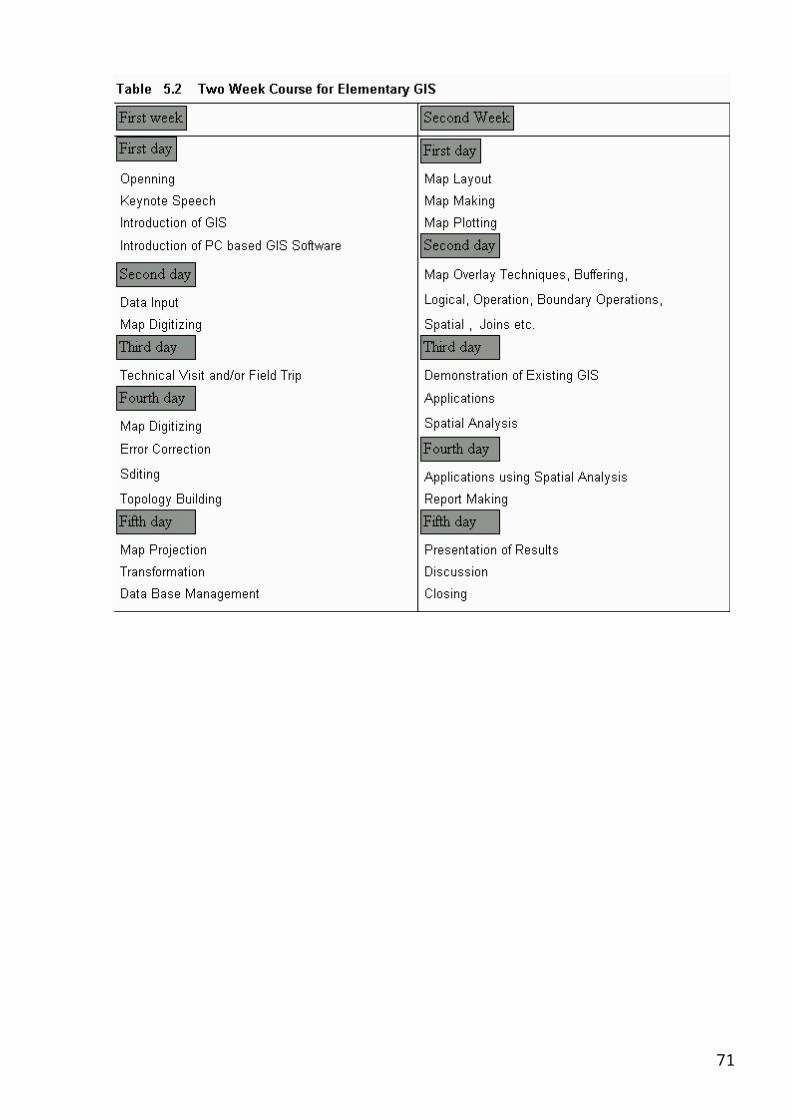
Table 5.2 shows a typical curriculum of short course for elementary GIS.
57
58
5-4 Image Display
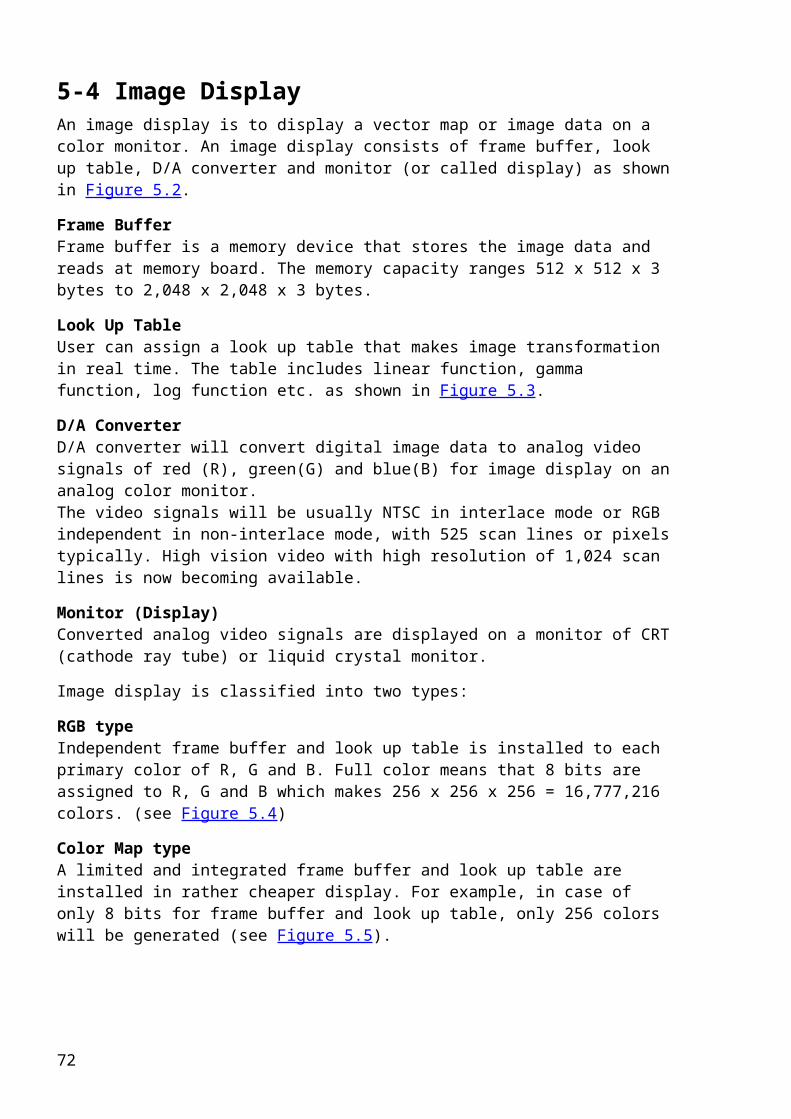
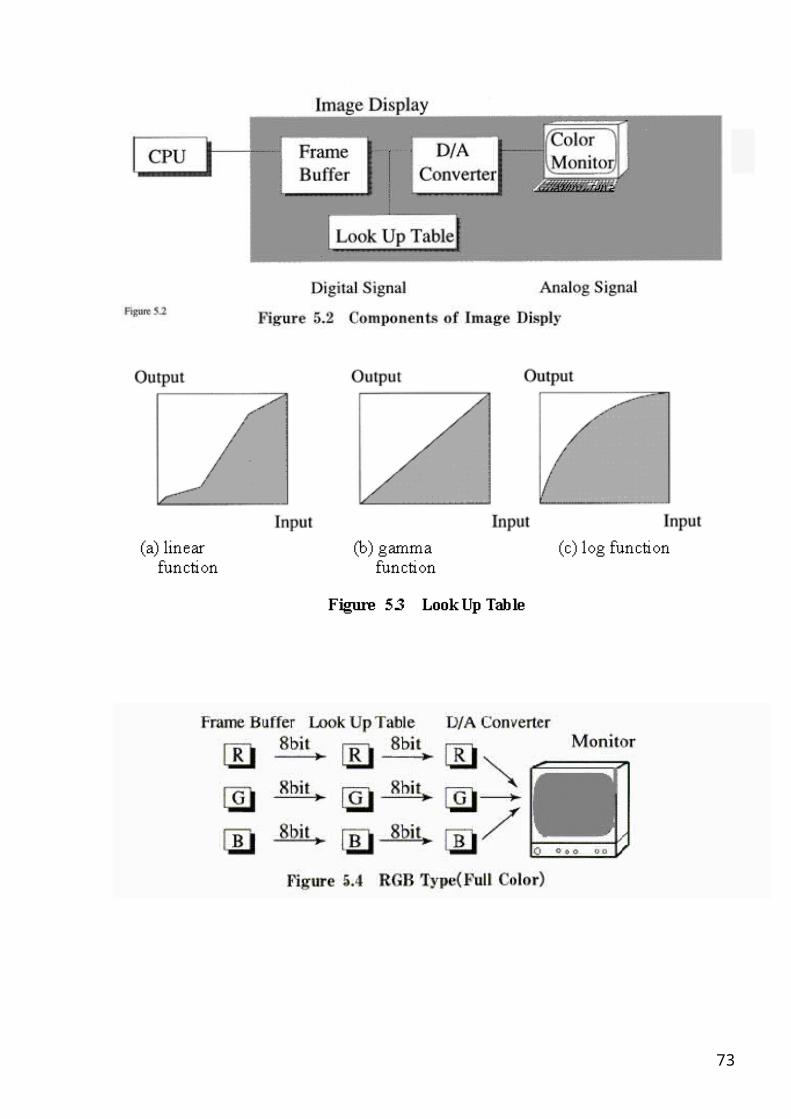
An image display is to display a vector map or image data on a color monitor. An image display consists of frame buffer, look up table, D/A converter and monitor (or called display) as shown in Figure 5.2.
Frame BufferFrame buffer is a memory device that stores the image data and reads at memory board. The memory capacity ranges 512 x 512 x 3 bytes to 2,048 x 2,048 x 3 bytes.
Look Up TableUser can assign a look up table that makes image transformation in real time. The table includes linear function, gamma function, log function etc. as shown in Figure 5.3.
D/A ConverterD/A converter will convert digital image data to analog video signals of red (R), green(G) and blue(B) for image display on an analog color monitor.The video signals will be usually NTSC in interlace mode or RGB independent in non-interlace mode, with 525 scan lines or pixels typically. High vision video with high resolution of 1,024 scan lines is now becoming available.
Monitor (Display)Converted analog video signals are displayed on a monitor of CRT (cathode ray tube) or liquid crystal monitor.
Image display is classified into two types:
RGB typeIndependent frame buffer and look up table is installed to each primary color of R, G and B. Full color means that 8 bits are assigned to R, G and B which makes 256 x 256 x 256 = 16,777,216 colors. (see Figure 5.4)
Color Map typeA limited and integrated frame buffer and look up table are installed in rather cheaper display. For example, in case of only 8 bits for frame buffer and look up table, only 256 colors will be generated (see Figure 5.5).
59
60
5-5 Color Hard Copy Machine
A color hard copy machine is a data output equipment to produce color hard copies in the GIS applications.
There are several different color hard copy machines as listed below.
Pen PlotterUsually four different colors of black, blue, green and red are available to draw line maps or diagrams in vector mode. In case of color painted polygon map, hatching pattern with fine and parallel lines will be used. The advantage is cheap cost, while the disadvantages are limited color selections, slow output and limited only to vector map.
Color Ink Jet RecorderA color ink jet recorder is to produce a raster image with fine and color ink dots with the resolution of 200~400 dpi (dots per inch). Uaually toners and three kinds of yellow, cyan and magenta inks are available, the mixture of which makes a variety of colors with dot matrix patterns. The advantages are cheap cost and rapid color output, while the disadvantage is color degradation with time elapse and/or wet hands.
Color Dot PrinterA color dot printer is based on electrostatic theory, that can produce very fast color vector maps as well as raster images up to the size of AO. The advantage is high speed output, while the disadvantage is high cost.
Film RecorderThere are two types of color films recorder, drum scanner with ordinary film, and thermal electronic color printer with special coated paper and toner.
The advantages are fine resolution of 300~1,000 dpi and continuous full color tones, while the disadvantage is high cost and rather slow speed.
Figure 5.6 shows major color hard copy machines.
Table 5.3 shows a comparison between different types of color hard copy machines.
61
5-6 Pen Computer
62
A pen computer is a portable type of personal computer as shown in Figure 5.7, which are very useful for on spot GIS data acquisition at the site.
It can be connected with a mobile telephone (or called cellular telephone) or a public telephone through which the stored data can be tranmitted to the host computer with GIS database.
Because of its light weight, it will be vey useful to carry a pen computer together with a kinematic GPS system to measure geospatial objects which is so called GPS survey, as shown in Figure 5.8.
The pen computer can be also connected with a GPS based total station as shown in Figure 5.9, which has the function of geodetic surveying for spatial objects as well as data input of the attributes at the site in digital form.
The pen computer is designed against water, dust and shock as well as with working range from -5° to 50° C in temperature, which is stronger than the ordinary laptop computer in the open field. This system will replace the conventional plane surveying of analog mapping, which is commonly used in the field.
Chapter 6 Installation of GIS
6-1 Plan for GIS Installation
63
Installion planning is divided into three phases; planning, anlysis and implementation.
The First Phase : PlanningStep 1 : Proposal of PlanThe objectives, rationale, system configuration, database, budget, scheduling etc. should be proposed.
Step 2 : Review of PlanThe proposed plan should be circulated and explained at the related departments or divisions to obtain the consensus in the bottomup approach.
Step 3 : Approval of PlanThe plan should be approved by the top-manager particularly with respect to the policy and strategy of GIS installation.
Step 4 : Organization of Project TeamA project with well defined terms of reference should be organized.
The Second Phase : AnalysisStep 5 : Pilot Scale Feasibility StudyA pilot scale feasibilitiy Study should be made by the project team in consultation with GIS experts.
Step 6 : Approval of Pilot ProjectThe pilot project will be approved particularly with respect to the budget.
Step 7: Drafting of SpecificationSpecifications for hardware and software, as well as database structure should be made.
Step 8 : Selection of VendorA vendor will be selected through bidding.
The Third Phase : ImplementationStep 9 : Design of DatabaseData acquisitions, maintenance and updating with well defined data format and database model should be designed.
Step 10 : Implementation of Pilot ProjectA small scale GIS project should be tested as a pilot project in coorperation with the selected vendor
Step 11 : Review of Pilot ProjectDatabase design, data input cost, performances of hardware and software and so on should be reviewed and improved.
Step 12 : Purchase Order of SystemsHardware and software should be purchased.
The following steps are common flow of the last stage.
Step 13 : TrainingStep 14 : Data InputStep 15 : Daily Operation
Figure 6.1 summarieze the installation planning.
64
6-2 Considerations for Installation of GIS
The following items should be taken into consideration for installation of GIS
a) CostThe cost of GIS is very important with regard to the installation cost and operational cost as enumerated.
Installation CostCost of hardware and software with respect to the requirements
65
Cost of Data InputCost of Database ManagementTraining CostCost of Application SoftwareVersion Up of Hardware and Software Other Necessary Facilities and Equipments
Operation CostMaintenance of HardwareCost for updating of DatabaseCost for Data AnalysisCost for Data OutputCost for Archiving System/Back Up System
b) Functions of GISData Input Selection of Geospatial DataData Model and StrucutreDigitizing Methods and Tools Error Check and CorrectionDatabase Management system
Data ProcessingMap Projection/Map ProductionMap MozaicingTopological StructureRaster-Vector, Vector-Raster Conversion
Spatial AnalysisOverlayQuery of Spatial Data and the AttributesMeasurement of spatial DataDEMNetwork Analysis
c) Support by VendorMaintenance of Hardware and SoftwareAfter ServicesNew ProductsService Persons
d) Support for UsersTraining Provision of MetadataOn Line Help ServiceData Access/ExchangeApplication Package
Figure 6.2 summariezes the considerations for installation of GIS.
66
67
6-3 Keys for a Successful GIS
The following six keys are the most important factors for a sucessful GIS.
Data InputAs the cost of data input will occupy about 80 percent of the total cost in GIS, the first key should be data input. More attention should be given to selection and classification of required geospatial data for the project taking into consideration of the digitizing method.
Maintenance of DatabaseThe second key is the maintenance of database, particularly maintaining data quality and routinely updating the system.
Consensus of SupportersNot only top managers but also other administrative staffs and engineers should support the GIS project.
Customizing SotfwareAs the existing GIS softwares provided by vendors are not enoght for practical applications, the users should develop customized software or solution for the problem by building a model and programming an application package.
Data SharingData sharing is one of the important keys to minimize the total cost of data input and also to maximize the use of the database. Political and administrative problems should be solved to promote the data sharing for a successful GIS.
Education and TrainingEdcudation and training are also very important for understanding GIS concept, goals and techniques. They should be organized in three levels for makers, professionals and technicians.
Figure 6.3 summarizes the keys for a successful GIS
68
69
6-4 Reasons for an Unsuccessful GIS
These are the following six major reasons that may lead to a unsuccessful GIS.
Lack of VisionThe objectives, targets and goals of a GIS project were not definded by the top manager, who just purchased GIS hardware and software only by the name of GIS. In such case, a GIS is only a toy for the top manager.
Lack of Long Term PlanningOne should note that GIS projects are long term projects that run for about ten years at least. The budget for version up and updating the database is sometimes not prepared, and as such cannot keep the GIS project running.
Lack of Support by Decsion MakersOn some occasion, the top manager in charge of GIS is replaced by an other person who is not very supportive to the GIS project.
Lack of System AnalysisDigital approach with GIS in replacement of the existing analog approach based on manual works is sometimes not acceptable in the existing conventional system. The restructuring of the organizationo and reducation/restraining is not implemented.
Lack of ExpertiseImprper selection and misuse of GIS hardware and software very often occur due to lack of experstise. Professional consultants or experts should be invited to evaluate the plan.
Lack of Access for User’sThere would be very few user if the training for users is not well organized and not provided with a well organized manual. Sometimes users are not responsible after the installation as they did not participate in the project at the initial stage.
Figure 6.4 Shows the six reasons for unsuccessful GIS.
70
71
6-5 Required Human Resource for GIS
Required managers and staffs for the operation of GIS are listed below with the terms of reference.
GIS Project managerPlanning of implementation of GIS applicationsPlanning of GIS productsSelection of hardware and softwareConsultation with usersCommunication with usersManagement of personnelBudgeting and fund raisingReport to advisory board and top manager
Database ManagerDesign of GIS databaseMaintenance and updating of databasePlan of data output and map productionProduction of GIS databaseQuality control of geospatial dataPlan of data acquisition
Digital Map MakerCompiling of the existing map sourcesMap digitizationData input of attributesData acquisition with aerial photogerammetry and remote sensingDesign of Digital mapsProduction of digital maps
System OperatorOperation of hardware, software and other peripherals (input/output devices).Management of materialsBack up of programs and data fileManagement of software library with the manualsSupport to user’s requestPrioritization of user’s access
ProgrammerProgramming for data conversion/reformattingProgramming of applicatrion softwareDevelopment of custom command menuSolution to problems with respect of programs and data files
Figure 6.5 Summarizes the required human resources for the operation of GIS to the institutional scheme.
72
6-6 Cost Analysis of GIS Project
The major cost required for a GIS project is classified into three categories as follows.
Cost for Hardware and SoftwarePC based GIS system will range from 10,000 to 30,000 US dollars for a PC, a CD ROM driver, a digitizer (A3 size), a color ink jet recorder and a public domain software or discounted software for educational purpose.
UNIX workstation based system will range from 50,000 to 300,000 US dollars for an UNIX workstation, input/output devices and comercialized GIS software.
Cost for Establishment of DatabaseMap digitization, scanning, error check, updating and database management are the most expensive, with a share of about 60~80 percent of the total cost.
Cost of Mainteneance and Daily OperationPersonnel, material, electric power, training and so on are necessary.
73

The question is how to demonstrate to the decision maker or financial administrator the possibility of cost saving if GIS is imlemented instead of the conventional analog system.
The justification to promote a GIS project is to emphasize the following three point ;
- Much better decisions can be made with the help of more information provided by GIS, which will save the unnecessary costs due to mismanagement.
- Higher productivity can be expected because of implementation of a more systematized and standardized management of geospatial datra and information.
- More saving of personnel cost will be achieved as the total productivity will raise under a restructured scheme.
Table 6.1 shows approximate prices of hardware, software and input/output devices.
Figure 6.6 shows the balance between the cost and saving, which implies that the total cost will be compensated in about ten years.
74