Embed Size (px)
Citation preview

1
Giving to Government: Voluntary Taxation in the Lab*
Sherry Xin Li School of Economic, Political and Policy Sciences (EPPS)
University of Texas at Dallas, GR31 800 W. Campbell Rd. Richardson, TX 75080 Phone: 972-883-4987
Catherine C. Eckel School of Economic, Political and Policy Sciences (EPPS)
University of Texas at Dallas, GR31 800 W. Campbell Rd. Richardson, TX 75080 Phone: 972-883-4949 [email protected]
Philip J. Grossman
Department of Economics St. Cloud State University, Monash University
St. Cloud, MN 56301 320-308-4232
Tara Larson Brown Department of Economics
College of Business University of Texas at Arlington
Arlington, TX 76019 [email protected]
* Funding was provided by the John D. and Catherine T. MacArthur Foundation and the National Science Foundation (SES-0554893 and SES-0136684). Thanks to Edward McCaffery for suggesting this idea to us. Research assistance was provided by Linda Bi, Natalia Candelo, Vera Holovchenko, Eric McLester, Angela de Oliveira, Elizabeth Pickett, and Hrishakesh Singhania. We are grateful to conference participants at the AEA (New Orleans 2008), the Midwest Economics Association (Chicago 2008) meetings, and the International ESA meetings (Caltech, 2008) for helpful comments. Experiments were conducted at the Center for Behavioral and Experimental Economic Science at the University of Texas at Dallas (http://cbees.utdallas.edu).

2
Giving to Government: Voluntary Taxation in the Lab
I. Introduction
Giving USA 2007 reports that for 2006, giving to private charities totaled $295 billion, or
2.2 percent of Gross Domestic Product. Approximately 75 percent of donations came from
individual donors. In the same year, the combined federal, state, and local governments had
current expenditures of $4,130 billion, approximately 31 percent of Gross Domestic Product
(Economic Report of the President 2008). Many of the government agencies funded by these
outlays have missions that mirror or overlap with the missions of many private charities. While
government agencies and private charities often serve the same constituent bases with the same
end goals, the means by which their respective activities are financed are perceived very
differently. At the same time that people complain that their taxes are too high, they contribute to
nonprofit causes.1
What explains this inconsistency? Three possible explanations come to mind. First,
distaste for government and taxes may reflect a belief that a government organization is inferior
to its private counterpart; private charities may be perceived as more effective at accomplishing
specific goals as compared to government organizations.2 Second, such distaste may reflect the
coercive nature of taxes versus the voluntary nature of contributions. That is, an individual may
1 Negative attitudes regarding taxation and giving to nonprofit causes are not unique to either Democrats or Republicans. Since 1947, surveys consistently find between 50 and 70 percent of taxpayers believe that the taxes they pay are too high (Chamberlin, 2007). Hughes et al. (2009) find that neither American for Democratic Action rating nor red (Republican) state designation (as expressed by preference for president in the 2004 election) significantly influence secular charitable giving. Brooks (2006) examines differences in giving levels for 1996 survey respondents based on their response to the statement: “The government has a responsibility to reduce income inequality.” Assuming that Democrats would tend to agree with the statement, while Republicans would tend to disagree, one can infer the relationship between party identification and donations. Those who strongly agreed and agreed gave on average $140 ($66) and $320 ($139), respectively, to all (secular) charitable causes. Those who strongly disagreed and disagreed gave $1,637 ($591) and $978 ($389), respectively. 2 Numerous studies have found private sector operations to be more cost-effective and more efficient than public sector operations (see Mueller 1989 for a review of the literature).

3
perceive a government agency as equal or superior to the private counterpart, but object to being
forced to pay. Third, difference in attitudes toward taxes and charitable giving may reflect
individuals’ desire to control the use of their funds. In the case of charitable contributions, people
can make their own decisions on the social programs or causes to support, whereas for taxes,
taxpayers seldom are given the opportunity to earmark their tax payments for specific causes.
In this study we use laboratory experiments to control for the latter two while examining
the first explanation. In our experiments, giving is voluntary, so coercion is absent, and subjects
may donate funds to a specific government organization, thereby earmarking their contributions
for specific functions. We employ a “real donation” experiment, first used in Eckel and
Grossman (1996), where subjects are given an endowment and the opportunity to donate any part
of that endowment to a specific organization: donated funds are forwarded to the organization in
question. The organizations consist of pairs of private charities and government agencies
matched by their primary functions, the only difference being that one is private, and the other
government-managed. This makes the donation decisions as comparable as possible. In addition,
we collect survey information to gauge perceptions of the effectiveness and efficiency of the
organization. This allows us to compare directly a subject’s giving in the form of voluntary taxes
paid to a government agency with giving in the form of voluntary donations to a private charity
with a similar mission.
A related question is whether or not distaste for taxation differs by level of government.
Assuming that the median voter rule applies and that diversity of tastes and preferences increases
with population size, voter dissatisfaction with government will be greater at the national level
than at the local level. Smaller, local government units may better reflect the tastes and
preferences of their constituents. As such, any preference for charities over government
4
organizations would be greater at the national than at the local level. Our study covers three
levels of organizations: local, state, and national.
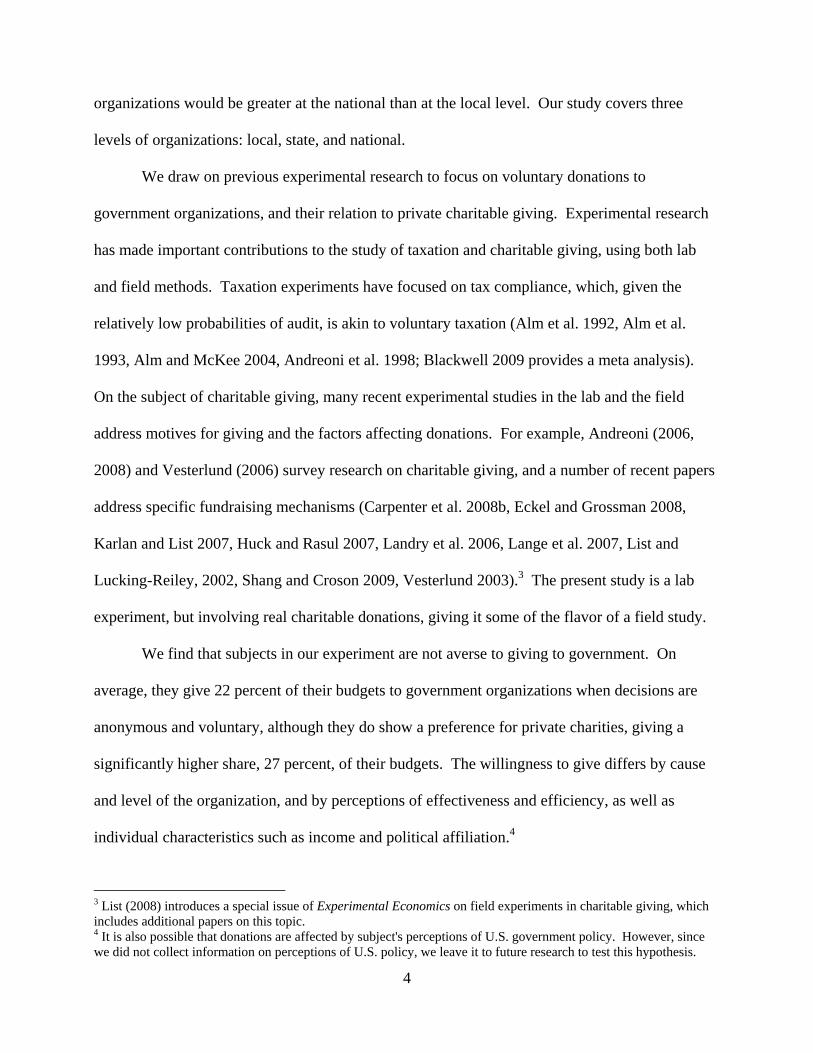
We draw on previous experimental research to focus on voluntary donations to
government organizations, and their relation to private charitable giving. Experimental research
has made important contributions to the study of taxation and charitable giving, using both lab
and field methods. Taxation experiments have focused on tax compliance, which, given the
relatively low probabilities of audit, is akin to voluntary taxation (Alm et al. 1992, Alm et al.
1993, Alm and McKee 2004, Andreoni et al. 1998; Blackwell 2009 provides a meta analysis).
On the subject of charitable giving, many recent experimental studies in the lab and the field
address motives for giving and the factors affecting donations. For example, Andreoni (2006,
2008) and Vesterlund (2006) survey research on charitable giving, and a number of recent papers
address specific fundraising mechanisms (Carpenter et al. 2008b, Eckel and Grossman 2008,
Karlan and List 2007, Huck and Rasul 2007, Landry et al. 2006, Lange et al. 2007, List and
Lucking-Reiley, 2002, Shang and Croson 2009, Vesterlund 2003).3 The present study is a lab
experiment, but involving real charitable donations, giving it some of the flavor of a field study.
We find that subjects in our experiment are not averse to giving to government. On
average, they give 22 percent of their budgets to government organizations when decisions are
anonymous and voluntary, although they do show a preference for private charities, giving a
significantly higher share, 27 percent, of their budgets. The willingness to give differs by cause
and level of the organization, and by perceptions of effectiveness and efficiency, as well as
individual characteristics such as income and political affiliation.4
3 List (2008) introduces a special issue of Experimental Economics on field experiments in charitable giving, which includes additional papers on this topic. 4 It is also possible that donations are affected by subject's perceptions of U.S. government policy. However, since we did not collect information on perceptions of U.S. policy, we leave it to future research to test this hypothesis.

5
This study contributes to the literature by comparing voluntary contributions to
government agencies and private charities with similar causes. We identify the characterizations
that make private charities more attractive for charitable donations. Our findings suggest that the
antipathy often expressed toward taxation is due more to coercion or lack of control over the use
of resources, rather than to government per se, and that taxpayers embrace the voluntary,
earmarked feature of a gift to a specific government agency.5 This finding is consistent with a
series of lab experiments reported in Alm et al. (1993), showing that individuals respond
positively when tax proceeds are directed to programs they value. This pattern of behavior also is
consistent with the increasing amount of contributions to “check-off” programs, whereby
taxpayers can voluntarily reduce their refunds or increase their taxes owed by “checking off”
contributions to federal and state programs on their income tax returns. We revisit these
programs in the conclusion with an eye to policy implications.
The rest of the paper is organized as follows: Section II presents the experimental design;
Section III presents the analysis and results; and Section IV concludes.
II. The Experiment
The experiment consists of a series of distinct budget allocation decisions, called “real
donation” tasks, introduced by Eckel and Grossman (1996). For each decision, subjects choose
how much (if any) of an endowment to donate to a private charity or a government agency that is
matched to be parallel in mission and their scope of activity. Giving to the government agencies
in our experiment resembles a voluntary tax, since it involves a sacrifice of an endowment, at the
discretion of the subject, in order to support government services. Comparing such government
donations with giving to the private charities allows us to study different preferences for giving.
5 Note while taxpayers may dislike the coercion nature of paying taxes, we do not manipulate coercion in this study and therefore cannot compare contributions with and without coercion.

6
We also link preferences for giving with perceptions about the target organizations using
information collected in the post-experiment survey. In this section, we will discuss the
experiment design and procedures.
Design
To study preferences for voluntary giving, we employ a real donation experiment to
compare giving to government agencies and private charities that are parallel in missions and
their scope of activities. The characteristics of the organizations selected vary in three
dimensions: type (government vs. private organization), level (national, state, and local), and
function (Cancer Research, Disaster Relief, Education Enhancement, Parks and Wildlife). We
include three levels to account for differences in the scope of the organizations’ functions, and
focus on four main areas where both government and private organizations are present. That is,
for each function, there are six organizations: a government agency matched with a private
charity for each of the three levels, making 2x3x4 = 24 organizations in total.
Due to time constraints we limit the decisions in each session to 12 organizations
consisting of two randomly-paired functions. We use four different pairings of functions: Parks
and Wildlife/Education Enhancement, Parks and Wildlife/Disaster Relief, Cancer
Research/Education Enhancement, and Cancer Research/Disaster Relief. Each subject is given
an endowment of $20.00 for each of the 12 decisions, and makes separate budget allocation
decisions for each organization. 6 At the end of the experiment one decision was chosen
randomly for payment, and the money allocated as indicated by the subject. This was done
individually for each subject. No show-up fee was given to subjects. The subjects received the
6 An alternative design would be to let subjects choose organizations and decide how much to contribute. The drawback is that researchers cannot observe the contributions for those organizations that are not selected. In our design, a decision must be made for each target organization.

7
part of the endowment they allocated to themselves, and the specific organization was mailed its
allocated part of the endowment as described below.
For example, in a session that consists of the Parks and Wildlife/Education Enhancement
pairing, each subject makes six choices about private and public matched organizations whose
missions reflect Parks and Wildlife, and six additional choices for organizations whose missions
reflect Education Enhancement. For one of the Education decisions, the subject is matched with
“Project Grad USA” – which is clearly denoted as a federal government organization that aims at
enhancing education – and decides (in private and anonymously) how to allocate the $20
endowment between self and this organization. The amount allocated to this government
organization serves as a measure of voluntary tax paid to the government. The decision is
repeated for the other five education organizations and the six Parks and Wildlife organizations.
A decision involves a real trade-off between a subject’s own earnings in the experiment and the
amount sent to the organizations. Hence these measures are likely to be more accurate and
informative than survey-based measures of altruistic behavior (see Forsythe et al. 1994 for a
comparison of hypothetical and real decisions).
An important and challenging part of the design was to identify organizations that were
parallel in their scope of activities, and where the government organization had the capability to
receive donations. Although we were constrained by the limited number of government agencies
that were able to receive direct donations, much time and care was invested to ensure that the
organizations were parallel, not only in their mission, but also in terms of their specific activities
and beneficiaries. For example, both of the local Dallas area organizations for parks and wildlife
service improve the same physical area, and both engage in similar efforts. By making the
organizations as parallel as possible, we can focus on relative giving, and are not concerned with
heterogeneity of organizations apart from their governmental or nongovernmental status. An

8
information sheet that listed and described the organizations (see the supplemental material) was
available to the subjects while they made their decisions. In addition, everyone was given a
separate sheet containing more detailed descriptions of the organizations.
Procedures
A total of 11 sessions were conducted at the Center for Behavioral and Experimental
Economic Science (CBEES), the University of Texas at Dallas (UTD) in fall 2007 with 125
subjects participating. The number of subjects per session varied from 9 to 13. We intended to
use only undergraduate students as subjects; however, a few, mostly international graduate
students (21) were inadvertently recruited. We dropped all graduate student observations to
prevent biasing the results, since international graduate students were likely to have different
preferences as the undergraduates, who are overwhelmingly U.S. residents.7 We ended up with a
total of 104 undergraduate student subjects, 11 of whom served as monitors for their sessions,
leaving 93 decision makers.
Subjects were recruited through email. The experiment lasted for about an hour. Before
starting, the experimenters asked for a volunteer to be a monitor. It was public information that
the monitor would be paid a flat amount of $20, would help the experimenters when needed,
make sure that instructions were properly followed, and most importantly, accompany the
experimenters to mail the checks to the organizations after the experiment was over.
7 Although we did not collect information on whether subjects were U.S. citizens or residents we believe that graduate students in our sample are overwhelmingly international students based on the self-reported ethnicity (19 percent Caucasian, 14 percent African American, 48 percent Asian and 14 percent Indian subcontinent among graduate students, compared to 66 percent Caucasian, 6 percent African American, 5 percent Hispanic, 8 percent Asian and 5 percent Indian subcontinent among undergraduate students). Since we were not able to identify international undergraduate students we dropped only graduate students from our sample. On average, graduate students gave $5.4 to charities and $4.2 to government agencies, compared to $5.3 and $4.4 given by the undergraduate students. The likelihood of giving is 81 percent to charities and 71 percent to government agencies by graduate students, in comparison to 68 percent and 60 percent by undergraduate students.

9
In the experiment, subjects made decisions while sitting at partitioned desks. Experiment
ID numbers were used to preserve anonymity. The instructions were read aloud and examples
were explained. Upon finishing their allocation decisions, subjects sealed the forms in the
envelopes provided. One decision was randomly chosen for each subject to determine the
payoff.8 Having each subject separately and randomly determining his paired organization
ensured independent decisions.9 Forms were then collected, and the survey distributed to collect
information on demographics, religion, college major, political affiliation, other charitable giving
behavior, and perceptions about the target organizations. In the meantime, experimenters and the
monitor prepared payment in a separate room. Earnings (allocation to self) and a slip reminding
the subject of his donation and the selected organization were sealed in a payment envelope with
subject ID marked on the front. Subjects used their ID cards to claim payment. These procedures
ensured complete anonymity of decisions.
The monitor assisted the experimenter in writing checks to the organizations. The
monitor verified and sealed each stamped, preaddressed envelope and then walked with the
experimenter to drop the checks in the mailbox. Subjects also were invited to accompany the
experimenter and the monitor to the mailbox, although none did. The experimental instructions,
decision sheets, descriptions of organizations, post-experiment survey, and summary statistics on
individual’s perceptions are included in the supplemental material.10
III. Results
8 A 6-sided die was rolled twice. The first roll determined the function (an odd roll meant the first function in their packet was selected, an even roll meant the second) and the second roll determined which of the six decisions of the selected category would be used for payment. 9 If a common decision were chosen for all subjects, we were concerned that crowding out might occur based on subjects’ (differential) expectations of the donations of others in their session, complicating inferences from the data. 10 They are also available at http://cbees.utdallas.edu/papers/GTG_supplemental.pdf.

10
In this section, we first present summary statistics on average amount of giving,
likelihood of giving, and perceptions of organizations. We also present the results from
parametric and nonparametric tests based on aggregate data. We then use regression analysis
based on individual data to investigate the factors that affect giving.
Summary Statistics
Among the 93 participants, 17 always gave the same amount across all types, causes, and
levels of the organizations: thirteen always gave zero, and two always gave $20, with the
remaining two giving an intermediate amount. Each participant made 12 decisions (for both
public and private types, three levels and two causes), which yields 1116 decisions. Our main
results are that subjects give positive amounts to government organizations, and average giving is
about twenty percent higher for private than government organizations. The average contribution
is $4.85 out of $20, with $5.30 for private charities and $4.40 for government agencies (p < 0.01,
two-side t test and Wilcoxon signed-ranks test for matched pairs). The histogram of contributions
pooling all decisions is presented in Figure 1. Overall, subjects give zero in 36 percent of the
decisions. Another two focal amounts are $5 (16 percent) and $10 (12 percent). In 4 percent of
decisions subjects give the full $20.11
[Figure 1 about here]
Table 1 (panel A) summarizes mean giving for all decisions, and these are also shown in
Figure 2. Panel B contains mean giving after excluding the participants who always gave zero
regardless of the organizations. We find that in all cases average giving is positive and
substantial for both government agencies and private charities. The average contribution for all 11 Despite our painstaking effort to ensure anonymity, we cannot entirely rule out experimenter demand as a motive for giving. It is not impossible that participants are making contributions in part because they believe this is what the experimenter wants them to do. On the other hand, participants may believe the experimenter wants them to give nothing (to validate the economic theory of free-riding). Our analyses and conclusions are based for the most part on comparative statics – the variations in contributions across types, causes, and levels that are least likely subject to this bias – rather than the absolute levels of giving.

11
decisions varies from $1.78 (local-level Parks and Wildlife) to $6.51 (local-level Cancer
Research) for government agencies, and from $2.53 (local-level Parks and Wildlife) to $8.76
(national-level Disaster Relief) for private charities.
[Figure 2 about here]
Several additional regularities emerge. First, we find that average donations to
government organizations are significantly greater than zero for all levels and all causes (p <
0.01, t-test of means). On average, subjects give $5.89, $3.67, $3.48, and $4.59 to government
organizations for Cancer Research, Education Enhancement, Parks and Wildlife, and Disaster
Relief, respectively. This implies that people will give to government organizations, paying de
facto voluntary taxes for specific functions.
Second, contributions to charity and to government organizations are positively and
significantly correlated for all causes and all levels. The correlation varies from 0.52 to 0.81 (p <
0.01) (panel A). This result is similar to that in de Oliveira et al (2010). They argue that there
exists a “giving type” – a positive correlation at the individual level between giving to one
organization and to another – which is why charitable organizations have an incentive to share
mailing lists.
Third, giving to private charities is typically higher than giving to government
organizations, and significantly so for Disaster Relief at all levels and national-level Cancer
Research (p < 0.05, two-sided t-test and Wilcoxon signed-rank test for paired sample). For Parks
and Wildlife and local and national-level Education Enhancement, the differences are also
positive but insignificant for at least one test. For state-level Education Enhancement,
government organizations receive more contributions than charities (p = 0.05 two-sided t-test, p >
0.10 two-sided Wilcoxon signed-rank test).
[Table 1 about here]

12
The probability of a positive contribution is reported in panel C of Table 1. We find that
although the probability of giving exhibits wide heterogeneity across causes, types, and levels of
organizations, subjects are more likely to make a positive contribution to private than to
government organizations. McNemar’s test for matched samples shows that the probability of
giving is higher for private organizations in all categories except state-level Education
Enhancement. Pooling over levels, the probability of giving is significantly higher for charities
than for government organizations for Cancer Research and Disaster Relief (p < 0.01), but
insignificantly different for Education Enhancement and Parks and Wildlife (p > 0.10).
Comparing across functions, the probability of giving is significantly higher for Cancer Research
and Disaster Relief than for Education Enhancement and Parks and Wildlife (p < 0.05, two-sided
proportions test).
In the post-experiment survey, we solicit participants’ perceptions of the government
organizations and charities used in that session. We first ask whether they believe the cause is
important. We then ask on a five-point scale how much subjects trust each organization, and
their perceptions of the responsibility, resources currently spent, quality of work, additional
resources needed, and efficiency for each.12 Several interesting patterns emerge. We find that
trust is uniformly higher toward private than toward government organizations, and private
organizations are seen as having greater efficiency and quality.13 In contrast, private charities are
seen as having greater need for resources than their governmental counterparts. On the other
hand, government organizations are perceived to have greater responsibility for all functions.
This responsibility varies by level, with the national-level government most responsible for
12 Participants were told to use their best guess if they had no prior experience or were unfamiliar with the organization. A set of sample questions for Cancer Research is included in the supplemental material. 13 The differences are not always statistically significant, and in one case is reversed (quality for state level Parks and Wildlife). See the supplemental material for participants’ average responses and test results comparing perceptions of government agencies and charities.

13
Cancer Research and Disaster Relief, and state-level government for Education Enhancement and
Parks and Wildlife. Government is seen as having greater spending than charity for Education
Enhancement, whereas subjects perceive that charity has spent significantly more resources than
government in Cancer Research and in Disaster Relief, despite the greater perceived
responsibility of the latter.
Regression Analysis
In this subsection, we investigate the determinants of giving and the likelihood of giving.
We are particularly interested in how individual perceptions about the target organizations
influence demonstrated preferences for giving. Because the data are censored by design, we use a
random-effects Tobit model, with the amount contributed as the dependent variable as shown in
Table 2.
[Table 2 about here]
As a benchmark, the first model in column (1) contains variables that capture the
organizations’ characteristics, including the types of organization (Charity versus Government),
causes (Cancer Research (Cancer), Education Enhancement (Education), Parks and Wildlife
(P&W), and Disaster Relief) and levels (National, Texas, and Dallas). We also control for the
specific pairings of causes used in each session.14 The omitted variables are Government,
Cancer, National, and P&W-Education.
Column (2) adds variables to capture key features of perceptions: whether the
organization serves an Important Cause, whether it is the organization’s Responsibility to provide
the service specified, and whether it is a Good Organization. The variables Important Cause and
14 Recall that participants made decisions for a series of organizations for two randomly-paired functions. Because of the potential effects of the specific pairings of functions, we control for pairings within a session (Cancer-Disaster, Cancer-Education, P&W-Disaster, and P&W-Education).

14
Responsibility are constructed directly from subjects’ responses to the relevant questions in the
survey (see the supplemental material). We use confirmatory factor analysis (with a varimax
rotation) to derive the variable Good Organization from four items in the questionnaire: trust,
resources currently spent, quality of work, and efficiency of the organization.15 These four items
load on a single factor with an eigenvalue 1.77, and there is no other factor with an eigenvalue
above 1. This gives us confidence that these items are common to a single factor.16 We use the
resulting factor scores for our measure of Good Organization.
Column (3) adds subject characteristics, including gender, race, age, political affiliation
and income. Subjects come from three political affiliations including Democrat (25 percent, the
omitted category), Republican (20 percent), and Independents/Others (55 percent). They fall into
three income categories: variables Salary $14,000-$27,999 (8 subjects) and Salary $28,000-
$43,999 (5 subjects) are indicators if subjects’ annual income falls into the corresponding
ranges.17 Subjects whose income is below $13,999 are in the omitted category. The political
affiliation and income category variables are interacted with Charity to examine if the difference
in giving to the private and public organizations is contingent on one’s political background and
income.18
The results in Table 2 are robust across the specifications and consistent with earlier
analysis. We find that the amount given is significantly greater to charities than to government
agencies (p < 0.01). Among the causes, people give a higher amount to Cancer than to the others
(p < 0.01). The level of organization is also important: on average national
15 We refer the readers to Harrington (2008) for a detailed description of the confirmatory factor analysis. Here we outline how it is implemented in our study. 16 The eigenvalues of other factors are 0.08, -0.15 and -0.20, respectively. 17 The small number of subjects in these categories may affect the significance of the results. 18 The number of observations decreases when the perception variables are added in the analysis, because some subjects did not answer some questions. In addition, one subject did not answer any of the importance questions. Hence, the number of subjects also falls by one when the perception variables are added.

15
organizations/agencies attract more contributions than state or local ones (p < 0.01). Changing
the level of the organization amounts to changing the group size. Dallas has a population of 6.5
million, about a quarter of the state population of 24.8 million, which is in turn about 1/12 of the
U.S. population of 307 million. Taking all causes together as in Table 2 we see a clear positive
relationship between group size and contributions.19,20 One additional detail is of interest. The
Cancer-Disaster pairing is associated with a higher level of giving than any other pairing (p <
0.05) in columns 1 and 2, but its statistical significance disappears after we control for subjects’
political affiliations and other demographics variables.
Perceptions play an important role in individuals’ decisions about giving. The more
important the cause is perceived to be, the higher the contribution (p < 0.05). A good
organization, which is trusted and efficient, has high levels of spending (resources), and provides
high quality of work, enjoys greater contributions (p < 0.01). People give more if they perceive it
is the organization’s responsibility to provide the specified service (p < 0.05).
Turning to the subject characteristics, we find that women contribute significantly more
than men (p < 0.01), consistent with previous studies.21 Neither race nor age is related to the
19 Andreoni (2007) develops a theoretical model showing that the relationship between group size and total contributions depends on potential congestion –i.e. whether adding a person to a recipient group reduces average benefits from the contribution. If contributions produce a public good, then increasing group size will decrease contributions. But if the contribution produces private goods for recipients (e.g., a soup kitchen) contributions will increase with group size. Table 6 disaggregates the analysis by cause, and we see that Cancer Research alone shows a negative relationship between group size and contributions. Arguably, Cancer Research has the strongest public good properties of the set of causes, and this may explain why contributions decline with group size. Education, Disaster Relief and Parks and Wildlife may be more similar to private goods, and show clear positive relationships. A future study including more causes that could be clearly classified would be necessary to test this idea. 20 Kahneman and Knetsch’s (1992) embedding effect theory also has implications for our level variable. They argue that willingness to pay (WTP) for a public good at the national level may be only slightly more than at state and the local levels. Donors may perceive that local provision is a close substitute for state or national-level provision. They find that WTPs are not significantly different across levels. A second factor that could compress WTPs is budget. If WTP approaches budgetary limits at the lowest levels of embedding, it cannot rise at higher levels. Our maximum budget of $20 could compress donations across levels. However, we find that fewer than 5 percent give the maximum $20 to any organization at any level. 21 Croson and Gneezy (2009) survey gender differences in dictator games, and note that women generally – but not always – give more to an anonymous recipient (i.e., are more sensitive to inequality aversion), as first shown in Eckel and Grossman (1998). However, they do not survey settings where the recipient is a “good cause” such as a

16
level of giving. The income variables and their interactions with Charity indicate that
contributions appear to be a concave function of subjects’ income. However, the average
contribution is not significantly different across the three income brackets (p > 0.10). The
interaction term Charity*(Salary $14,000~$27,999) enters with a positive sign and statistical
significance at the 5 percent level. This suggests that the difference between private and public
contributions is significantly larger for subjects in the middle income range ($14,000~$27,999),
compared to those in the lower (below $13,999) and higher income ($28,000~$43,999)
categories. We defer the discussion on the impact of political affiliation to the next subsection.
[Table 3 about here]
To closely examine the potentially heterogeneous effects of these factors on giving to
government and private organizations, we disaggregate the data by type of organization, as shown
in Table 3 with columns 1-3 for private charities and columns 4-6 for government organizations.
The results, although largely confirming those in Table 2, reveal one interesting difference, that
is, giving to the national level significantly exceeds state-level giving only for private charities (p
< 0.01 in columns 1-3).22
In all the analysis, we control for subject’s age either by including a continuous age
variable (results reported) or by including an indicator variable for older subjects (age 25 or older,
results omitted for space limitation). Results are similar, except that the indicator variable for
older subjects (n = 9) enters with a significant negative coefficient for government organizations charitable organization (Carpenter et al. 2008a, Crumpler and Grossman 2008, Eckel and Grossman 2003, Eckel et al. 2007, Fong 2007, List 2004). In these studies women students are shown to donate significantly more to a real charity than men. One may argue that the gender difference is due to interactions between the experimental protocol and the lab environment unique to women, for example, more generous women volunteer for lab experiments. Cleave et al (2010) test directly for selection bias by comparing the behavior of a large sample of students with a smaller group of volunteers for a lab experiment who were drawn from this large sample. They find that women who give low amounts in the large study are overrepresented among those who volunteer for the lab experiment. This would tend to bias downward the amount sent by women as compared to by men in the lab relative to a broader sample. This result strengthens our finding on gender difference, i.e., women give more than men. 22 The coefficient on the variable Good Organization is higher for government as compared to charities due to less variance in this variable for charities.

17
in column 6 of Table 3. This suggests that people who are older and hence more experienced
with paying taxes may have a negative view of taxes, and make less voluntary contribution to
government agencies. However, more research is needed to confirm this result.
[Tables 4 and 5 about here]
In separate analyses, we also investigate the determinants of the likelihood of giving and
of gift size conditional on giving. Results are reported in Tables 4 and 5. Table 4 shows a random
effects probit model with the likelihood of giving as the dependent variable. Table 5 includes a
random effects linear regression, with gift size conditional on giving as the dependent variable.
The specifications and the set of independent variables are the same as in Table 2. Results are
largely consistent with those in Table 2, except that the effects of Important Cause and
Responsibility on the likelihood of giving are not significantly different from zero (as shown in
Table 4) whereas their effects on the conditional gift are positive and significant (p < 0.05 in
Table 5). This implies that whether the cause is important and whether it is perceived as the
organization’s responsibility to provide a specific kind of service does not affect one’s decision
on whether to give, but does influence the amount of contribution.
[Table 6 about here]
We also disaggregate the data by cause, as shown in Table 6. These random-effects Tobit
results are consistent with those in Tables 2 and 3. Contributions remain higher to the Disaster
Relief charity than its public counterpart (p < 0.01). There is no independent effect of majoring
in economics. Students in the $14,000~$27,999 income range give more to Parks and Wildlife
and Disaster Relief than those in the lower income range (p < 0.05). However, they give less to
government for Education (p < 0.05).
Political Affiliation

18
In this section we explore in greater depth the effect of political affiliation on the
difference in giving to government and to private charities.23 This analysis may be of interest
because the experiment was run during a Republican presidency that some saw as politically
divisive. This environment may have differentially affected subjects’ giving, depending on their
political affiliations. In the sample of UTD students, 20 percent self-identify as Republican, 25
percent as Democrat, and 55 percent Independents/Others (37 percent self-identified Independent
and 18 percent other).24,25
First we revisit the previous analysis, highlighting the effects of political affiliation. Table
2 analyzes unconditional giving. For political affiliation we include dummy variables for
Republican and for Independent/Other, with Democrat the excluded category. These two
affiliations enter as main effects and interact with the Charity indicator. Note that the coefficients
on the interactions between political affiliation and Charity provide a measure of the difference in
the charity v. government differential between the political category as compared to Democrats –
i.e. the difference in differences. Column 3 in Table 2 shows that, relative to Democrats,
Independents/Others (but not Republicans) give the charities differentially more than the
government agencies (p < 0.05). Note that the main effect of Charity is insignificant when the
Independent/Other*Charity interaction is included. Table 3 breaks down the analysis by type of
organization. Here we see no significant effect of Republican or Independent/Other affiliation
relative to Democrats.
23 We thank an anonymous referee for suggesting this analysis. 24 Texas is one of the most strongly Republican states, with Republicans controlling all statewide offices, dominating the state legislature, and holding a majority of seats in the congressional delegation. The Republican candidate has won the presidential race in all elections in the last three decades. The major Texas cities (Austin, Dallas, Houston, and San Antonio) usually support Democrats, while their suburbs are heavily Republican. UTD draws largely from Dallas and its suburbs, and so has roughly equal proportions of students who identify themselves as Republican or Democratic. 25 In a survey of UTD Freshmen taken in April, 2008, we found that 18 percent of students identified as Democrat, 22 percent as Republican, 54 percent independent, and 6 percent other.
19
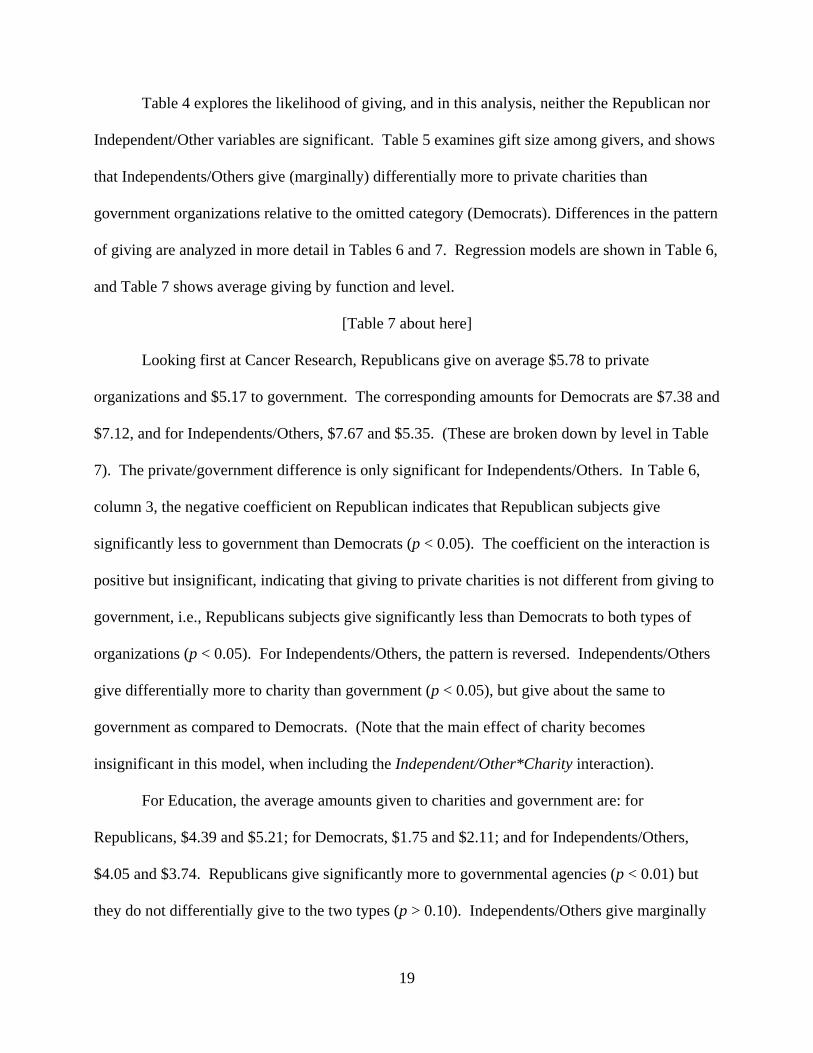
Table 4 explores the likelihood of giving, and in this analysis, neither the Republican nor
Independent/Other variables are significant. Table 5 examines gift size among givers, and shows
that Independents/Others give (marginally) differentially more to private charities than
government organizations relative to the omitted category (Democrats). Differences in the pattern
of giving are analyzed in more detail in Tables 6 and 7. Regression models are shown in Table 6,
and Table 7 shows average giving by function and level.
[Table 7 about here]
Looking first at Cancer Research, Republicans give on average $5.78 to private
organizations and $5.17 to government. The corresponding amounts for Democrats are $7.38 and
$7.12, and for Independents/Others, $7.67 and $5.35. (These are broken down by level in Table
7). The private/government difference is only significant for Independents/Others. In Table 6,
column 3, the negative coefficient on Republican indicates that Republican subjects give
significantly less to government than Democrats (p < 0.05). The coefficient on the interaction is
positive but insignificant, indicating that giving to private charities is not different from giving to
government, i.e., Republicans subjects give significantly less than Democrats to both types of
organizations (p < 0.05). For Independents/Others, the pattern is reversed. Independents/Others
give differentially more to charity than government (p < 0.05), but give about the same to
government as compared to Democrats. (Note that the main effect of charity becomes
insignificant in this model, when including the Independent/Other*Charity interaction).
For Education, the average amounts given to charities and government are: for
Republicans, $4.39 and $5.21; for Democrats, $1.75 and $2.11; and for Independents/Others,
$4.05 and $3.74. Republicans give significantly more to governmental agencies (p < 0.01) but
they do not differentially give to the two types (p > 0.10). Independents/Others give marginally

20
more to government than Democrats (p < 0.10), and give differentially give more to private
charities (p < 0.10).
For Parks and Wildlife, the average amounts given to charities and government are: for
Republicans, $4.44 and $4.08; for Democrats $0.63 and $1.54; and for Independents/Others
$4.24 and $3.78. Republicans give more to government than Democrats; the difference is large
but not significant. However, Republicans give differentially more to charities (p < 0.10).26
Independents/Others do not give more to government than Democrats, but do give differentially
more to charity (p < 0.10). Comparing Independents/Others and Republicans: there is no
difference in giving to either type.
Finally, looking at Disaster Relief, we see a pattern similar to that for Cancer Research.
Republicans give on average $4.50 to charity and $2.75 to government; the comparable amounts
for Democrats are $8.29 and $6.32, and for Independents/Others $6.90 and $4.42. The
regressions show that Republicans give significantly less to government (p < 0.05), with no
significant interaction effect. That is, Republicans give less than Democrats to both government
and private charities. Both coefficients are insignificant for Independents/Others.27
The overall pattern in the data is that Republicans give less overall for Cancer Research
and Disaster Relief, and rarely discriminate between giving to government and private charities
as compared to Democrats. This differential giving is marginally significant only for Parks and
Wildlife. As shown in Table 7, giving by Democrats and Independents/Others is more variable
across all levels and categories as compared to Republicans, whose average giving is between
$1.38 and $6.50 out of $20. Average giving by Democrats ranges from $0.25 to $10.73, and for
26 In a pair-wise comparison, overall Republicans do give significantly more to charity than Democrats (p < 0.05) for Parks and Wildlife. 27 Analysis using only the national-level decisions yields very similar results. All coefficients on the political affiliation variables and interactions are similar in magnitude; statistical significance is reduced.

21
Independents/Others from $2.04 to $9.19. Independents/Others give more to private charities
than to government on average, and for every cause and level except for small differences in State
Education and State Parks and Wildlife. Republicans and Democrats vary quite a lot, giving
more to government in about half the cases, and only giving more consistently to charities in the
case of Disaster Relief. Therefore the overall higher level of giving to private charities is driven
primarily by the differential giving of Independents/Others.
IV. Conclusion
In this paper, we investigate the question of whether people will give to government, and
if so, what determines the amount of giving. We design a lab experiment in which participants
make decisions about whether and how much to give to private and public organizations that are
matched according to function (Cancer Research, Disaster Relief, Education Enhancement, and
Parks and Wildlife) and level (federal, state, and local). Giving to the government organizations
amounts to voluntary taxes earmarked for a specific function, and giving to the private charities is
in the form of voluntary contributions. The experiment is conducted so that giving is voluntary
and anonymity is ensured. We find that people give on average $4.40 (22 percent of their
budgets) to government organizations, significantly less than the $5.30 (27 percent of their
budgets) they give to private charities. The willingness to give varies by the type, function, and
level of the organization, and according to perceptions of the organization. People give more to
Cancer Research than to the three other causes. National organizations (whether public or
private) attract more contributions than do state or local organizations; we see little evidence to
support the idea that state or local-level organizations are seen as more responsive to local
concerns. An organization that is perceived as serving an important cause, being trustworthy,
efficient, and providing a high quality of service attracts higher contributions. From the analysis

22
of political affiliation we conclude that the higher overall giving to private charities is primarily
due to the differential giving of Independents/Others as opposed to Republicans or Democrats.
The levels of giving may be higher than one expects to see a donor give from a small
windfall shock to income in the field; nevertheless, two aspects of our results are particularly
informative. The first is that, college students will voluntarily part with any of their earnings to
support organizations whose budgets come from tax revenue, thereby in essence paying voluntary
taxes. The second is that giving is almost always higher for private charities. This latter result is
driven by perceptions about the relative efficacy and efficiency of the specific organizations.
The fact that this study is conducted in the lab with student subjects is cause to question if
these comparative static results would hold up in the field. Students may not be the most
appropriate subject pool for studying voluntary taxation; they are, on average, younger than the
general taxpaying public, and likely have had only limited experience with the income tax
system. We employed a student subject pool for its convenience and for cost reasons. Several
studies address this issue. Benz and Meier (2008) show that contributions by student subjects in
a lab experiment are positively correlated with donations in the field (0.25 to 0.40). Using a
sample of low-income adults, de Oliveira et al. (2009) find that giving in a lab experiment is
strongly related to volunteering and donating to charities. Carpenter and Seki (2009) show that
social preferences in the lab predict cooperation in production by Japanese fishermen. However,
Laury and Taylor (2008) find little support for a relationship between lab contributions and
donations to a local public good (planting trees). One may conjecture that individual’s
willingness to pay voluntary taxes may decrease with age. Future studies are needed to test the
validity of our results in other, more diverse populations, e.g. older taxpayers.
Voluntary giving to government occurs in the U.S. through several mechanisms. First,
individuals have been able to make earmarked gifts to the federal government for reducing the

23
national debt since 1961.28 Slemrod and Oltmans (2001) find that the size of such gifts is
systematically related to attitudes toward government and the size of the deficit. Taxpayers may
also contribute to a special federal account called Gifts to the United States, maintained by the
Department of Treasury since 1843. The amount of gifts totaled $394,000 in fiscal year 2001,
and increased substantially after September 11, 2001 (Miniter 2002).
However, the largest source of voluntary taxation is the extensive set of “check-off”
programs established by many states, through which taxpayers can make voluntary contributions
to public or social programs by indicating their preferences on their state income tax forms.
These have gained popularity since they were first implemented in 1977, and in 2002, 210 such
programs collected a total amount of $32.8 million.29 As of 2007, the number of such programs
had grown to 318 across the forty-one states that had a broad-based personal income tax. The
most common programs were to provide funding for nongame wildlife preservation, child abuse
and neglect prevention, breast cancer research and prevention, and military families. The
popularity and success of these programs indicates a strong willingness on the part of taxpayers to
pay additional voluntary taxes when they have control over how the money is used.
The functions we study in this paper, including cancer research, education enhancement,
disaster relief, and environmental causes, parallel some of the popular categories in the check-off
programs. Our findings offer some explanations for what makes these programs successful. This
paper shows that, as confirmed by the success of the state check-off programs, people are willing
to pay voluntary tax when allowed to decide the use of their funds. In addition, organizations that
are perceived as serving an important cause, as being trustworthy and efficient, and providing a
28 The Internal Revenue Service has included instructions in the tax packet on how to make a contribution since 1982 (Slemrod 2003). 29 Data come from Federation of Tax Administrators (FTA) article “Check-off Programs See Strong Growth”. URL: http://www.taxadmin.org/fta/rate/checkoff03.html. FTA conducted biannual surveys on state check-off programs from 1989 to 2003.

24
high quality of service are more likely to attract funds. We also find that conditional on function,
national organizations (whether public or private) get more contributions than do state or local
organizations. It suggests the potential of broadening the check-off programs on the federal
income tax return, which included only one such program on political campaigns as of 2009.
Voluntary donations such as these may be a useful alternative source of funding for causes that
are seen as salient to taxpayers, and where the government units that provide these services are
seen as deserving of additional support.

25
References
Alm, J., McClelland, G.H., Schulze, W.D., 1992. Why do people pay taxes? Journal of Public Economics 48, 21-38.
Alm, J., McKee, M., 2004. Tax compliance as a coordination game. Journal of Economic Behavior and Organization 54(3), 297-312.
Alm, J., Jackson, B.R., McKee, M., 1993. Fiscal exchange, collective decision institutions, and tax compliance. Journal of Economic Behavior and Organization 22(4), 285-303.
Andreoni, J., 2006. Philanthropy. In Handbook of Giving, Reciprocity and Altruism, Amsterdam, North Holland, pp. 1201-1269.
Andreoni, J., 2007. Giving gifts to groups: How altruism depends on the number of recipients. Journal of Public Economics 91(9), 1731-1749.
Andreoni, J., 2008. Charitable giving. The New Palgrave Dictionary of Economics, 2nd edition, edited by Steven N. Durlauf and Lawrence E. Blume, Palgrave Macmillan (Basingstoke and New York). 2008.
Andreoni, J., Erard, B., Feinstein, J., 1998. Tax compliance. Journal of Economic Literature 36(2), 818-860.
Benz, M., Meier, S., 2008. Do people behave in experiments as in the field? – Evidence from donations. Experimental Economics 11, 268-281.
Blackwell, C., 2009. Tax compliance: A meta-analysis. Forthcoming in J. Alm, B. Torgler and J. Martinez-Vazquez, eds, Tax Compliance.
Brooks, A.C., 2006. Who Really Cares: The Surprising Truth about Compassionate Conservatism. New York , Basic Books.
Carpenter, J., Seki, E., 2009. Do social preferences increase productivity? Field experimental evidence from fishermen in Toyama Bay. Economic Inquiry, forthcoming.
Carpenter, J., Connolly, C., Myers, C.K., 2008a. Altruistic behavior in a representative dictator experiment. Experimental Economics 11, 282-298.
Carpenter, J., Holmes, J., Matthews, P.H., 2008b. Charity auctions: A field experiment. The Economic Journal 525, 92-113.
Chamberlin, A. 2007. What does America think about taxes? The 2007 Annual Survey of U.S. Attitudes on Taxes and Wealth. Tax Foundation Special Report No. 157.
Cleave, B., Nikiforakis, N., and Slonim, R., 2010. Is there selection bias in laboratory experiments? University of Sydney, School of Economics Working Paper.
Croson, R., Gneezy, U., 2009. Gender differences in preferences. Journal of Economic Literature 47(2), 1-27.
Crumpler, H., Grossman, P. J., 2008. An experimental test of warm glow giving. Journal of Public Economics 92, 1011-1021.
de Oliveira, A.C.M., Croson, R.T.A., Eckel, C.C., 2009. Are preferences stable across domains? An experimental investigation of social preferences in the field. University of Texas at Dallas, Center for Behavioral and Experimental Economic Science, Working paper 08-03, revised 2009.
de Oliveira, A.C.M., Croson, R.T.A., Eckel, C.C., forthcoming. The giving type: identifying donors. Journal of Public Economics.
Eckel, C.C., Grossman, P. J., 1996. Altruism in anonymous dictator games. Games and Economic Behavior 16,181-191.
Eckel, C.C., Grossman, P. J., 1998. Are women less selfish than men? Evidence from dictator experiments. Economic Journal 108, 726-735.
Eckel, C.C., Grossman, P. J., 2003. Rebates and matching: Does how we subsidize charitable contributions matter? Journal of Public Economics 87, 681-701.
Eckel, C.C., Grossman, P.J., 2008. Subsidizing charitable contributions: A natural field experiment comparing matching and rebate subsidies. Experimental Economics 11, 234-252.

26
Eckel, C.C., Grossman, P. J., Johnston, M., 2005. An experimental test of the crowding out hypothesis. Journal of Public Economics 89(8), 1543-1560.
Eckel, C.C., Grossman, P.J., Milano, A., 2007. Is more information always better? An experimental study of charitable giving and Hurricane Katrina. Southern Economic Journal 74(2), 388-41.
Economic Report of the President. 2008. U. S. Government Printing Office, Washington D.C. Fong, C.M., 2007. Evidence from an experiment on charity to welfare recipients: Reciprocity, altruism
and the empathic responsiveness hypothesis. The Economic Journal 117, 1008-1024. Forsythe, R., Horowitz, J., Savin, N., Sefton, M., 1994. Fairness in simple bargaining experiments. Games
and Economic Behavior 6, 347-369. Giving USA, 2007. Giving USA Foundation (http//www.givingusa.org). Harrington, D., 2008. Confirmatory Factor Analysis. Oxford University Press. Huck, S., Rasul, I., 2007. Comparing charitable fundraising schemes: Evidence from a natural field
experiment. Center for Economic Learning and Social Evolution (ELSE), University College London, London.
Hughes, P., Luksetich, W., Sidway, J. N. 2009. Charitable giving: Political ideology and religious preference. Saint Cloud State University Working paper.
Kahneman, D., Knetsch, J. 1992. Valuing public goods: The purchase of moral satisfaction. Journal of Environmental Economics and Management 22(1), 57-70.
Karlan, D., List, J. A., 2007. Does price matter in charitable giving? Evidence from a large-scale natural field experiment. American Economic Review 97(5), 1774-1893.
Landry, C., Lange, A., List, J., Price, M., Rupp, N., 2006. Toward an understanding of the economics of charity: Evidence from a field experiment. Quarterly Journal of Economics 121, 747-782.
Lange, A., List, J.A., Price, M.K., 2007. A fundraising mechanism inspired by historical tontines: Theory and experimental evidence. Journal of Public Economics 91, 1750-1782.
Laury, S.K., Taylor, L.O., 2008. Altruism spillovers: Are behaviors in context-free experiments predictive of altruism toward a naturally occurring public good? Journal of Economic Behavior & Organization 65, 9-29.
List, J., 2004. Young, selfish and male: Field evidence of social preferences. Economic Journal 114, 121-149.
List, J.A., 2008. Introduction to field experiments in economics with applications to the economics of charity, Special Issue on Field Experiments in Charity, Experimental Economics, 11(3), pp. 203-212.
List, J.A., Lucking-Reiley, D., 2002. The effects of seed money and refunds on charitable giving: experimental evidence from a university capital campaign. Journal of Political Economy, 110, 215–233.
Miniter, B., April 15, 2002. To Uncle Sam with love—taxes too low? The Treasury is happy to take your money. Wall Street Journal.
Manzi, N., November 2007. Use tax collection on income tax returns in other states. Policy Brief, Research Department Minnesota House of Representatives. URL: http://archive.leg.state.mn.us/docs/2007/other/070766.pdf.
Mueller, D.C., 1989. Public Choice II (Cambridge University Press, Cambridge). Shang, J., Croson, R.T.A., 2009. Field experiments in charitable contributions: The impact of social
influence on the voluntary provision of public goods. The Economic Journal 119, 1422-1439. Slemrod, J., 2003. Trust in public finance, in S. Cnossen and H.-W. Sinn (eds.), Public Finance and Public
Policy in the New Century, MIT Press, pp. 49-88. Slemrod, J., Oltmans, E., 2001. Gifts to government. Mimeo., University of Michigan, Ann Arbor. Vesterlund, L., 2003. The informational value of sequential fundraising. Journal of Public Economics 87,
627–657. Vesterlund, L., 2006. Why do people give? In: Steinberg, R., Powell, W. W. (Eds.), The Nonprofit Sector,
2nd edition, Yale Press, New Haven.

27
Table 1: Summary Statistics on Giving
Panel A: Unconditional Giving Panel B: Conditional Giving (Excl.
subjects who always gave $0) Panel C: Probability of Giving
Mean ($) (Std. dev.) p value*
Correlation (p value)
Mean ($) (Std. dev.) p value*
% McNemar’s
test: p value Function Level Gov Private Gov Private Gov Private
Cancer Research
National 5.61 (5.41)
7.89 (6.18)
0.00 [0.00]
0.69 (0.00)
5.99 (5.38)
8.43 (6.02)
0.00 [0.00] 66.0 85.1 0.00
State 5.55 (5.55)
6.94 (5.94)
0.10 [0.22]
0.52 (0.00)
5.93 (5.53)
7.41 (5.84)
0.10 [0.22] 66.0 78.7 0.03
Local 6.51 (6.18)
7.18 (6.00)
0.26 [0.01]
0.78 (0.00)
6.95 (6.14)
7.67 (5.88)
0.27 [0.01] 74.5 85.1 0.06
All 5.89 (5.70)
7.34 (6.01)
0.00 [0.00]
0.66 (0.00)
6.29 (5.67)
7.84 (5.89)
0.00 [0.00] 68.8 83.0 0.00
Education Enhancement
National 4.14 (4.74)
4.40 (4.98)
0.67 [0.71]
0.60 (0.00)
4.93 (4.78)
5.24 (5.01)
0.68 [0.68] 60.0 66.0 0.44
State 4.08 (5.00)
2.84 (4.06)
0.05 [0.17]
0.57 (0.00)
4.86 (5.10)
3.38 (4.23)
0.05 [0.14] 58.0 48.0 0.28
Local 2.80 (4.29)
3.48 (4.85)
0.10 [0.06]
0.81 (0.00)
3.33 (4.49)
4.14 (5.02)
0.10 [0.06] 44.0 50.0 0.32
All 3.67 (4.69)
3.57 (4.66)
0.76 [0.72]
0.64 (0.00)
4.37 (4.81)
4.25 (4.79)
0.76 [0.74] 54.0 54.7 0.72
Parks and Wildlife
National 4.42 (5.43)
4.22 (4.80)
0.69 [0.97]
0.78 (0.00)
5.65 (5.55)
5.39 (4.81)
0.69 [0.89] 60.9 63.0 0.66
State 4.23 (5.36)
4.25 (5.01)
0.97 [0.99]
0.78 (0.00)
5.40 (5.51)
5.43 (5.07)
0.97 [0.99] 58.7 60.9 0.74
Local 1.78 (3.89)
2.53 (4.35)
0.14 [0.10]
0.67 (0.00)
2.28 (4.27)
3.24 (4.69)
0.14 [0.10] 30.4 41.3 0.06
All 3.48 (5.05)
3.67 (4.76)
0.52 [0.42]
0.76 (0.00)
4.44 (5.33)
4.69 (4.92)
0.52 [0.44] 50.0 55.1 0.42
Disaster Relief
National 5.02 (5.38)
8.76 (6.97)
0.00 [0.00]
0.53 (0.00)
5.68 (5.38)
9.91 (6.59)
0.00 [0.00] 67.4 86.0 0.01
State 4.49 (4.65)
5.94 (5.80)
0.03 [0.07]
0.71 (0.00)
5.08 (4.63)
6.72 (5.72)
0.03 [0.06] 69.8 76.7 0.26
Local 4.27 (5.10)
5.73 (5.57)
0.03 [0.02]
0.68 (0.00)
4.83 (5.17)
6.49 (5.49)
0.03 [0.02] 62.8 76.7 0.03
All 4.59 (5.02)
6.81 (6.25)
0.00 [0.00]
0.62 (0.00)
5.20 (5.04)
7.71 (6.11)
0.00 [0.00] 66.7 79.8 0.00
All Functions Pooled
National 4.78 (5.22)
6.24 (6.07)
0.00 [0.00]
0.63 (0.00)
5.56 (5.24)
7.26 (5.95)
0.00 [0.00] 63.4 74.7 0.00
State 4.58 (5.15)
4.94 (5.43)
0.29 [0.42]
0.63 (0.00)
5.33 (5.18)
5.74 (5.44)
0.29 [0.42] 62.9 65.6 0.46
Local 3.83 (5.21)
4.70 (5.49)
0.00 [0.00]
0.77 (0.00)
4.45 (5.37)
5.47 (5.56)
0.00 [0.00] 52.7 62.9 0.00
All 4.40 (5.20)
5.30 (5.70)
0.00 [0.00]
0.67 (0.00)
5.11 (5.27)
6.16 (5.70)
0.00 [0.00] 59.7 67.7 0.00
*: We conduct two-side t test and Wilcoxon signed-ranks test for matched pairs. P values for both tests are reported with those for Wilcoxon signed-rank test included in the brackets. Sign test of equality of median (not reported due to space limit) yields results consistent with signed-rank test.

28
Table 2: Unconditional Giving (random effects tobit, all causes pooled)
(1) (2) (3) Experimental variables yes yes yes Perceptions yes yes Political affiliations and demographics yes Charity 1.539*** (0.285) 1.431*** (0.349) 0.249 (0.593) Education -2.194*** (0.514) -2.027*** (0.525) -2.073*** (0.520) P&W -2.365*** (0.584) -2.193*** (0.621) -2.207*** (0.616) Disaster Relief -1.378*** (0.452) -1.649*** (0.462) -1.653*** (0.457) Texas -1.149*** (0.344) -1.189*** (0.345) -1.198*** (0.342) Dallas -2.105*** (0.349) -1.843*** (0.352) -1.847*** (0.348) Cancer-Disaster 4.952** (2.126) 5.043** (2.080) 3.308 (2.092) Cancer-Education -0.208 (2.142) -0.393 (2.093) -2.081 (2.124) P&W-Disaster -0.749 (2.279) -0.854 (2.227) -1.993 (2.164) important cause 0.592** (0.266) 0.597** (0.263) good organization 1.211*** (0.231) 1.173*** (0.229) Responsibility 0.379** (0.168) 0.378** (0.168) Female 4.252*** (1.632) non-Caucasian -0.743 (1.658) Age -0.027 (0.256) salary $14,000~27,999 2.222 (2.636) Charity*(salary $14,000~27,999) 2.464** (1.004) salary $28,000~43,999 0.599 (4.116) Charity*(salary $28,000~43,999) -0.407 (1.404) Republican -0.220 (2.322) Republican*charity 0.219 (0.844) Independent/Other 0.101 (1.835) Independent/Other *charity 1.717** (0.709) Constant 3.487** (1.547) -0.320 (1.989) -0.713 (5.534) Log-likelihood function -2254 -2129 -2115 Observations 1,116 1,064 1,064 Number of subjects 93 92 92 Notes: Dependent variable is the unconditional giving. Standard errors are in parentheses. * significant at the 10% level, ** significant at the 5% level, *** significant at the 1% level.

29
Table 3: Unconditional Giving by Type of Organization (random effects tobit)
(1) (2) (3) (4) (5) (6) Type charity charity charity government government government Experimental variables yes yes yes yes yes yes Perceptions yes yes yes yes Political affiliations and demographics yes yes
Education -3.479*** (0.639) -3.535*** (0.682) -3.570*** (0.682) -0.796 (0.669) -0.616 (0.708) -0.630 (0.707) P&W -2.692*** (0.735) -2.538*** (0.793) -2.523*** (0.792) -1.884*** (0.731) -1.492* (0.816) -1.482* (0.816) Disaster Relief -0.227 (0.572) -0.447 (0.604) -0.410 (0.604) -2.600*** (0.557) -2.629*** (0.583) -2.633*** (0.583) Texas -2.005*** (0.435) -2.003*** (0.448) -2.011*** (0.447) -0.278 (0.427) -0.478 (0.438) -0.478 (0.437) Dallas -2.447*** (0.438) -2.237*** (0.454) -2.245*** (0.453) -1.699*** (0.438) -1.667*** (0.451) -1.665*** (0.451) Cancer-Disaster 4.381** (2.091) 4.249** (2.109) 2.332 (2.069) 5.569** (2.326) 6.076*** (2.247) 4.656** (2.314) Cancer-Education 0.205 (2.097) -0.0267 (2.114) -1.888 (2.091) -1.497 (2.381) -1.280 (2.285) -2.545 (2.369) P&W-Disaster -1.881 (2.231) -2.124 (2.249) -3.503 (2.134) 1.150 (2.480) 1.548 (2.389) 0.629 (2.375) important cause 0.668** (0.334) 0.681** (0.333) 0.800** (0.355) 0.811** (0.354) good organization 0.219 (0.396) 0.270 (0.395) 0.903*** (0.313) 0.900*** (0.314) responsibility 0.451 (0.289) 0.364 (0.288) -0.039 (0.238) -0.039 (0.238) female 4.689*** (1.582) 3.791** (1.789) Non-Caucasian -0.871 (1.605) -1.040 (1.814) age 0.048 (0.247) -0.226 (0.287) salary $14,000~27,999 4.269* (2.493) 1.068 (2.906) salary $28,000~43,999 0.140 (3.929) 2.080 (4.438) Republican 0.145 (2.215) -0.471 (2.502) Independent/Other 1.151 (1.747) 0.016 (1.977) Constant 5.942*** (1.551) 1.769 (2.222) -0.774 (5.426) 2.447 (1.727) -0.851 (2.446) 2.990 (6.314) Log-likelihood function -1186 -1123 -1116 -1060 -1010 -1007 Observations 558 528 528 558 536 536 Number of subjects 93 92 92 93 92 92 Notes: Dependent variable is the unconditional giving. Standard errors are in parentheses. * significant at the 10% level, ** significant at the 5% level, *** significant at the 1% level.

30
Table 4: Likelihood of Giving
(random effects probit, all causes pooled)
(1) (2) (3) Experimental variables yes yes yes Perceptions yes yes Political affiliations and demographics yes Charity 0.484*** (0.115) 0.377** (0.149) 0.050 (0.276) Education -0.581*** (0.201) -0.499** (0.213) -0.537** (0.218) P&W -0.689*** (0.233) -0.743*** (0.260) -0.773*** (0.269) Disaster Relief -0.346 (0.230) -0.598** (0.255) -0.629** (0.258) Texas -0.317** (0.140) -0.420*** (0.150) -0.432*** (0.153) Dallas -0.693*** (0.143) -0.725*** (0.152) -0.744*** (0.155) Cancer-Disaster 2.051*** (0.636) 2.242*** (0.648) 1.888*** (0.676) Cancer-Education -0.105 (0.610) -0.164 (0.600) -0.736 (0.630) P&W-Disaster -0.165 (0.650) -0.092 (0.640) -0.412 (0.644) important cause 0.148 (0.105) 0.157 (0.109) good organization 0.502*** (0.093) 0.523*** (0.094) responsibility 0.044 (0.071) 0.045 (0.072) female 1.275** (0.506) non-Caucasian 0.161 (0.518) age -0.064 (0.077) salary $14,000~27,999 0.162 (0.859) Charity*(salary $14,000~27,999) 1.700*** (0.594) salary $28,000~43,999 0.829 (1.288) Charity*(salary $28,000~43,999) -0.001 (0.698) Republican 0.089 (0.713) Republican*charity -0.126 (0.369) Independent/Other 0.038 (0.572) Independent/Other *charity 0.456 (0.320) Constant 0.914** (0.463) 0.266 (0.690) 1.124 (1.697)
Log-likelihood function -422 -385 -372 Observations 1,116 1,064 1,064 Number of subjects 93 92 92 Notes: Dependent variable is the probability of giving a positive gift. Coefficient estimates are reported. Standard errors are in parentheses. * significant at the 10% level, ** significant at the 5% level, *** significant at the 1% level.

31
Table 5: Gift Size Conditional on Giving (random effects linear regressions, all causes pooled)
(1) (2) (3) Experimental variables yes yes yes Perceptions yes yes Political affiliations and demographics yes Charity 0.718*** (0.223) 0.790*** (0.266) 0.038 (0.461) Education -1.091*** (0.404) -1.232*** (0.416) -1.256*** (0.415) P&W -0.939** (0.456) -0.679 (0.481) -0.701 (0.480) Disaster Relief -0.871*** (0.333) -0.919*** (0.347) -0.907*** (0.346) Texas -0.779*** (0.260) -0.770*** (0.263) -0.781*** (0.262) Dallas -1.037*** (0.270) -0.854*** (0.274) -0.873*** (0.273) Cancer-Disaster 1.925 (1.305) 1.661 (1.324) 0.675 (1.501) Cancer-Education 0.250 (1.351) -0.186 (1.368) -1.235 (1.604) P&W-Disaster 0.074 (1.482) -0.456 (1.502) -1.321 (1.657) important cause 0.617*** (0.216) 0.637*** (0.216) good organization 0.485** (0.189) 0.477** (0.189) responsibility 0.326** (0.130) 0.305** (0.133) female 2.052* (1.124) non-Caucasian -1.407 (1.122) age 0.035 (0.179) salary $14,000~27,999 2.353 (1.788) Charity*(salary $14,000~27,999) 0.744 (0.796) salary $28,000~43,999 1.791 (3.077) Charity*(salary $28,000~43,999) -0.615 (1.108) Republican -1.438 (1.764) Republican*charity 0.746 (0.676) Independent/Other -1.570 (1.361) Independent/Other *charity 1.000* (0.562)
Constant 7.259*** (1.007) 3.665** (1.435) 3.960 (3.827) Observations 711 678 678 R2 0.042 0.081 0.136 Number of subjects 80 79 79 Notes: Dependent variable is gifts conditional on giving; standard errors are included in parentheses; * significant at the 10% level, ** significant at the 5% level, *** significant at the 1% level.

32
Table 6. Random Effect Tobit Model on Unconditional Giving (by Cause)
(1) (2) (3) (4) (5) (6) (7) (8) (9) (10) (11) (12)
Funcation Cancer Cancer Cancer Education Education Education P&W P&W P&W Disaster Disaster Disaster
Experimental variables yes yes yes yes yes yes yes yes yes yes yes yes
Perceptions yes yes yes yes yes yes yes yes Political affiliations and demographics yes yes yes yes
charity 2.276*** 1.149* -0.385 -0.003 0.366 -1.473 0.515 0.660 -2.643 3.140*** 2.787*** 2.353**
(0.530) (0.681) (0.962) (0.555) (0.841) (1.354) (0.554) (0.708) (1.823) (0.534) (0.655) (0.997)
Texas -0.786 0.274 0.176 -1.441** -1.834*** -1.940*** -0.097 -0.290 -0.330 -2.183*** -2.369*** -2.331***
(0.646) (0.678) (0.662) (0.667) (0.683) (0.668) (0.649) (0.687) (0.678) (0.646) (0.652) (0.652)
Dallas 0.334 1.871*** 1.723** -2.351*** -2.542*** -2.607*** -4.508*** -4.212*** -4.218*** -2.603*** -2.789*** -2.750***
(0.642) (0.723) (0.707) (0.685) (0.694) (0.677) (0.712) (0.742) (0.731) (0.650) (0.659) (0.659)
cancer-disaster 5.698*** 5.215*** 4.932*** 4.950** 6.162*** 5.189***
(2.028) (1.821) (1.666) (2.202) (2.348) (1.932)
cancer-education -0.090 -0.057 0.387
(2.086) (2.141) (2.160)
P&W-disaster -1.469 -0.105 -0.626
(2.645) (2.386) (2.425)
important cause 2.801** 2.757** -0.825 -0.508 4.153*** 2.437 1.657 1.070
(1.131) (1.166) (1.505) (1.365) (1.404) (1.527) (1.637) (1.393)
good organizations 2.188*** 2.012*** 1.142** 1.353*** 0.671 0.754 1.127** 1.026**
(0.522) (0.514) (0.453) (0.449) (0.583) (0.580) (0.484) (0.499)
responsibility 0.300 0.251 0.330 0.398 0.336 0.312 0.485 0.451
(0.338) (0.331) (0.376) (0.389) (0.381) (0.394) (0.360) (0.367)
female 5.942*** 4.234* 0.123 5.575***
(2.009) (2.366) (2.583) (1.838)
Non-Caucasian -3.282* 0.159 -0.100 -1.479
(1.980) (2.530) (2.779) (1.864)
age 0.060 -0.274 -0.371 -0.244

33
(0.341) (0.360) (0.531) (0.420)
economics major 0.704 -3.696 -4.986 -6.059
(3.180) (4.020) (5.656) (3.739)
salary $14,000~27,999 -0.477 -8.299** 9.523** 8.636***
(2.903) (4.218) (4.857) (3.258) Charity*( salary $14,000~27,999) 2.618 6.267*** 1.393 -0.184
(1.643) (2.315) (2.281) (1.908)
salary $28,000~43,999 1.166 -1.984 6.553 2.364
(7.161) (5.029) (5.324) (7.260) Charity*(salary $28,000~43,999) -1.056 0.095 0.086 -0.0005
(3.243) (2.962) (2.371) (2.613)
Republican -6.879** 8.328*** 4.007 -7.510**
(3.206) (3.226) (3.655) (2.992)
Republican*charity 0.645 -0.528 3.437* 1.611
(1.772) (1.677) (2.007) (1.792)
Independent/Other -2.780 4.696* 1.466 -3.634
(2.033) (2.611) (3.497) (2.247)
Independent/Other *charity 2.310** 2.934* 3.573* 0.514
(1.146) (1.565) (1.996) (1.287)
Constant 1.601 -11.40** -12.01 2.371 5.208 3.506 2.040 -14.70*** -3.347 1.519 -7.848 0.456
(1.551) (5.222) (8.222) (1.491) (6.906) (9.743) (1.749) (5.612) (11.76) (1.739) (7.632) (9.634)
Log-likelihood function -662.6 -616.2 -607.5 -563.2 -540.2 -525.4 -483.6 -428.6 -422.2 -589.1 -579.7 -567.3
Observations 282 266 266 300 291 291 276 251 251 258 256 256
Number of subjects 47 46 46 50 49 49 46 42 42 43 43 43
Notes: Standard errors in parentheses. * - significant at 10% level; ** - significant at 5% level; *** - significant at 1% level.

34
Table 7. Summary Statistics on Giving by Political Affiliation
Republican (20 percent)
Democrat (25 percent)
Independent/Other (55 percent)
Function Level Private ($)
Gov ($)
Private ($)
Gov ($)
Private ($)
Gov ($)
Cancer Research National 5.83 6.00 7.52 6.77 8.58 4.85 State 5.00 5.00 7.33 7.07 7.15 4.81 Local 6.50 4.50 7.30 7.53 7.27 6.38
All levels 5.78 5.17 7.38 7.12 7.67 5.35 Education National 6.27 6.36 1.67 2.33 4.85 4.04
State 2.64 5.36 1.42 1.92 3.56 4.52 Local 4.27 3.91 2.17 2.08 3.74 2.67
All levels 4.39 5.21 1.75 2.11 4.05 3.74 P&W National 4.77 5.77 1.13 2.13 4.92 4.45
State 5.54 5.08 0.50 0.88 4.78 4.86 Local 3.00 1.38 0.25 1.63 3.02 2.04
All levels 4.44 4.08 0.63 1.54 4.24 3.78 Disaster Relief National 4.75 2.50 10.73 7.36 9.19 4.79
State 4.38 2.25 7.23 5.45 5.88 4.79 Local 4.38 3.50 6.91 6.14 5.65 3.67
All levels 4.50 2.75 8.29 6.32 6.90 4.42 All functions All levels 4.78 4.30 4.51 4.27 5.71 4.32

35
0.00
0.05
0.10
0.15
0.20
0.25
0.30
0.35
0.40
0 1 2 3 4 5 6 7 8 9 10 11 12 13 14 15 16 17 18 19 20
Frac
tion
Donation ($)
Figure 1: Donation Histogram (All Data)
0123456789
10
US Government US Charity TX Government
TX Charity Dallas Government
Dallas Charity
Don
atio
n ($
)
Type/Level of organizations
Figure 2: Average Donations ($)
Disaster Relief
Parks & Wildlife
Education Enhancement
Cancer Research