Embed Size (px)
Citation preview
Environmental Taxes in Europe
Thomas Sterner and
Gunnar Köhlin Department of Economics
Göteborg University, Sweden Abstract
This paper provides an overview and a discussion of environmental taxes in Europe. On the whole, most European countries have fairly high levels of environmental taxation – at least compared to the US. This appears broadly speaking to be true of both tax levels and tax revenues. It is partly related to a greater reliance on taxes as an instrument of environmental policy and partly due to a greater acceptance of taxes and maybe a larger public sector overall. It may also be due to a more ambitious goal when it comes to reductions in fossil energy use, particularly for transportation. There is still considerable variation within Europe when it comes to the level of taxation, the use of the revenues collected and other issues. Introduction1
In this article we discuss environmental taxes in Europe. Revenues from these taxes average around 3% of GDP or 8% of government revenue (OECD, 2002) and are widely accepted – not only in Germany and the Scandinavian countries where green parties are strong – but also in many Southern and Eastern European countries with less pronounced green movements.
The stylized fact is that the USA prefers tradable permits2 and particularly freely allocated, grandfathered, permits while Europe prefers 1 Special thanks to Nils-Axel Bråthen at the OECD for useful and enlightening discussions concerning these data. 2 One striking feature of permits is the dominance of the US experience: outside the US the only important applications are in fisheries.
2
taxation. It is tempting to see this as a reflection of a stronger belief in individual private rights and particularly the “prior appropriation” doctrine (the right of the first user) in the US. The corresponding credo in Europe is rather in favor of the benign and paternalistic state as a representative of “societal” interests. There is probably a good deal of path dependency in the learning and lobbying processes that characterize the development of policy over time. Originally, environmentally related taxes and fees in some European countries were intended mainly to finance water supply, sewage treatment, road construction etc. However, gradually policy makers and others found that they also led to energy and resource savings that provided motivation for continued increases of these taxes. As the taxes grew gradually, society adapted to them and some groups may even have realized that they benefit from them, such as public employees in general, and in the case of fuel taxes the producers of energy efficient cars and those who work for public transportation etc.
A common trait for these industrialized countries is that basic regulation and licensing forms the backbone of environmental protection. The market-based and other instruments are not construed as alternatives so much as complements to the traditional instruments.
A number of formerly planned economies of Eastern Europe implemented a form of environmental taxes already under the old regime. These did not really operate as Pigouvian taxes since the firms had “soft budget constraints”: They did not earn their revenues on a market but were allocated ministerial funds in relation to “needs”. Additional “taxes” would thus be paired with additional allocation of “funds” to pay them so there was no incentive effect at all! The taxes did however raise revenue for funds that were used for some abatement and restoration. They also raised environmental awareness and they facilitated the introduction of real tax instruments as these economies embarked on their transition towards market economies.
As shown by various authors on fiscal federalism, there are strong welfare arguments in favor of ‘subsidiarity’ (which is the jargon used within the European Union for finding an appropriate level of decentralization for each particular political topic), see for instance Oates (1998). Allowing local legislations to adapt policies to local conditions can lead to considerable gains as is well known in countries that are political
3
federations (including the US and Germany). This assumes however that these legislations are large enough to internalize most of the pollution and that they have the appropriate instruments in order to implement an optimal policy. In the case of transboundary pollution or the management of global commons, international policies or at least coordination of policies is clearly called for.
Within the European Union the need for common environmental
regulation, as a response to cross-boundary pollution, has been one important justification for greater harmonization between countries. Historically the EU has also been a progressive force in countries with less developed environmental regulation. This argument has also been important in order to persuade skeptics in countries about to join the EU. There have even been (green) voices proposing that the development and implementation of environmental policies should be a major theme for the EU. In recent policy papers the Environmental Directorate of the European Commission has given particular emphasis to environmental taxation (Schlegelmilch, 1998).
Naturally, an important force behind environmental taxes is political pressure and in many European countries green parties have succeeded in establishing themselves in both parliament and in some cases government. There has been quite a popular pressure in favor of environmental tax reform and several countries have officially carried out such reforms in a more or less ambitious way. Both taxes and regulations have to be enforced to be meaningful. When it comes to taxes, experience is that various forms of tax relief crop up, particularly in the energy intensive industries where the incentive effect is most needed. Public opinion, even among green parties tends to want to avoid bankruptcy and thus the affected industries are usually quite successful when lobbying for exceptions. This is discussed particularly for the case of Swedish energy taxes below. The difficulty in enforcing and levying traditional taxes has led to a number of innovations such as revenue recycling or revenue neutral instruments that will also be discussed below (see for instance the NOx charge in Sweden). The menu of policy instruments
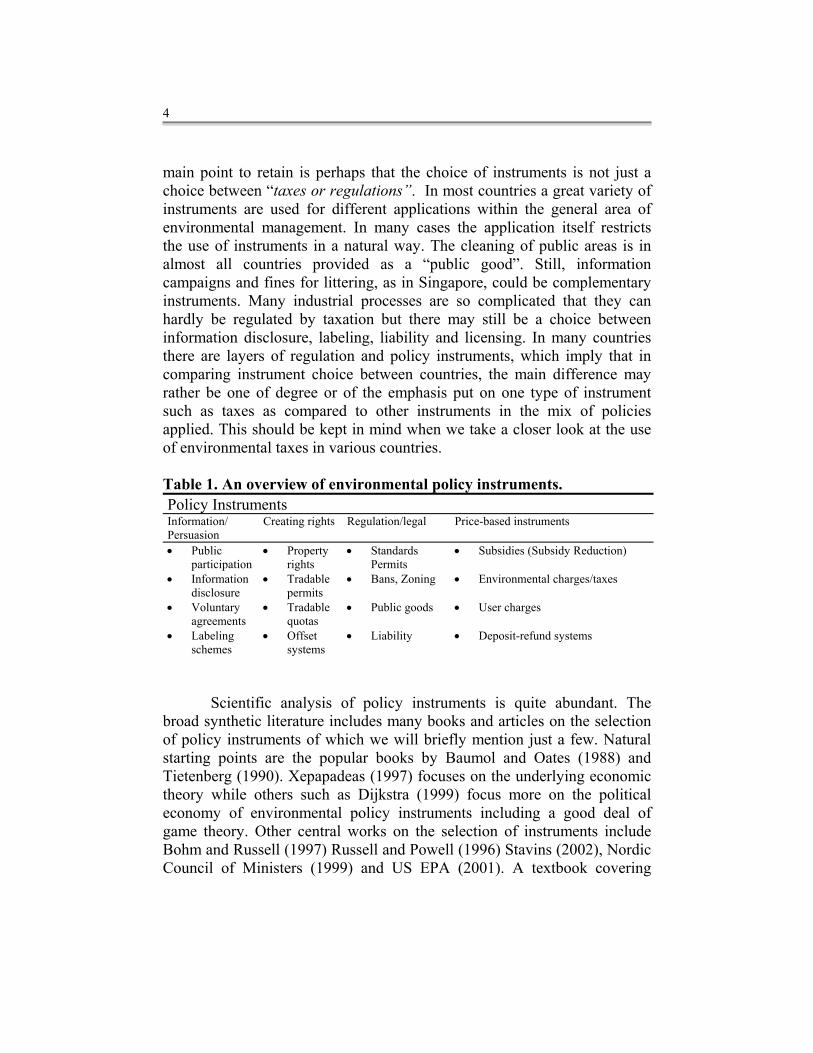
There is no universally accepted taxonomy of environmental policy instruments, but table 1 shows one that may be useful in this context. The
4
main point to retain is perhaps that the choice of instruments is not just a choice between “taxes or regulations”. In most countries a great variety of instruments are used for different applications within the general area of environmental management. In many cases the application itself restricts the use of instruments in a natural way. The cleaning of public areas is in almost all countries provided as a “public good”. Still, information campaigns and fines for littering, as in Singapore, could be complementary instruments. Many industrial processes are so complicated that they can hardly be regulated by taxation but there may still be a choice between information disclosure, labeling, liability and licensing. In many countries there are layers of regulation and policy instruments, which imply that in comparing instrument choice between countries, the main difference may rather be one of degree or of the emphasis put on one type of instrument such as taxes as compared to other instruments in the mix of policies applied. This should be kept in mind when we take a closer look at the use of environmental taxes in various countries. Table 1. An overview of environmental policy instruments. Policy Instruments Information/ Persuasion
Creating rights Regulation/legal Price-based instruments
• Public participation
• Property rights
• Standards Permits
• Subsidies (Subsidy Reduction)
• Information disclosure
• Tradable permits
• Bans, Zoning • Environmental charges/taxes
• Voluntary agreements
• Tradable quotas
• Public goods • User charges
• Labeling schemes
• Offset systems
• Liability • Deposit-refund systems
Scientific analysis of policy instruments is quite abundant. The broad synthetic literature includes many books and articles on the selection of policy instruments of which we will briefly mention just a few. Natural starting points are the popular books by Baumol and Oates (1988) and Tietenberg (1990). Xepapadeas (1997) focuses on the underlying economic theory while others such as Dijkstra (1999) focus more on the political economy of environmental policy instruments including a good deal of game theory. Other central works on the selection of instruments include Bohm and Russell (1997) Russell and Powell (1996) Stavins (2002), Nordic Council of Ministers (1999) and US EPA (2001). A textbook covering
5
theory and applications in both developing3 and industrialized countries is Sterner (2002). A recent survey of European environmental taxes is found in Ekins (1999).
There are thus many possible ways to structure a review of environmental taxes. In the following we present a model that distinguishes between countries and firms to lay the foundation for a comparison of environmental taxes. We then start the analysis with a comparison of environmental tax revenues including a discussion of the limitations of such an approach. This is followed by comparisons of tax rates for gasoline, carbon, sulphur, nitrogen, lead, water effluent and waste. Taxes as indicators of environmental policy
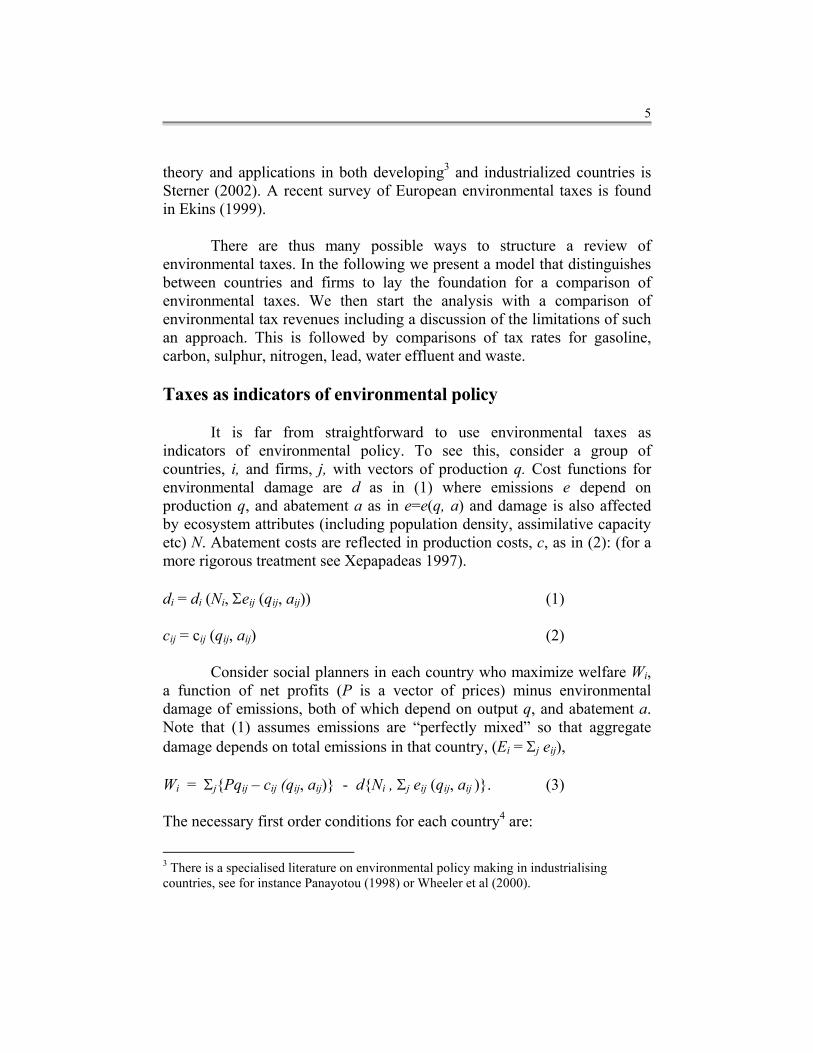
It is far from straightforward to use environmental taxes as indicators of environmental policy. To see this, consider a group of countries, i, and firms, j, with vectors of production q. Cost functions for environmental damage are d as in (1) where emissions e depend on production q, and abatement a as in e=e(q, a) and damage is also affected by ecosystem attributes (including population density, assimilative capacity etc) N. Abatement costs are reflected in production costs, c, as in (2): (for a more rigorous treatment see Xepapadeas 1997). di = di (Ni, Σeij (qij, aij)) (1) cij = cij (qij, aij) (2)
Consider social planners in each country who maximize welfare Wi, a function of net profits (P is a vector of prices) minus environmental damage of emissions, both of which depend on output q, and abatement a. Note that (1) assumes emissions are “perfectly mixed” so that aggregate damage depends on total emissions in that country, (Ei = Σj eij), Wi = Σj{Pqij – cij (qij, aij)} - d{Ni , Σj eij (qij, aij )}. (3) The necessary first order conditions for each country4 are:
3 There is a specialised literature on environmental policy making in industrialising countries, see for instance Panayotou (1998) or Wheeler et al (2000).
6
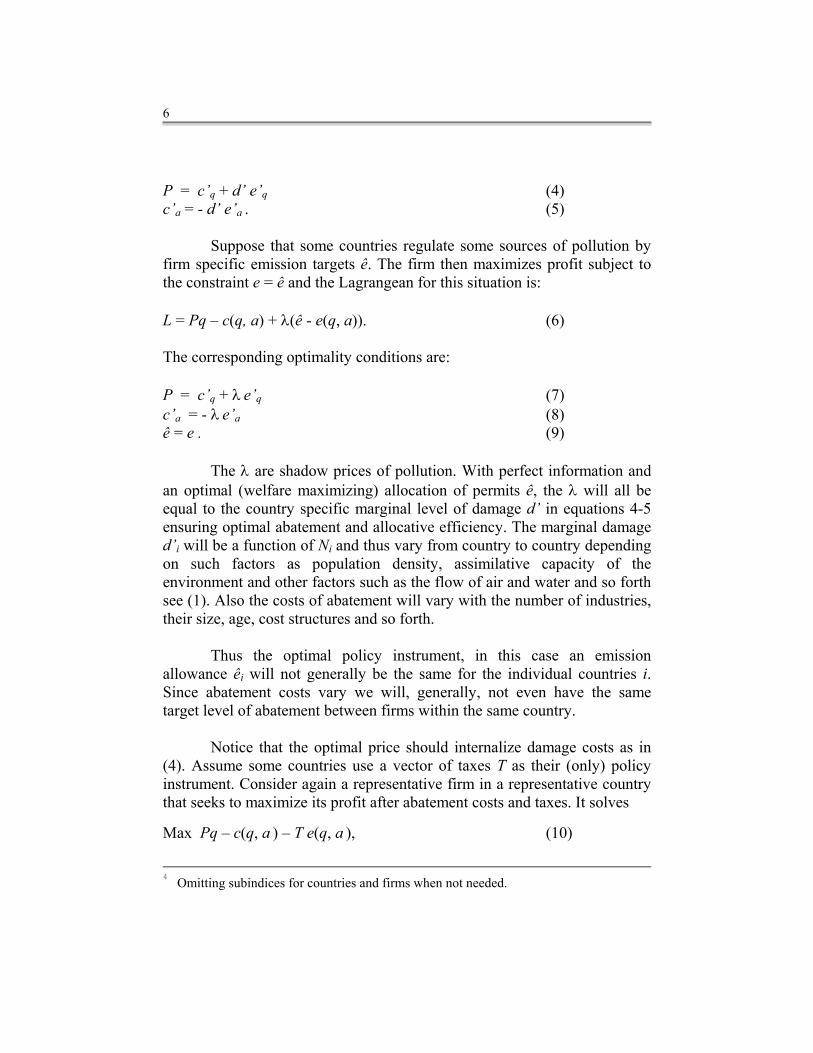
P = c’q + d’ e’q (4) c’a = - d’ e’a . (5)
Suppose that some countries regulate some sources of pollution by firm specific emission targets ê. The firm then maximizes profit subject to the constraint e = ê and the Lagrangean for this situation is: L = Pq – c(q, a) + λ(ê - e(q, a)). (6) The corresponding optimality conditions are: P = c’q + λ e’q (7) c’a = - λ e’a (8) ê = e . (9)
The λ are shadow prices of pollution. With perfect information and an optimal (welfare maximizing) allocation of permits ê, the λ will all be equal to the country specific marginal level of damage d’ in equations 4-5 ensuring optimal abatement and allocative efficiency. The marginal damage d’i will be a function of Ni and thus vary from country to country depending on such factors as population density, assimilative capacity of the environment and other factors such as the flow of air and water and so forth see (1). Also the costs of abatement will vary with the number of industries, their size, age, cost structures and so forth.
Thus the optimal policy instrument, in this case an emission allowance êi will not generally be the same for the individual countries i. Since abatement costs vary we will, generally, not even have the same target level of abatement between firms within the same country.
Notice that the optimal price should internalize damage costs as in (4). Assume some countries use a vector of taxes T as their (only) policy instrument. Consider again a representative firm in a representative country that seeks to maximize its profit after abatement costs and taxes. It solves Max Pq – c(q, a ) – T e(q, a ), (10)
4 Omitting subindices for countries and firms when not needed.
7
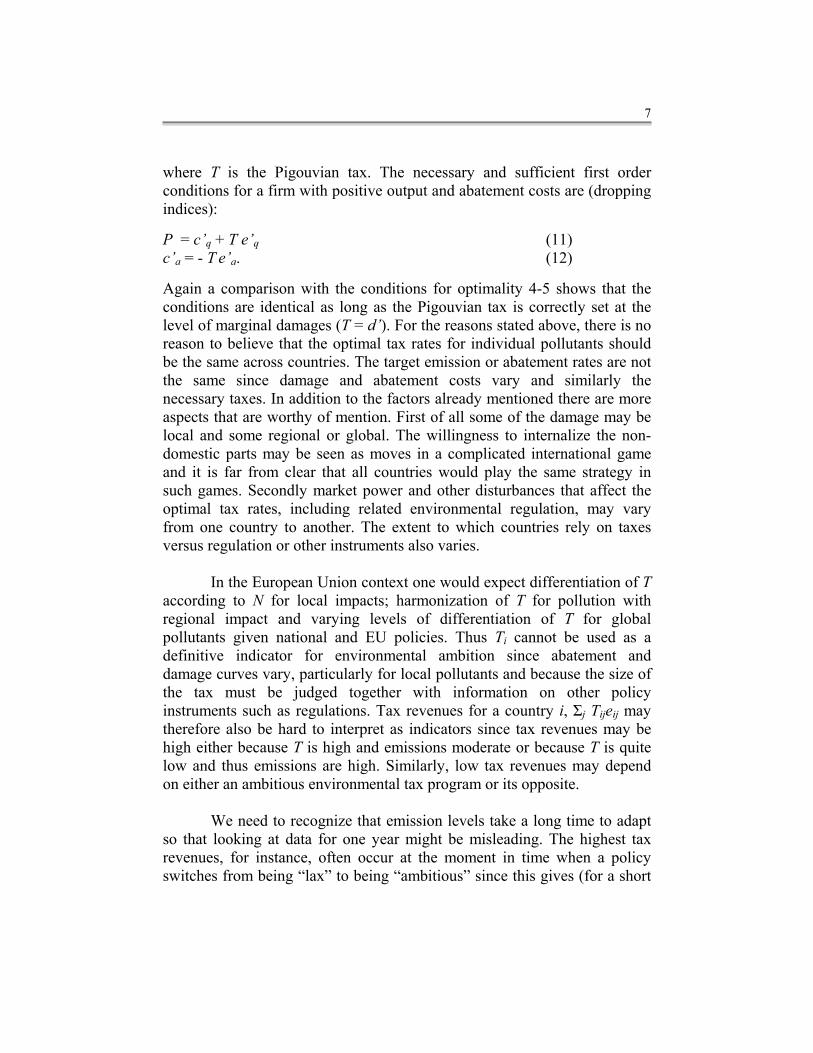
where T is the Pigouvian tax. The necessary and sufficient first order conditions for a firm with positive output and abatement costs are (dropping indices): P = c’q + T e’q (11) c’a = - T e’a. (12)
Again a comparison with the conditions for optimality 4-5 shows that the conditions are identical as long as the Pigouvian tax is correctly set at the level of marginal damages (T = d’). For the reasons stated above, there is no reason to believe that the optimal tax rates for individual pollutants should be the same across countries. The target emission or abatement rates are not the same since damage and abatement costs vary and similarly the necessary taxes. In addition to the factors already mentioned there are more aspects that are worthy of mention. First of all some of the damage may be local and some regional or global. The willingness to internalize the non-domestic parts may be seen as moves in a complicated international game and it is far from clear that all countries would play the same strategy in such games. Secondly market power and other disturbances that affect the optimal tax rates, including related environmental regulation, may vary from one country to another. The extent to which countries rely on taxes versus regulation or other instruments also varies.
In the European Union context one would expect differentiation of T according to N for local impacts; harmonization of T for pollution with regional impact and varying levels of differentiation of T for global pollutants given national and EU policies. Thus Ti cannot be used as a definitive indicator for environmental ambition since abatement and damage curves vary, particularly for local pollutants and because the size of the tax must be judged together with information on other policy instruments such as regulations. Tax revenues for a country i, Σj Tijeij may therefore also be hard to interpret as indicators since tax revenues may be high either because T is high and emissions moderate or because T is quite low and thus emissions are high. Similarly, low tax revenues may depend on either an ambitious environmental tax program or its opposite.
We need to recognize that emission levels take a long time to adapt so that looking at data for one year might be misleading. The highest tax revenues, for instance, often occur at the moment in time when a policy switches from being “lax” to being “ambitious” since this gives (for a short
8
period) a combination of high tax rates and high emission levels. Looking at several years of data on both production, tax and tax revenues does at least partly alleviate these concerns. It is also important to look at the composition of the environmental tax revenues: Generally a dominating share comes from the energy and transport sectors and can (partly) be interpreted as targeting global pollution. Since tax elasticities are fairly low5, high revenues from these taxes will be a reasonable reflection of an ambitious (environmental) tax policy.
An additional factor that complicates comparisons across countries is that different countries use different policy instruments to deal with different environmental issues. Some use regulations of some sort, others use taxes or charges, tradable permits, voluntary agreements, liability, labeling or other information disclosure strategies. It is not at all uncommon for a country to combine several instruments. Although it is not necessarily easy to judge the combined effect of a tax and a regulation it is clear that when a small tax is combined with strong regulations the tax is non-binding and such a tax is mainly fiscal and can not easily be compared with a classical Pigouvian tax. This means that the optimal level of say abatement requirements and charges would be different from the corresponding optimal levels if either instrument were used in isolation. An international comparison of environmental tax revenues
A practical difficulty in comparing environmental tax revenues is deciding what to include. A striking example is the USA where the IRS has an official category “Environmental taxes” which covered only 130 million USD in 2001 mainly from ozone depleting substances. By this definition environmental taxes (IRS 2002) have fallen dramatically since 1995 (down from about 1.5 billion USD) and now only constitute a minute .0007% of US GDP. However total US excise taxes in 2000 were 54 billion USD of which around 30 billion USD were taxes on gasoline, diesel and other fuels. Other large items were alcohol, tobacco, air traffic and telephone. Some would argue that tobacco taxes are supposed to internalize factors such as the health damages of secondary smoking and that this is a typical inter-
5 If price elasticities are around –0.7 and the tax share in prices is 50% then the tax elasticity will only be around –0.35. For sulphur emissions however, elasticities are high and this relationship would not hold.
9
personal, environmental externality. In the OECD statistics that we use here (OECD 2002), tobacco taxes are not included but most fuel and transportation-related taxes are – and in fact they form, by far, the largest share of what is called environmental taxes here.
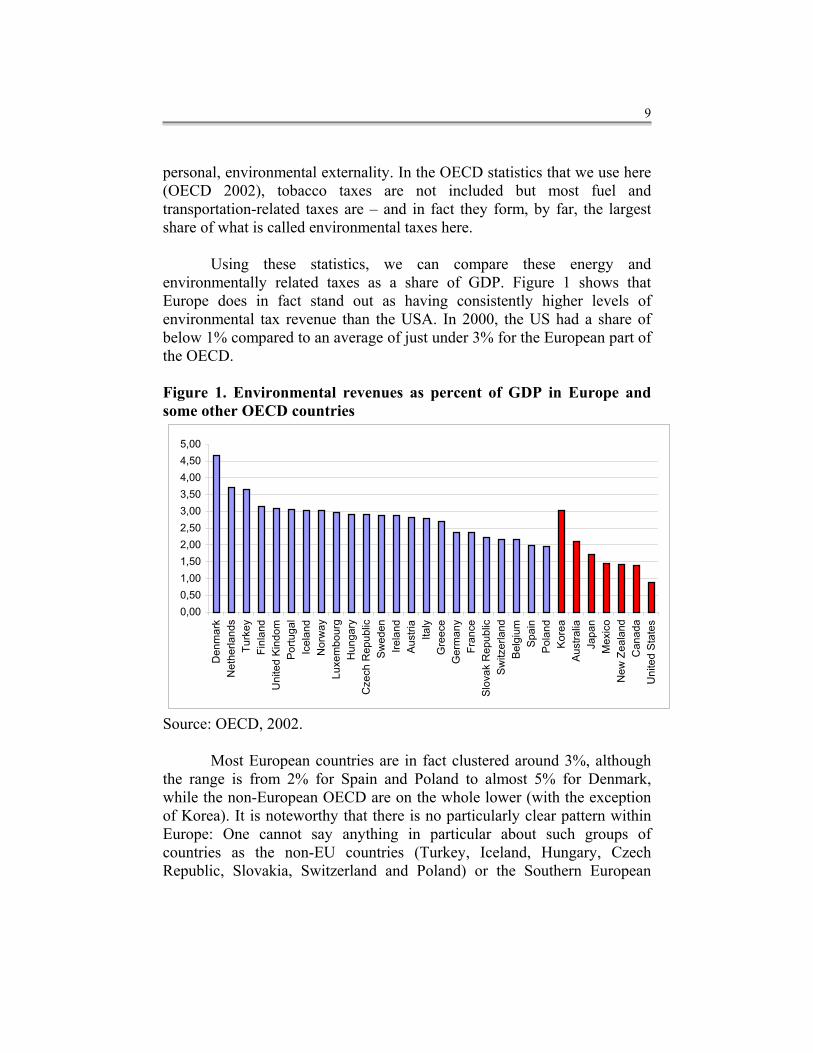
Using these statistics, we can compare these energy and environmentally related taxes as a share of GDP. Figure 1 shows that Europe does in fact stand out as having consistently higher levels of environmental tax revenue than the USA. In 2000, the US had a share of below 1% compared to an average of just under 3% for the European part of the OECD. Figure 1. Environmental revenues as percent of GDP in Europe and some other OECD countries
0,000,501,001,502,002,503,003,504,004,505,00
Den
mar
kN
ethe
rland
sTu
rkey
Finl
and
Uni
ted
Kind
omPo
rtuga
lIc
elan
dN
orw
ayLu
xem
bour
gH
unga
ryC
zech
Rep
ublic
Swed
enIre
land
Aust
riaIta
lyG
reec
eG
erm
any
Fran
ceSl
ovak
Rep
ublic
Switz
erla
ndB
elgi
umSp
ain
Pola
ndKo
rea
Aus
tralia
Japa
nM
exic
oN
ew Z
eala
ndC
anad
aU
nite
d St
ates
Source: OECD, 2002.
Most European countries are in fact clustered around 3%, although the range is from 2% for Spain and Poland to almost 5% for Denmark, while the non-European OECD are on the whole lower (with the exception of Korea). It is noteworthy that there is no particularly clear pattern within Europe: One cannot say anything in particular about such groups of countries as the non-EU countries (Turkey, Iceland, Hungary, Czech Republic, Slovakia, Switzerland and Poland) or the Southern European
10
countries such as Greece, Italy, Spain, Portugal and Turkey. Some observers might believe that these countries would on the whole have a less ambitious environmental profile than for instance the Netherlands, Germany and Scandinavia that are often considered as being influenced by “green politics”, but this does not come out in any clear way in the ranking of countries here (as we would indeed not expect from our earlier discussion). Following our earlier discussion, we hesitate to comment on environmental tax revenues for a single year, since a high value might be transitory as a new tax will lead to erosion of the tax base due to abatement – which may well be a beneficial and intended outcome. The OECD data covers environmental revenues for 7 years 1994-2000. We have looked at the variance in environmental tax revenues and time trends in the data and found that environmental tax revenues are in fact rather stable in most countries: The average standard deviation for all the European countries is 0.26 and most of this variation is due to some smaller countries, the average standard deviation for the major EU economies of France, Germany, UK, and Italy is only 0.07. This shows that the environmental revenues have on the whole been very stable and that the figures that we are discussing from 2000 are indeed representative for each respective country. Over the whole period, the European average has also been virtually constant at 2.8%. Few countries have any large and clear trend in environmental tax revenues although a few countries have some variation – most notably Hungary which is by far the most erratic, its environmental tax revenues rise from 4 to 5 and then fall back under 3% of GDP.
As mentioned, interpretation must be cautious: low tax revenues may be due to a low tax level (as gasoline taxes in the USA) or low emissions (e.g. consumption of gasoline per capita as in Japan). Furthermore the countries import and export goods, services and emissions in complex ways. Vehicle and fuel taxes are an important part of these tax data and some countries have a much larger fraction of transit traffic than others. Some countries such as Luxembourg have even been notorious for attracting motorists from neighboring countries by having low fuel taxes. These motorists thus go to Luxembourg to fuel their cars and thus Luxembourg combines very low tax rates with very high tax revenues.
An aspect that is worth mention is the fact that total tax revenues varies quite strongly as a share of GDP. In the US, Canada and Australia the

11
0,00
0,50
1,00
1,50
2,00
2,50
3,00
3,50
4,00
4,50
5,00
0 10 20 30 40 50
Total tax share in GDP
Envir
onm
tax s
hare
in G
DP
US
DK
NZBEL
TURK
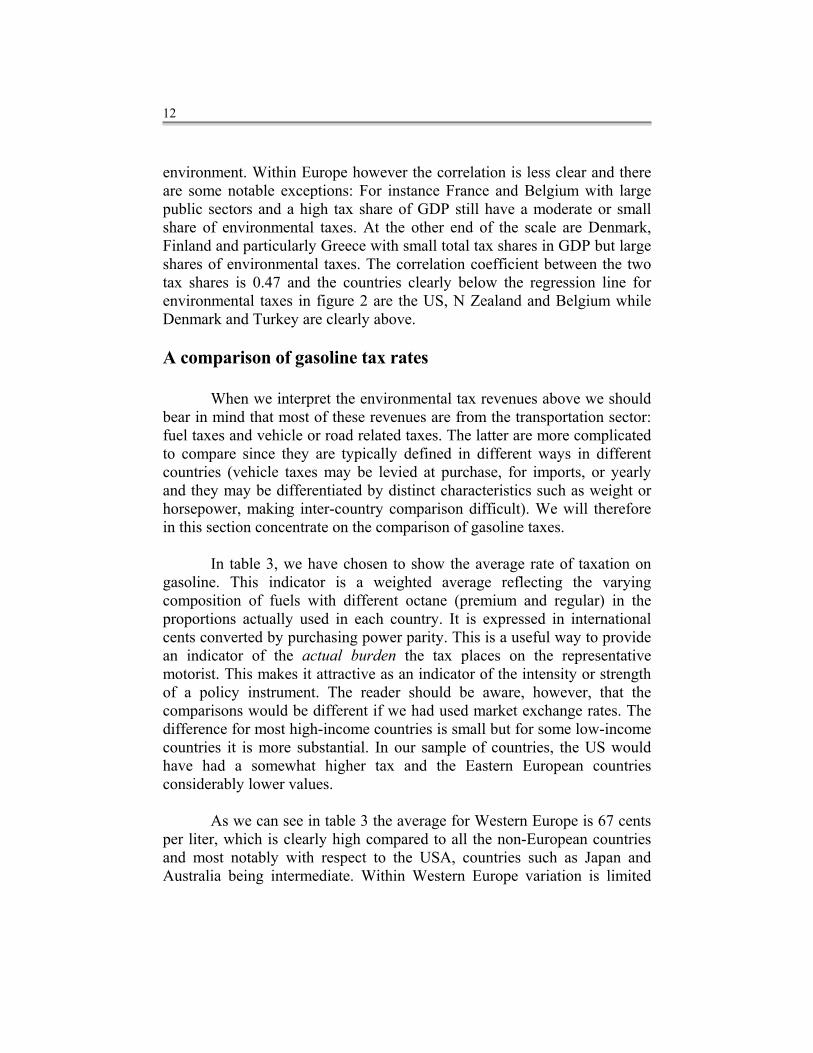
tax share is around 20%. There are a few European countries with taxes that are in the same range but most of them are actually in the range of 30-40% irrespective of whether they belong to the North or South of Europe or whether they belong to the former “Eastern” or Western sphere, see table 2. It is, however, again, not easy to say what the effect of the share of taxes in GDP should be on the share of environmental taxes in GDP. One might say that with low taxes in general as a share of GDP one would expect any particular tax to be a small share of GDP. This line of reasoning appears to assume that there is some logic by which environmental taxes should be some proportion of total taxes. One such reason would be if the motivation for environmental taxes were not primarily to correct for environmental externalities but rather exploit a tax base. If instead we were to believe that environmental taxes were decided simply on the logic of what is needed in order to attain a livable ambient quality, then one would simply expect environmental taxes to be a larger share of total taxes in countries with a bad environmental situation. Table 2. Taxes as share of GDP
% range Countries 20-22 USA, Canada, Greece, Switzerland, Turkey, Australia, 26-29 Germany, Iceland, Spain, Finland. Poland, New Zealand 31-33 Ireland, Portugal, Slovakia, Denmark, Czech. R, Hungary 34-35 Norway, Austria, Sweden, UK 39-43 France, Italy, Luxembourg, Netherlands, Belgium Source: World Development Report Indicators 2002, Figures are for 2000 or latest available year. Countries are in order by ascending percentage. Figure 2. Environmental and total tax shares in GDP
As can be seen by
comparing table 2 and figure 2, there is a certain amount of correspondence in the sense that the non-European OECD countries like the US, Canada and Australia do appear to rely much less on taxes in general and as a means to improving the
12
environment. Within Europe however the correlation is less clear and there are some notable exceptions: For instance France and Belgium with large public sectors and a high tax share of GDP still have a moderate or small share of environmental taxes. At the other end of the scale are Denmark, Finland and particularly Greece with small total tax shares in GDP but large shares of environmental taxes. The correlation coefficient between the two tax shares is 0.47 and the countries clearly below the regression line for environmental taxes in figure 2 are the US, N Zealand and Belgium while Denmark and Turkey are clearly above. A comparison of gasoline tax rates
When we interpret the environmental tax revenues above we should bear in mind that most of these revenues are from the transportation sector: fuel taxes and vehicle or road related taxes. The latter are more complicated to compare since they are typically defined in different ways in different countries (vehicle taxes may be levied at purchase, for imports, or yearly and they may be differentiated by distinct characteristics such as weight or horsepower, making inter-country comparison difficult). We will therefore in this section concentrate on the comparison of gasoline taxes.
In table 3, we have chosen to show the average rate of taxation on gasoline. This indicator is a weighted average reflecting the varying composition of fuels with different octane (premium and regular) in the proportions actually used in each country. It is expressed in international cents converted by purchasing power parity. This is a useful way to provide an indicator of the actual burden the tax places on the representative motorist. This makes it attractive as an indicator of the intensity or strength of a policy instrument. The reader should be aware, however, that the comparisons would be different if we had used market exchange rates. The difference for most high-income countries is small but for some low-income countries it is more substantial. In our sample of countries, the US would have had a somewhat higher tax and the Eastern European countries considerably lower values.
As we can see in table 3 the average for Western Europe is 67 cents per liter, which is clearly high compared to all the non-European countries and most notably with respect to the USA, countries such as Japan and Australia being intermediate. Within Western Europe variation is limited
13
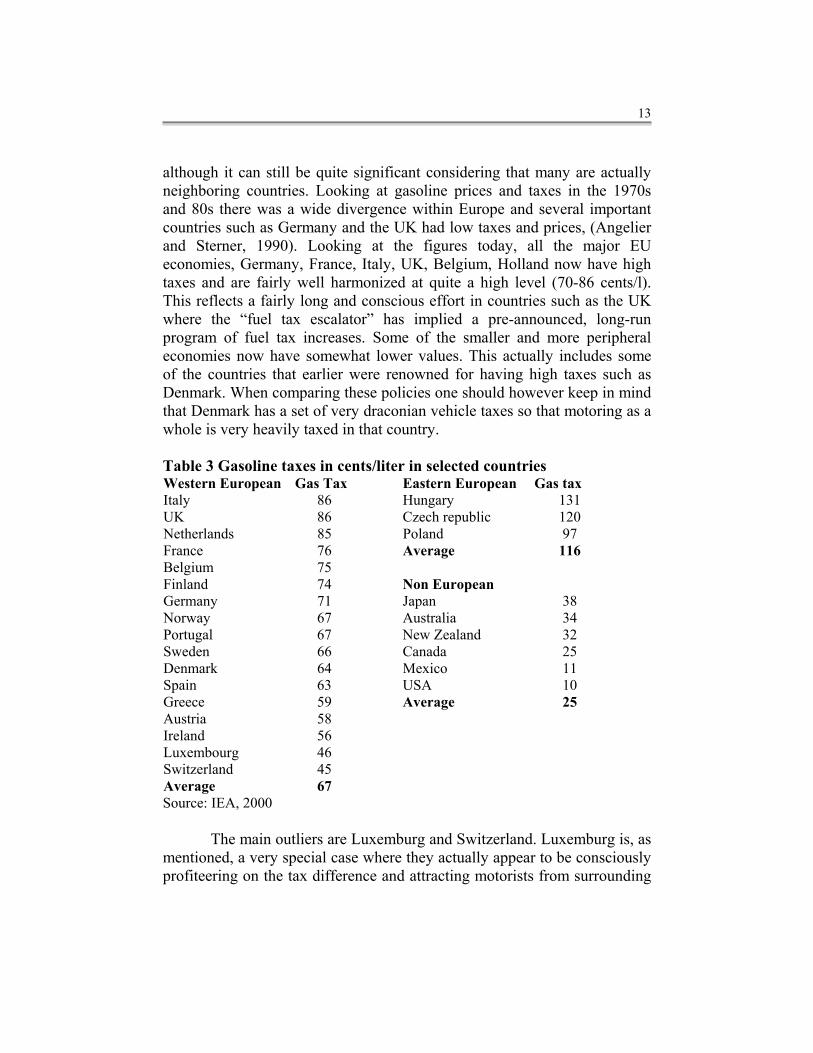
although it can still be quite significant considering that many are actually neighboring countries. Looking at gasoline prices and taxes in the 1970s and 80s there was a wide divergence within Europe and several important countries such as Germany and the UK had low taxes and prices, (Angelier and Sterner, 1990). Looking at the figures today, all the major EU economies, Germany, France, Italy, UK, Belgium, Holland now have high taxes and are fairly well harmonized at quite a high level (70-86 cents/l). This reflects a fairly long and conscious effort in countries such as the UK where the “fuel tax escalator” has implied a pre-announced, long-run program of fuel tax increases. Some of the smaller and more peripheral economies now have somewhat lower values. This actually includes some of the countries that earlier were renowned for having high taxes such as Denmark. When comparing these policies one should however keep in mind that Denmark has a set of very draconian vehicle taxes so that motoring as a whole is very heavily taxed in that country. Table 3 Gasoline taxes in cents/liter in selected countries Western European Gas Tax Eastern European Gas tax Italy 86 Hungary 131 UK 86 Czech republic 120 Netherlands 85 Poland 97 France 76 Average 116 Belgium 75 Finland 74 Non European Germany 71 Japan 38 Norway 67 Australia 34 Portugal 67 New Zealand 32 Sweden 66 Canada 25 Denmark 64 Mexico 11 Spain 63 USA 10 Greece 59 Average 25 Austria 58 Ireland 56 Luxembourg 46 Switzerland 45 Average 67 Source: IEA, 2000
The main outliers are Luxemburg and Switzerland. Luxemburg is, as mentioned, a very special case where they actually appear to be consciously profiteering on the tax difference and attracting motorists from surrounding
14
countries to fuel their cars thereby giving Luxemburg high revenues through a low tax rate. This cannot be interpreted as environmental or non-environmental policy; it appears to be a case of very simple local tax maximization without regard for any other principles. The case of Switzerland is quite distinct and they are currently using regulations and advanced road pricing to deter the transit traffic that is a considerable local environmental problem as well as causing considerable costs to this alp country where road maintenance is problematic.
In other countries such as Austria and Ireland that have low gasoline tax rates, the fairly high (or intermediate) environmental tax revenues are explained by the fact that these countries have sizeable road or vehicle taxes. In countries such as Italy and the UK with high gasoline taxes these other road and vehicle taxes appear to be relatively lower.
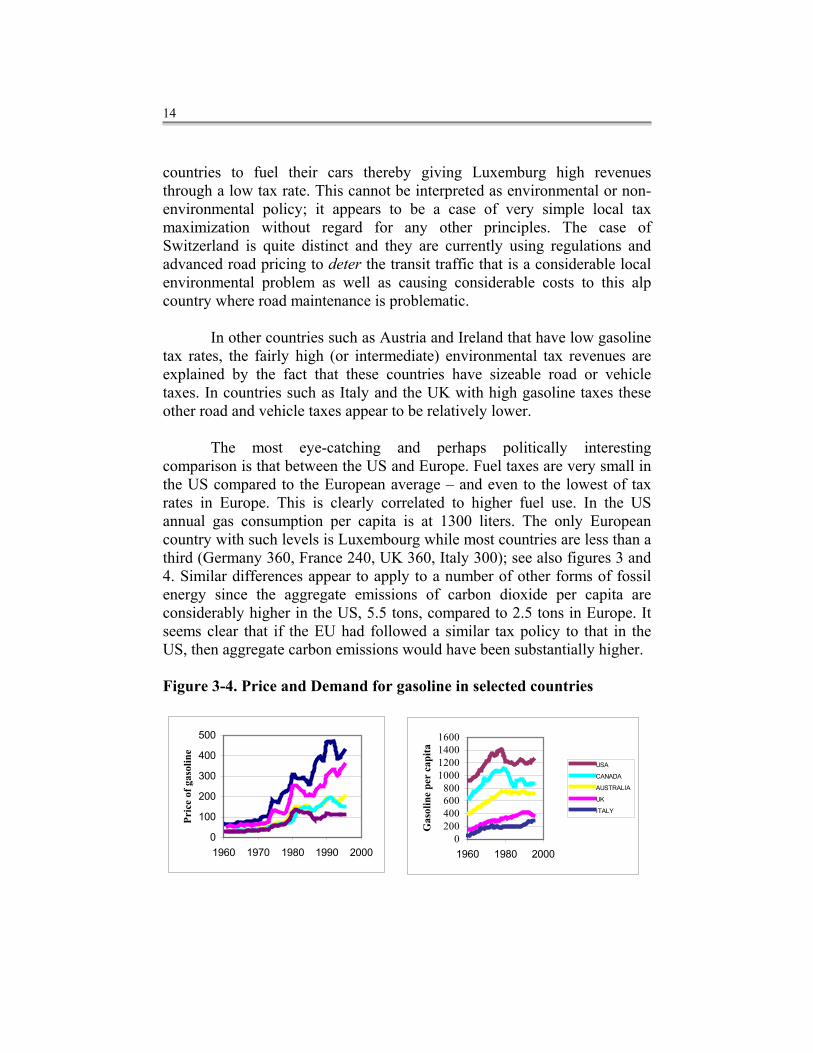
The most eye-catching and perhaps politically interesting comparison is that between the US and Europe. Fuel taxes are very small in the US compared to the European average – and even to the lowest of tax rates in Europe. This is clearly correlated to higher fuel use. In the US annual gas consumption per capita is at 1300 liters. The only European country with such levels is Luxembourg while most countries are less than a third (Germany 360, France 240, UK 360, Italy 300); see also figures 3 and 4. Similar differences appear to apply to a number of other forms of fossil energy since the aggregate emissions of carbon dioxide per capita are considerably higher in the US, 5.5 tons, compared to 2.5 tons in Europe. It seems clear that if the EU had followed a similar tax policy to that in the US, then aggregate carbon emissions would have been substantially higher.
Figure 3-4. Price and Demand for gasoline in selected countries
0
100
200
300
400
500
1960 1970 1980 1990 2000
Pric
e of
gas
olin
e
0200400600800
1000120014001600
1960 1980 2000
Gas
olin
e pe
r ca
pita
USA
CANADA
AUSTRALIA
UK
ITALY
15
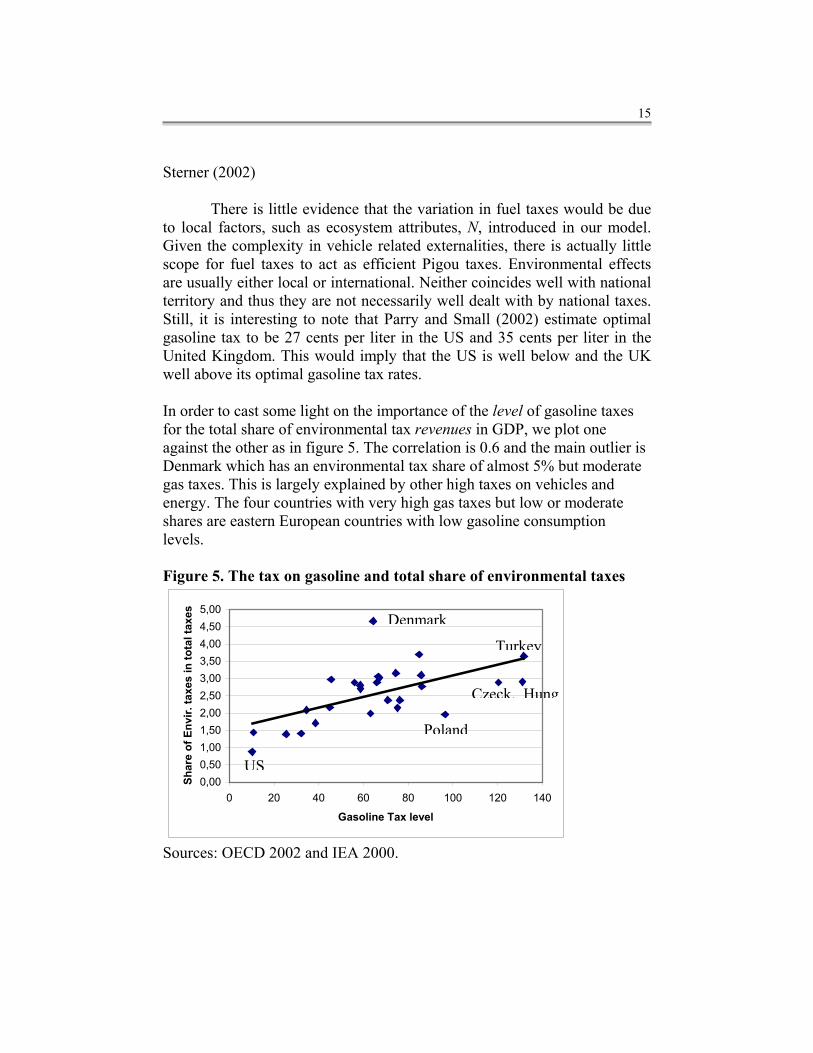
Sterner (2002) There is little evidence that the variation in fuel taxes would be due to local factors, such as ecosystem attributes, N, introduced in our model. Given the complexity in vehicle related externalities, there is actually little scope for fuel taxes to act as efficient Pigou taxes. Environmental effects are usually either local or international. Neither coincides well with national territory and thus they are not necessarily well dealt with by national taxes. Still, it is interesting to note that Parry and Small (2002) estimate optimal gasoline tax to be 27 cents per liter in the US and 35 cents per liter in the United Kingdom. This would imply that the US is well below and the UK well above its optimal gasoline tax rates. In order to cast some light on the importance of the level of gasoline taxes for the total share of environmental tax revenues in GDP, we plot one against the other as in figure 5. The correlation is 0.6 and the main outlier is Denmark which has an environmental tax share of almost 5% but moderate gas taxes. This is largely explained by other high taxes on vehicles and energy. The four countries with very high gas taxes but low or moderate shares are eastern European countries with low gasoline consumption levels. Figure 5. The tax on gasoline and total share of environmental taxes
0,000,501,001,502,002,503,003,504,004,505,00
0 20 40 60 80 100 120 140
Gasoline Tax level
Shar
e of
Env
ir. ta
xes
in to
tal t
axes
Sources: OECD 2002 and IEA 2000.
US
Czeck. Hung
Turkey
Poland
Denmark
16
A Comparison of other environmental taxes
Although fuel taxes have the largest impact on revenues, there are a large number of other taxes or fees that contribute to abatement at the regional, national and local levels. The diversity in this area is quite considerable and we cannot cover all countries or taxes systematically. Instead we focus on some striking examples at different levels. Carbon taxes
We might expect greater harmonization between countries in taxes targeting global pollution since variations in damage cost are smaller. Greenhouse gas emissions are of course the most conspicuous such pollutant. Although fuel taxes have an effect on carbon emissions they only affect the transportation sector which, from the viewpoint of climate policy is very incomplete. There are at present really no countries that have true broad-based carbon taxes. Sweden and Norway have sizeable carbon taxes for some sectors6. These are regularly updated and the Swedish tax level is now 0.63 SEK/kg CO2 (October 2002). This corresponds to over 200 USD/ton of carbon7, which is clearly high compared to the levels that have been discussed internationally. There are however numerous exceptions to the tax: Production of electricity is exempted; non-energy use (for instance coal in the steel industry) is exempted; air freight and international ship bunkers are exempted; industrial use has a 65% reduction as well as a cap of 1.2% of total revenue that is particularly important for the energy-intensive industries. There has recently been a parliamentary investigation that has revisited this difficult and contentious area, (SOU 2003:38). One of the problems they highlight is that EU legislation makes it illegal for Sweden to single out some sectors of business for preferential treatment. This makes it impossible to treat “energy-intensive” industries from other firms. This also applies to the industries within the energy sector (power plants etc) that used to be national and often publicly owned. Deregulation of this industry and EU membership has thus introduced new layers of complexity here. Their suggestions include a general lowering of energy
6 Denmark, Finland, Italy and the Netherlands also have some form of carbon taxes, see Stavins (2002). 7 At a current exchange rate of 8.5 SEK/USD this gives just over 74 USD/ton CO2 and a conversion of 44/12 from tons of CO2 to tons of C gives 270 USD/ton C.
17
taxes for business and an overall cap of 0,7% of total revenue (unless this implies that the tax falls below the EU minimum).
In spite of the tax reliefs, the tax has had some effects: Since the creation of a Swedish carbon tax in 1990 the annual use of biomass, particularly forest residues, in district heating has risen very rapidly and biomass is clearly dominant in this sector today. However, with the current formulation of this tax there is no incentive for biomass in transportation fuels. An even more poignant example is the fact that in Norway, thanks to the carbon tax, large-scale storage of CO2 has started in industrial aquifers. On the Sleipner Vest gas field, CO2 rich natural gas is being stripped for its CO2 and this is being injected into a saline aquifer at about 1000 m depth. Such techniques are sometimes used to enhance oil recovery. It is however unique that this is being done for environmental reasons and as a result of the carbon tax. The captured and injected quantity is roughly 1 million tons CO2 per year, which corresponds to a non-trivial 3% of Norway’s total CO2 emissions. Sulphur taxes
Acid rain has been one of the most contentious forms of pollution in Europe over the last decades since it is regional in impact, emissions are very skewed depending on dependence on coal and oil and the sensitivity to the acidity depends on the sensitivity of soils (the “N” in our model). In addition to regulating contents, a number of European countries use differentiated energy or fuel taxation to encourage a reduction in the use of sulphur. The Scandinavian countries Sweden, Norway and Denmark have high taxes (3400, 2100 and 1300 USD/ton respectively) in comparison to which the taxes in Italy, France, Switzerland, Spain (actually a regional tax in Galicia) and Finland (only diesel) are quite small (all below 50 USD/ton). These tax levels can be compared to the US permit prices, which tend to be in the range of 100-200 USD/ton. While all taxes should, in principle, have some effect it is unlikely to be significant when they are so low. Even for the high-tax countries, the effect is hard to disentangle from the effect of other concurrent policies. For Sweden, SEPA (1997) judges that the tax was responsible for 30% of the reduction between 1989 and 1995. Notice that a large part of the reduction in sulphur use in Sweden predates the tax. In 1970, emissions were over 900 ktons, by 1980 it was reduced to 500 ktons and in 1990 it had dropped to 136 ktons. It is only the last, but perhaps most
18
difficult, reduction down to 66 ktons in 1999 that has been (partly) caused by the tax. The tax applies to sulphur actually emitted but is levied on fuels based on their sulphur content. There is then a rebate for sulphur removed by filters etc. Hammar and Löfgren (2001) find that the sulphur tax appears to have been important in reducing the actual sulphur content of fuel oil below the legal limits. Sweden had in some years stricter limits than the EU, for instance 0.2% for light fuel oil already in 1976 but actual sulphur content was lower still. In 1991 the actual figure was 0.08% and in 1994 0.058% when the legal limit was still 0.2% and this must be mainly due to the tax. Sulphur emission rates have fallen dramatically and are today very low in the high tax countries compared to other countries. Emission rates of 8 kg S/cap in Sweden and Norway are less than half the corresponding value in the UK, France or Germany and about one eighth of US figures. The reason for the strong policies in Scandinavia is that local ecosystems are very sensitive to acidification; see further Sterner (2002).
One more country deserves special mention when it comes to sulphur taxation and that is Poland. It is presumably the Eastern European country that most consistently has applied quite tough economic instruments in order to reduce pollution and to finance the abatement of pollution (the fees are not strictly fiscal taxes but paid into funds). Poland has a sulphur tax of over 80 USD/ton which also appears to be collected in a very consistent manner which may not apply to all the other Eastern European countries.8 Considering the low-income level and high pollution levels this tax must clearly be considered a sizeable tax, higher than in many West European countries and almost on par with permit prices in the US. The tax is thought of as successful both through its incentive effect and through the funds for abatement investments that it generates. Nitrogen taxes and charges
Nitrogen oxides have a very similar acidifying effect as sulphur but are much harder to measure. Most of the NOx is formed by the effect of high temperature on atmospheric nitrogen and does not (like sulphur) come from an impurity in the fuel. This implies that NOx emission cannot be 8 According to Stavins (2002) the following sulphur taxes in USD/ton applied to a selection of Eastern European countries: Bulgaria 0.02, Czech R. 30 for permitted and 45 for excess emissions, Hungary 2.4, Estonia 2 for permitted and 95 for excess emissions, Lithuania 46 and Slovakia 33 USD/ton.
19
easily predicted and thus complicated and expensive monitoring equipment is required. As in the case of sulphur, the US uses permits and several European countries have tax schemes. According to Stavins (2002) Bulgaria, Czechoslovakia, Estonia, France, Hungary, Italy, Lithuania, Poland, Slovakia all have some form of tax or fee. For the major countries the level is around 30-100 USD/ton and most typically they are levied on the basis of estimated pollution (which implies little incentive for real abatement). However the funds are often used to promote abatement, which of course should lead to some reduction (although generally not in an effective way).
The only country that appears to base payments exclusively on measured emissions and that also charges a very high fee is Sweden, where a refunded emission payment of 5 000 USD/ton is used, see Sterner and Höglund (2000). The design of the charge has been unique. It is on the one hand a very high charge - more than 200 times higher than the French charge. On the other hand its proceeds are distributed back to the polluting companies in relation to the amount of energy produced by the specific plant. This means that the polluting industry as a whole does not pay anything to society – and it is presumably this fact that has made the charge politically feasible. The design mechanism was partly chosen due to the fact that only large combustion plants are obliged to pay the charge. This was based partly on the high costs of metering which (together with abatement costs) were considered unreasonable for smaller plants. Now if a tax were applied to only a subsection of some industry then this subsection would be unfairly disadvantaged compared to other firms in the same industry. In this case, if the tax were applied only to the large plants, large companies would have an incentive to set up several small combustion plants instead of one big one and this is typically not desirable (from any viewpoint including emissions of NOx and other pollutants). As the system has developed and turned out to be effective, (emission rates have fallen by about 40% in six years) costs for abatement and metering have fallen and the criterion for inclusion has been lowered twice: in 1996 plants producing at least 40 GWh useful energy per year were included and in 1997 the boundary was lowered to 25 GWh. In 1998, 400 plants were subject to the charge, compared to 200 plants in 1992.
20
Taxes related to lead content of fuels
From the viewpoint of the local environment and particularly human health, the most important issue is of course not at all fossil carbon but various toxic substances found in fuels or formed upon combustion. One of the most crucial environmental and health improvements has been the elimination of lead from gasoline. The US was the first country to phase out lead from gasoline in the early to mid 1980s. They used tradable permits for the lead content of gasoline. Other countries have not copied this scheme although most have or are phasing out lead from gasoline, in many cases a decade or even two after the US. Scandinavia, Germany and Austria have already phased out lead completely but some other European countries lag behind. The EU Council of Ministers banned leaded fuel use after 2000 (with some exemptions to 2005).
Most European countries chose a mixture of policy instruments
including fuel specifications and mandatory catalysts for new cars and in some cases subsidizing them on older cars (e.g. Sweden). This created a demand for unleaded gas since catalysts become defunct if used with leaded gasoline. To speed up the transition many countries then used differential taxation of leaded and unleaded gasoline or other instruments such as subsidies. The tax differential between leaded and unleaded in Sweden is a case in point. Sweden raised the tax differential on leaded gasoline drastically to about 8 US cents/liter. With a tax wedge much larger than the production cost differential, both retailers and consumers were anxious to switch. The same occurred in several countries such as Denmark where unleaded gas was about 7% cheaper resulting in a 50% market share even before the cars with catalysts had any market share (and 100% unleaded when these cars had only 25%). In this case the lower tax appears to have had a large effect but this varied between countries. See Löfgren and Hammar (2000) for an econometric analysis of the phase out of lead in the EU showing the importance of tax differentials, income levels and catalysts. The general conclusion is that the phase out of lead was speedy because politicians used powerful policy instruments. According to Kågeson (1993) the instruments used in Europe corresponded to a shadow price of 200-500 USD/kg of lead. The environmental tax revenues from these taxes are impossible to isolate since they were intertwined with fuel taxes. Frequently they were formulated as rebates from gas taxes for lead free fuel. Furthermore the “revenues” would have been very transitory as the tax on
21
lead was often low at first and then raised as the share of leaded fuel dwindled. Other local environmental taxes
In many European countries, (notably France, Germany and the Netherlands) water was one of the earliest examples of a resource for which policy makers have used something of an ecosystem approach (the water basins often being self-governing). It has also been fairly common to use some form of taxation or pricing to cover numerous aspects such as scarcity, supply cost and the costs caused by effluents. The diversity of these schemes is however such that it is hard to provide any numerical comparisons. Typically the fees are refunded to the sector to provide finance for water treatment plants or similar use, see Stavins (2002) and the references therein.
Several European (as well as non-European) countries have waste taxes or differentiated charges for municipal waste management. In several countries the driving force is the lack of space (and/or of local acceptance) for landfills. Consequently a number of countries have particular taxes on landfills (sometimes combined with other policies concerning incineration). According to Stavins (2002), such fees may be found in the UK, Denmark, Netherlands and Finland at rates that range from USD 3/ton for inert waste to several hundred USD for hazardous waste, with typical figures of 15-50 USD/ton of typical landfill waste. Estonia, Latvia and Poland also have such fees although with somewhat lower rates.
In several countries such as Sweden, a number of municipalities are now charging for waste on a “per kg” or “per bag” basis. Sterner and Bartelings (1999) analyze waste disposal, recycling and composting in a municipality in southwest Sweden, Varberg, which in 1994 introduced a weight-based billing system for household waste charging 1 SEK/kg (.18 USD/kg) of waste and at the same time, recycling centers were set up and a “green shopping” campaign was launched. This led to a significant reduction in waste collected (35% within a couple of years). The article shows however, that economic incentives, although important, are not the only driving force behind the observed reduction in municipal waste: Given the proper infrastructure that facilitates recycling, people are willing to
22
invest more time than can be motivated purely by savings on their waste management bill!
Waste management fees are often used in combination with specific taxes on such products as batteries and tires that have particular environmental effects. In many cases these may be combined with deposit-refund systems, user charge systems or there may be other means for earmarking the revenues for clean up, abatement or waste management. Also information campaigns, eco-labeling, liability schemes and even permit trading (such as the UK system for trade in packaging waste recovery notes) are being used in this area. Taxes are applied to a broad range of items such as chlorinated solvents in Denmark and Norway to batteries in Sweden, non-refillable containers in Sweden and Finland, ozone-depleting substances in Denmark, VOCs in Switzerland and France. In most of these cases the tax revenues generated by these schemes were insignificant.
Concluding comments
The broad range of this subject makes it hard to produce firm and encompassing conclusions regarding the role of environmental taxes in the overall environmental policy mix in different countries. Still, environmental taxation does appear to play a somewhat more prominent role in Europe than in other continents. This is partly but very imperfectly reflected in higher environmental tax revenue as a share of GDP. Environmental taxes should however be separated into two categories. In the first we have taxes related to energy and transportation and motivated at least partly by global concerns such as climate change. In this category we have considerable revenues already and in principle an even larger potential if taxation were to be used as the primary way of achieving global goals for climate. The elasticity of energy use to price is limited but not insignificant which means that high taxes will be needed and large revenues generated in order for ambitious goals to be achieved. The global nature of this environmental problem causes numerous problems of coordination between countries that are largely motivated by concerns of industrial competitiveness. A second concern may be if the incidence of the taxes is regressive or hurts politically influential groups. The European experience shows that a number of steps have been taken to reduce the competitive and regressive effects of taxation
23
by modifying the tax schedules or through the use of the tax proceeds, see further Ekins (1999), Sterner (2002) and Stavins (2002).
The other category of environmental taxes is somewhat less visible both to ministries of finance and thus to the political world and to the researcher. They generate fairly insignificant revenue. On the other hand, one of the reasons for the low revenue is precisely the tax base erosion, which from a fiscal point of view may be unsatisfactory but from an environmental viewpoint is very desirable. The diversity of these taxes is considerable, they are applied to various chemical pollutants and their administration ranges from pure taxes to product charges, local user fees, and noncompliance fees. Furthermore, they include elements of refunding and other aspects that make them hard to compare. On the whole, however, there is considerable evidence that they are sometimes efficient instruments for environmental improvement. References Angelier, Jean-Pierre, and Thomas Sterner. 1990. "Tax harmonization for petroleum products in the EC." Energy Policy. July 1990. Baumol, William. J. and Wallace E. Oates. 1988. The Theory of Environmental Policy. Cambridge: Cambridge University Press. Bohm, Peter and C.S. Russell. 1997. “Comparative Analysis of Alternative Policy Instruments.” In The Economics of Environmental Protection: Theory and Demand Revelation. Ed. Peter Bohm. Cheltenham: Edward Elgar, pp. 48-113.
Dijkstra, B.R. 1999. The Political Economy of Environmental Policy. A Public Choice Approach to Market Instruments. Cheltenham: Edward Elgar. Ekins, Paul. 1999. “European Environmental Taxes and Charges: Recent Experience, Issues and Trends.” Ecological Economics. 31(1): pp. 39-62. Hammar, Henrik and Åsa Löfgren. 2001. “The Determinants of Sulfur Emissions from Oil Consumption in Swedish Manufacturing Industry, 1976-1995.” The Energy Journal. 22(2): pp. 107-126.
24
International Energy Agency. 2000. “Energy Prices and Taxes.” Quarterly statistics 2000, Paris: OECD. IRS. 2002. (US Internal Revenue Service) “Table 21--Federal Excise Taxes Reported to or Collected by the Internal Revenue Service.” http://www.irs.gov/taxstats/index.html. (November 10, 2002). Kågeson, Per. 1993. “Getting the Prices Right. A European Scheme for Making Transport Pay its True Costs.” Transport and Environment 93(6). Löfgren, Åsa and Henrik Hammar. 2000). ‘The phase-out of leaded gasoline in the EU: a successful failure?.” Transportation Research, Part D Transport and Environment. (5): pp. 419-431. Nordic Council of Ministers. 1999. “The Use of Economic Instruments in Nordic Environmental Policy 1997-98.” TemaNord Copenhagen. 1999:524. Oates, Wallace E. 1998. ”Environmental Policy in the European Community: Harmonization or National Standards?” Empirica. (25): pp. 1-13. OECD. 2002. “Environmentally Related Taxes database”. http://www.oecd.org/oecd/pages/home/displaygeneral/0,3380,EN-document-471-14-no-1-3016-0,FF.html (November 10, 2002). Panayotou, Theodore. 1998. Instruments of Change – Motivating and Financing Sustainable Development. UNEP. Parry, Ian W.H. and Kenneth A. Small. 2002. “Does Britain or the United States Have the Right Gasoline Tax?” Discussion Paper 02-12. Resources for the Future. Washington D.C. Russell, C.S. and P.T. Powell. 1996. Choosing Environmental Policy Tools: Theoretical Cautions and Practical Considerations. Inter-American Development Bank. Schlegelmilch, Kai. 1998. Energy Taxation in the EU and some member States:Looking for Opportunities Ahead. Wuppertal Institute for Climate, Environment and Energy.
25
SEPA. 1997. (Swedish Environmental Protection Agency) “Environmental Taxes in Sweden – Economic Instruments of Environmental Policy.” Report 4745, Stockholm. SOU 2003:38, “Svåra Skatter.” Green Paper by the Swedish Committee on Energy Taxation of the Business Sector. Statens Offentliga Utredningar. Stockholm. Stavins, Robert N. 2002. "Experience with Market-Based Environmental Policy Instruments." Handbook of Environmental Economics. Eds. Karl-Göran Mäler and Jeffrey Vincent. Amsterdam: Elsevier Science. Sterner, Thomas. 2002. Policy Instruments for Environmental and Natural Resource Management. RFF press in collaboration with the World Bank and Sida: Washington DC. Sterner, Thomas. and Heleen Bartelings. 1999. “Household Waste Management in a Swedish Municipality.” Environmental and Resource Economics. June 13(4). Sterner, Thomas and Lena Höglund. 2000. “Output-Based Refunding of Emission Payments: Theory, Distribution of Costs, and International Experience.” Discussion Paper 00-29. Resources for the Future: Washington D.C. Tietenberg, Thomas H. 1990. “Economic Instruments for Environmental Regulation.” Oxford Review of Economic Policy. 6(1): pp. 17-33. US EPA. 2001. “The United States Experience with Economic Incentives for Protecting the Environment.” Report EPA-240-R-01-001. Washington DC. Wheeler, David et al. 2000. “Greening Industry: New Roles for Communities, Markets and Governments.” World Bank Policy Research Report. New York: Oxford University Press. World Development Report Indicators. 2002. World Bank: Washington DC.

26
Xepapadeas, Anastasios. 1997. Advanced Principles in Environmental Policy. Edward Elgar.