Embed Size (px)
Citation preview

The Cryosphere, 8, 2275–2291, 2014
www.the-cryosphere.net/8/2275/2014/
doi:10.5194/tc-8-2275-2014
© Author(s) 2014. CC Attribution 3.0 License.
Glacier topography and elevation changes
derived from Pléiades sub-meter stereo images
E. Berthier1, C. Vincent2, E. Magnússon3, Á. Þ. Gunnlaugsson3, P. Pitte4, E. Le Meur2, M. Masiokas4, L. Ruiz4,
F. Pálsson3, J. M. C. Belart3, and P. Wagnon5,6
1Laboratoire d’Etudes en Géophysique et Océanographie Spatiales, Centre National de la Recherche Scientifique (LEGOS –
CNRS, UMR5566), Université de Toulouse, 31400 Toulouse, France2UJF – Grenoble1/CNRS, LGGE – UMR5183, 38041 Grenoble, France3Institute of Earth Sciences, University of Iceland, Askja, Sturlugata 7, Reykjavik, Iceland4Instituto Argentino de Nivología, Glaciología y Ciencias Ambientales (IANIGLA), CCT – CONICET Mendoza, C.C. 330,
5500 Mendoza, Argentina5IRD/Univ. Grenoble Alpes/CNRS/INPG, Laboratoire d’étude des Transferts en Hydrologie et Environnement, LTHE –
UMR5564, Laboratoire de Glaciologie et de Géophysique de l’Environnement, LGGE – UMR5183, 38041 Grenoble, France6ICIMOD, G.P.O. Box 3226, Kathmandu, Nepal
Correspondence to: E. Berthier ([email protected])
Received: 19 August 2014 – Published in The Cryosphere Discuss.: 11 September 2014
Revised: 7 November 2014 – Accepted: 11 November 2014 – Published: 10 December 2014
Abstract. In response to climate change, most glaciers are
losing mass and hence contribute to sea-level rise. Repeated
and accurate mapping of their surface topography is required
to estimate their mass balance and to extrapolate/calibrate
sparse field glaciological measurements. In this study we
evaluate the potential of sub-meter stereo imagery from the
recently launched Pléiades satellites to derive digital eleva-
tion models (DEMs) of glaciers and their elevation changes.
Our five evaluation sites, where nearly simultaneous field
measurements were collected, are located in Iceland, the Eu-
ropean Alps, the central Andes, Nepal and Antarctica. For
Iceland, the Pléiades DEM is also compared to a lidar DEM.
The vertical biases of the Pléiades DEMs are less than 1 m
if ground control points (GCPs) are used, but reach up to
7 m without GCPs. Even without GCPs, vertical biases can
be reduced to a few decimetres by horizontal and vertical
co-registration of the DEMs to reference altimetric data on
ice-free terrain. Around these biases, the vertical precision
of the Pléiades DEMs is ±1 m and even ±0.5 m on the flat
glacier tongues (1σ confidence level). Similar precision lev-
els are obtained in the accumulation areas of glaciers and
in Antarctica. We also demonstrate the high potential of
Pléiades DEMs for measuring seasonal, annual and multi-
annual elevation changes with an accuracy of 1 m or bet-
ter if cloud-free images are available. The negative region-
wide mass balances of glaciers in the Mont-Blanc area
(−1.04± 0.23 m a−1 water equivalent, w.e.) are revealed by
differencing Satellite pour l’Observation de la Terre 5 (SPOT
5) and Pléiades DEMs acquired in August 2003 and 2012,
confirming the accelerated glacial wastage in the European
Alps.
1 Introduction
In a context of nearly global glacier wastage, new means
to retrieve accurate and comprehensive measurements of
glacier topography and elevation changes are welcome.
Digital elevation models (DEMs) are needed to properly
orthorectify satellite images and to extrapolate pointwise
glaciological mass balance measurements to entire ice bodies
(Kääb et al., 2005; Zemp et al., 2013). The geodetic method,
based on the differencing of multi-temporal DEMs, has been
used for decades to retrieve glacier-wide and region-wide
glacier mass balances (e.g. Bamber and Rivera, 2007; Fin-
sterwalder, 1954). This method reveals the spatial patterns
of elevation changes over individual glaciers or entire re-
gions. Geodetically derived mass balances are now included
Published by Copernicus Publications on behalf of the European Geosciences Union.

2276 E. Berthier et al.: Glacier topography and elevation changes derived from Pléiades sub-meter stereo images
Figure 1. Study sites where Pléiades stereo pairs and tri-stereos were acquired. The background image is a MODIS mosaic from the Blue
Marble Next Generation project.
in global assessments of glacier mass loss (Cogley, 2009;
Vaughan et al., 2013). Furthermore, the differences between
multi-temporal DEMs derived from aerial photos and air-
borne lidar can be used to check and, if necessary, correct
cumulative mass balances measured using the field-based
glaciological method over periods of typically 5–10 years
(e.g. Abermann et al., 2010; Jóhannesson et al., 2013; Soruco
et al., 2009b; Zemp et al., 2013). However, airborne sensors
cannot acquire data everywhere on Earth because of the lo-
gistical difficulties involved in flying an airplane over some
remote regions (e.g. high-mountain Asia, polar regions). Li-
dar data from the Ice, Cloud and land Elevation Satellite
(ICESat) mission (and from the future ICESat-2) remain too
sparse to provide a comprehensive coverage of individual
glaciers; hence, mass balances can be retrieved reliably only
for sufficiently large regions (Arendt et al., 2013; Gardner
et al., 2013; Kääb et al., 2012). The geodetic method has
also been applied extensively to DEMs derived from space-
borne optical or radar sensors such as the Shuttle Radar To-
pographic Mission (SRTM) and SPOT DEMs (e.g. Gardelle
et al., 2013). However, the vertical errors of these DEMs (5 to
10 m) and their resolution (40 to 90 m) limits the possibil-
ity of retrieving accurate glacier-wide mass balances on indi-
vidual small to medium size glaciers covering typically less
than 10 km2 for time periods of a few years. DEMs derived
from sub-meter stereo images have the potential to fill this
gap between coarse spaceborne DEMs and very high resolu-
tion DEMs from aerial surveys.
After the launch of the first non-military sub-meter res-
olution satellite (IKONOS) in September 1999 and until
recently, relatively little work was carried out on deriving
DEMs from these images over glaciers, probably due to the
cost of the images. However, over the last 2–3 years, inter-
est in these data sets has grown due to easier accessibility by
researchers (e.g. Haemmig et al., 2014; Marti et al., 2014;
Sirguey and Cullen, 2014). In the US, WorldView-1 and
WorldView-2 images are distributed by the Polar Geospa-
tial Center (PGC) to US-funded researchers (Noh and Howat,
2014a, b). Since the launch of the Pléiades 1A and 1B satel-
lites in December 2011 and 2012, their high-resolution im-
ages have become available for researchers from the Euro-
pean Union, Iceland, Norway and Switzerland through the
ISIS program of the French Space Agency, CNES (http:
//www.isis-cnes.fr/). In this context, the goal of the present
study is to assess the accuracy of the DEMs retrieved from
Pléiades stereo images and to test their potential to esti-
mate glacier elevation changes at seasonal, annual and multi-
annual timescales.
2 Data sets
2.1 Pléiades stereo images
Pléiades stereo pairs acquired in five different regions are
used in this study (Fig. 1, Table 1). The study sites were
selected to represent a variety of glacial settings ranging
from the small (1 km2) Agua Negra Glacier in the high
(> 5000 m a.s.l.), steep and arid Andes of Argentina to the
flat and 7 km wide Astrolabe Glacier, an outlet glacier of the
East Antarctic ice sheet in Adélie Land. The main reason for
selecting these glaciers was that they were all targets of on-
going field programs (Björnsson et al., 2013; Jóhannesson et
al., 2013; Le Meur et al., 2014; Vincent et al., 2009, 2014;
Wagnon et al., 2013) so that accurate reference data were
available. A Pléiades image is shown for each study site in
Fig. 2, with an enlargement of a small area in the upper part
of Astrolabe Glacier.
The Pléiades 1A and 1B twin satellites were launched
17 December 2011 and 2 December 2012, respectively. Im-
ages are delivered at a ground sampling distance (pixel
size) of 0.5 m for the panchromatic channel (wavelength in
The Cryosphere, 8, 2275–2291, 2014 www.the-cryosphere.net/8/2275/2014/

E. Berthier et al.: Glacier topography and elevation changes derived from Pléiades sub-meter stereo images 2277
Table 1. Characteristics of the study sites and Pléiades images. For each site, the approximate geographic coordinates and maximum altitude
(Zmax, m a.s.l.) are indicated. All images were acquired by Pléiades-1A, except a Pléiades-1B stereo pair over Tungnafellsjökull. The base-to-
height ratio (B/H), the ratio of the distance between two successive positions of the satellite to its height above ground, is an indicator of the
sensitivity to topography. A single B/H is indicated for stereo pairs, whereas three values for the front/nadir, nadir/back and front/back pairs
are provided for tri-stereos. The percentage of saturation in the image is given for the front/back images for stereo pairs and front/nadir/back
for tri-stereos. The reference (noted Ref.) altimetric data used to evaluate the Pléiades DEMs are kinematic global navigation satellite system
(kGNSS), stop and go GNSS measurements and, for the Tungnafellsjökull Ice Cap only, a lidar DEM. Identification codes of the Pléiades
images are not listed for the sake of concision.
Study site Pléiades B/H Saturation Ref. Date ref. Uncertainty
Long,Lat;Zmax date (%) data data ref. data
(m)
Andes 4 Apr 2013 0.22; 0.17; 0.39 0.01; 0.01; 0.01 kGNSS 20 Apr 2013 ±0.5
Agua Negra
69.8◦W, 30.2◦ S; 5200
European Alps 19 Aug 2012 0.33 0.02; 0.01 stop & go 5–8 Sep 2012, ±0.2
Mont Blanc GNSS 26 Oct 2012
6.9◦ E, 45.9◦ N; 4800 20 Sep 2013 0.31; 0.35; 0.66 3.23; 4.29; 5.22 stop & go 13–14 Sep 2013
GNSS
Iceland 9 Oct 2013 0.37 0 kGNSS 2 May 2013, ±0.2
Tungnafellsjökull 18 Sep 2013
17.9◦W, 64.7◦ N; 1500 Lidar DEM 7–8 Aug 2011 ±0.5
Himalaya 25 Nov 2012 0.47 0.46; 0.91 stop & go 20–27 Nov 2012 ±0.2
Mera GNSS
86.9◦W, 27.7◦ N; 6400
Antarctica 6 Feb 2013 0.45 0.12; 0.04 stop & go 18 Jan 2013 ±0.3
Astrolabe GNSS
140◦ E, 66.7◦ S; 800
the 480–830 nm range) and 2 m for the multi-spectral blue,
green, red and near-infrared channels (http://smsc.cnes.fr/
PLEIADES/). However, the actual resolution of the sensor
is slightly coarser (0.7 and 2.8 m) and the images are there-
fore oversampled by the ground segment (Gleyzes et al.,
2012). One advantage of the Pléiades satellites (compared
to SPOT1-5 and ASTER, Advanced Spaceborne Thermal
Emission and Reflection Radiometer) for glaciological stud-
ies is the fact that the panchromatic band images are coded
on 12 bits (digital number range is 2n, where n is the number
of bits). Such a wide radiometric range gives much better im-
age contrast over flat and textureless regions (such as snow-
covered accumulation areas, Fig. 2) and the risk of saturation
is reduced. As a direct result of the 12 bit encoding, the per-
centage of our Pléiades images with saturation, i.e. where
digital numbers equal 4095, is low (Table 1). The maximum
percentage is observed over the Mont Blanc images (5 %)
and is due to several snowfalls during the days preceding the
20 September 2013 acquisition. This date excluded, the per-
centage is always lower than 1 %. However, new Pléiades im-
ages acquired in north-west Himalaya in August 2014 con-
tained a higher percentage of saturated pixels, sometimes up
to 10 %. This is probably due to a high solar elevation angle
in August at this relatively low latitude (∼ 33◦ N). In such
cases, specific acquisition parameters (i.e. lower number of
time delay integration, TDI, stages) may help to reduce the
saturated areas.
A positive consequence of this 12 bit encoding is that
nearly all images from the archive are now useful for the
study of ice and snow surfaces, whereas with SPOT1-5 or
ASTER stereo imagers (8 bit encoding), special acquisition
plans with a low gain had to be defined to avoid saturation
and to enhance image contrast over snow and ice (Korona et
al., 2009; Raup et al., 2000).
The images of a Pléiades stereo pair are acquired along
the orbit (along track) within a few tens of seconds due to
the agility (pitch) of the platform. Triplets of images (re-
ferred to as tri-stereos) are available for two of our study
sites, in the Andes and in the Alps. A tri-stereo is made
of three images (front, nadir and back images) that can be
combined in three stereo pairs for multiple DEM generation:
front/nadir, nadir/back and front/back. The front/nadir and
nadir/back pairs are acquired from closer points of view than
the front/back pair and hence exhibit less distortion, facili-
tating the recognition of identical features in the images by
automatic matching algorithms. However, the sensitivity to
topography is reduced by a factor of about 2, so matching
errors will lead to doubled altimetric errors (Toutin, 2008).
www.the-cryosphere.net/8/2275/2014/ The Cryosphere, 8, 2275–2291, 2014

2278 E. Berthier et al.: Glacier topography and elevation changes derived from Pléiades sub-meter stereo images
Figure 2. Pléiades orthoimages for the five different study sites. Yellow dots locate the GNSS measurements used to evaluate the DEMs. For
Tungnafellsjökull, the blue polygon marks the limits of the lidar DEM. For the Mont-Blanc area, the red rectangles separate two stereo pairs
acquired the same day which are combined to cover the entire glacier complex. For Astrolabe Glacier, an enlargement of a 750 m by 600 m
area in the upper part of the glacier (elevation of > 700 m above ellipsoid) is shown.
As for all optical sensors, the main drawback of the Pléi-
ades constellation is the need for clear-sky conditions to ob-
tain suitable cloud-free images.
2.2 SPOT 5 DEMs
Two SPOT 5 DEMs were used in this study.
First, a DEM covering 30 km × 60 km and including the
entire Mont-Blanc area was computed in a previous study
from two SPOT 5-HRG images acquired 19 and 23 Au-
gust 2003 (Berthier et al., 2004). The ground sampling dis-
tance of a SPOT 5-HRG image is 2.5 m and the DEM pixel
size is 10 m. This DEM was subtracted from the Pléiades
19 August 2012 Pléiades DEM to measure the geodetic mass
balance for the entire Mont-Blanc area.
Second, a DEM including the Astrolabe Glacier was ex-
tracted from the SPIRIT (SPOT 5 stereoscopic survey of po-
lar ice: reference images and topographies) database (Korona
et al., 2009). The ground sampling distance of a SPOT 5-
HRS (high-resolution sensor) image is 10 m across track and
5 m along track (Berthier and Toutin, 2008; Bouillon et al.,
2006). This SPOT 5 DEM has a pixel size of 40 m and covers
an area of 120 km × 230 km.
For these two study sites (Mont-Blanc area and Astrolabe
Glacier), the Pléiades and SPOT 5 DEMs are also compared
qualitatively to determine the added value of the Pléiades
broader radiometric range and higher resolution for DEM
generation, in particular over the snow-covered accumulation
areas.
2.3 Validation data: GNSS and lidar
Table 1 includes the type, date and precision of the reference
data available to evaluate the Pléiades DEMs. Most of the ref-
erence data are differential GNSS (global navigation satellite
system) measurements including the US GPS and Russian
GLONASS constellations. They are processed relative to the
closest available base station. A decimetric precision can be
reached in the best cases (the Mont-Blanc area), whereas, in
the worst case, the precision is closer to ±0.5 m in the An-
des due to the fact that the base station (TOLO) is located
100 km away from Agua Negra Glacier. For Iceland, the Pléi-
ades DEM was also compared to an airborne lidar DEM with
a 2 m pixel size. The lidar DEM was acquired 7 and 8 Au-
gust 2011, slightly more than 2 years before the acquisition
of Pléiades images (Jóhannesson et al., 2013). The vertical
accuracy of the lidar DEM and its horizontal positioning ac-
curacy has been estimated to be well within 0.5 m (Jóhannes-
son et al., 2011).
The Cryosphere, 8, 2275–2291, 2014 www.the-cryosphere.net/8/2275/2014/

E. Berthier et al.: Glacier topography and elevation changes derived from Pléiades sub-meter stereo images 2279
3 Methods
3.1 Pléiades DEM generation
All Pléiades DEMs presented in this paper were calculated
using the OrthoEngine module of PCI Geomatica 2013. The
original orientation of each image was read in the ancillary
data provided with the images in the form of rational poly-
nomial coefficients. Without ground control points (GCPs),
the horizontal location accuracy of the images was estimated
at 8.5 m (CE90, Circular Error at a confidence level of 90 %)
for Pléiades-1A and 4.5 m for Pléiades-1B (Lebègue et al.,
2013). This initial orientation was then refined using GCPs
when available. DEMs were generated with a pixel size of
4 m, a compromise offering relatively fast processing and
sufficient resolution. In addition to pixel size, two other main
parameters can be tuned during DEM generation with Or-
thoEngine: the level of detail of the DEM (from low to very
high) and the type of relief in the scene (from plain to moun-
tainous). Unless otherwise mentioned, all DEMs evaluated
in the present paper were obtained with the low and moun-
tainous settings. The choice of these parameters is justified
in Sect. 4.1. Data voids were generally not filled by interpo-
lation during DEM generation because our aim was not to
obtain complete coverage but rather to determine where ele-
vations were extracted and what their quality was. Thus, the
statistics on elevation differences are only provided outside
of Pléiades DEM data voids, except when mentioned explic-
itly.
The use of a commercial software is one of the limitations
of our study. For example, it is not possible to know the exact
DEM extraction parameters (e.g. correlation window size,
correlation threshold) hidden behind the PCI processing pa-
rameter settings. Future analyses are planned to evaluate and
inter-compare some open-source software able to generate
DEMs from Pléiades stereo images such as, among others
surface extraction through triangular irregular network-based
minimisation (SETSM) (Noh and Howat, 2014b), the Satel-
lite Stereo Pipeline (s2p) (De Franchis et al., 2014) and the
Ames Stereo Pipeline (ASP) (Moratto et al., 2010).
3.2 Pléiades DEM evaluation
The metrics used to describe the quality of the DEMs are
the percentage of data voids and various statistics on the el-
evation differences between the Pléiades DEMs and the ref-
erence (GNSS or lidar) data: (i) their mean, µ, and median
to evaluate the vertical accuracy of the DEMs and (ii) their
standard deviation (SD) and normalised median absolute de-
viation (NMAD) to characterise their vertical precision. The
NMAD is a metric for the dispersion of the data (also at the
1σ confidence level) that is not as sensitive to outliers as the
SD and is recommended to evaluate DEM precision (Höhle
and Höhle, 2009).
NMAD= 1.4826 ·median(∣∣1hj −m1h∣∣) , (1)
where 1hj denotes the individual errors and m1h is the me-
dian of the errors.
All statistics were computed after horizontal co-
registration of the DEMs to the reference data. These hor-
izontal shifts were obtained (i) by minimising the SD of
the elevation differences when two DEMs were compared
(Berthier et al., 2007; Rodriguez et al., 2006); (ii) in other
cases by estimating the shift between a Pléiades orthoimage
and the GNSS measurements acquired along certain trails
and roads clearly visible in the images (e.g. Wagnon et al.,
2013). When GCPs were used to compute the DEMs, we al-
ways verified visually that no horizontal shift of more than
one to two pixels (i.e. 0.5 to 1 m) remained between the Pléi-
ades orthoimages and the GNSS tracks acquired along roads
and trails. Thus, no planimetric correction was required. For
Tungnafellsjökull, the GCPs were derived from a shaded re-
lief image of the lidar DEM and a small shift remained be-
tween the Pléiades and the lidar DEM (see Sect. 4.2).
All elevation differences between the Pléiades DEMs and
the reference data (GNSS surveys or lidar DEM) are assumed
to be due to errors in the Pléiades DEMs. In fact the total er-
ror budget also includes (i) on glaciers only, real and spatially
varying elevation changes over the time span of a few days or
weeks separating the acquisition of the Pléiades images and
the reference data and (ii) everywhere, errors in the reference
data themselves. Error (i) can also matter off glacier if snow
was present during the acquisition of the Pléiades images or
the reference data. Therefore, the present study provides an
upper limit for the errors of the Pléiades DEMs. When the
time between satellite acquisition and field measurements ex-
ceeds a few weeks (e.g. the lidar DEM in Iceland), only ref-
erence data off glaciers are considered for the evaluation of
the DEM, and data on glaciers are used only for the study of
glacier elevation changes.
3.3 Glacier outlines
Glaciers outlines are needed for the Mont-Blanc area and
the Icelandic study site to perform separate statistics on/off
glaciers and to compute the glacier-wide mean elevation
changes. For Mont Blanc, glacier outlines were drawn manu-
ally on a SPOT 5 2.5 m orthoimage acquired 23 August 2003.
Very little seasonal snow remained when this image was ac-
quired due to the heatwave that baked Europe in early Au-
gust 2003. For Tungnafellsjökull, the margin of the ice cap
was digitised manually from a shaded relief image of the
August 2011 lidar DEM. The surrounding snow patches were
obtained through semi-automatic classification applied to the
corresponding lidar intensity image. For others study sites,
GNSS data points were overlaid on the Pléiades orthoimages
and visually classified as on/off glaciers so that no glacier
outline was necessary.
www.the-cryosphere.net/8/2275/2014/ The Cryosphere, 8, 2275–2291, 2014

2280 E. Berthier et al.: Glacier topography and elevation changes derived from Pléiades sub-meter stereo images
Table 2. Influence of different processing parameter settings on the coverage and accuracy of the Pléiades DEMs. Statistics for the elevation
differences between the Pléiades and lidar DEMs are computed for ∼ 3 000 000 data points on the ice-free terrain around the Tungnafell-
sjökull ice cap (Iceland). The parameter settings tested are as follows: type of terrain is mountainous (Mtn) or flat, DEM detail is low or high,
data gaps are filled or not filled. All Pléiades DEMs are computed using 5 GCPs and with a final pixel size of 4 m. The table provides the
horizontal shifts of the Pléiades DEMs and, after horizontal co-registration (i.e. correction of the mean horizontal shift between the Pléiades
and the lidar DEMs on the ice-free terrain), statistics (mean, median, SD and NMAD) of the elevation differences (dh, ZPléiades−Zlidar)
outside the ice cap (OFF ice).
Processing Covered Shift Shift Mean dh Median dh SD NMAD
parameters area easting northing OFF ice∗ OFF ice∗ OFF ice∗ OFF ice∗
(%) (m) (m) (m) (m) (m) (m)
Mtn, low, 99.0 1.94 −0.56 0.02 0.03 0.88 0.74
not filled
Mtn, low, 100 1.89 −0.66 0.08 0.00 2.19 0.92
filled
Mtn, 92.9 1.91 −0.58 0.02 0.02 0.60 0.71
high, not
filled
flat, low, 93.6 1.94 −0.44 0.04 0.04 0.51 0.70
not filled
∗ after horizontal co-registration. The parameter that was changed compared to the first row is in bold.
4 Accuracy and precision of the Pléiades DEMs
The stable terrain around the Tungnafellsjökull ice cap (Ice-
land), which was snow-free on 7–8 August 2011 when the
lidar DEM was acquired, is our primary site to evaluate the
Pléiades DEM because of the extensive coverage and high
accuracy provided by the lidar DEM. For this site, we ex-
plore the influence of the different processing parameters in
PCI Geomatica (Sect. 4.1), of the number of GCPs (Sect. 4.2)
and check the occurrence of spatially varying biases in the
Pléiades DEM (Sect. 4.3). The Pléiades DEMs for the other
study sites were then evaluated (Sect. 4.4).
4.1 Processing parameter settings
Our criteria for selecting processing parameter settings for
the DEM generation were (i) the percentage of coverage with
valid data (covered area column in Table 2) and (ii) the dis-
persion of the elevation differences around the mean and me-
dian (quantified using the SD and NMAD, respectively).
With the parameters “Type of relief” set to mountain-
ous, “DEM detail” set to low and without filling data voids,
the dispersion is just slightly larger and the area covered is
greatly improved (nearly 99 % versus less than 93 %). All
DEMs examined in the rest of this study were generated
using these parameter settings, which seems to be the best
compromise between a low percentage of data voids and a
low dispersion of the elevation differences. We acknowledge
that the differences obtained for different processing param-
eter settings are not very large and hence that other settings
may be more appropriate in some cases. For instance, to map
crevasses using a Pléiades DEM, a high or extra high level of
detail would probably be a better setting. Filling data voids
by interpolation leads to much larger errors (the SD is mul-
tiplied by a factor of 3, Table 2) and is not recommended
except if a complete DEM is really needed (e.g. for orthorec-
tification of an image).
4.2 Influence of the numbers of GCPs and tie points
Our five study sites are the target of glacier field measure-
ments; therefore, GCPs are already available from static
GNSS measurements of prominent features such as large
boulders or crossing roads or could be measured in the future
during dedicated campaigns. However, GCPs are not avail-
able in all ice-covered regions and it is important to assess
their influence on DEM quality and determine whether use-
ful DEMs can be retrieved in remote regions where no GCPs
are available. At the time of DEM processing, no GCPs were
available for the Astrolabe (Antarctica) and Mera (Nepal)
study sites. The best GCP coverage was around Tungnafell-
sjökull where 19 evenly distributed GCPs were identified
manually on a shaded relief image (pixel size of 2 m) de-
rived from the lidar DEM. Uncertainties in the latter GCPs
results from (i) errors in pointing manually identical features
in the Pléiades images and the lidar shaded relief image and
(ii) the horizontal and vertical errors in the lidar data. Tung-
nafellsjökull was thus the site chosen to test the influence of
the number of GCPs.
For the Tungnafellsjökull site, the Pléiades DEM derived
without any GCPs exhibits a horizontal shift of about 3.3 m
and is also about 3 m too high on the average (Table 3). The
The Cryosphere, 8, 2275–2291, 2014 www.the-cryosphere.net/8/2275/2014/

E. Berthier et al.: Glacier topography and elevation changes derived from Pléiades sub-meter stereo images 2281
Table 3. Influence of the collection of ground control points (GCPs) and tie point (TPs) on the accuracy of the Pléiades DEMs. Statistics
are computed for the elevation differences (dh) between the Pléiades and lidar DEMs around and on the Tungnafellsjökull ice cap (Iceland).
The Pléiades DEMs are computed using different numbers of GCPs and TPs. The parameter settings used to generate all the DEMs are as
follows: DEM detail is low, type of terrain is mountainous, pixel size is 4 m, data gaps are not filled. The number of pixels used in these
statistics is over 3 000 000.
Nb of GCPs/ Shift Shift Mean dh Median dh SD NMAD Mean dh
TPs Easting Northing OFF icea OFF icea OFF icea OFF icea ON iceb
(m) (m) (m) (m) (m) (m) (m)
0/0 3.16 −1.13 3.07 3.08 0.93 0.84 −1.60
0/20 3.22 −1.33 3.60 3.62 0.92 0.76 −1.57
1/0 2.18 −0.56 0.08 0.09 0.90 0.76 −1.60
5/0 1.94 −0.56 0.02 0.03 0.88 0.74 −1.59
19/0 1.86 −0.50 −0.05 −0.04 0.89 0.74 −1.59
a after horizontal co-registration; b after horizontal and vertical co-registration, i.e. correction of the mean horizontal and vertical
shifts between the Pléiades and lidar DEMs estimated on the ice-free terrain.
addition of GCPs reduces the horizontal shift to about 2 m
and the vertical shift nearly vanishes. In fact, a single accu-
rate GCP appears to be sufficient to eliminate most of the
vertical bias. In contrast, the horizontal shift is never entirely
removed, even with 19 GCPs, possibly because a system-
atic shift may arise from GCP identification in the shaded
relief image of the lidar DEM. The last column of Table 3
corresponds to the mean elevation difference between Au-
gust 2011 and October 2013 on the ice cap after horizontal
and vertical co-registration (referred to as 3-D co-registration
hereafter) of the Pléiades and lidar DEMs. The similarity of
these values (within 0.03 m) illustrates the effectiveness of
3-D co-registration. It implies that, if the subtracted DEMs
include a sufficient proportion of stable areas (i.e. ice-free
terrain), accurate elevation change measurements can be re-
trieved even without GCPs.
In the case of the Icelandic study site, the collection of tie
points (TPs, i.e. homologous points identified in both images
of the stereo pair but with unknown geographic coordinates)
had no clear influence on the quality of the DEM: the vertical
bias is increased by 0.5 m and the dispersion is slightly lower.
In Sect. 4.4, we will show that this conclusion does not hold
for the other study sites.
4.3 Spatial pattern of the off-glacier elevation
differences
In the previous sections, we assessed the overall accuracy of
the Pléiades DEM on the whole ice-free terrain surround-
ing Tungnafellsjökull. However, past studies have high-
lighted the occurrence of spatially varying elevation errors
in ASTER and SPOT 5 DEMs due notably to unrecorded
variations in satellite attitude (Berthier et al., 2012; Nuth
and Kääb, 2011). To quantify these errors, we split the map
of elevation differences between the Pléiades DEM (com-
puted using 5 GCPs) and the lidar DEM into X × X tiles
(with X the number of tiles in each direction, varying from 2
to 5) and computed the median elevation difference on the
Figure 3. Map of the elevation differences between the lidar DEM
(7–8 August 2011) and the Pléiades DEM (9 October 2013) of the
Tungnafellsjökull Ice Cap. The margin of the ice cap is shown by a
thick black line and snow patches are outlined with a thinner black
line. On the ice cap, the elevation contour lines are drawn as thin
dashed lines every 100 m (from 1000 to 1500 m a.s.l.). The study
area has been divided into 3× 3 tiles in which the median of the
elevation differences on the ice-free terrain only is reported (in me-
tres). Background: Pléiades image (©CNES 2013, Distribution Air-
bus D & S).
ice-free terrain of each tile. The median was preferred here
because it is a metric of centrality less affected by outliers
(Höhle and Höhle, 2009). The results are shown in Fig. 3
for X= 3. The maximum absolute departure from 0 is ob-
served for the north-west tile where the median elevation
difference between the Pléiades and lidar DEMs reaches
www.the-cryosphere.net/8/2275/2014/ The Cryosphere, 8, 2275–2291, 2014

2282 E. Berthier et al.: Glacier topography and elevation changes derived from Pléiades sub-meter stereo images
Table 4. Statistics on the elevation differences between the Pléiades DEMs and the GNSS measurements for all study sites. When a tri-stereo
was available, the statistics for the three different image combinations and for a merged DEM are given. For Agua Negra and Tungnafell-
sjökull, the statistics are also given separately on and off glaciers. The last column, N , indicates the number of points for which elevation
differences are computed.
Site Number Image Covered ON/OFF Mean Median SD NMAD N
of GCPs combination area glacier (m) (m) (m) (m)
(Tri-stereos (%)
only)
5
Front/Nadir 96.7 ON & OFF 1.00 1.04 1.06 0.84 2403
Nadir/Back 96.3 ON & OFF −0.33 −0.15 1.26 1.10 2343
Front/Back 93.4 ON & OFF 0.55 0.62 1.02 0.86 2324
Front/Nadir & 97.7 ON & OFF 0.37 0.47 1.04 0.83 2403
Andes, Nadir/Back ON 0.53 0.64 0.81 0.63 932
Agua Negra OFF 0.27 0.35 1.16 1.03 1471
0
Front/Nadir 96.7 ON & OFF 1.33 1.38 1.16 1.00 2389
Nadir/Back 96.5 ON & OFF 0.99 1.05 1.13 0.85 2329
Front/Back 93.5 ON & OFF 1.22 1.30 1.10 0.83 2308
Front/Nadir &97.8 ON & OFF 1.17 1.23 1.08 0.84 2388
Nadir/Back
Alps, 13 93.1 ON 0.97 0.99 0.69 0.62 491
Mont Blanc0 90.2 ON 6.84 6.84 0.98 0.78 493
2012
11
Front/Nadir 85.5 ON 0.08 0.09 0.55 0.44 460
Alps, Nadir/Back 85.4 ON 0.03 0.07 0.56 0.46 475
Mont Blanc Front/Back 70.9 ON 0.11 0.11 0.56 0.36 479
2013 Front/Nadir &94.2 ON 0.03 0.04 0.51 0.41 479
Nadir/Back
Iceland,
5 99.0
ON & OFF −0.09 −0.08 0.84 0.37 3856
Tungnafellsjökull ON −0.07 −0.06 0.53 0.37 2764
OFF −0.15 −0.12 1.33 0.40 1092
Himalaya, 22 (from82.0 ON −0.94 −0.93 1.02 0.92 445
Mera SPOT 5)
Antarctica,0 98.5 ON 1.86 1.84 0.72 0.55 170
Astrolabe
−0.15 m (µ=−0.20, SD= 0.79, N = 141 754), followed by
the south-east tile (median= 0.10 m, µ= 0.12, SD= 0.37,
N = 12 246). These two tiles are also the ones with the most
limited data coverage. This maximum absolute median ele-
vation difference is 0.08, 0.26, and 0.24 m when X = 2, 4,
and 5, respectively. These statistics show very limited spa-
tially varying elevation differences between the Pléiades and
lidar DEMs, implying that, within each quadrant, elevation
changes of a sufficiently large ice body could be retrieved
with an uncertainty of about ±0.3 m or less.
4.4 Evaluation of the Pléiades DEMs from all study sites
Table 4 summarises the results of the evaluation of the Pléi-
ades DEMs with GNSS measurements for all study sites. In
the Andes and for Mont Blanc, 5–13 GCPs were available to
compute the DEMs.
For Mera Glacier in Himalaya no accurate GCPs, i.e. mea-
sured in the field using static GNSS positioning, were avail-
able at the time of processing. Instead, a set of 22 GCPs was
derived from a coarser resolution SPOT 5 data set (2.5 m or-
thoimage and 40 m DEM). These SPOT 5 data were previ-
ously co-registered to GNSS data acquired along the trails of
the Everest base camp, outside of the Pléiades images (see
Wagnon et al., 2013, for a complete description). Because of
the coarse resolution of the SPOT 5 DEM we tried as much
as possible to select GCPs over flat terrain. The horizontal
precision of these GCPs is limited by the SPOT 5 pixel size
(2.5 m) and their vertical precision is about ±5 m, the preci-
sion of the SPOT 5 DEM. For Astrolabe Glacier, no GCPs
were available at the time of processing.
The Cryosphere, 8, 2275–2291, 2014 www.the-cryosphere.net/8/2275/2014/

E. Berthier et al.: Glacier topography and elevation changes derived from Pléiades sub-meter stereo images 2283
Figure 4. Comparison of the 21 August 2003 SPOT 5 and 19 August 2012 Pléiades DEMs of the accumulation basin of the Mer de Glace.
The upper panels show the SPOT 5 data and the lower panels the Pléiades data. From left to right, the panels show successively the satellite
images, the DEMs with the 50 m elevation contour lines and the shaded relief images derived from the DEMs. Note the higher percentage of
data voids and artefacts in the SPOT 5 DEM.
4.4.1 Precision of the DEMs
The vertical precision (quantified using the SD and the
NMAD) is relatively homogeneous for all sites and gener-
ally between ±0.5 and ±1 m (NMAD values ranging from
0.36 to 1.1 m and SDs from 0.51 to 1.26 m). These precision
values are consistent with a recent study for a small glacier in
the Pyrénées (Marti et al., 2014) and slightly better than those
obtained using Pléiades stereo pairs in two other studies (Poli
et al., 2014; Stumpf et al., 2014). For the relatively steep and
vegetated terrain around landslides in the southern French
Alps (Stumpf et al., 2014), the precision of the Pléiades DEM
is around ±3 m. For the urban landscape around the city of
Trento in Italy (Poli et al., 2014), it is ±6 m or more. The
seemingly lower precision in other studies is probably not
due to differences in the processing of the Pléiades images
but more likely due to the influence of the landscape on the
DEM precision. A quasi-linear relationship has been found
between DEM precision and terrain slope (e.g. Toutin, 2002).
It is also problematic to extract precise DEMs in urban areas
(e.g. Poli et al., 2014). We would therefore expect to obtain
a better precision on smooth glacier topography. This is con-
firmed by the results for the two study sites (Agua Negra and
Tungnafellsjökull), where GNSS data have been collected on
and off glaciers (Table 4). The precisions are always higher
on glaciers. The improvement is particularly spectacular on
the Tungnafellsjökull study site where the SD of the elevation
difference is 0.53 m on the ice cap and 1.33 m elsewhere. The
decrease of the SD is not as strong for the Agua Negra study
site, possibly because the glacier presented a rough topog-
raphy (0.5 to 1 m high penitents) at the end of the ablation
season when the Pléiades images and GNSS measurements
were acquired.
It is notoriously difficult to extract reliable elevation mea-
surements in the flat and textureless accumulation areas
of glaciers using stereo photogrammetry. In our Pléiades
DEMs, only a limited percentage of data voids is present in
these accumulation areas which suggests a good correlation
between the images. This is confirmed by the vertical preci-
sion of the DEMs which reaches the same level as in the ab-
lation areas. For example, in the Mont-Blanc area, 16 GNSS
points were measured in 2012 above 4000 m a.s.l. in the Col
du Dôme area (Fig. 2, southernmost points on the Mont
Blanc Pléiades image), well above the regional equilibrium
line altitude of ∼ 3100 m a.s.l. during the last 10 years (Ra-
batel et al., 2013). For these 16 points, the mean bias of the
August 2012 Pléiades DEM is 0.19 m (median= 0.14 m) and
the SD of the elevation difference is 0.40 m.
These quantitative assessments are confirmed qualitatively
when examining elevation contours and shaded relief images
generated from the DEMs (Figs. 4 and 5). The smoothness of
the elevation contour lines and of the shaded relief images re-
www.the-cryosphere.net/8/2275/2014/ The Cryosphere, 8, 2275–2291, 2014

2284 E. Berthier et al.: Glacier topography and elevation changes derived from Pléiades sub-meter stereo images
Figure 5. Comparison of the 14 December 2007 SPOT 5 and 6 February 2013 Pléiades DEMs of Astrolabe Glacier. (a) shows the Pléiades
image. The two right panels show shaded relief images derived from the Pléiades DEM (b) and the SPOT 5-HRS DEM (c) with the 100 m
elevation contour lines overlaid.
flects the smoothness of the Pléiades DEMs for the upper ac-
cumulation basin of the Mer de Glace (the so-called Glacier
du Géant) and the Astrolabe Glacier in Antarctica. The noise
level is much larger in the SPOT 5 DEMs of these areas.
Together with the larger dynamic range (12 bits for Pléiades
vs. 8 bits for SPOT 5), we suggest that the higher resolution
of Pléiades allows capturing some fine-scale surface features
that facilitate the matching of the images.
4.4.2 Accuracy of the DEMs
When GCPs are available, the vertical bias (i.e. the mean
or median of the elevation differences) is generally lower
than 1 m. The GNSS surveys on glaciers used to evaluate
the DEMs are not exactly temporally coincident with the
acquisition dates of the Pléiades images (Table 1). Hence,
part of these vertical biases may be explained by real (but
unknown) glacier elevation changes during this time in-
terval. For example, in the case of the Mont Blanc 2012
DEM, the ca. 1 m elevation difference could be easily ex-
plained by the thinning that likely occurred between 19 Au-
gust 2012 (Pléiades DEM) and 5–8 September 2012 (GNSS
survey) on the rapidly thinning tongues of Argentière Glacier
and Mer de Glace. Ablation field measurements performed
on stakes on Argentière Glacier between 16 August and
5 September 2012 gave values of −0.98 m water equiva-
lent (w.e.) at 2400 m a.s.l., −0.75 m w.e. at 2550 m a.s.l. and
−0.60 m w.e. at 2700 m a.s.l. These ablation values, mea-
sured during a similar time period, approach the 1 m ele-
vation difference observed between the Pléiades DEM and
the GNSS survey but this agreement can only be considered
as a general indication because glacier elevation changes are
the combination of surface mass balance and ice dynamics
processes.
Without GCPs, the vertical biases of the DEMs are larger:
about 1 m for the Agua Negra study site, 2 m for the Astro-
labe Glacier (Antarctica) and as much as 7 m for the Au-
gust 2012 Mont Blanc DEM. These results clearly demon-
strate the necessity to vertically adjust the Pléiades DEMs
built without GCPs on stable terrain before using them to re-
trieve elevation changes (Paul et al., 2014).
For the Agua Negra study site, we obtained similar verti-
cal biases between the three different versions of the Pléiades
DEMs (front/nadir, nadir/back, front/back) computed with-
out GCPs, with mean vertical biases ranging from 0.99 to
1.33 m. Conversely, with our 5 GCPs, the mean vertical bi-
ases range from −0.33 to 1 m. There are two possible expla-
nations for this. First, the coordinates of the GCPs were cal-
culated using a GNSS base station located as far as 100 km
away and are more uncertain than for other study sites. Sec-
ond, the identification on the Pléiades images of the features
(GCPs) measured in the field (e.g. large boulders) was some-
times ambiguous.
4.4.3 Necessity of tie points
We already mentioned above that TPs had no influence on
the coverage and the precision of the DEM of the Tungnafell-
sjökull ice cap (Table 3). However, this does not hold for the
Mont-Blanc area and the Astrolabe Glacier, two other sites
where DEMs were generated without GCPs. In both cases,
the automatic collection of about 20 TPs provided far better
coverage probably by improving the relative orientation of
the two images of the stereo pairs. The necessity of collect-
ing TPs will depend on the accuracy of the navigation data
(position and attitude of the satellite) provided with the im-
ages. Given that the latter accuracy is not known a priori, we
recommend collecting TPs between the images.
4.4.4 Added value of a tri-stereo
There is a moderate added value of a tri-stereo instead of
a simple stereo pair. In general, among the three possible
pair combinations of the three images, the largest percentage
The Cryosphere, 8, 2275–2291, 2014 www.the-cryosphere.net/8/2275/2014/

E. Berthier et al.: Glacier topography and elevation changes derived from Pléiades sub-meter stereo images 2285
of data gaps is observed for the front/back pair, due to the
stronger distortion between these images. This is especially
true when the base-to-height ratio is high (> 0.5), for exam-
ple in the case of the Mont Blanc 2013 tri-stereo where the
data voids represent as much as 30 % for the nadir/back pair
and only 15 % for the front/nadir and nadir/back pairs. For
the latter two pairs, we combined the two DEMs in a merged
DEM as follows: (i) for pixels where both DEMs were avail-
able, the mean of the two values was calculated; (ii) for pix-
els where only one DEM was available, this single value was
retained; (iii) for pixels corresponding to data voids in both
DEMs, a data void was kept in the merged DEM (i.e. no gap
filling was used). The percentage of data voids in the Mont
Blanc 2013 merged DEM dropped from 15 to 6 %, showing
that data voids were not at the same location in the front/nadir
and nadir/back DEMs. For Agua Negra Glacier (Andes), the
same merging reduced the percentage of data voids by only
1 % (but the initial coverage in the DEMs was higher, over
96 %) with no significant improvements in vertical precision.
5 Seasonal, annual and multi-annual glacier elevation
changes
5.1 Seasonal elevation changes
A comprehensive GNSS survey of Tungnafellsjökull ice cap
was performed using a snowmobile on 2 May 2013, 5 months
before the acquisition of the Pléiades stereo pair. The Pléi-
ades DEM, first co-registered horizontally and vertically to
the lidar DEM, was compared to GNSS elevations to reveal
the surface elevation changes during the 2013 melt season
between 2 May and 9 October. As expected, the surface was
lower in October due to snow, and to a lesser extent, firn
compaction and surface melt during summer (Fig. 6). On
the average, the surface lowering between May and Octo-
ber 2013 was 3.1 m (SD= 0.89 m, N = 4800). Part of this
lowering is also due to ice dynamics in the accumulation
area, whereas ice motion (i.e. emergent velocity) only partly
counteracts the strong lowering due to melting in the ablation
zone in summer. A clear pattern with elevation is observed,
with greater thinning at lower elevations close to the margins
of the ice cap (inset of Fig. 6). Precise elevation changes are
available at cross-over points between the extensive GNSS
survey in May 2013 and the more limited GNSS coverage
in September 2013 (Fig. 2). At those locations, there is good
agreement (within 0.4 m) between the Pléiades–GNSS and
repeated GNSS elevation change measurements.
5.2 Annual elevation changes
For the Mont-Blanc area, two Pléiades DEMs were available
with a time difference of slightly more than a year (19 Au-
gust 2012 and 20 September 2013). These two DEMs were
first co-registered by minimising the SD of their elevation
differences on the ice-free terrain (e.g. Berthier et al., 2007).
Figure 6. Elevation differences between the kinematic GNSS data
(2 May 2013) and the Pléiades DEM (9 October 2013) on the Tung-
nafellsjökull ice cap. Black circles indicate the locations where el-
evation differences have been measured using repeated GNSS sur-
veys (2 May 2013 and 18 September 2013). Yellow crosses show
the location of most of the 19 GCPs used to generate the DEM (two
are masked by the inset and the colour scale). Inset: distribution of
these elevation differences with altitude, with repeat GNSS surveys
shown as larger dots. Background: shaded relief image derived from
the Pléiades DEM.
The corrected horizontal shifts were 1 m in easting and nor-
thing. The remaining vertical shift on the ice-free terrain after
horizontal co-registration was only 0.1 m (median of the ele-
vation differences) and the dispersion (NMAD) was 1.79 m.
These very low horizontal and vertical shifts could be ex-
pected given that the 2012 and 2013 DEMs were built using
the same set of GCPs. This negligible median elevation dif-
ference off glaciers tends to confirm that the 19 August 2012
DEM is not biased and that the ca. 1 m average elevation
difference between the 19 August 2012 DEM and the 5–
8 September 2012 GNSS measurements (Table 4) is due to
real elevation changes, not errors in the 2012 Pléiades DEM.
Once co-registered in 3-D, the DEMs were differentiated
to map the glacier elevation changes that occurred over the
13 months between 19 August 2012 and 20 September 2013
(Fig. 7). Due to the difference in seasonality, the glaciolog-
ical interpretation of these changes, as well as their com-
parison to field measurements (performed annually around
10 September), is not straightforward. However, the map
reveals a clear thinning for all glacier tongues, whereas
thickening is observed on most glaciers above 3000 m a.s.l.,
with some localised elevation gains of over 5 m, probably
www.the-cryosphere.net/8/2275/2014/ The Cryosphere, 8, 2275–2291, 2014
2286 E. Berthier et al.: Glacier topography and elevation changes derived from Pléiades sub-meter stereo images
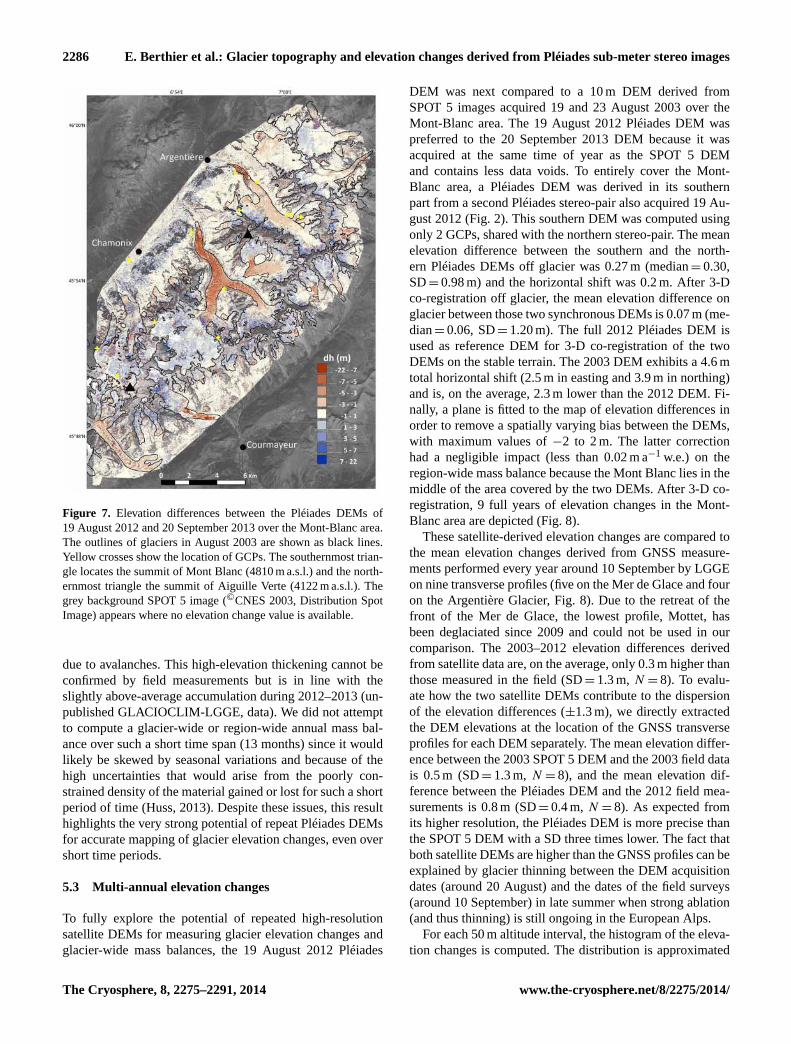
Figure 7. Elevation differences between the Pléiades DEMs of
19 August 2012 and 20 September 2013 over the Mont-Blanc area.
The outlines of glaciers in August 2003 are shown as black lines.
Yellow crosses show the location of GCPs. The southernmost trian-
gle locates the summit of Mont Blanc (4810 m a.s.l.) and the north-
ernmost triangle the summit of Aiguille Verte (4122 m a.s.l.). The
grey background SPOT 5 image (©CNES 2003, Distribution Spot
Image) appears where no elevation change value is available.
due to avalanches. This high-elevation thickening cannot be
confirmed by field measurements but is in line with the
slightly above-average accumulation during 2012–2013 (un-
published GLACIOCLIM-LGGE, data). We did not attempt
to compute a glacier-wide or region-wide annual mass bal-
ance over such a short time span (13 months) since it would
likely be skewed by seasonal variations and because of the
high uncertainties that would arise from the poorly con-
strained density of the material gained or lost for such a short
period of time (Huss, 2013). Despite these issues, this result
highlights the very strong potential of repeat Pléiades DEMs
for accurate mapping of glacier elevation changes, even over
short time periods.
5.3 Multi-annual elevation changes
To fully explore the potential of repeated high-resolution
satellite DEMs for measuring glacier elevation changes and
glacier-wide mass balances, the 19 August 2012 Pléiades
DEM was next compared to a 10 m DEM derived from
SPOT 5 images acquired 19 and 23 August 2003 over the
Mont-Blanc area. The 19 August 2012 Pléiades DEM was
preferred to the 20 September 2013 DEM because it was
acquired at the same time of year as the SPOT 5 DEM
and contains less data voids. To entirely cover the Mont-
Blanc area, a Pléiades DEM was derived in its southern
part from a second Pléiades stereo-pair also acquired 19 Au-
gust 2012 (Fig. 2). This southern DEM was computed using
only 2 GCPs, shared with the northern stereo-pair. The mean
elevation difference between the southern and the north-
ern Pléiades DEMs off glacier was 0.27 m (median= 0.30,
SD= 0.98 m) and the horizontal shift was 0.2 m. After 3-D
co-registration off glacier, the mean elevation difference on
glacier between those two synchronous DEMs is 0.07 m (me-
dian= 0.06, SD= 1.20 m). The full 2012 Pléiades DEM is
used as reference DEM for 3-D co-registration of the two
DEMs on the stable terrain. The 2003 DEM exhibits a 4.6 m
total horizontal shift (2.5 m in easting and 3.9 m in northing)
and is, on the average, 2.3 m lower than the 2012 DEM. Fi-
nally, a plane is fitted to the map of elevation differences in
order to remove a spatially varying bias between the DEMs,
with maximum values of −2 to 2 m. The latter correction
had a negligible impact (less than 0.02 m a−1 w.e.) on the
region-wide mass balance because the Mont Blanc lies in the
middle of the area covered by the two DEMs. After 3-D co-
registration, 9 full years of elevation changes in the Mont-
Blanc area are depicted (Fig. 8).
These satellite-derived elevation changes are compared to
the mean elevation changes derived from GNSS measure-
ments performed every year around 10 September by LGGE
on nine transverse profiles (five on the Mer de Glace and four
on the Argentière Glacier, Fig. 8). Due to the retreat of the
front of the Mer de Glace, the lowest profile, Mottet, has
been deglaciated since 2009 and could not be used in our
comparison. The 2003–2012 elevation differences derived
from satellite data are, on the average, only 0.3 m higher than
those measured in the field (SD= 1.3 m, N = 8). To evalu-
ate how the two satellite DEMs contribute to the dispersion
of the elevation differences (±1.3 m), we directly extracted
the DEM elevations at the location of the GNSS transverse
profiles for each DEM separately. The mean elevation differ-
ence between the 2003 SPOT 5 DEM and the 2003 field data
is 0.5 m (SD= 1.3 m, N = 8), and the mean elevation dif-
ference between the Pléiades DEM and the 2012 field mea-
surements is 0.8 m (SD= 0.4 m, N = 8). As expected from
its higher resolution, the Pléiades DEM is more precise than
the SPOT 5 DEM with a SD three times lower. The fact that
both satellite DEMs are higher than the GNSS profiles can be
explained by glacier thinning between the DEM acquisition
dates (around 20 August) and the dates of the field surveys
(around 10 September) in late summer when strong ablation
(and thus thinning) is still ongoing in the European Alps.
For each 50 m altitude interval, the histogram of the eleva-
tion changes is computed. The distribution is approximated
The Cryosphere, 8, 2275–2291, 2014 www.the-cryosphere.net/8/2275/2014/

E. Berthier et al.: Glacier topography and elevation changes derived from Pléiades sub-meter stereo images 2287
Figure 8. Elevation differences between the SPOT 5 DEM from 19 to 23 August 2003 and Pléiades DEM from 19 August 2012 over the
Mont-Blanc area. In yellow, the location of the transverse profiles where elevations are measured every year using differential GNSS. The
field (noted GNSS) and satellite (SAT) 2003–2012 elevation differences averaged along these profiles are indicated. Inset: satellite-derived
(SAT, small symbols) and field (GNSS, large symbols) elevation changes as a function of altitude for the Mer de Glace (blue) and the
Argentière (grey) glaciers. Large symbols correspond to the field measurements.
by a Gaussian curve, which permits the calculation of the
mean thickness change as the average of all the values less
than 3 SDs from the mode of the Gaussian curve (Berthier et
al., 2004; Gardner et al., 2012). Where no elevation change
is available for a pixel, we assign to it the value of the mean
elevation change of the 50 m altitude interval it belongs to,
in order to assess the mass balance over the whole glacier
area. Conservatively, the SD of the elevation differences at
the eight transverse profiles (±1.3 m) is used as our error es-
timate for the 2003–2012 satellite-derived elevation differ-
ences. For un-surveyed areas, this elevation change error is
multiplied by a factor of 5, resulting in an error of±8 m. The
percentage of data voids equals 15 % for the whole Mont-
Blanc area and range from 2 to 22 % for individual glaciers
(Table 5). Elevation differences are converted to annual mass
balances using a density of 850± 60 kg m−3 (Huss, 2013).
The resulting glacier-wide geodetic mass balance
for Argentière Glacier (−1.12± 0.18 m a−1 w.e.) be-
www.the-cryosphere.net/8/2275/2014/ The Cryosphere, 8, 2275–2291, 2014

2288 E. Berthier et al.: Glacier topography and elevation changes derived from Pléiades sub-meter stereo images
Table 5. Geodetic mass balances for the entire Mont-Blanc area and its 10 largest glaciers, sorted by size. Where available, the 2003–2012
geodetic mass balances calculated in this study are compared to the 1979–2003 geodetic mass balances (Berthier, 2005). The glaciological
mass balance is provided for Argentière Glacier.
Glacier Total Data Geodetic Glaciological Geodetic
area voids mass mass mass
2003 (%) balance balance balance
(km2) 2003–2012 2003–2012 1979–2003
(m a−1 w.e.) (m a−1 w.e.) (m a−1 w.e.)
Mer de Glace 22.7 8.6 −1.22± 0.20 −0.40
Argentière 13.5 5.7 −1.12± 0.18 −1.46± 0.40 −0.31
Miage 10.8 16.8 −0.84± 0.22
Bossons 10.5 14.9 −0.32± 0.20 −0.10
Talèfre 7.6 3.6 −1.28± 0.18 −0.38
Tre-la-tête 7.5 10.3 −1.34± 0.22
Tour 7.3 4.0 −0.77± 0.16 −0.24
Saleina 6.1 2.1 −1.20± 0.17
Trient 5.9 7.1 −0.66± 0.17
Brenva 5.8 22.5 −0.83± 0.25
Mont Blanc 161.6 15.6 −1.04± 0.23
tween August 2003 and August 2012 agrees within error
bars with a cumulative glaciological mass balance of
−1.46± 0.40 m a−1 w.e., between September 2003 and
September 2012 (Table 5). Uncertainty for the glacio-
logical mass balance is from Thibert et al. (2008). The
glacier-wide mass balances for 10 selected glaciers are
all negative (Table 5) as the region-wide mass balance of
−1.04± 0.23 m a−1 w.e. A clear acceleration of the mass
loss is observed for all glaciers that were measured both in
1979–2003 and 2003–2012 (Table 5). These results reflect
the strong mass loss that has occurred in the Mont-Blanc
area over the last decade, in agreement with recent studies
elsewhere in the European Alps (Abermann et al., 2009;
Carturan et al., 2013; Gardent et al., 2014; Huss, 2012;
Kropácek et al., 2014; Rabatel et al., 2013).
6 Summary and conclusions
So far, little work has been carried out based on Pléiades im-
ages over glaciers. Our evaluation over five different glacial
environments demonstrates that Pléiades stereo images are
a promising tool for the monitoring of glacier topography
and elevation changes. Overall the precision of these DEMs
(at the 1σ confidence level) is ca. ±1 m, sometimes better
(±0.5 m) for the flat glacier tongues, a result in agreement
with a study on a small glacier in the Pyrénées (Marti et al.,
2014). The coverage and precision of the accumulation areas
is also promising. The higher precision on glaciers compared
to the surrounding ice-free terrain implies that an error esti-
mate performed on the ice-free terrain will be conservative.
Vertical biases are greater (as much as 7 m) if no GCPs are
available but can be greatly reduced through proper 3-D co-
registration of the Pléiades DEMs with a reference altimetry
data set on ice-free terrain. One or two accurate GCPs seem
sufficient to reduce the vertical biases to a few decimetres.
There is a slight improvement of the DEM coverage when
they are derived from a tri-stereo. We have shown for the
Mont-Blanc area that a simple combination of the different
DEMs derived from the three images of a tri-stereo can re-
duce the percentage of data voids and slightly improve preci-
sion of the merged DEM. However, because glacier topog-
raphy is often relatively smooth, a standard stereo cover-
age with a limited difference in incidence angles (typically a
base-to-height ratio of about 0.35–0.45) provides a relatively
comprehensive and cost-effective coverage of the glacier sur-
faces.
One strong advantage of DEMs derived from Pléiades (and
from other optical stereo sensors) compared to DEMs de-
rived from radar images (such as the SRTM and Tandem-X
DEMs) is the absence of penetration into snow and ice. Thus,
all measured elevation differences correspond to real ice and
snow elevation changes. Given their accuracy, DEMs derived
from Pléiades (or other similar optical sensor) could be used
in the future to check the magnitude and spatial pattern of
the penetration depth of the Tandem-X radar signal into snow
and ice, if temporally concomitant acquisitions can be found
in the image archives. As for all optical sensors, the main
drawback of the Pléiades constellation is the need for clear-
sky conditions to obtain suitable cloud-free images.
Our results open some promising perspectives. In the fu-
ture, the differencing of Pléiades DEMs acquired ∼ 5 years
apart could make it possible to determine glacier-wide mass
balances with an uncertainty of ±0.1 to ±0.2 m a−1 w.e.
Such an error level is sufficiently low to check the cumulative
glaciological mass balances measured in the field (e.g. Zemp
et al., 2013) and explore the spatial variability of glacier-wide
The Cryosphere, 8, 2275–2291, 2014 www.the-cryosphere.net/8/2275/2014/

E. Berthier et al.: Glacier topography and elevation changes derived from Pléiades sub-meter stereo images 2289
mass balances at the scale of a glaciated massif (Abermann
et al., 2009; Soruco et al., 2009a). It is already possible to dif-
ferentiate recent Pléiades and older DEMs to provide accu-
rate glacier-wide and region-wide mass balance. In our study,
Pléiades and SPOT 5 DEM differencing was used to measure
the strongly negative mass balance of the entire Mont-Blanc
area. Pléiades DEMs acquired at the beginning and end of the
accumulation seasons could probably be used to map snow
thickness if the ice dynamics component can be estimated. If
this is confirmed, Pléiades will represent a good alternative
to recently developed techniques based on lidar (Deems et
al., 2013; Helfricht et al., 2014) and stereo-photogrammetry
(Bühler et al., 2014), especially for remote areas where ac-
quiring airborne data can be challenging. Still, the conver-
sion of glacier elevation changes measured over short time
periods (1 season or 1 year) to glacier-wide mass balances
will remain a complicated task due to the lack of knowledge
of the actual density of the material (ice–firn–snow) gained
or lost.
Apart from their cost and their sensitivity to cloud cover-
age, the main limitation of Pléiades images is their relatively
limited footprint, typically 20 km× 20 km for a single scene.
No large-scale stereo mapping has yet been planned using
these two satellites and the cost of covering all glaciers on
Earth (> 700 000 km2) would be very high. For mapping vast
glaciated areas, the recently launched SPOT6 and SPOT7
satellites may prove to be a good compromise given their
resolution (1.5 m) and wider swath (60 km). Like Pléiades,
they benefit from a very broad radiometric range (12 bits),
avoiding saturation in most cases and improving contrast on
snow-covered areas. However, the accuracy of the DEMs that
can be derived from these stereo images has yet to be demon-
strated over glaciers, ice caps and ice sheets.
Acknowledgements. We thank I. Howat (editor), three anonymous
referees, R. Marti, S. Gascoin and B. Raup for their constructive
comments that led to an improved manuscript. We acknowledge
all our colleagues who helped collect the GNSS data in the field
(including F. Couvreux, Þ. Jónsson., S. Steinþórsson, C. Wild
and M. Sacchettini) and acquire the Pléiades images (C. Tinel,
D. Fontannaz, D. Giaccobo, M. Bernard and S. Hosford) within
the framework of the CNES Pléiades thematic commissioning
phase and the Airbus Defence and Space “Pléiades User Group”.
Images from Iceland and Antarctica were purchased at research
price thanks to the CNES ISIS program (http://www.isis-cnes.fr/).
GNSS reference data from the TOLO base station (Chile) was
provided by C. Vigny and the “Laboratoire International Associé
Montessus de Ballore”. This study used the recent lidar map-
ping of the glaciers in Iceland that was funded by the Icelandic
Research Fund, the Landsvirkjun Research Fund, the Icelandic
Road Administration, the Reykjavík Energy Environmental and
Energy Research Fund, the Klima- og Luftgruppen (KoL) research
fund of the Nordic Council of Ministers, the Vatnajökull National
Park, the organisation Friends of Vatnajökull, the National Land
Survey of Iceland and the Icelandic Meteorological Office. The
field surveys on Tungnafellsjökull in 2013 were funded by Friends
of Vatnajökull and Landsvirkjun assisted the logistics of these
surveys. Field measurements in the Mont-Blanc area and Mera
Clacier were performed in the framework of the GLACIOCLIM
(Les GLACiers comme Observatoire du CLIMat) project. We
thank D. Six for extracting the 2012–2013 winter accumulation
in the Mont-Blanc area. For Mera Glacier, field work was also
supported by the French National Research Agency (ANR) through
ANR-PAPRIKA and ANR-PRESHINE and has been supported
by a grant from LabexOSUG@2020 (Investissements d’avenir
– ANR10 LABX56). LTHE and LGGE are part of LabExO-
SUG@2020. This study was carried out within the framework of
the Ev-K2-CNR project in collaboration with the Nepal Academy
of Science and Technology as foreseen by the Memorandum of
Understanding between Nepal and Italy, with contributions from
the Italian National Research Council, the Italian Ministry of
Education, University and Research and the Italian Ministry of
Foreign Affairs. This publication is contribution number 50 of the
Nordic Centre of Excellence SVALI, “Stability and Variations of
Arctic Land Ice”, funded by the Nordic top-level initiative (TRI).
SPOT 5-HRS image and DEM of the Astrolabe Glacier were
provided by the International Polar Year SPIRIT project, funded
by the French Space Agency (CNES). E. Berthier acknowledges
support from TOSCA (CNES) and ANR-12-BS06-0018 (SUMER).
Edited by: I. M. Howat
References
Abermann, J., Lambrecht, A., Fischer, A., and Kuhn, M.: Quantify-
ing changes and trends in glacier area and volume in the Aus-
trian Ötztal Alps (1969-1997-2006), The Cryosphere, 3, 205–
215, doi:10.5194/tc-3-205-2009, 2009.
Abermann, J., Fischer, A., Lambrecht, A., and Geist, T.: On
the potential of very high-resolution repeat DEMs in glacial
and periglacial environments, The Cryosphere, 4, 53–65,
doi:10.5194/tc-4-53-2010, 2010.
Arendt, A., Luthcke, S., Gardner, A., O’neel, S., Hill, D., Mo-
holdt, G., and Abdalati, W.: Analysis of a GRACE global mas-
con solution for Gulf of Alaska glaciers, J. Glaciol., 59, 913–924,
doi:10.3189/2013JoG12J197, 2013.
Bamber, J. L. and Rivera, A.: A review of remote sensing methods
for glacier mass balance determination, Global Planet. Change,
59, 138–148, doi:10.1016/j.gloplacha.2006.11.031, 2007.
Berthier, E.: Dynamique et bilan de masse des glaciers de montagne
(Alpes, Islande, Himalaya), Contribution de l’imagerie satelli-
taire, Université Paul Sabatier, LEGOS, Toulouse, 2005.
Berthier, E. and Toutin, T.: SPOT5-HRS digital elevation models
and the monitoring of glacier elevation changes in North-West
Canada and South-East Alaska, Remote Sens. Environ., 112,
2443–2454, 2008.
Berthier, E., Arnaud, Y., Baratoux, D., Vincent, C., and Remy, F.:
Recent rapid thinning of the ”Mer de Glace” glacier derived
from satellite optical images, Geophys. Res. Lett., 31, L17401,
doi:10.1029/2004GL020706, 2004.
Berthier, E., Arnaud, Y., Kumar, R., Ahmad, S., Wagnon, P., and
Chevallier, P.: Remote sensing estimates of glacier mass balances
in the Himachal Pradesh (Western Himalaya, India), Remote
www.the-cryosphere.net/8/2275/2014/ The Cryosphere, 8, 2275–2291, 2014

2290 E. Berthier et al.: Glacier topography and elevation changes derived from Pléiades sub-meter stereo images
Sens. Environ., 108, 327–338, doi:10.1016/j.rse.2006.11.017,
2007.
Berthier, E., Scambos, T. A., and Shuman, C. A.: Mass
loss of Larsen B tributary glaciers (Antarctic Peninsula)
unabated since 2002, Geophys. Res. Lett., 39, L13501,
doi:10.1029/2012GL051755, 2012.
Björnsson, H., Pálsson, F., Guðmundsson, S., Magnússon, E., Aðal-
geirsdóttir, G., Jóhannesson, T., Berthier, E., Sigurðsson, O., and
Thorsteinsson, T.: Contribution of Icelandic ice caps to sea level
rise: trends and variability since the Little Ice Age, Geophys. Res.
Lett., 40, 1–5, doi:10.1002/grl.50278, 2013.
Bouillon, A., Bernard, M., Gigord, P., Orsoni, A., Rudowski, V., and
Baudoin, A.: SPOT 5 HRS geometric performances: Using block
adjustment as a key issue to improve quality of DEM generation,
ISPRS J. Photogramm., 60, 134–146, 2006.
Bühler, Y., Marty, M., Egli, L., Veitinger, J., Jonas, T., Thee, P.,
and Ginzler, C.: Spatially continuous mapping of snow depth
in high alpine catchments using digital photogrammetry, The
Cryosphere Discuss., 8, 3297–3333, doi:10.5194/tcd-8-3297-
2014, 2014.
Carturan, L., Baroni, C., Becker, M., Bellin, A., Cainelli, O., Carton,
A., Casarotto, C., Dalla Fontana, G., Godio, A., Martinelli, T.,
Salvatore, M. C., and Seppi, R.: Decay of a long-term monitored
glacier: Careser Glacier (Ortles-Cevedale, European Alps), The
Cryosphere, 7, 1819–1838, doi:10.5194/tc-7-1819-2013, 2013.
Cogley, J. G.: Geodetic and direct mass-balance measurements:
comparison and joint analysis, Ann. Glaciol., 50, 96–100, 2009.
Deems, J. S., Painter, T. H., and Finnegan, D. C.: Lidar mea-
surement of snow depth: a review, J. Glaciol., 59, 467–479,
doi:10.3189/2013JoG12J154, 2013.
De Franchis, C., Meinhardt-Llopis, E., Michel, J., Morel, J.-M., and
Facciolo, G.: An automatic and modular stereo pipeline for push-
broom images, ISPRS Ann. Photogramm. Remote Sens. Spa-
tial Inf. Sci., II-3, 49–56, doi:10.5194/isprsannals-II-3-49-2014,
2014.
Finsterwalder, R.: Photogrammetry and glacier research with spe-
cial reference to glacier retreat in the eastern Alps, J. Glaciol., 2,
306–315, 1954.
Gardelle, J., Berthier, E., Arnaud, Y., and Kääb, A.: Region-wide
glacier mass balances over the Pamir-Karakoram-Himalaya dur-
ing 1999–2011, The Cryosphere, 7, 1263–1286, doi:10.5194/tc-
7-1263-2013, 2013.
Gardent, M., Rabatel, A., Dedieu, J.-P., and Deline, P.: Multi-
temporal glacier inventory of the French Alps from the late
1960s to the late 2000s, Global Planet. Change, 120, 24–37,
doi:10.1016/j.gloplacha.2014.05.004, 2014.
Gardner, A., Moholdt, G., Arendt, A., and Wouters, B.: Accelerated
contributions of Canada’s Baffin and Bylot Island glaciers to sea
level rise over the past half century, The Cryosphere, 6, 1103–
1125, doi:10.5194/tc-6-1103-2012, 2012.
Gardner, A. S., Moholdt, G., Cogley, J. G., Wouters, B., Arendt,
A. A., Wahr, J., Berthier, E., Hock, R., Pfeffer, W. T., Kaser,
G., Ligtenberg, S. R. M., Bolch, T., Sharp, M. J., Hagen, J. O.,
Van den Broeke, M. R., and Paul, F.: A Reconciled Estimate of
Glacier Contributions to Sea Level Rise: 2003 to 2009, Science,
340, 852–857, doi:10.1126/science.1234532, 2013.
Gleyzes, A., Perret, L., and Kubik, P.: Pleiades system archi-
tecture and main performances, in: International Archives of
the Photogrammetry, Remote Sensing and Spatial Information
Science, vol. XXXIX-B1, IRPRS, Melbourne, available at: http:
//www.int-arch-photogramm-remote-sens-spatial-inf-sci.net/
XXXIX-B1/537/2012/isprsarchives-XXXIX-B1-537-2012.pdf,
last access: 5 December 2014, 537–542, 2012.
Haemmig, C., Huss, M., Keusen, H., Hess, J., Wegmüller, U., Ao,
Z., and Kulubayi, W.: Hazard assessment of glacial lake outburst
floods from Kyagar glacier, Karakoram mountains, China, Ann.
Glaciol., 55, 34–44, doi:10.3189/2014AoG66A001, 2014.
Helfricht, K., Kuhn, M., Keuschnig, M., and Heilig, A.: Lidar snow
cover studies on glaciers in the Ötztal Alps (Austria): compari-
son with snow depths calculated from GPR measurements, The
Cryosphere, 8, 41–57, doi:10.5194/tc-8-41-2014, 2014.
Höhle, J. and Höhle, M.: Accuracy assessment of digi-
tal elevation models by means of robust statistical meth-
ods, ISPRS J. Photogramm. Remote Sens., 64, 398–406,
doi:10.1016/j.isprsjprs.2009.02.003, 2009.
Huss, M.: Extrapolating glacier mass balance to the mountain-range
scale: the European Alps 1900–2100, The Cryosphere, 6, 713–
727, doi:10.5194/tc-6-713-2012, 2012.
Huss, M.: Density assumptions for converting geodetic glacier
volume change to mass change, The Cryosphere, 7, 877–887,
doi:10.5194/tc-7-877-2013, 2013.
Jóhannesson, T., Björnsson, H., Pálsson, F., Sigurðsson, O., and
Þorsteinsson, Þ.: LiDAR mapping of the Snæfellsjökull ice cap,
western Iceland, Jökull, 61, 19–32, 2011.
Jóhannesson, T., Björnsson, H., Magnússon, E., Guðmundsson, S.,
Pálsson, F., Sigurðsson, O., Thorsteinsson, T., and Berthier, E.:
Ice-volume changes, bias estimation of mass-balance measure-
ments and changes in subglacial lakes derived by lidar mapping
of the surface of Icelandic glaciers, Ann. Glaciol., 54, 63–74,
doi:10.3189/2013AoG63A422, 2013.
Kääb, A., Huggel, C., Fischer, L., Guex, S., Paul, F., Roer, I., Salz-
mann, N., Schlaefli, S., Schmutz, K., Schneider, D., Strozzi, T.,
and Weidmann, Y.: Remote sensing of glacier- and permafrost-
related hazards in high mountains: an overview, Nat. Hazards
Earth Syst. Sci., 5, 527–554, doi:10.5194/nhess-5-527-2005,
2005.
Kääb, A., Berthier, E., Nuth, C., Gardelle, J. and Arnaud, Y.: Con-
trasting patterns of early 21st century glacier mass change in
the Himalaya, Nature, 488, 495–498, doi:10.1038/nature11324,
2012.
Korona, J., Berthier, E., Bernard, M., Remy, F., and Thouvenot, E.:
SPIRIT. SPOT 5 stereoscopic survey of Polar Ice: Reference Im-
ages and Topographies during the fourth International Polar Year
(2007–2009), ISPRS J. Photogramm. Remote Sens., 64, 204–
212, doi:10.1016/j.isprsjprs.2008.10.005, 2009.
Kropácek, J., Neckel, N., and Bauder, A.: Estimation of Mass Bal-
ance of the Grosser Aletschgletscher, Swiss Alps, from ICE-
Sat Laser Altimetry Data and Digital Elevation Models, Remote
Sensing, 6, 5614–5632, doi:10.3390/rs6065614, 2014.
Lebègue, L., Greslou, D., Blanchet, G., De Lussy, F., Fourest, S.,
Martin, V., Latry, C., Kubik, P., Delvit, J.-M., Dechoz, C., and
Amberg, V.: PLEIADES satellites image quality commission-
ing, Proc. SPIE 8866, Earth Observing Systems XVIII, 88660Z
(23 September 2013), doi:10.1117/12.2023288, 2013.
Le Meur, E., Sacchettini, M., Garambois, S., Berthier, E., Drouet,
A. S., Durand, G., Young, D., Greenbaum, J. S., Holt, J. W.,
Blankenship, D. D., Rignot, E., Mouginot, J., Gim, Y., Kirchner,
D., de Fleurian, B., Gagliardini, O., and Gillet-Chaulet, F.: Two
The Cryosphere, 8, 2275–2291, 2014 www.the-cryosphere.net/8/2275/2014/

E. Berthier et al.: Glacier topography and elevation changes derived from Pléiades sub-meter stereo images 2291
independent methods for mapping the grounding line of an outlet
glacier – an example from the Astrolabe Glacier, Terre Adélie,
Antarctica, The Cryosphere, 8, 1331–1346, doi:10.5194/tc-8-
1331-2014, 2014.
Marti, R., Gascoin, S., Houet, T., Laffly, D., and René, P.: Eval-
uation du modèle numérique d’élévation d’une petit glacier de
montagne généré à partir d’images stéréoscopiques Pléiades. cas
du glacier d’Ossoue, Pyrénées françaises, Revue Française de
Photogrammétrie et de Télédétection, 208, 57–62, 2014.
Moratto, Z. M., Broxton, M. J., Beyer, R. A., Lundy, M., and Hus-
mann, K.: Ames Stereo Pipeline, NASA’s Open Source Auto-
mated Stereogrammetry Software, 41st Lunar and Planetary Sci-
ence Conference, 2364, 2010.
Noh, M.-J. and Howat, I. M.: Automated Coregistration of Repeat
Digital Elevation Models for Surface Elevation Change Measure-
ment Using Geometric Constraints, IEEE T. Geosci. Remote, 52,
2247–2260, doi:10.1109/TGRS.2013.2258928, 2014a.
Noh, M.-J. and Howat, I. M.: Automated stereo-photogrammetric
DEM generation at high latitudes: Surface Extraction from TIN-
Based Search Minimization (SETSM) validation and demonstra-
tion, Remote Sens. Environ., submitted, 2014b.
Nuth, C. and Kääb, A.: Co-registration and bias corrections of satel-
lite elevation data sets for quantifying glacier thickness change,
The Cryosphere, 5, 271–290, doi:10.5194/tc-5-271-2011, 2011.
Paul, F., Bolch, T., Kääb, A., Nagler, T., Nuth, C., Scharrer, K.,
Shepherd, A., Strozzi, T., Ticconi, F., Bhambri, R., Berthier,
E., Bevan, S., Gourmelen, N., Heid, T., Jeong, S., Kunz, M.,
Laucknes, T., Luckman, A., Merryman, J., Moholdt, G., Muir,
A., Neelmeijer, J., Rankl, M., VanLooy, J. A., and Van Niel, T.:
The Glaciers Climate Change Initiative: Algorithms for creat-
ing glacier area, elevation change and velocity products, Remote
Sens. Environ., doi:10.1016/j.rse.2013.07.043, in press, 2014.
Poli, D., Remondino, F., Angiuli, E., and Agugiaro, G.:
Radiometric and geometric evaluation of GeoEye-1,
WorldView-2 and Pléiades-1A stereo images for 3D infor-
mation extraction, ISPRS J. Photogramm. Remote Sens.,
doi:10.1016/j.isprsjprs.2014.04.007, in press, 2014.
Rabatel, A., Letréguilly, A., Dedieu, J.-P., and Eckert, N.: Changes
in glacier equilibrium-line altitude in the western Alps from
1984 to 2010: evaluation by remote sensing and modeling of
the morpho-topographic and climate controls, The Cryosphere,
7, 1455–1471, doi:10.5194/tc-7-1455-2013, 2013.
Raup, B. H., Kieffer, H. H., Hare, T. M., and Kargel, J. S.: Gener-
ation of data acquisition requests for the ASTER satellite instru-
ment for monitoring a globally distributed target: Glaciers, IEEE
T. Geosci. Remote, 38, 1105–1112, 2000.
Rodriguez, E., Morris, C. S., and Belz, J. E.: A global assessment
of the SRTM performance, Photogramm. Eng. Remote Sens., 72,
249–260, 2006.
Sirguey, P. and Cullen, N.: A very high resolution DEM of Kil-
imanjaro via photogrammetry of GeoEye-1 images (KILISoS-
DEM2012), Survey Quart., 303, 19–25, 2014.
Soruco, A., Vincent, C., Francou, B., and Gonzalez, J. F.: Glacier
decline between 1963 and 2006 in the Cordillera Real, Bolivia,
Geophys. Res. Lett., 36, L03502, doi:10.1029/2008GL036238,
2009a.
Soruco, A., Vincent, C., Francou, B., Ribstein, P., Berger, T., Sicart,
J. E., Wagnon, P., Arnaud, Y., Favier, V., and Lejeune, Y.: Mass
balance of Glaciar Zongo, Bolivia, between 1956 and 2006,
using glaciological, hydrological and geodetic methods, Ann.
Glaciol., 50, 1–8, 2009b.
Stumpf, A., Malet, J.-P., Allemand, P., and Ulrich, P.: Surface recon-
struction and landslide displacement measurements with Pléi-
ades satellite images, ISPRS J. Photogramm. Remote Sens., 95,
1–12, doi:10.1016/j.isprsjprs.2014.05.008, 2014.
Thibert, E., Blanc, R., Vincent, C., and Eckert, N.: Glaciological
and volumetric mass-balance measurements: error analysis over
51 years for Glacier de Sarennes, French Alps, J. Glaciol., 54,
522–532, 2008.
Toutin, T.: Three-dimensional topographic mapping with ASTER
stereo data in rugged topography, IEEE T. Geosci. Remote, 40,
2241–2247, doi:10.1109/TGRS.2002.802878, 2002.
Toutin, T.: ASTER DEMs for geomatic and geoscientific ap-
plications: a review, Int. J. Remote Sens., 29, 1855–1875,
doi:10.1080/01431160701408477, 2008.
Vaughan, D. G., Comiso, J. C., Allison, I., Carrasco, J., Kaser,
G., Kwok, R., Mote, P., Murray, T., Paul, F., Ren, J., Rig-
not, E., Solomina, O., Steffen, K., and Zhang, T.: Observations:
Cryosphere, in: Climate Change 2013: The Physical Science Ba-
sis, Contribution of Working Group I to the Fifth Assessment Re-
port of the Intergovernmental Panel on Climate Change, edited
by: Stocker, T. F., Qin, D., Plattner, G.-K., Tignor, M., Allen,
S. K., Boschung, J., Nauels, A., Xia, Y., Bex, V., and Midgley, P.
M., Cambridge University Press, Cambridge, UK and New York,
NY, USA, 317–382, 2013.
Vincent, C., Soruco, A., Six, D., and Le Meur, E.: Glacier
thickening and decay analysis from 50 years of glacio-
logical observations performed on Glacier d’Argentière,
Mont Blanc area, France, Ann. Glaciol., 50, 73–79,
doi:10.3189/172756409787769500, 2009.
Vincent, C., Harter, M., Gilbert, A., Berthier, E., and Six, D.: Future
fluctuations of the Mer de Glace (French Alps) assessed using
a parameterized model calibrated with past thickness changes,
Ann. Glaciol., 55, 15–24, doi:10.3189/2014AoG66A050, 2014.
Wagnon, P., Vincent, C., Arnaud, Y., Berthier, E., Vuillermoz, E.,
Gruber, S., Ménégoz, M., Gilbert, A., Dumont, M., Shea, J.
M., Stumm, D., and Pokhrel, B. K.: Seasonal and annual mass
balances of Mera and Pokalde glaciers (Nepal Himalaya) since
2007, The Cryosphere, 7, 1769–1786, doi:10.5194/tc-7-1769-
2013, 2013.
Zemp, M., Thibert, E., Huss, M., Stumm, D., Rolstad Denby, C.,
Nuth, C., Nussbaumer, S. U., Moholdt, G., Mercer, A., Mayer,
C., Joerg, P. C., Jansson, P., Hynek, B., Fischer, A., Escher-Vetter,
H., Elvehøy, H., and Andreassen, L. M.: Reanalysing glacier
mass balance measurement series, The Cryosphere, 7, 1227–
1245, doi:10.5194/tc-7-1227-2013, 2013.
www.the-cryosphere.net/8/2275/2014/ The Cryosphere, 8, 2275–2291, 2014