Embed Size (px)
Citation preview

1Gladstone Regional Council Long Term Financial Plan
Long Term Financial Plan
Gladstone Regional Council
Revision No. 9 07/2017
2Gladstone Regional Council Long Term Financial Plan
ValuesWe value respect - for our community, for the environment and for each other.
MissionOur mission is to do the everyday things well, every day.
PurposeOur purpose is to improve our community.
Our community’s needs are met.
Our natural and built environment is preserved and enhanced to the benefit of our current generation, without disadvantaging the next.
Our people enjoy a sense of both purpose and accomplishment each working day.
Our vision is to be the best local government in Queensland.
Vision
We are Gladstone Regional Council.
Our Charter
We are successful when
3Gladstone Regional Council Long Term Financial Plan
Table of Contents
Overarching Vision and Direction 4Rates and Charges 4Sustainability Indicators 4Operating Position 4Asset Management 4Capital Investment 5Cash Investments 5Debt 5Our Long Term Financial Outlook 6Major Infrastructure and Service Delivery Area Capital Expenditure 7Key Operating Forecast Drivers 10Expense Assumptions 11Other Assumptions 11Debt Analysis 11Financial Sustainability Ratios 11Summary 12
Appendices Appendix 1 Income Statement for the Forecast Period 16Appendix 2 Balance Sheet for the Forecast Period 21Appendix 3 Cash Flow Statement for the Forecast Period 25Appendix 4 Key Financial Sustainability Metrics 28
4Gladstone Regional Council Long Term Financial Plan
Overarching Vision and Directions
Financial management within Gladstone Regional Council supports the delivery of objectives identified within Council’s Community Plan and ensures that financial resources are allocated according to the annual priorities set by Council for achieving that vision within the parameters determined through the long-term financial planning process.
The long term financial plan is an integral part of the local government planning framework depicted below:
The plan is informed by not only the Gladstone Regional Community Plan and the Gladstone Regional Council Corporate Plan 2017-2021, but also the latest information available at the time of preparation of the long term financial plan with respect to:
• Master planning documents, inclusive of the Gladstone Region Social Infrastructure Strategic Plan and Sport and Recreation Plan;
• Infrastructure schedules (Local Government Infrastructure Plans) included within the Gladstone Regional Planning Scheme;
• Latest population growth estimates from relevant sources;
• Most recent estimates of development activity; • Asset Management Plans for the various classes of
Assets.
All financial decisions are made in the context of long term financial sustainability with funding decisions having due regard to intergenerational equity, so that those who enjoy the benefits of assets and services provided by Council contribute to the funding of those same assets and services.
Conversely, assets and services that are consumed in the short term do not place a financial burden on future generations.
Financial decisions are guided by corporate policies, strategies and principles of effective financial management.
Rates and Charges
Council applies the principles of equity, effectiveness and efficiency, simplicity and sustainability.
Council aims to raise sufficient revenue to:
• Ensure a balanced budget and provide a strong financial basis for effective management of expenditure programmes and debt;
• Provide sustainable services to the community based on principles of intergenerational equity and deemed capacity to pay for Council services;
• Sustain operating capability on a long-term basis;• Encourage a strong, growing and sustainable local
economy with appropriate levels of infrastructure assets and facilities; and,
• Provide certainty of funding for the provision of infrastructure and services identified by Council in its long-term strategic financial plans.
Sustainability Indicators
Council uses the financial sustainability indicators mandated in the Local Government Act 2009 and Local Government Regulation 2012, plus other measures to assist in monitoring financial sustainability.
As is the case with all forecasts, circumstances change, and these sometimes impact on the financial forecast and can negatively impact the sustainability ratios. When this occurs, Council will develop strategies to bring the forecast back to a sustainable outlook in the long term.
Operating Position
The net operating position (operating revenue less operating expenses) indicates the extent to which Council is raising sufficient operating revenue to cover operating expenses. Council aims to achieve a positive operating position in each financial year of the long-term financial forecast as an indication that expenditure is being managed within the available revenue projections.
Council must make all endeavours to ensure a balanced budget is adopted each financial year, and seeks to achieve reliable and ongoing revenue sources to fund recurrent operating expenditure. One-off revenue sources should not be used to commit to new recurrent expenditure. This approach promotes financial sustainability by ensuring that new ongoing (recurrent) expenditure commitments have a reliable revenue source, not only in the current budget year, but for future years.
Asset Management
Council continues to place a high importance on ensuring the standard of assets in the region remains high; to this end asset management plans have been developed for the seven classes of assets under Council’s control:
• Roads (including bridges and footpaths)• Water• Sewerage• Stormwater• Parks• Waste• Buildings
5Gladstone Regional Council Long Term Financial Plan
Both the Local Government Act 2009 and Local Government Regulation 2012 require local governments to place an even greater focus on asset management with the development of more comprehensive asset management plans and the integration of these plans with the long term planning process.
The intention of this increased focus is to ensure an appropriate amount of the annual budget is dedicated to operating, maintaining and renewing assets, thus supporting service standards in the region. An improved asset management framework will deliver better financial data for financial planning and thus further promote financial sustainability.
It is recognised that this is an evolutionary process and that as Council’s asset management systems and data analysis continue to mature, so will the outputs from these plans that feed into the Long Term Financial Plan.
Capital Investment
Council invests a significant amount of the annual Council invests a significant amount of the annual budget into community and infrastructure assets to enable the delivery of services to the region’s residents and visitors.
Financial management necessarily requires balancing the level of rates burden on property owners with the demand for assets and services within the region.
This requires planning for ‘whole of life’ costs for new assets including operating, maintenance, renewal and financing costs. The long term financial forecast seeks to capture these costs to avoid underestimating the true cost of constructing or acquiring a new asset.
In order to minimise the impact on ratepayers through user charges and general rates, and also to ensure that borrowings are minimised, Council has set a long term benchmark when assessing and reviewing its capital works programme that the total Capital Works Programme is not to exceed annual depreciation and external funding sources such as capital grants, subsides and contributions.
Cash Investments
A significant proportion of Council’s revenue is received once a year in conjunction with the annual rates levy. This causes a spike in Council’s cash held after each rating period, with the cash to be used for budgeted purposes through to the next rating period.
This cash flow profile requires prudent cash management processes to ensure funds are invested to maximise returns within the bounds of Council’s conservative risk profile and also to ensure sufficient cash is on hand when required to meet obligations to employees and suppliers.
A number of internal policies, controls and procedures are maintained to ensure the integrity of Council’s funds. Council’s policies are guided by the Statutory Bodies Financial Arrangements Act, which sets the bounds for acceptable investments.
The management of the portfolio may be described as active; this relates mainly to the general positioning of the investment portfolio (short vs long dated maturities) by taking a view on the interest rate outlook. Once investments are made, Council holds those investments to maturity.
Council’s Investment Policy is reviewed annually to ensure that it is structured appropriately to strike the balance between maximising returns and protecting Council’s investment portfolio.
Debt
Debt is only used for capital purposes. The term of the debt is matched, as best as possible, to the life of the asset up to the maximum term imposed by Queensland Treasury Corporation (QTC). Borrowings usually have terms of nine, 12 or 15 years. Occasionally, for major capital projects, debt will be borrowed over the maximum term of 20 years.
The level of borrowings drawn each financial year is carefully monitored through long-term financial modelling to ensure affordability. A number of financial measures are utilised to assess sustainability, including those mandated by legislation. In addition to internal assessments, Council is required to submit an annual application to the State Government, which includes the long-term financial forecast, to gain approval for all planned borrowings.
QTC periodically undertakes a detailed credit assessment of Gladstone Regional Council. Such a credit review was conducted in January 2016, and Council was awarded a ‘moderate’ financial rating based on Council’s adopted budget and forward planning at that time. It is the intention of Council to continue these regular QTC assessments.
The external debt assessments focus on the macro view of Council’s ability to repay debt.
However, Council manages debt at a more detailed funding level internally, further ensuring the financial sustainability of borrowing decisions. Council seeks to minimise general rates as a funding source to repay debt, preferring to rely on specific revenue sources (water charges, sewerage charges, etc) that are matched to the infrastructure being constructed.
This ensures that Council is in a position to fund critical assets in areas that do not have a separate revenue source.
6Gladstone Regional Council Long Term Financial Plan
Our Long term Financial Outlook
Council regularly models financial performance, financial position and cash flow forecasts to monitor the long term sustainability of financial decisions. Projected financial statements for the ten year period through to 30 June 2027 are included in Appendices 1, 2 and 3 to the plan.
The long term financial forecast is set amidst the competing backdrop of the completion of capital works required to keep pace with recent industrial growth, while also recognising that economic activity has slowed in recent times and this is placing pressure on different sectors within our community, and the capacity to pay of those sectors from a rating and user charges perspective will need to be closing monitored.
Ongoing capital revenue constraints as a result of a series of State Government decisions over several years have seen the removal of the 40 per cent capital grants and subsidies, as well as the capping of infrastructure charges for new development, causing the capital works programme to be reviewed significantly, to take into account these constraints.
The long term financial forecast continues to apply the following operational principles:
• The finalisation of the implementation of price paths for utility charges. To this end the long term financial plan is based on the price paths in the respective utility schemes that aim to achieve a postage stamp price for those services across the region. Water Charges are currently at the postage stamp price, whilst Sewerage Charges are scheduled to achieve cost reflective postage stamp price in 2018/19.
• Level of fees and charges associated with building, plumbing and development activities that achieves cost recovery; and,
• Continual review of operations to ensure that the operating position is optimised by one or more of the following means:
• Reducing costs through operational savings or reduced service delivery;
• Ensuring that overheads are appropriately recovered;
• Increasing charges; and/or • The restructuring of operations which may involve
the divestment of activities or involvement of the private sector
Some of the key challenges to be managed by Council include:
• Asset Management
Council’s infrastructure is relatively young and is in good condition.
Despite this, preparation of future budgets will need to take a planned approach to funding the ongoing maintenance and renewal of infrastructure assets to ensure long term sustainability of Council services.
To support this, Council is in the process of further advancing the Asset Management Plans for infrastructure assets in order to provide a better picture of the costs and risks associated with current levels of service for asset based services.
The long term financial plan is based on current service levels for the respective asset classes and as these service levels are continued to be reviewed (either to an increased level or to a reduced level) there will be impacts on the Council’s Long Term Financial Plan.
• Community Facilities and Infrastructure Program
Council has a significant plan to improve the standard of community infrastructure in the region through the Gladstone Region Social Infrastructure Strategic Plan, as well as the Council’s Park and Recreation Facilities Strategic Plan.
These plans identify the strategic needs for the Gladstone Region in these areas and include swimming pools, community and regional entertainment centres, youth facilities, social services precincts and libraries.
Although funds have been set aside for this purpose and works are continuing, more funding is required to complete the full 10 year capital plan and the associated operating and maintenance costs that result from new infrastructure.
Funding sources to complete the full program will need to be considered as part of future financial planning.
• Infrastructure Charges
Infrastructure charges are raised from developers to help meet the cost of new infrastructure that Council must provide due to the growth of the region. The State Government cap on infrastructure charges and a change in the timing of Council collection of the charges from developers came into effect in July 2011. The impact of these charges will be realised across all facets of Council’s business with the following impacts recognised in the financial plan:• The service level of infrastructure included in
priority infrastructure plans to be continually revised for optimal solutions that are cost effective in the long term;
• Increased service charges for utilities such as water and sewerage; and
• Reduced developer charges based on current infrastructure charge cap available as a means of funding trunk infrastructure.
7Gladstone Regional Council Long Term Financial Plan
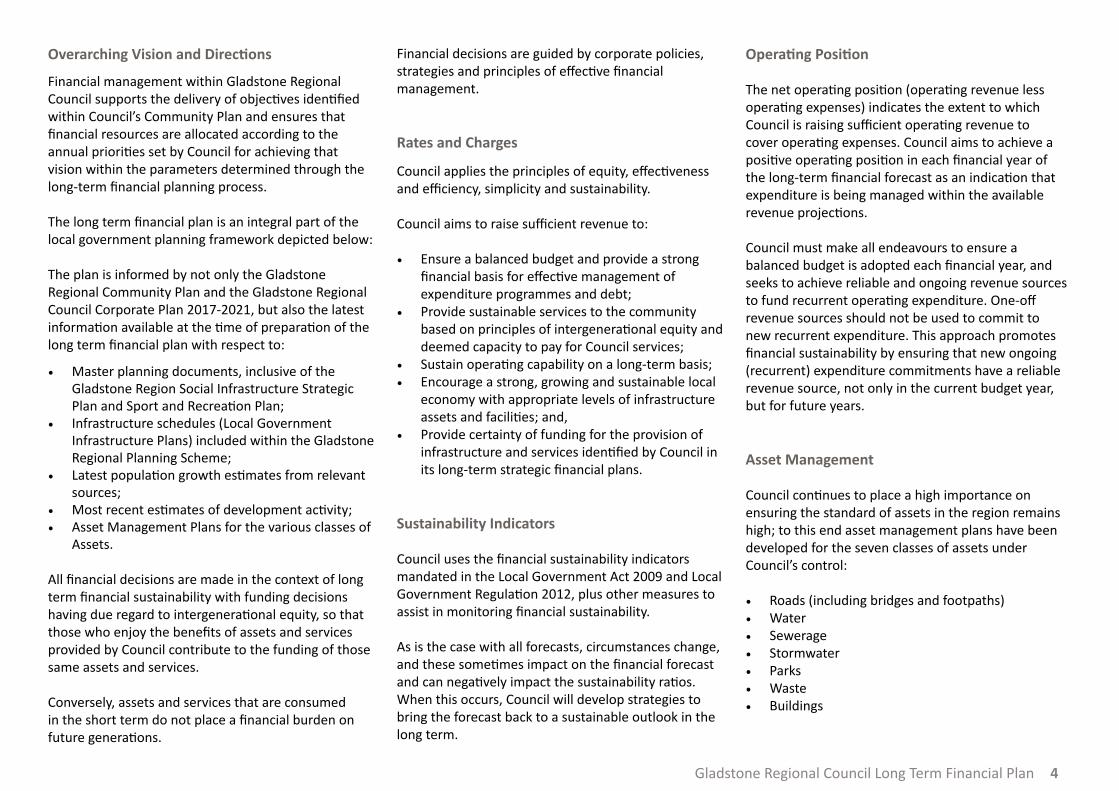
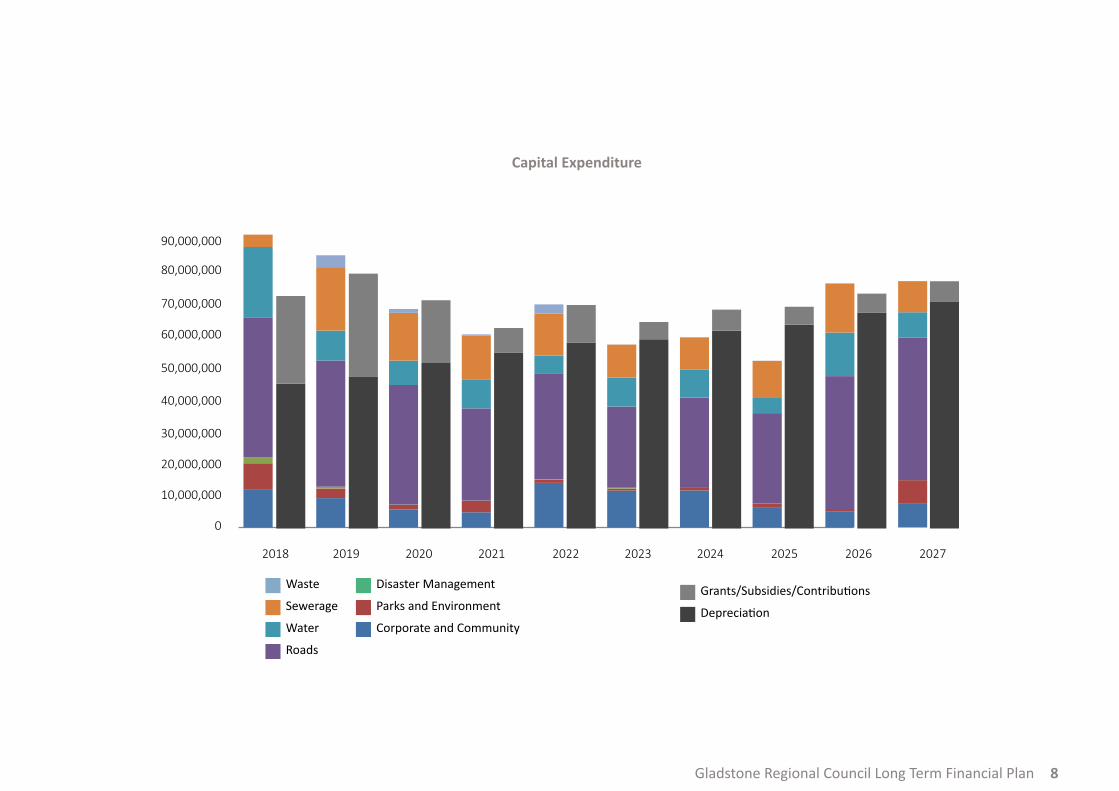
Major Infrastructure and Service Delivery Area Capital Expenditure
As part of the long term financial planning undertaken, 10 year financial plans are maintained for major service areas, which enable planning at a more detailed level for the delivery of major infrastructure and services to the community.
These plans, which represent the majority of the total capital spend in the financial forecast period, are at varying levels of maturity for the various asset classes and are reviewed at least annually when incorporated into the corporate financial forecast.
As planning and asset management systems become more informed, these figures are expected to change at each revision due to trigger points for various projects being met, which may lend itself to more certainty with respect to both expected expenditure and associated timing.
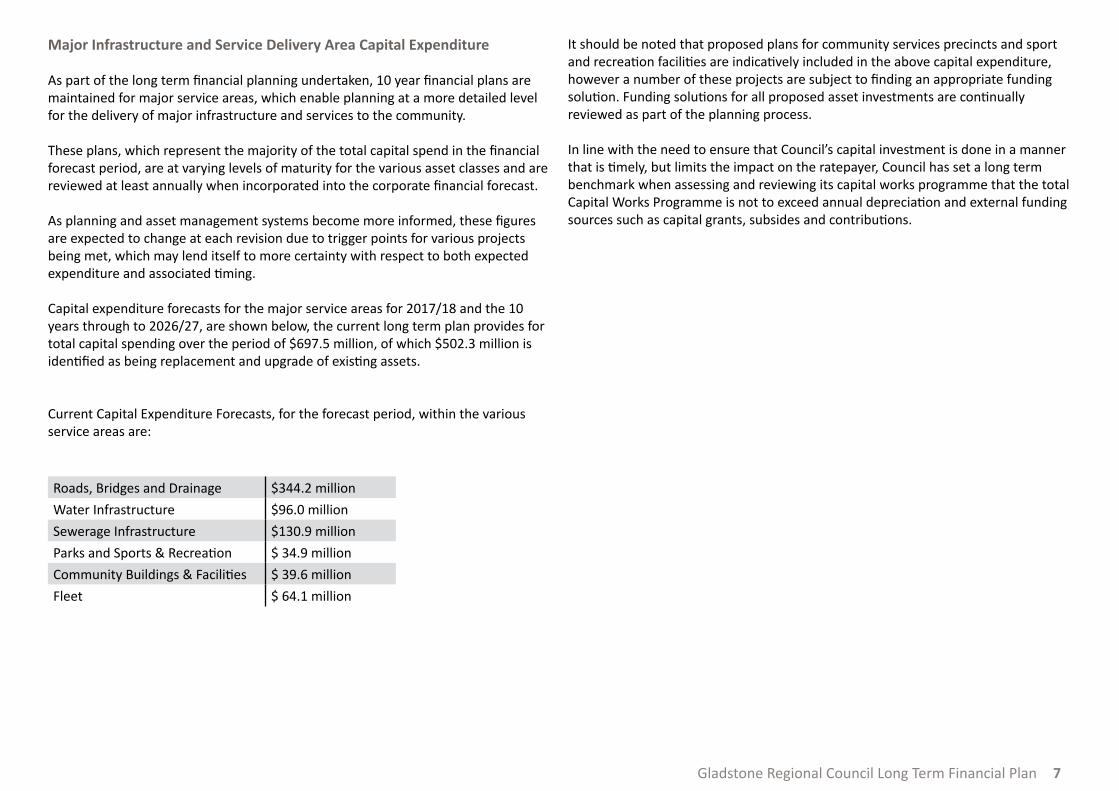
Capital expenditure forecasts for the major service areas for 2017/18 and the 10 years through to 2026/27, are shown below, the current long term plan provides for total capital spending over the period of $697.5 million, of which $502.3 million is identified as being replacement and upgrade of existing assets.
Current Capital Expenditure Forecasts, for the forecast period, within the various service areas are:
Roads, Bridges and Drainage $344.2 million
Water Infrastructure $96.0 million
Sewerage Infrastructure $130.9 million
Parks and Sports & Recreation $ 34.9 million
Community Buildings & Facilities $ 39.6 million
Fleet $ 64.1 million
It should be noted that proposed plans for community services precincts and sport and recreation facilities are indicatively included in the above capital expenditure, however a number of these projects are subject to finding an appropriate funding solution. Funding solutions for all proposed asset investments are continually reviewed as part of the planning process.
In line with the need to ensure that Council’s capital investment is done in a manner that is timely, but limits the impact on the ratepayer, Council has set a long term benchmark when assessing and reviewing its capital works programme that the total Capital Works Programme is not to exceed annual depreciation and external funding sources such as capital grants, subsides and contributions.
8Gladstone Regional Council Long Term Financial Plan
2018 2019 2020 2021 2022 2023 2024 2025 2026
40,000,000
50,000,000
60,000,000
70,000,000
80,000,000
90,000,000
Waste
Sewerage
Water
Roads
Disaster Management
Parks and Environment
Corporate and Community
Grants/Subsidies/Contributions
Depreciation
30,000,000
20,000,000
10,000,000
0
2027
Capital Expenditure
9Gladstone Regional Council Long Term Financial Plan
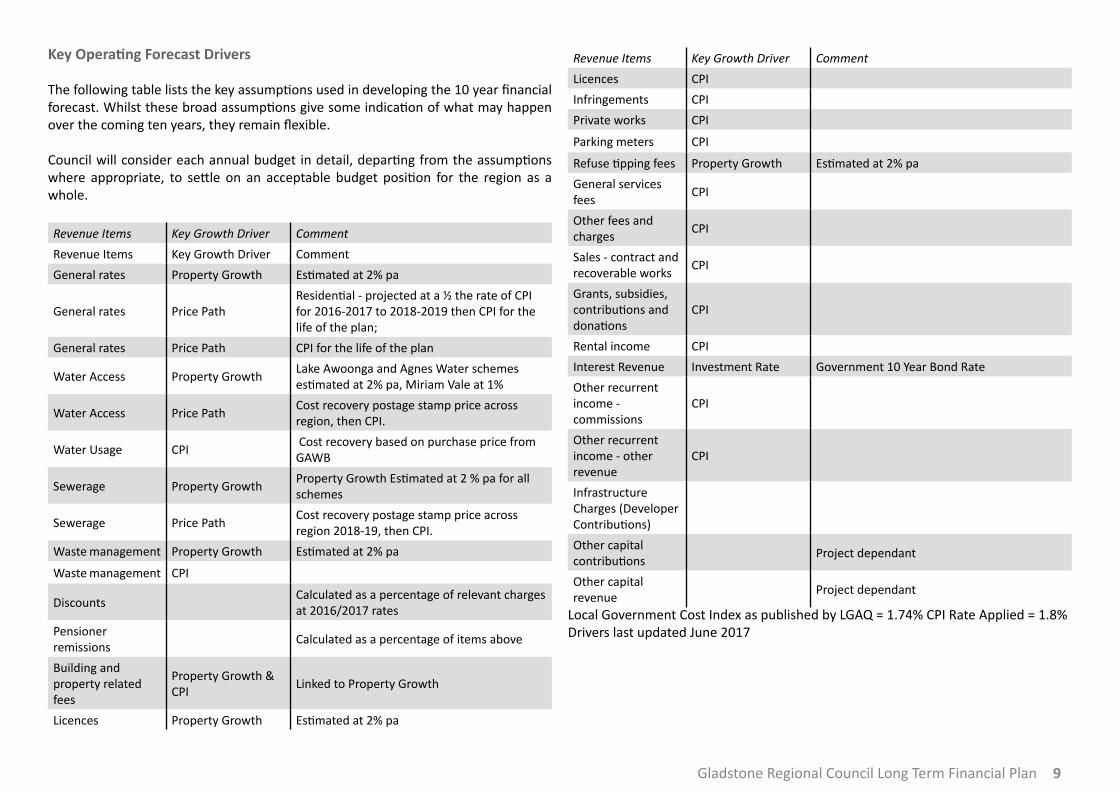
Key Operating Forecast Drivers
The following table lists the key assumptions used in developing the 10 year financial forecast. Whilst these broad assumptions give some indication of what may happen over the coming ten years, they remain flexible.
Council will consider each annual budget in detail, departing from the assumptions where appropriate, to settle on an acceptable budget position for the region as a whole.
Revenue Items Key Growth Driver Comment
Revenue Items Key Growth Driver Comment
General rates Property Growth Estimated at 2% pa
General rates Price PathResidential - projected at a ½ the rate of CPI for 2016-2017 to 2018-2019 then CPI for the life of the plan;
General rates Price Path CPI for the life of the plan
Water Access Property GrowthLake Awoonga and Agnes Water schemes estimated at 2% pa, Miriam Vale at 1%
Water Access Price PathCost recovery postage stamp price across region, then CPI.
Water Usage CPI Cost recovery based on purchase price from GAWB
Sewerage Property GrowthProperty Growth Estimated at 2 % pa for all schemes
Sewerage Price PathCost recovery postage stamp price across region 2018-19, then CPI.
Waste management Property Growth Estimated at 2% pa
Waste management CPI
Discounts Calculated as a percentage of relevant charges at 2016/2017 rates
Pensioner remissions
Calculated as a percentage of items above
Building and property related fees
Property Growth & CPI
Linked to Property Growth
Licences Property Growth Estimated at 2% pa
Revenue Items Key Growth Driver Comment
Licences CPI
Infringements CPI
Private works CPI
Parking meters CPI
Refuse tipping fees Property Growth Estimated at 2% pa
General services fees
CPI
Other fees and charges
CPI
Sales - contract and recoverable works
CPI
Grants, subsidies, contributions and donations
CPI
Rental income CPI
Interest Revenue Investment Rate Government 10 Year Bond Rate
Other recurrent income - commissions
CPI
Other recurrent income - other revenue
CPI
Infrastructure Charges (Developer Contributions)
Other capital contributions
Project dependant
Other capital revenue
Project dependant
Local Government Cost Index as published by LGAQ = 1.74% CPI Rate Applied = 1.8% Drivers last updated June 2017
10Gladstone Regional Council Long Term Financial Plan
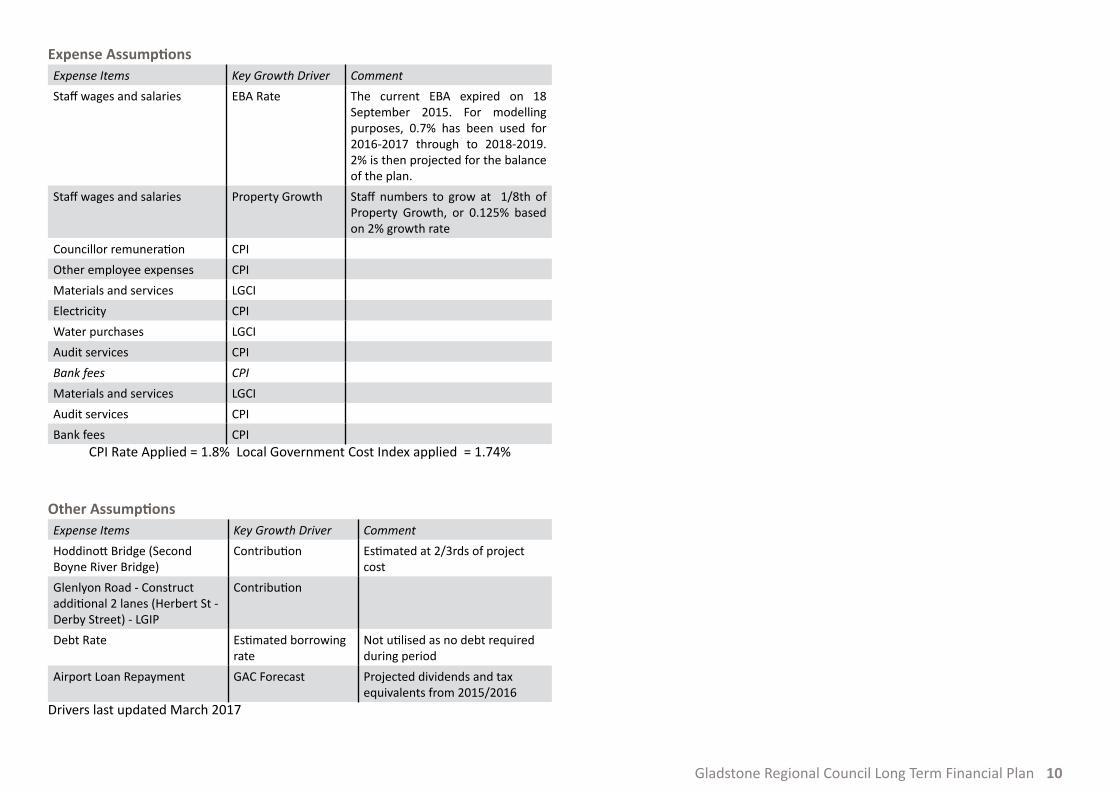
Expense AssumptionsExpense Items Key Growth Driver Comment
Staff wages and salaries EBA Rate The current EBA expired on 18 September 2015. For modelling purposes, 0.7% has been used for 2016-2017 through to 2018-2019. 2% is then projected for the balance of the plan.
Staff wages and salaries Property Growth Staff numbers to grow at 1/8th of Property Growth, or 0.125% based on 2% growth rate
Councillor remuneration CPI
Other employee expenses CPI
Materials and services LGCI
Electricity CPI
Water purchases LGCI
Audit services CPI
Bank fees CPI
Materials and services LGCI
Audit services CPI
Bank fees CPI CPI Rate Applied = 1.8% Local Government Cost Index applied = 1.74%
Other AssumptionsExpense Items Key Growth Driver Comment
Hoddinott Bridge (Second Boyne River Bridge)
Contribution Estimated at 2/3rds of project cost
Glenlyon Road - Construct additional 2 lanes (Herbert St - Derby Street) - LGIP
Contribution
Debt Rate Estimated borrowing rate
Not utilised as no debt required during period
Airport Loan Repayment GAC Forecast Projected dividends and tax equivalents from 2015/2016
Drivers last updated March 2017
11Gladstone Regional Council Long Term Financial Plan
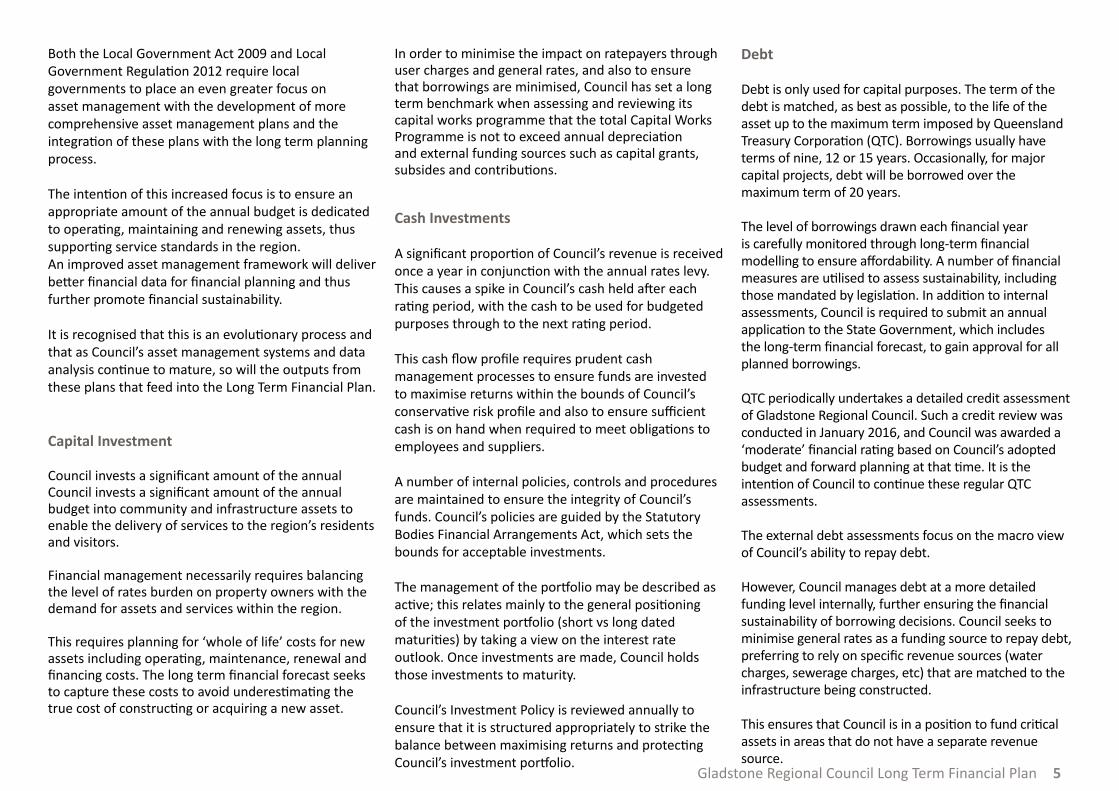
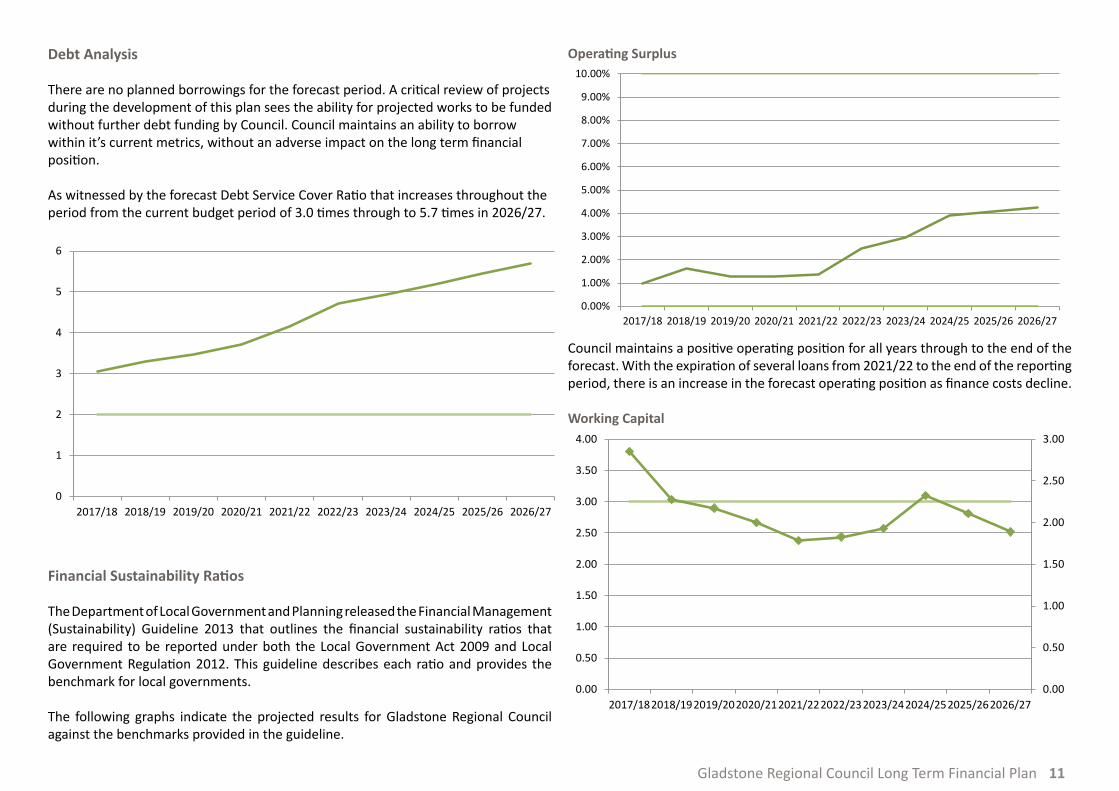
Debt Analysis
There are no planned borrowings for the forecast period. A critical review of projects during the development of this plan sees the ability for projected works to be funded without further debt funding by Council. Council maintains an ability to borrow within it’s current metrics, without an adverse impact on the long term financial position.
As witnessed by the forecast Debt Service Cover Ratio that increases throughout the period from the current budget period of 3.0 times through to 5.7 times in 2026/27.
0
1
2
3
4
5
6
2017/18 2018/19 2019/20 2020/21 2021/22 2022/23 2023/24 2024/25 2025/26 2026/27
Financial Sustainability Ratios
The Department of Local Government and Planning released the Financial Management (Sustainability) Guideline 2013 that outlines the financial sustainability ratios that are required to be reported under both the Local Government Act 2009 and Local Government Regulation 2012. This guideline describes each ratio and provides the benchmark for local governments.
The following graphs indicate the projected results for Gladstone Regional Council against the benchmarks provided in the guideline.
Operating Surplus
0.00%
1.00%
2.00%
3.00%
4.00%
5.00%
6.00%
7.00%
8.00%
9.00%
10.00%
2017/18 2018/19 2019/20 2020/21 2021/22 2022/23 2023/24 2024/25 2025/26 2026/27
Council maintains a positive operating position for all years through to the end of the forecast. With the expiration of several loans from 2021/22 to the end of the reporting period, there is an increase in the forecast operating position as finance costs decline.
Working Capital
0.00
0.50
1.00
1.50
2.00
2.50
3.00
0.00
0.50
1.00
1.50
2.00
2.50
3.00
3.50
4.00
2017/182018/192019/202020/212021/222022/232023/242024/252025/262026/27
12Gladstone Regional Council Long Term Financial Plan
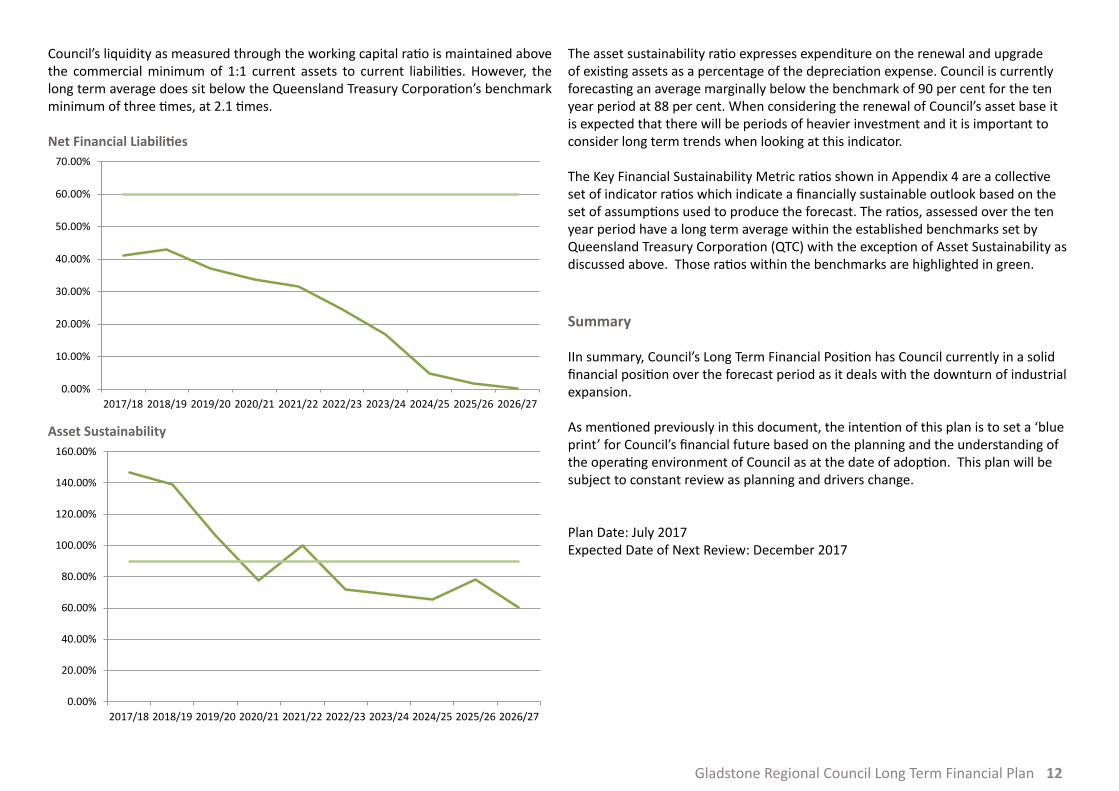
Council’s liquidity as measured through the working capital ratio is maintained above the commercial minimum of 1:1 current assets to current liabilities. However, the long term average does sit below the Queensland Treasury Corporation’s benchmark minimum of three times, at 2.1 times.
Net Financial Liabilities
0.00%
10.00%
20.00%
30.00%
40.00%
50.00%
60.00%
70.00%
2017/18 2018/19 2019/20 2020/21 2021/22 2022/23 2023/24 2024/25 2025/26 2026/27
Asset Sustainability
0.00%
20.00%
40.00%
60.00%
80.00%
100.00%
120.00%
140.00%
160.00%
2017/18 2018/19 2019/20 2020/21 2021/22 2022/23 2023/24 2024/25 2025/26 2026/27
The asset sustainability ratio expresses expenditure on the renewal and upgrade of existing assets as a percentage of the depreciation expense. Council is currently forecasting an average marginally below the benchmark of 90 per cent for the ten year period at 88 per cent. When considering the renewal of Council’s asset base it is expected that there will be periods of heavier investment and it is important to consider long term trends when looking at this indicator.
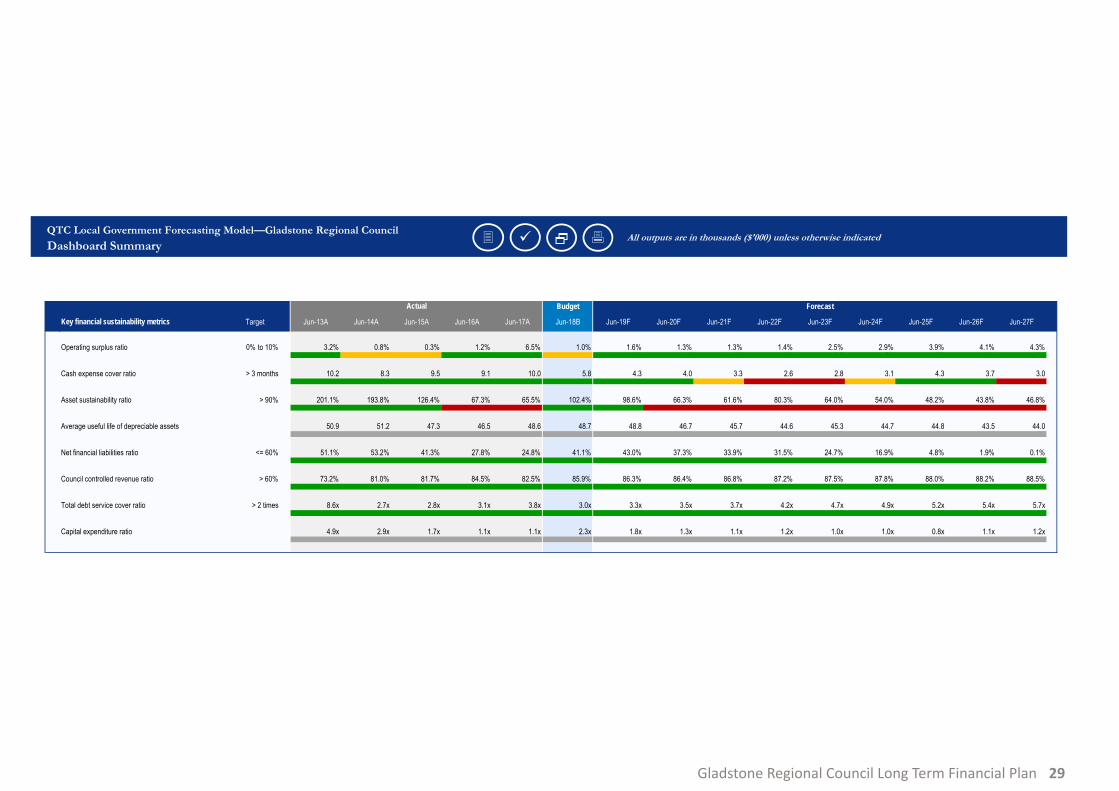
The Key Financial Sustainability Metric ratios shown in Appendix 4 are a collective set of indicator ratios which indicate a financially sustainable outlook based on the set of assumptions used to produce the forecast. The ratios, assessed over the ten year period have a long term average within the established benchmarks set by Queensland Treasury Corporation (QTC) with the exception of Asset Sustainability as discussed above. Those ratios within the benchmarks are highlighted in green.
Summary
IIn summary, Council’s Long Term Financial Position has Council currently in a solid financial position over the forecast period as it deals with the downturn of industrial expansion.
As mentioned previously in this document, the intention of this plan is to set a ‘blue print’ for Council’s financial future based on the planning and the understanding of the operating environment of Council as at the date of adoption. This plan will be subject to constant review as planning and drivers change.
Plan Date: July 2017Expected Date of Next Review: December 2017

13Gladstone Regional Council Long Term Financial Plan
14Gladstone Regional Council Long Term Financial Plan
Appendices
Appendix 1 – Income Statement for the forecast period
Appendix 2 – Balance Sheet for the forecast period
Appendix 3 – Cash Flow Statement for the forecast period
Appendix 4 - Key Financial Sustainability Metrics
List of Appendices
16Gladstone Regional Council Long Term Financial Plan
Appendix 1Income Statement for the Forecast Period
17Gladstone Regional Council Long Term Financial Plan
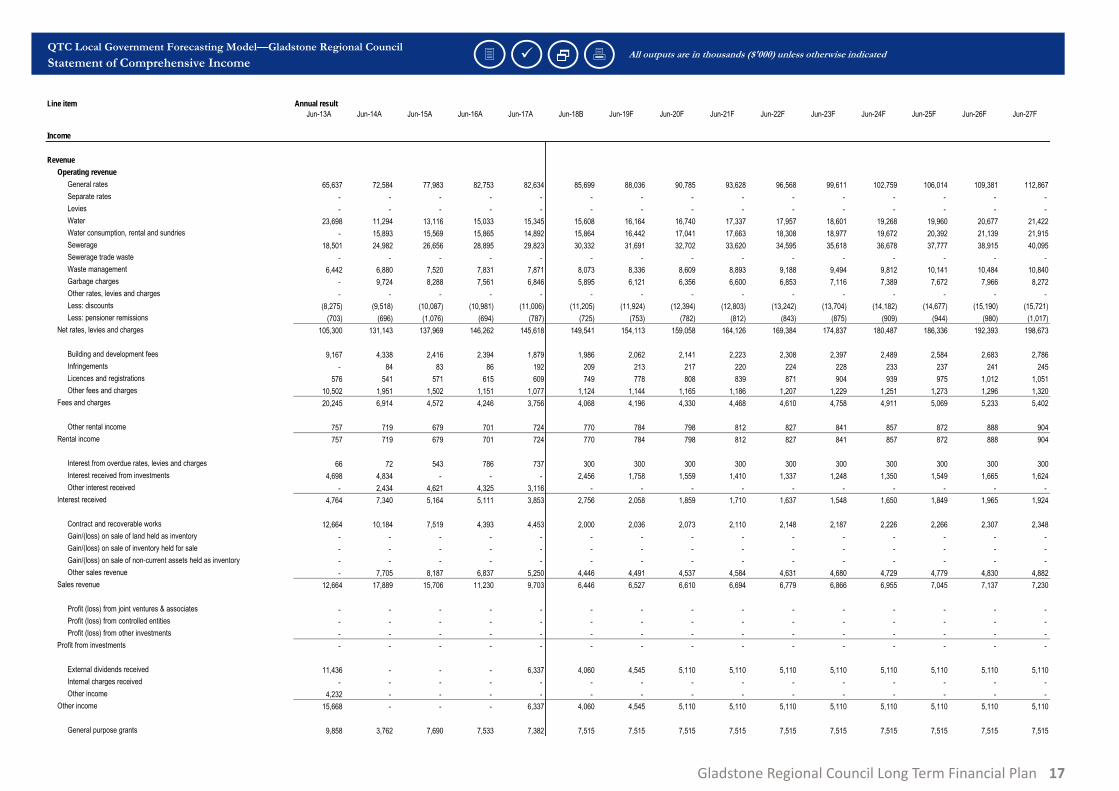
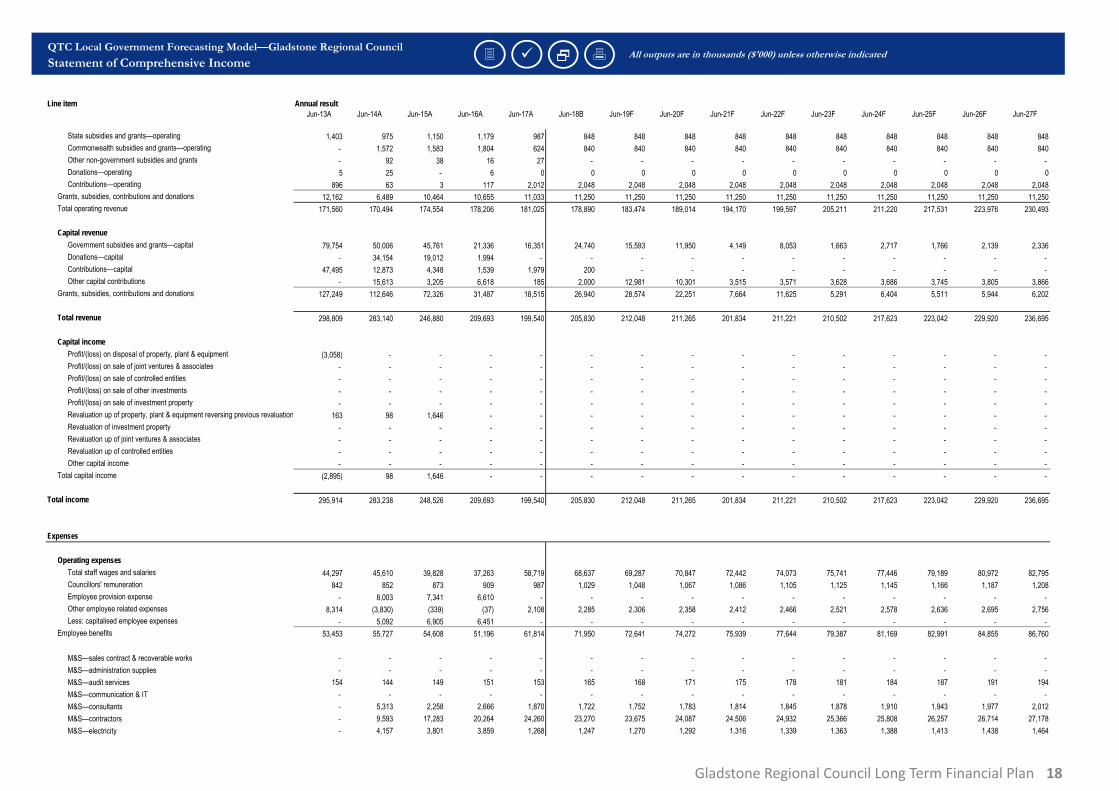
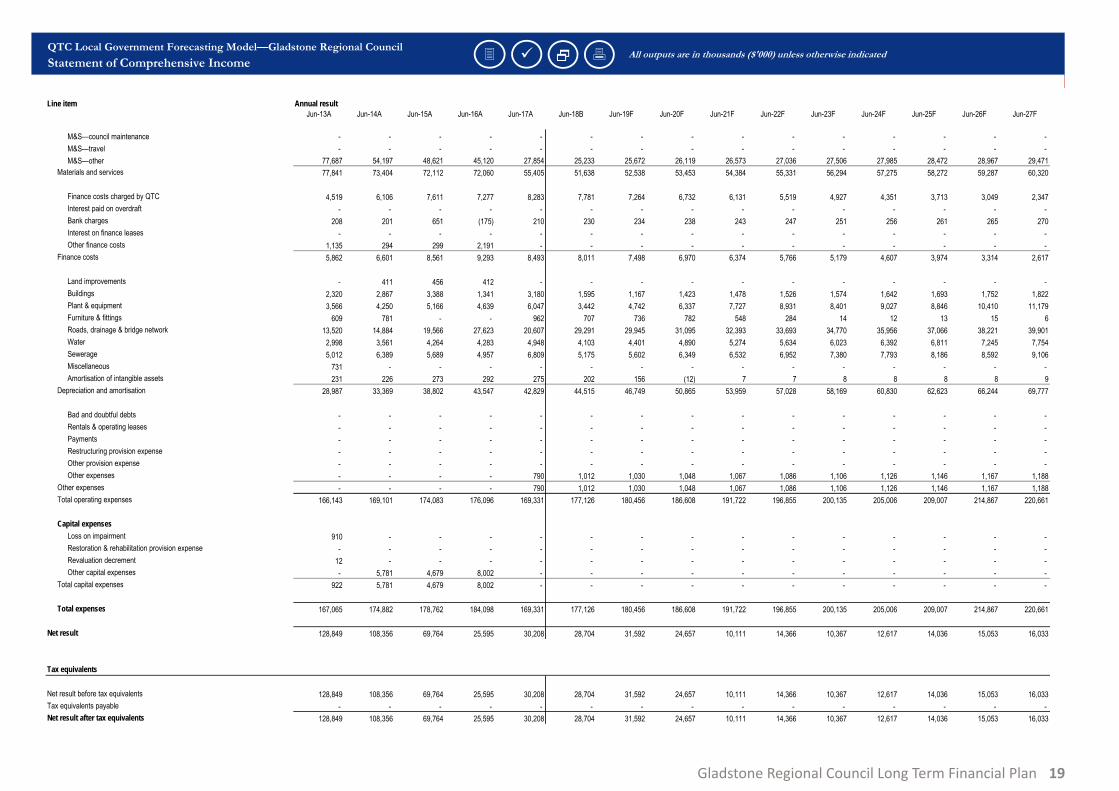
QTC Local Government Forecasting Model—Gladstone Regional CouncilStatement of Comprehensive Income
Line item Annual resultJun-13A Jun-14A Jun-15A Jun-16A Jun-17A Jun-18B Jun-19F Jun-20F Jun-21F Jun-22F Jun-23F Jun-24F Jun-25F Jun-26F Jun-27F
1 error identified—Whole of Council active
All outputs are in thousands ($'000) unless otherwise indicated
Income
RevenueOperating revenue
General rates 65,637 72,584 77,983 82,753 82,634 85,699 88,036 90,785 93,628 96,568 99,611 102,759 106,014 109,381 112,867Separate rates - - - - - - - - - - - - - - - Levies - - - - - - - - - - - - - - - Water 23,698 11,294 13,116 15,033 15,345 15,608 16,164 16,740 17,337 17,957 18,601 19,268 19,960 20,677 21,422Water consumption, rental and sundries - 15,893 15,569 15,865 14,892 15,864 16,442 17,041 17,663 18,308 18,977 19,672 20,392 21,139 21,915Sewerage 18,501 24,982 26,656 28,895 29,823 30,332 31,691 32,702 33,620 34,595 35,618 36,678 37,777 38,915 40,095Sewerage trade waste - - - - - - - - - - - - - - - Waste management 6,442 6,880 7,520 7,831 7,871 8,073 8,336 8,609 8,893 9,188 9,494 9,812 10,141 10,484 10,840Garbage charges - 9,724 8,288 7,561 6,846 5,895 6,121 6,356 6,600 6,853 7,116 7,389 7,672 7,966 8,272Other rates, levies and charges - - - - - - - - - - - - - - - Less: discounts (8,275) (9,518) (10,087) (10,981) (11,006) (11,205) (11,924) (12,394) (12,803) (13,242) (13,704) (14,182) (14,677) (15,190) (15,721)Less: pensioner remissions (703) (696) (1,076) (694) (787) (725) (753) (782) (812) (843) (875) (909) (944) (980) (1,017)
Net rates, levies and charges 105,300 131,143 137,969 146,262 145,618 149,541 154,113 159,058 164,126 169,384 174,837 180,487 186,336 192,393 198,673
Building and development fees 9,167 4,338 2,416 2,394 1,879 1,986 2,062 2,141 2,223 2,308 2,397 2,489 2,584 2,683 2,786Infringements - 84 83 86 192 209 213 217 220 224 228 233 237 241 245Licences and registrations 576 541 571 615 609 749 778 808 839 871 904 939 975 1,012 1,051Other fees and charges 10,502 1,951 1,502 1,151 1,077 1,124 1,144 1,165 1,186 1,207 1,229 1,251 1,273 1,296 1,320
Fees and charges 20,245 6,914 4,572 4,246 3,756 4,068 4,196 4,330 4,468 4,610 4,758 4,911 5,069 5,233 5,402
Other rental income 757 719 679 701 724 770 784 798 812 827 841 857 872 888 904Rental income 757 719 679 701 724 770 784 798 812 827 841 857 872 888 904
Interest from overdue rates, levies and charges 66 72 543 786 737 300 300 300 300 300 300 300 300 300 300Interest received from investments 4,698 4,834 - - - 2,456 1,758 1,559 1,410 1,337 1,248 1,350 1,549 1,665 1,624Other interest received - 2,434 4,621 4,325 3,116 - - - - - - - - - -
Interest received 4,764 7,340 5,164 5,111 3,853 2,756 2,058 1,859 1,710 1,637 1,548 1,650 1,849 1,965 1,924
Contract and recoverable works 12,664 10,184 7,519 4,393 4,453 2,000 2,036 2,073 2,110 2,148 2,187 2,226 2,266 2,307 2,348Gain/(loss) on sale of land held as inventory - - - - - - - - - - - - - - - Gain/(loss) on sale of inventory held for sale - - - - - - - - - - - - - - - Gain/(loss) on sale of non-current assets held as inventory - - - - - - - - - - - - - - - Other sales revenue - 7,705 8,187 6,837 5,250 4,446 4,491 4,537 4,584 4,631 4,680 4,729 4,779 4,830 4,882
Sales revenue 12,664 17,889 15,706 11,230 9,703 6,446 6,527 6,610 6,694 6,779 6,866 6,955 7,045 7,137 7,230
Profit (loss) from joint ventures & associates - - - - - - - - - - - - - - - Profit (loss) from controlled entities - - - - - - - - - - - - - - - Profit (loss) from other investments - - - - - - - - - - - - - - -
Profit from investments - - - - - - - - - - - - - - -
External dividends received 11,436 - - - 6,337 4,060 4,545 5,110 5,110 5,110 5,110 5,110 5,110 5,110 5,110Internal charges received - - - - - - - - - - - - - - - Other income 4,232 - - - - - - - - - - - - - -
Other income 15,668 - - - 6,337 4,060 4,545 5,110 5,110 5,110 5,110 5,110 5,110 5,110 5,110
General purpose grants 9,858 3,762 7,690 7,533 7,382 7,515 7,515 7,515 7,515 7,515 7,515 7,515 7,515 7,515 7,515
QTC Model 17-18 Budget v2 26/06/2017 3:41 PM Page 1 of 4
LGFM v3.0.1'CompInc'
18Gladstone Regional Council Long Term Financial Plan
QTC Local Government Forecasting Model—Gladstone Regional CouncilStatement of Comprehensive Income
Line item Annual resultJun-13A Jun-14A Jun-15A Jun-16A Jun-17A Jun-18B Jun-19F Jun-20F Jun-21F Jun-22F Jun-23F Jun-24F Jun-25F Jun-26F Jun-27F
1 error identified—Whole of Council active
All outputs are in thousands ($'000) unless otherwise indicated
State subsidies and grants—operating 1,403 975 1,150 1,179 987 848 848 848 848 848 848 848 848 848 848Commonwealth subsidies and grants—operating - 1,572 1,583 1,804 624 840 840 840 840 840 840 840 840 840 840Other non-government subsidies and grants - 92 38 16 27 - - - - - - - - - - Donations—operating 5 25 - 6 0 0 0 0 0 0 0 0 0 0 0Contributions—operating 896 63 3 117 2,012 2,048 2,048 2,048 2,048 2,048 2,048 2,048 2,048 2,048 2,048
Grants, subsidies, contributions and donations 12,162 6,489 10,464 10,655 11,033 11,250 11,250 11,250 11,250 11,250 11,250 11,250 11,250 11,250 11,250Total operating revenue 171,560 170,494 174,554 178,206 181,025 178,890 183,474 189,014 194,170 199,597 205,211 211,220 217,531 223,976 230,493
Capital revenueGovernment subsidies and grants—capital 79,754 50,006 45,761 21,336 16,351 24,740 15,593 11,950 4,149 8,053 1,663 2,717 1,766 2,139 2,336Donations—capital - 34,154 19,012 1,994 - - - - - - - - - - - Contributions—capital 47,495 12,873 4,348 1,539 1,979 200 - - - - - - - - - Other capital contributions - 15,613 3,205 6,618 185 2,000 12,981 10,301 3,515 3,571 3,628 3,686 3,745 3,805 3,866
Grants, subsidies, contributions and donations 127,249 112,646 72,326 31,487 18,515 26,940 28,574 22,251 7,664 11,625 5,291 6,404 5,511 5,944 6,202
Total revenue 298,809 283,140 246,880 209,693 199,540 205,830 212,048 211,265 201,834 211,221 210,502 217,623 223,042 229,920 236,695
Capital incomeProfit/(loss) on disposal of property, plant & equipment (3,058) - - - - - - - - - - - - - - Profit/(loss) on sale of joint ventures & associates - - - - - - - - - - - - - - - Profit/(loss) on sale of controlled entities - - - - - - - - - - - - - - - Profit/(loss) on sale of other investments - - - - - - - - - - - - - - - Profit/(loss) on sale of investment property - - - - - - - - - - - - - - - Revaluation up of property, plant & equipment reversing previous revaluation 163 98 1,646 - - - - - - - - - - - - Revaluation of investment property - - - - - - - - - - - - - - - Revaluation up of joint ventures & associates - - - - - - - - - - - - - - - Revaluation up of controlled entities - - - - - - - - - - - - - - - Other capital income - - - - - - - - - - - - - - -
Total capital income (2,895) 98 1,646 - - - - - - - - - - - -
Total income 295,914 283,238 248,526 209,693 199,540 205,830 212,048 211,265 201,834 211,221 210,502 217,623 223,042 229,920 236,695
Expenses
Operating expensesTotal staff wages and salaries 44,297 45,610 39,828 37,263 58,719 68,637 69,287 70,847 72,442 74,073 75,741 77,446 79,189 80,972 82,795Councillors' remuneration 842 852 873 909 987 1,029 1,048 1,067 1,086 1,105 1,125 1,145 1,166 1,187 1,208Employee provision expense - 8,003 7,341 6,610 - - - - - - - - - - - Other employee related expenses 8,314 (3,830) (339) (37) 2,108 2,285 2,306 2,358 2,412 2,466 2,521 2,578 2,636 2,695 2,756Less: capitalised employee expenses - 5,092 6,905 6,451 - - - - - - - - - - -
Employee benefits 53,453 55,727 54,608 51,196 61,814 71,950 72,641 74,272 75,939 77,644 79,387 81,169 82,991 84,855 86,760
M&S—sales contract & recoverable works - - - - - - - - - - - - - - - M&S—administration supplies - - - - - - - - - - - - - - - M&S—audit services 154 144 149 151 153 165 168 171 175 178 181 184 187 191 194M&S—communication & IT - - - - - - - - - - - - - - - M&S—consultants - 5,313 2,258 2,666 1,870 1,722 1,752 1,783 1,814 1,845 1,878 1,910 1,943 1,977 2,012M&S—contractors - 9,593 17,283 20,264 24,260 23,270 23,675 24,087 24,506 24,932 25,366 25,808 26,257 26,714 27,178M&S—electricity - 4,157 3,801 3,859 1,268 1,247 1,270 1,292 1,316 1,339 1,363 1,388 1,413 1,438 1,464
QTC Model 17-18 Budget v2 26/06/2017 3:41 PM Page 2 of 4
LGFM v3.0.1'CompInc'
19Gladstone Regional Council Long Term Financial Plan
QTC Local Government Forecasting Model—Gladstone Regional CouncilStatement of Comprehensive Income
Line item Annual resultJun-13A Jun-14A Jun-15A Jun-16A Jun-17A Jun-18B Jun-19F Jun-20F Jun-21F Jun-22F Jun-23F Jun-24F Jun-25F Jun-26F Jun-27F
1 error identified—Whole of Council active
All outputs are in thousands ($'000) unless otherwise indicated
State subsidies and grants—operating 1,403 975 1,150 1,179 987 848 848 848 848 848 848 848 848 848 848Commonwealth subsidies and grants—operating - 1,572 1,583 1,804 624 840 840 840 840 840 840 840 840 840 840Other non-government subsidies and grants - 92 38 16 27 - - - - - - - - - - Donations—operating 5 25 - 6 0 0 0 0 0 0 0 0 0 0 0Contributions—operating 896 63 3 117 2,012 2,048 2,048 2,048 2,048 2,048 2,048 2,048 2,048 2,048 2,048
Grants, subsidies, contributions and donations 12,162 6,489 10,464 10,655 11,033 11,250 11,250 11,250 11,250 11,250 11,250 11,250 11,250 11,250 11,250Total operating revenue 171,560 170,494 174,554 178,206 181,025 178,890 183,474 189,014 194,170 199,597 205,211 211,220 217,531 223,976 230,493
Capital revenueGovernment subsidies and grants—capital 79,754 50,006 45,761 21,336 16,351 24,740 15,593 11,950 4,149 8,053 1,663 2,717 1,766 2,139 2,336Donations—capital - 34,154 19,012 1,994 - - - - - - - - - - - Contributions—capital 47,495 12,873 4,348 1,539 1,979 200 - - - - - - - - - Other capital contributions - 15,613 3,205 6,618 185 2,000 12,981 10,301 3,515 3,571 3,628 3,686 3,745 3,805 3,866
Grants, subsidies, contributions and donations 127,249 112,646 72,326 31,487 18,515 26,940 28,574 22,251 7,664 11,625 5,291 6,404 5,511 5,944 6,202
Total revenue 298,809 283,140 246,880 209,693 199,540 205,830 212,048 211,265 201,834 211,221 210,502 217,623 223,042 229,920 236,695
Capital incomeProfit/(loss) on disposal of property, plant & equipment (3,058) - - - - - - - - - - - - - - Profit/(loss) on sale of joint ventures & associates - - - - - - - - - - - - - - - Profit/(loss) on sale of controlled entities - - - - - - - - - - - - - - - Profit/(loss) on sale of other investments - - - - - - - - - - - - - - - Profit/(loss) on sale of investment property - - - - - - - - - - - - - - - Revaluation up of property, plant & equipment reversing previous revaluation 163 98 1,646 - - - - - - - - - - - - Revaluation of investment property - - - - - - - - - - - - - - - Revaluation up of joint ventures & associates - - - - - - - - - - - - - - - Revaluation up of controlled entities - - - - - - - - - - - - - - - Other capital income - - - - - - - - - - - - - - -
Total capital income (2,895) 98 1,646 - - - - - - - - - - - -
Total income 295,914 283,238 248,526 209,693 199,540 205,830 212,048 211,265 201,834 211,221 210,502 217,623 223,042 229,920 236,695
Expenses
Operating expensesTotal staff wages and salaries 44,297 45,610 39,828 37,263 58,719 68,637 69,287 70,847 72,442 74,073 75,741 77,446 79,189 80,972 82,795Councillors' remuneration 842 852 873 909 987 1,029 1,048 1,067 1,086 1,105 1,125 1,145 1,166 1,187 1,208Employee provision expense - 8,003 7,341 6,610 - - - - - - - - - - - Other employee related expenses 8,314 (3,830) (339) (37) 2,108 2,285 2,306 2,358 2,412 2,466 2,521 2,578 2,636 2,695 2,756Less: capitalised employee expenses - 5,092 6,905 6,451 - - - - - - - - - - -
Employee benefits 53,453 55,727 54,608 51,196 61,814 71,950 72,641 74,272 75,939 77,644 79,387 81,169 82,991 84,855 86,760
M&S—sales contract & recoverable works - - - - - - - - - - - - - - - M&S—administration supplies - - - - - - - - - - - - - - - M&S—audit services 154 144 149 151 153 165 168 171 175 178 181 184 187 191 194M&S—communication & IT - - - - - - - - - - - - - - - M&S—consultants - 5,313 2,258 2,666 1,870 1,722 1,752 1,783 1,814 1,845 1,878 1,910 1,943 1,977 2,012M&S—contractors - 9,593 17,283 20,264 24,260 23,270 23,675 24,087 24,506 24,932 25,366 25,808 26,257 26,714 27,178M&S—electricity - 4,157 3,801 3,859 1,268 1,247 1,270 1,292 1,316 1,339 1,363 1,388 1,413 1,438 1,464
QTC Model 17-18 Budget v2 26/06/2017 3:41 PM Page 2 of 4
LGFM v3.0.1'CompInc'
QTC Local Government Forecasting Model—Gladstone Regional CouncilStatement of Comprehensive Income
Line item Annual resultJun-13A Jun-14A Jun-15A Jun-16A Jun-17A Jun-18B Jun-19F Jun-20F Jun-21F Jun-22F Jun-23F Jun-24F Jun-25F Jun-26F Jun-27F
1 error identified—Whole of Council active
All outputs are in thousands ($'000) unless otherwise indicated
M&S—council maintenance - - - - - - - - - - - - - - - M&S—travel - - - - - - - - - - - - - - - M&S—other 77,687 54,197 48,621 45,120 27,854 25,233 25,672 26,119 26,573 27,036 27,506 27,985 28,472 28,967 29,471
Materials and services 77,841 73,404 72,112 72,060 55,405 51,638 52,538 53,453 54,384 55,331 56,294 57,275 58,272 59,287 60,320
Finance costs charged by QTC 4,519 6,106 7,611 7,277 8,283 7,781 7,264 6,732 6,131 5,519 4,927 4,351 3,713 3,049 2,347Interest paid on overdraft - - - - - - - - - - - - - - - Bank charges 208 201 651 (175) 210 230 234 238 243 247 251 256 261 265 270Interest on finance leases - - - - - - - - - - - - - - - Other finance costs 1,135 294 299 2,191 - - - - - - - - - - -
Finance costs 5,862 6,601 8,561 9,293 8,493 8,011 7,498 6,970 6,374 5,766 5,179 4,607 3,974 3,314 2,617
Land improvements - 411 456 412 - - - - - - - - - - - Buildings 2,320 2,867 3,388 1,341 3,180 1,595 1,167 1,423 1,478 1,526 1,574 1,642 1,693 1,752 1,822Plant & equipment 3,566 4,250 5,166 4,639 6,047 3,442 4,742 6,337 7,727 8,931 8,401 9,027 8,846 10,410 11,179Furniture & fittings 609 781 - - 962 707 736 782 548 284 14 12 13 15 6Roads, drainage & bridge network 13,520 14,884 19,566 27,623 20,607 29,291 29,945 31,095 32,393 33,693 34,770 35,956 37,066 38,221 39,901Water 2,998 3,561 4,264 4,283 4,948 4,103 4,401 4,890 5,274 5,634 6,023 6,392 6,811 7,245 7,754Sewerage 5,012 6,389 5,689 4,957 6,809 5,175 5,602 6,349 6,532 6,952 7,380 7,793 8,186 8,592 9,106Miscellaneous 731 - - - - - - - - - - - - - - Amortisation of intangible assets 231 226 273 292 275 202 156 (12) 7 7 8 8 8 8 9
Depreciation and amortisation 28,987 33,369 38,802 43,547 42,829 44,515 46,749 50,865 53,959 57,028 58,169 60,830 62,623 66,244 69,777
Bad and doubtful debts - - - - - - - - - - - - - - - Rentals & operating leases - - - - - - - - - - - - - - - Payments - - - - - - - - - - - - - - - Restructuring provision expense - - - - - - - - - - - - - - - Other provision expense - - - - - - - - - - - - - - - Other expenses - - - - 790 1,012 1,030 1,048 1,067 1,086 1,106 1,126 1,146 1,167 1,188
Other expenses - - - - 790 1,012 1,030 1,048 1,067 1,086 1,106 1,126 1,146 1,167 1,188Total operating expenses 166,143 169,101 174,083 176,096 169,331 177,126 180,456 186,608 191,722 196,855 200,135 205,006 209,007 214,867 220,661
Capital expensesLoss on impairment 910 - - - - - - - - - - - - - - Restoration & rehabilitation provision expense - - - - - - - - - - - - - - - Revaluation decrement 12 - - - - - - - - - - - - - - Other capital expenses - 5,781 4,679 8,002 - - - - - - - - - - -
Total capital expenses 922 5,781 4,679 8,002 - - - - - - - - - - -
Total expenses 167,065 174,882 178,762 184,098 169,331 177,126 180,456 186,608 191,722 196,855 200,135 205,006 209,007 214,867 220,661
Net result 128,849 108,356 69,764 25,595 30,208 28,704 31,592 24,657 10,111 14,366 10,367 12,617 14,036 15,053 16,033
Tax equivalents
Net result before tax equivalents 128,849 108,356 69,764 25,595 30,208 28,704 31,592 24,657 10,111 14,366 10,367 12,617 14,036 15,053 16,033Tax equivalents payable - - - - - - - - - - - - - - - Net result after tax equivalents 128,849 108,356 69,764 25,595 30,208 28,704 31,592 24,657 10,111 14,366 10,367 12,617 14,036 15,053 16,033
QTC Model 17-18 Budget v2 26/06/2017 3:41 PM Page 3 of 4
LGFM v3.0.1'CompInc'
20Gladstone Regional Council Long Term Financial Plan
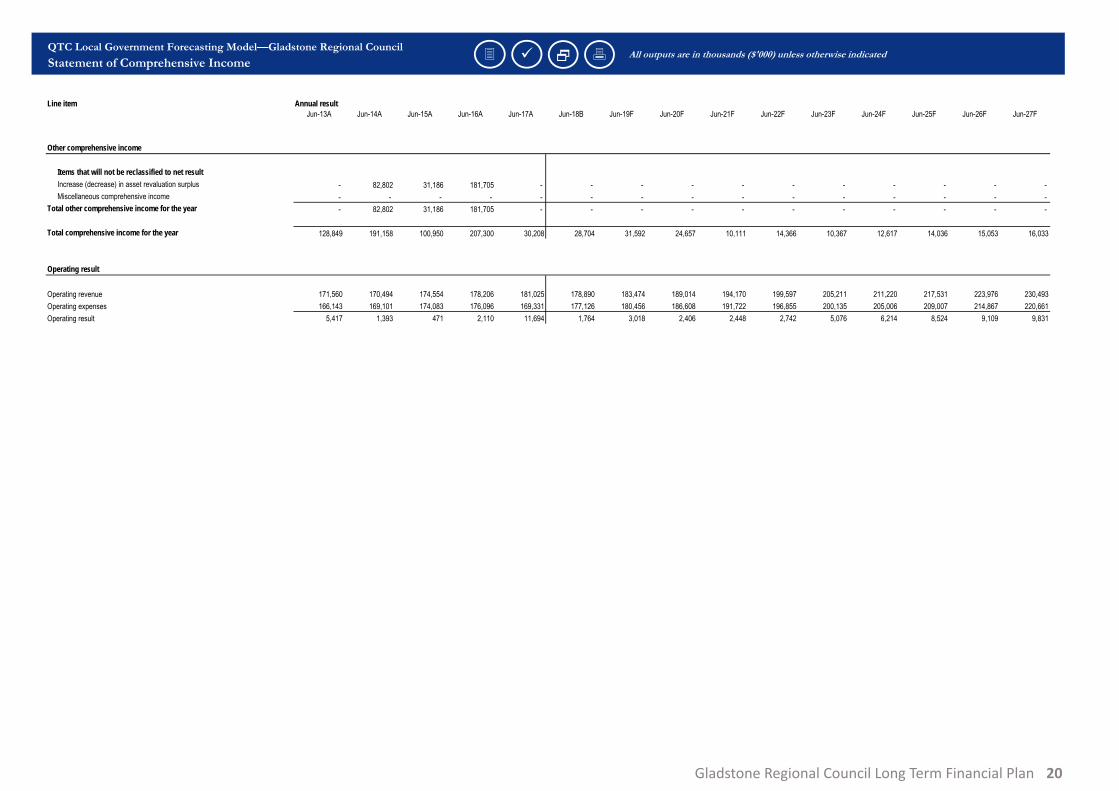
QTC Local Government Forecasting Model—Gladstone Regional CouncilStatement of Comprehensive Income
Line item Annual resultJun-13A Jun-14A Jun-15A Jun-16A Jun-17A Jun-18B Jun-19F Jun-20F Jun-21F Jun-22F Jun-23F Jun-24F Jun-25F Jun-26F Jun-27F
1 error identified—Whole of Council active
All outputs are in thousands ($'000) unless otherwise indicated
Other comprehensive income
Items that will not be reclassified to net resultIncrease (decrease) in asset revaluation surplus - 82,802 31,186 181,705 - - - - - - - - - - - Miscellaneous comprehensive income - - - - - - - - - - - - - - -
Total other comprehensive income for the year - 82,802 31,186 181,705 - - - - - - - - - - -
Total comprehensive income for the year 128,849 191,158 100,950 207,300 30,208 28,704 31,592 24,657 10,111 14,366 10,367 12,617 14,036 15,053 16,033
Operating result
Operating revenue 171,560 170,494 174,554 178,206 181,025 178,890 183,474 189,014 194,170 199,597 205,211 211,220 217,531 223,976 230,493Operating expenses 166,143 169,101 174,083 176,096 169,331 177,126 180,456 186,608 191,722 196,855 200,135 205,006 209,007 214,867 220,661Operating result 5,417 1,393 471 2,110 11,694 1,764 3,018 2,406 2,448 2,742 5,076 6,214 8,524 9,109 9,831
QTC Model 17-18 Budget v2 26/06/2017 3:41 PM Page 4 of 4
LGFM v3.0.1'CompInc'
21Gladstone Regional Council Long Term Financial Plan
QTC Local Government Forecasting Model—Gladstone Regional CouncilStatement of Comprehensive Income
Line item Annual resultJun-13A Jun-14A Jun-15A Jun-16A Jun-17A Jun-18B Jun-19F Jun-20F Jun-21F Jun-22F Jun-23F Jun-24F Jun-25F Jun-26F Jun-27F
1 error identified—Whole of Council active
All outputs are in thousands ($'000) unless otherwise indicated
Other comprehensive income
Items that will not be reclassified to net resultIncrease (decrease) in asset revaluation surplus - 82,802 31,186 181,705 - - - - - - - - - - - Miscellaneous comprehensive income - - - - - - - - - - - - - - -
Total other comprehensive income for the year - 82,802 31,186 181,705 - - - - - - - - - - -
Total comprehensive income for the year 128,849 191,158 100,950 207,300 30,208 28,704 31,592 24,657 10,111 14,366 10,367 12,617 14,036 15,053 16,033
Operating result
Operating revenue 171,560 170,494 174,554 178,206 181,025 178,890 183,474 189,014 194,170 199,597 205,211 211,220 217,531 223,976 230,493Operating expenses 166,143 169,101 174,083 176,096 169,331 177,126 180,456 186,608 191,722 196,855 200,135 205,006 209,007 214,867 220,661Operating result 5,417 1,393 471 2,110 11,694 1,764 3,018 2,406 2,448 2,742 5,076 6,214 8,524 9,109 9,831
QTC Model 17-18 Budget v2 26/06/2017 3:41 PM Page 4 of 4
LGFM v3.0.1'CompInc'
Appendix 2Balance Sheet
for the Forecast Period
22Gladstone Regional Council Long Term Financial Plan
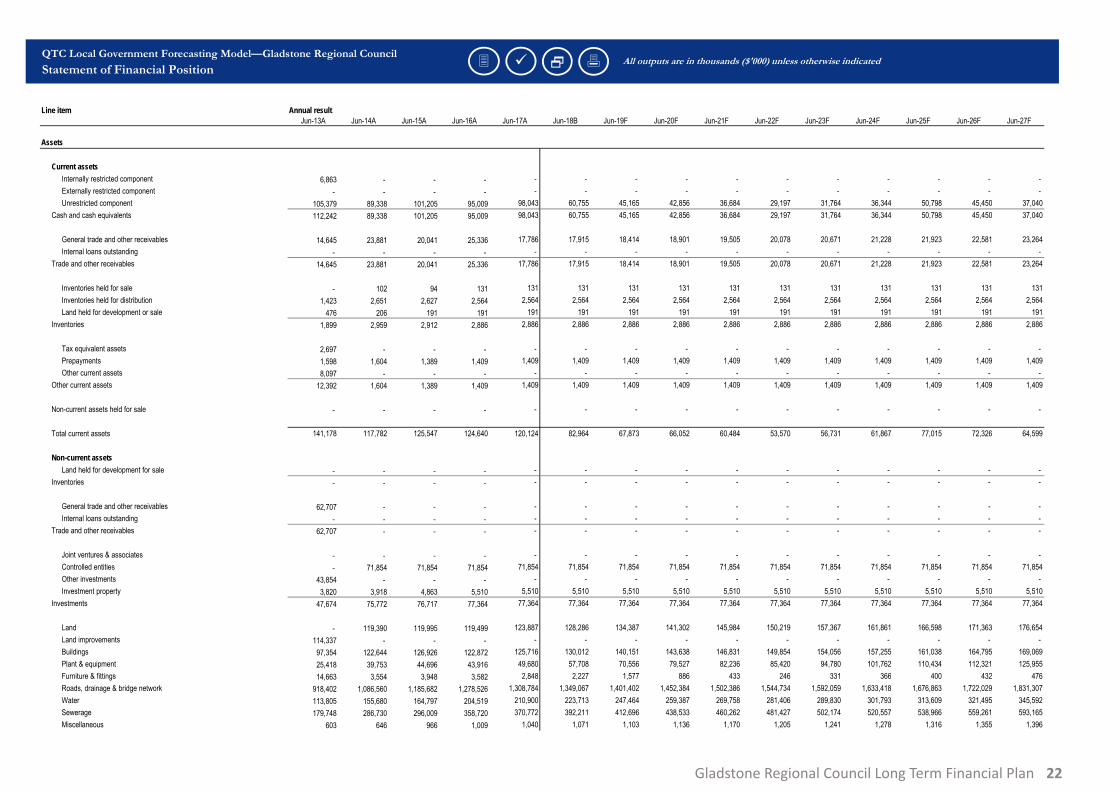
QTC Local Government Forecasting Model—Gladstone Regional CouncilStatement of Financial Position
Line item Annual resultJun-13A Jun-14A Jun-15A Jun-16A Jun-17A Jun-18B Jun-19F Jun-20F Jun-21F Jun-22F Jun-23F Jun-24F Jun-25F Jun-26F Jun-27F
1 error identified—Whole of Council active
All outputs are in thousands ($'000) unless otherwise indicated
Assets
Current assetsInternally restricted component 6,863 - - - - - - - - - - - - - - Externally restricted component - - - - - - - - - - - - - - - Unrestricted component 105,379 89,338 101,205 95,009 98,043 60,755 45,165 42,856 36,684 29,197 31,764 36,344 50,798 45,450 37,040
Cash and cash equivalents 112,242 89,338 101,205 95,009 98,043 60,755 45,165 42,856 36,684 29,197 31,764 36,344 50,798 45,450 37,040
General trade and other receivables 14,645 23,881 20,041 25,336 17,786 17,915 18,414 18,901 19,505 20,078 20,671 21,228 21,923 22,581 23,264Internal loans outstanding - - - - - - - - - - - - - - -
Trade and other receivables 14,645 23,881 20,041 25,336 17,786 17,915 18,414 18,901 19,505 20,078 20,671 21,228 21,923 22,581 23,264
Inventories held for sale - 102 94 131 131 131 131 131 131 131 131 131 131 131 131Inventories held for distribution 1,423 2,651 2,627 2,564 2,564 2,564 2,564 2,564 2,564 2,564 2,564 2,564 2,564 2,564 2,564Land held for development or sale 476 206 191 191 191 191 191 191 191 191 191 191 191 191 191
Inventories 1,899 2,959 2,912 2,886 2,886 2,886 2,886 2,886 2,886 2,886 2,886 2,886 2,886 2,886 2,886
Tax equivalent assets 2,697 - - - - - - - - - - - - - - Prepayments 1,598 1,604 1,389 1,409 1,409 1,409 1,409 1,409 1,409 1,409 1,409 1,409 1,409 1,409 1,409Other current assets 8,097 - - - - - - - - - - - - - -
Other current assets 12,392 1,604 1,389 1,409 1,409 1,409 1,409 1,409 1,409 1,409 1,409 1,409 1,409 1,409 1,409
Non-current assets held for sale - - - - - - - - - - - - - - -
Total current assets 141,178 117,782 125,547 124,640 120,124 82,964 67,873 66,052 60,484 53,570 56,731 61,867 77,015 72,326 64,599
Non-current assetsLand held for development for sale - - - - - - - - - - - - - - -
Inventories - - - - - - - - - - - - - - -
General trade and other receivables 62,707 - - - - - - - - - - - - - - Internal loans outstanding - - - - - - - - - - - - - - -
Trade and other receivables 62,707 - - - - - - - - - - - - - -
Joint ventures & associates - - - - - - - - - - - - - - - Controlled entities - 71,854 71,854 71,854 71,854 71,854 71,854 71,854 71,854 71,854 71,854 71,854 71,854 71,854 71,854Other investments 43,854 - - - - - - - - - - - - - - Investment property 3,820 3,918 4,863 5,510 5,510 5,510 5,510 5,510 5,510 5,510 5,510 5,510 5,510 5,510 5,510
Investments 47,674 75,772 76,717 77,364 77,364 77,364 77,364 77,364 77,364 77,364 77,364 77,364 77,364 77,364 77,364
Land - 119,390 119,995 119,499 123,887 128,286 134,387 141,302 145,984 150,219 157,367 161,861 166,598 171,363 176,654Land improvements 114,337 - - - - - - - - - - - - - - Buildings 97,354 122,644 126,926 122,872 125,716 130,012 140,151 143,638 146,831 149,854 154,056 157,255 161,038 164,795 169,069Plant & equipment 25,418 39,753 44,696 43,916 49,680 57,708 70,556 79,527 82,236 85,420 94,780 101,762 110,434 112,321 125,955Furniture & fittings 14,663 3,554 3,948 3,582 2,848 2,227 1,577 886 433 246 331 366 400 432 476Roads, drainage & bridge network 918,402 1,086,560 1,185,682 1,278,526 1,308,784 1,349,067 1,401,402 1,452,384 1,502,386 1,544,734 1,592,059 1,633,418 1,676,863 1,722,029 1,831,307Water 113,805 155,680 164,797 204,519 210,900 223,713 247,464 259,387 269,758 281,406 289,830 301,793 313,609 321,495 345,592Sewerage 179,748 286,730 296,009 358,720 370,772 392,211 412,696 438,533 460,262 481,427 502,174 520,557 538,966 559,261 593,165Miscellaneous 603 646 966 1,009 1,040 1,071 1,103 1,136 1,170 1,205 1,241 1,278 1,316 1,355 1,396
QTC Model 17-18 Budget v2 26/06/2017 3:36 PM Page 1 of 3
LGFM v3.0.1'FinPos'
23Gladstone Regional Council Long Term Financial Plan
QTC Local Government Forecasting Model—Gladstone Regional CouncilStatement of Financial Position
Line item Annual resultJun-13A Jun-14A Jun-15A Jun-16A Jun-17A Jun-18B Jun-19F Jun-20F Jun-21F Jun-22F Jun-23F Jun-24F Jun-25F Jun-26F Jun-27F
1 error identified—Whole of Council active
All outputs are in thousands ($'000) unless otherwise indicated
Assets
Current assetsInternally restricted component 6,863 - - - - - - - - - - - - - - Externally restricted component - - - - - - - - - - - - - - - Unrestricted component 105,379 89,338 101,205 95,009 98,043 60,755 45,165 42,856 36,684 29,197 31,764 36,344 50,798 45,450 37,040
Cash and cash equivalents 112,242 89,338 101,205 95,009 98,043 60,755 45,165 42,856 36,684 29,197 31,764 36,344 50,798 45,450 37,040
General trade and other receivables 14,645 23,881 20,041 25,336 17,786 17,915 18,414 18,901 19,505 20,078 20,671 21,228 21,923 22,581 23,264Internal loans outstanding - - - - - - - - - - - - - - -
Trade and other receivables 14,645 23,881 20,041 25,336 17,786 17,915 18,414 18,901 19,505 20,078 20,671 21,228 21,923 22,581 23,264
Inventories held for sale - 102 94 131 131 131 131 131 131 131 131 131 131 131 131Inventories held for distribution 1,423 2,651 2,627 2,564 2,564 2,564 2,564 2,564 2,564 2,564 2,564 2,564 2,564 2,564 2,564Land held for development or sale 476 206 191 191 191 191 191 191 191 191 191 191 191 191 191
Inventories 1,899 2,959 2,912 2,886 2,886 2,886 2,886 2,886 2,886 2,886 2,886 2,886 2,886 2,886 2,886
Tax equivalent assets 2,697 - - - - - - - - - - - - - - Prepayments 1,598 1,604 1,389 1,409 1,409 1,409 1,409 1,409 1,409 1,409 1,409 1,409 1,409 1,409 1,409Other current assets 8,097 - - - - - - - - - - - - - -
Other current assets 12,392 1,604 1,389 1,409 1,409 1,409 1,409 1,409 1,409 1,409 1,409 1,409 1,409 1,409 1,409
Non-current assets held for sale - - - - - - - - - - - - - - -
Total current assets 141,178 117,782 125,547 124,640 120,124 82,964 67,873 66,052 60,484 53,570 56,731 61,867 77,015 72,326 64,599
Non-current assetsLand held for development for sale - - - - - - - - - - - - - - -
Inventories - - - - - - - - - - - - - - -
General trade and other receivables 62,707 - - - - - - - - - - - - - - Internal loans outstanding - - - - - - - - - - - - - - -
Trade and other receivables 62,707 - - - - - - - - - - - - - -
Joint ventures & associates - - - - - - - - - - - - - - - Controlled entities - 71,854 71,854 71,854 71,854 71,854 71,854 71,854 71,854 71,854 71,854 71,854 71,854 71,854 71,854Other investments 43,854 - - - - - - - - - - - - - - Investment property 3,820 3,918 4,863 5,510 5,510 5,510 5,510 5,510 5,510 5,510 5,510 5,510 5,510 5,510 5,510
Investments 47,674 75,772 76,717 77,364 77,364 77,364 77,364 77,364 77,364 77,364 77,364 77,364 77,364 77,364 77,364
Land - 119,390 119,995 119,499 123,887 128,286 134,387 141,302 145,984 150,219 157,367 161,861 166,598 171,363 176,654Land improvements 114,337 - - - - - - - - - - - - - - Buildings 97,354 122,644 126,926 122,872 125,716 130,012 140,151 143,638 146,831 149,854 154,056 157,255 161,038 164,795 169,069Plant & equipment 25,418 39,753 44,696 43,916 49,680 57,708 70,556 79,527 82,236 85,420 94,780 101,762 110,434 112,321 125,955Furniture & fittings 14,663 3,554 3,948 3,582 2,848 2,227 1,577 886 433 246 331 366 400 432 476Roads, drainage & bridge network 918,402 1,086,560 1,185,682 1,278,526 1,308,784 1,349,067 1,401,402 1,452,384 1,502,386 1,544,734 1,592,059 1,633,418 1,676,863 1,722,029 1,831,307Water 113,805 155,680 164,797 204,519 210,900 223,713 247,464 259,387 269,758 281,406 289,830 301,793 313,609 321,495 345,592Sewerage 179,748 286,730 296,009 358,720 370,772 392,211 412,696 438,533 460,262 481,427 502,174 520,557 538,966 559,261 593,165Miscellaneous 603 646 966 1,009 1,040 1,071 1,103 1,136 1,170 1,205 1,241 1,278 1,316 1,355 1,396
QTC Model 17-18 Budget v2 26/06/2017 3:36 PM Page 1 of 3
LGFM v3.0.1'FinPos'
QTC Local Government Forecasting Model—Gladstone Regional CouncilStatement of Financial Position
Line item Annual resultJun-13A Jun-14A Jun-15A Jun-16A Jun-17A Jun-18B Jun-19F Jun-20F Jun-21F Jun-22F Jun-23F Jun-24F Jun-25F Jun-26F Jun-27F
1 error identified—Whole of Council active
All outputs are in thousands ($'000) unless otherwise indicated
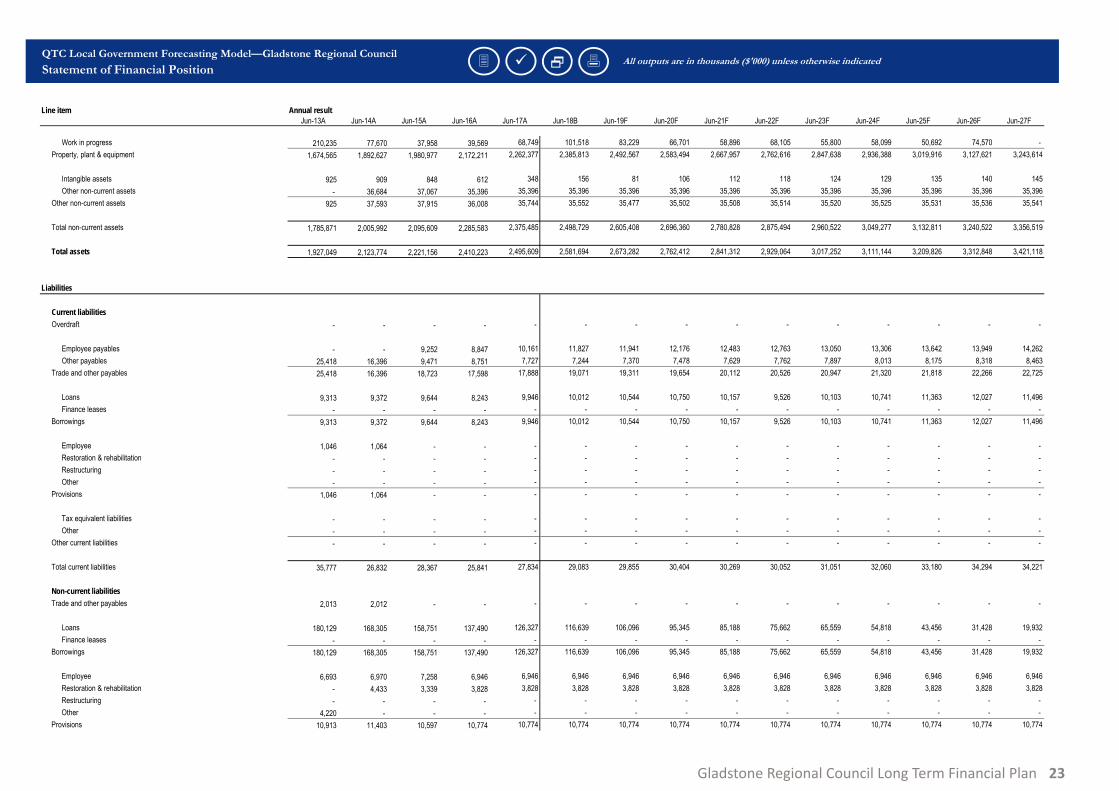
Work in progress 210,235 77,670 37,958 39,569 68,749 101,518 83,229 66,701 58,896 68,105 55,800 58,099 50,692 74,570 - Property, plant & equipment 1,674,565 1,892,627 1,980,977 2,172,211 2,262,377 2,385,813 2,492,567 2,583,494 2,667,957 2,762,616 2,847,638 2,936,388 3,019,916 3,127,621 3,243,614
Intangible assets 925 909 848 612 348 156 81 106 112 118 124 129 135 140 145Other non-current assets - 36,684 37,067 35,396 35,396 35,396 35,396 35,396 35,396 35,396 35,396 35,396 35,396 35,396 35,396
Other non-current assets 925 37,593 37,915 36,008 35,744 35,552 35,477 35,502 35,508 35,514 35,520 35,525 35,531 35,536 35,541
Total non-current assets 1,785,871 2,005,992 2,095,609 2,285,583 2,375,485 2,498,729 2,605,408 2,696,360 2,780,828 2,875,494 2,960,522 3,049,277 3,132,811 3,240,522 3,356,519
Total assets 1,927,049 2,123,774 2,221,156 2,410,223 2,495,609 2,581,694 2,673,282 2,762,412 2,841,312 2,929,064 3,017,252 3,111,144 3,209,826 3,312,848 3,421,118
Liabilities
Current liabilitiesOverdraft - - - - - - - - - - - - - - -
Employee payables - - 9,252 8,847 10,161 11,827 11,941 12,176 12,483 12,763 13,050 13,306 13,642 13,949 14,262Other payables 25,418 16,396 9,471 8,751 7,727 7,244 7,370 7,478 7,629 7,762 7,897 8,013 8,175 8,318 8,463
Trade and other payables 25,418 16,396 18,723 17,598 17,888 19,071 19,311 19,654 20,112 20,526 20,947 21,320 21,818 22,266 22,725
Loans 9,313 9,372 9,644 8,243 9,946 10,012 10,544 10,750 10,157 9,526 10,103 10,741 11,363 12,027 11,496Finance leases - - - - - - - - - - - - - - -
Borrowings 9,313 9,372 9,644 8,243 9,946 10,012 10,544 10,750 10,157 9,526 10,103 10,741 11,363 12,027 11,496
Employee 1,046 1,064 - - - - - - - - - - - - - Restoration & rehabilitation - - - - - - - - - - - - - - - Restructuring - - - - - - - - - - - - - - - Other - - - - - - - - - - - - - - -
Provisions 1,046 1,064 - - - - - - - - - - - - -
Tax equivalent liabilities - - - - - - - - - - - - - - - Other - - - - - - - - - - - - - - -
Other current liabilities - - - - - - - - - - - - - - -
Total current liabilities 35,777 26,832 28,367 25,841 27,834 29,083 29,855 30,404 30,269 30,052 31,051 32,060 33,180 34,294 34,221
Non-current liabilitiesTrade and other payables 2,013 2,012 - - - - - - - - - - - - -
Loans 180,129 168,305 158,751 137,490 126,327 116,639 106,096 95,345 85,188 75,662 65,559 54,818 43,456 31,428 19,932Finance leases - - - - - - - - - - - - - - -
Borrowings 180,129 168,305 158,751 137,490 126,327 116,639 106,096 95,345 85,188 75,662 65,559 54,818 43,456 31,428 19,932
Employee 6,693 6,970 7,258 6,946 6,946 6,946 6,946 6,946 6,946 6,946 6,946 6,946 6,946 6,946 6,946Restoration & rehabilitation - 4,433 3,339 3,828 3,828 3,828 3,828 3,828 3,828 3,828 3,828 3,828 3,828 3,828 3,828Restructuring - - - - - - - - - - - - - - - Other 4,220 - - - - - - - - - - - - - -
Provisions 10,913 11,403 10,597 10,774 10,774 10,774 10,774 10,774 10,774 10,774 10,774 10,774 10,774 10,774 10,774
QTC Model 17-18 Budget v2 26/06/2017 3:36 PM Page 2 of 3
LGFM v3.0.1'FinPos'
24Gladstone Regional Council Long Term Financial Plan
QTC Local Government Forecasting Model—Gladstone Regional CouncilStatement of Financial Position
Line item Annual resultJun-13A Jun-14A Jun-15A Jun-16A Jun-17A Jun-18B Jun-19F Jun-20F Jun-21F Jun-22F Jun-23F Jun-24F Jun-25F Jun-26F Jun-27F
1 error identified—Whole of Council active
All outputs are in thousands ($'000) unless otherwise indicated
Other non-current liabilities - - - - - - - - - - - - - - -
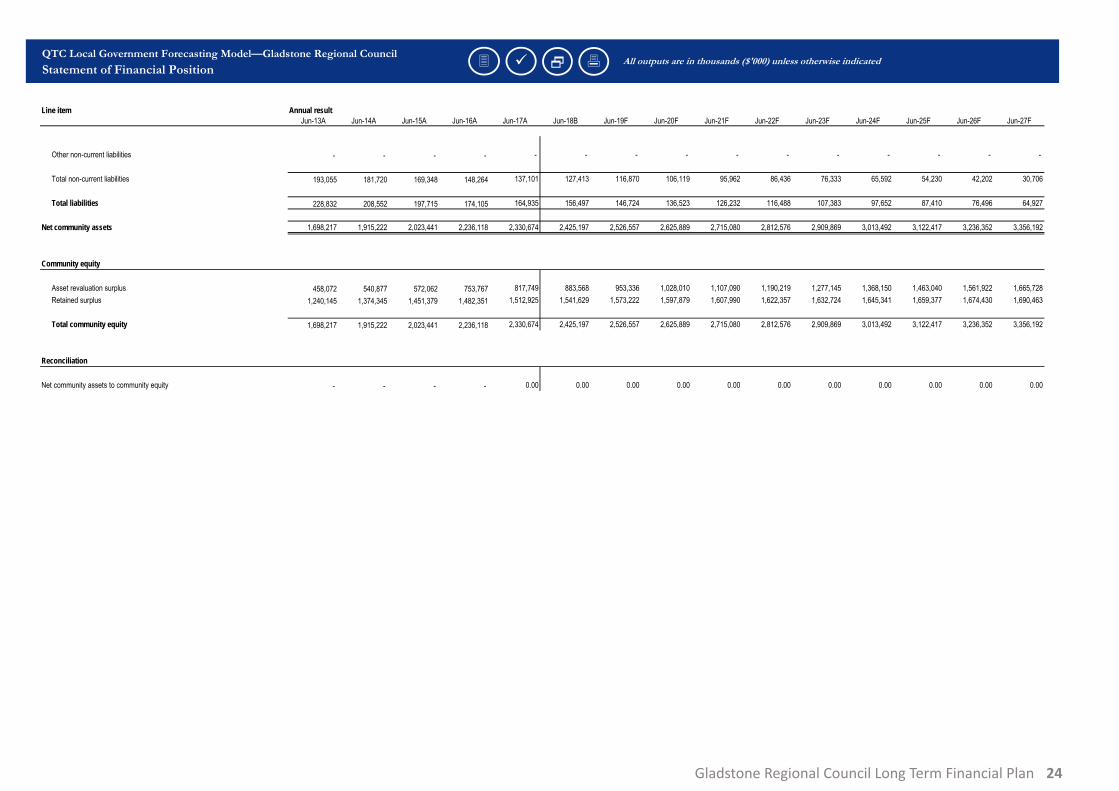
Total non-current liabilities 193,055 181,720 169,348 148,264 137,101 127,413 116,870 106,119 95,962 86,436 76,333 65,592 54,230 42,202 30,706
Total liabilities 228,832 208,552 197,715 174,105 164,935 156,497 146,724 136,523 126,232 116,488 107,383 97,652 87,410 76,496 64,927
Net community assets 1,698,217 1,915,222 2,023,441 2,236,118 2,330,674 2,425,197 2,526,557 2,625,889 2,715,080 2,812,576 2,909,869 3,013,492 3,122,417 3,236,352 3,356,192
Community equity
Asset revaluation surplus 458,072 540,877 572,062 753,767 817,749 883,568 953,336 1,028,010 1,107,090 1,190,219 1,277,145 1,368,150 1,463,040 1,561,922 1,665,728Retained surplus 1,240,145 1,374,345 1,451,379 1,482,351 1,512,925 1,541,629 1,573,222 1,597,879 1,607,990 1,622,357 1,632,724 1,645,341 1,659,377 1,674,430 1,690,463
Total community equity 1,698,217 1,915,222 2,023,441 2,236,118 2,330,674 2,425,197 2,526,557 2,625,889 2,715,080 2,812,576 2,909,869 3,013,492 3,122,417 3,236,352 3,356,192
Reconciliation
Net community assets to community equity - - - - 0.00 0.00 0.00 0.00 0.00 0.00 0.00 0.00 0.00 0.00 0.00
QTC Model 17-18 Budget v2 26/06/2017 3:36 PM Page 3 of 3
LGFM v3.0.1'FinPos'
25Gladstone Regional Council Long Term Financial Plan
QTC Local Government Forecasting Model—Gladstone Regional CouncilStatement of Financial Position
Line item Annual resultJun-13A Jun-14A Jun-15A Jun-16A Jun-17A Jun-18B Jun-19F Jun-20F Jun-21F Jun-22F Jun-23F Jun-24F Jun-25F Jun-26F Jun-27F
1 error identified—Whole of Council active
All outputs are in thousands ($'000) unless otherwise indicated
Other non-current liabilities - - - - - - - - - - - - - - -
Total non-current liabilities 193,055 181,720 169,348 148,264 137,101 127,413 116,870 106,119 95,962 86,436 76,333 65,592 54,230 42,202 30,706
Total liabilities 228,832 208,552 197,715 174,105 164,935 156,497 146,724 136,523 126,232 116,488 107,383 97,652 87,410 76,496 64,927
Net community assets 1,698,217 1,915,222 2,023,441 2,236,118 2,330,674 2,425,197 2,526,557 2,625,889 2,715,080 2,812,576 2,909,869 3,013,492 3,122,417 3,236,352 3,356,192
Community equity
Asset revaluation surplus 458,072 540,877 572,062 753,767 817,749 883,568 953,336 1,028,010 1,107,090 1,190,219 1,277,145 1,368,150 1,463,040 1,561,922 1,665,728Retained surplus 1,240,145 1,374,345 1,451,379 1,482,351 1,512,925 1,541,629 1,573,222 1,597,879 1,607,990 1,622,357 1,632,724 1,645,341 1,659,377 1,674,430 1,690,463
Total community equity 1,698,217 1,915,222 2,023,441 2,236,118 2,330,674 2,425,197 2,526,557 2,625,889 2,715,080 2,812,576 2,909,869 3,013,492 3,122,417 3,236,352 3,356,192
Reconciliation
Net community assets to community equity - - - - 0.00 0.00 0.00 0.00 0.00 0.00 0.00 0.00 0.00 0.00 0.00
QTC Model 17-18 Budget v2 26/06/2017 3:36 PM Page 3 of 3
LGFM v3.0.1'FinPos'
Appendix 3Cash Flow Statement
for the Forecast Period
26Gladstone Regional Council Long Term Financial Plan
QTC Local Government Forecasting Model—Gladstone Regional CouncilStatement of Cash Flows
Line item Annual resultJun-13A Jun-14A Jun-15A Jun-16A Jun-17A Jun-18B Jun-19F Jun-20F Jun-21F Jun-22F Jun-23F Jun-24F Jun-25F Jun-26F Jun-27F
1 error identified—Whole of Council active
Cash flows from operating activities
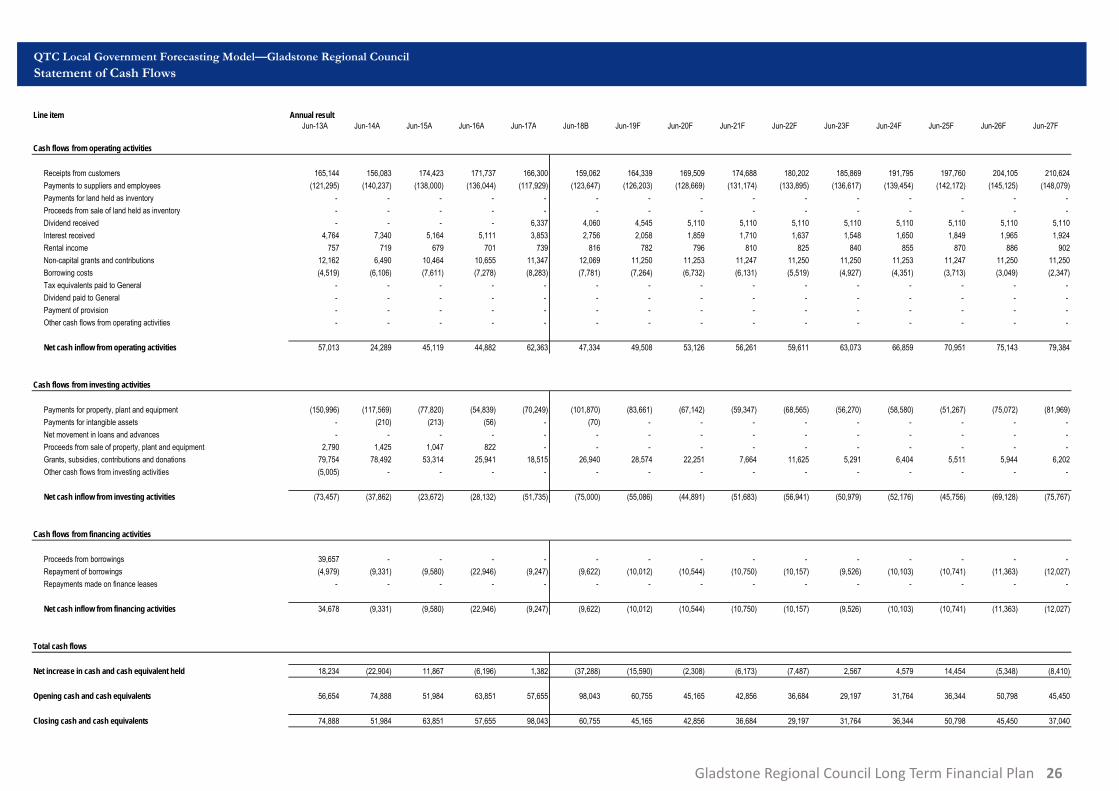
Receipts from customers 165,144 156,083 174,423 171,737 166,300 159,062 164,339 169,509 174,688 180,202 185,869 191,795 197,760 204,105 210,624Payments to suppliers and employees (121,295) (140,237) (138,000) (136,044) (117,929) (123,647) (126,203) (128,669) (131,174) (133,895) (136,617) (139,454) (142,172) (145,125) (148,079)Payments for land held as inventory - - - - - - - - - - - - - - - Proceeds from sale of land held as inventory - - - - - - - - - - - - - - - Dividend received - - - - 6,337 4,060 4,545 5,110 5,110 5,110 5,110 5,110 5,110 5,110 5,110Interest received 4,764 7,340 5,164 5,111 3,853 2,756 2,058 1,859 1,710 1,637 1,548 1,650 1,849 1,965 1,924Rental income 757 719 679 701 739 816 782 796 810 825 840 855 870 886 902Non-capital grants and contributions 12,162 6,490 10,464 10,655 11,347 12,069 11,250 11,253 11,247 11,250 11,250 11,253 11,247 11,250 11,250Borrowing costs (4,519) (6,106) (7,611) (7,278) (8,283) (7,781) (7,264) (6,732) (6,131) (5,519) (4,927) (4,351) (3,713) (3,049) (2,347)Tax equivalents paid to General - - - - - - - - - - - - - - - Dividend paid to General - - - - - - - - - - - - - - - Payment of provision - - - - - - - - - - - - - - - Other cash flows from operating activities - - - - - - - - - - - - - - -
Net cash inflow from operating activities 57,013 24,289 45,119 44,882 62,363 47,334 49,508 53,126 56,261 59,611 63,073 66,859 70,951 75,143 79,384
Cash flows from investing activities
Payments for property, plant and equipment (150,996) (117,569) (77,820) (54,839) (70,249) (101,870) (83,661) (67,142) (59,347) (68,565) (56,270) (58,580) (51,267) (75,072) (81,969)Payments for intangible assets - (210) (213) (56) - (70) - - - - - - - - - Net movement in loans and advances - - - - - - - - - - - - - - - Proceeds from sale of property, plant and equipment 2,790 1,425 1,047 822 - - - - - - - - - - - Grants, subsidies, contributions and donations 79,754 78,492 53,314 25,941 18,515 26,940 28,574 22,251 7,664 11,625 5,291 6,404 5,511 5,944 6,202Other cash flows from investing activities (5,005) - - - - - - - - - - - - - -
Net cash inflow from investing activities (73,457) (37,862) (23,672) (28,132) (51,735) (75,000) (55,086) (44,891) (51,683) (56,941) (50,979) (52,176) (45,756) (69,128) (75,767)
Cash flows from financing activities
Proceeds from borrowings 39,657 - - - - - - - - - - - - - - Repayment of borrowings (4,979) (9,331) (9,580) (22,946) (9,247) (9,622) (10,012) (10,544) (10,750) (10,157) (9,526) (10,103) (10,741) (11,363) (12,027)Repayments made on finance leases - - - - - - - - - - - - - - -
Net cash inflow from financing activities 34,678 (9,331) (9,580) (22,946) (9,247) (9,622) (10,012) (10,544) (10,750) (10,157) (9,526) (10,103) (10,741) (11,363) (12,027)
Total cash flows
Net increase in cash and cash equivalent held 18,234 (22,904) 11,867 (6,196) 1,382 (37,288) (15,590) (2,308) (6,173) (7,487) 2,567 4,579 14,454 (5,348) (8,410)
Opening cash and cash equivalents 56,654 74,888 51,984 63,851 57,655 98,043 60,755 45,165 42,856 36,684 29,197 31,764 36,344 50,798 45,450
Closing cash and cash equivalents 74,888 51,984 63,851 57,655 98,043 60,755 45,165 42,856 36,684 29,197 31,764 36,344 50,798 45,450 37,040
QTC Model 17-18 Budget v2 26/06/2017 3:35 PM Page 1 of 2
LGFM v3.0.1'CashFlow'
27Gladstone Regional Council Long Term Financial Plan
QTC Local Government Forecasting Model—Gladstone Regional CouncilStatement of Cash Flows
Line item Annual resultJun-13A Jun-14A Jun-15A Jun-16A Jun-17A Jun-18B Jun-19F Jun-20F Jun-21F Jun-22F Jun-23F Jun-24F Jun-25F Jun-26F Jun-27F
1 error identified—Whole of Council active
Cash flows from operating activities
Receipts from customers 165,144 156,083 174,423 171,737 166,300 159,062 164,339 169,509 174,688 180,202 185,869 191,795 197,760 204,105 210,624Payments to suppliers and employees (121,295) (140,237) (138,000) (136,044) (117,929) (123,647) (126,203) (128,669) (131,174) (133,895) (136,617) (139,454) (142,172) (145,125) (148,079)Payments for land held as inventory - - - - - - - - - - - - - - - Proceeds from sale of land held as inventory - - - - - - - - - - - - - - - Dividend received - - - - 6,337 4,060 4,545 5,110 5,110 5,110 5,110 5,110 5,110 5,110 5,110Interest received 4,764 7,340 5,164 5,111 3,853 2,756 2,058 1,859 1,710 1,637 1,548 1,650 1,849 1,965 1,924Rental income 757 719 679 701 739 816 782 796 810 825 840 855 870 886 902Non-capital grants and contributions 12,162 6,490 10,464 10,655 11,347 12,069 11,250 11,253 11,247 11,250 11,250 11,253 11,247 11,250 11,250Borrowing costs (4,519) (6,106) (7,611) (7,278) (8,283) (7,781) (7,264) (6,732) (6,131) (5,519) (4,927) (4,351) (3,713) (3,049) (2,347)Tax equivalents paid to General - - - - - - - - - - - - - - - Dividend paid to General - - - - - - - - - - - - - - - Payment of provision - - - - - - - - - - - - - - - Other cash flows from operating activities - - - - - - - - - - - - - - -
Net cash inflow from operating activities 57,013 24,289 45,119 44,882 62,363 47,334 49,508 53,126 56,261 59,611 63,073 66,859 70,951 75,143 79,384
Cash flows from investing activities
Payments for property, plant and equipment (150,996) (117,569) (77,820) (54,839) (70,249) (101,870) (83,661) (67,142) (59,347) (68,565) (56,270) (58,580) (51,267) (75,072) (81,969)Payments for intangible assets - (210) (213) (56) - (70) - - - - - - - - - Net movement in loans and advances - - - - - - - - - - - - - - - Proceeds from sale of property, plant and equipment 2,790 1,425 1,047 822 - - - - - - - - - - - Grants, subsidies, contributions and donations 79,754 78,492 53,314 25,941 18,515 26,940 28,574 22,251 7,664 11,625 5,291 6,404 5,511 5,944 6,202Other cash flows from investing activities (5,005) - - - - - - - - - - - - - -
Net cash inflow from investing activities (73,457) (37,862) (23,672) (28,132) (51,735) (75,000) (55,086) (44,891) (51,683) (56,941) (50,979) (52,176) (45,756) (69,128) (75,767)
Cash flows from financing activities
Proceeds from borrowings 39,657 - - - - - - - - - - - - - - Repayment of borrowings (4,979) (9,331) (9,580) (22,946) (9,247) (9,622) (10,012) (10,544) (10,750) (10,157) (9,526) (10,103) (10,741) (11,363) (12,027)Repayments made on finance leases - - - - - - - - - - - - - - -
Net cash inflow from financing activities 34,678 (9,331) (9,580) (22,946) (9,247) (9,622) (10,012) (10,544) (10,750) (10,157) (9,526) (10,103) (10,741) (11,363) (12,027)
Total cash flows
Net increase in cash and cash equivalent held 18,234 (22,904) 11,867 (6,196) 1,382 (37,288) (15,590) (2,308) (6,173) (7,487) 2,567 4,579 14,454 (5,348) (8,410)
Opening cash and cash equivalents 56,654 74,888 51,984 63,851 57,655 98,043 60,755 45,165 42,856 36,684 29,197 31,764 36,344 50,798 45,450
Closing cash and cash equivalents 74,888 51,984 63,851 57,655 98,043 60,755 45,165 42,856 36,684 29,197 31,764 36,344 50,798 45,450 37,040
QTC Model 17-18 Budget v2 26/06/2017 3:35 PM Page 1 of 2
LGFM v3.0.1'CashFlow'
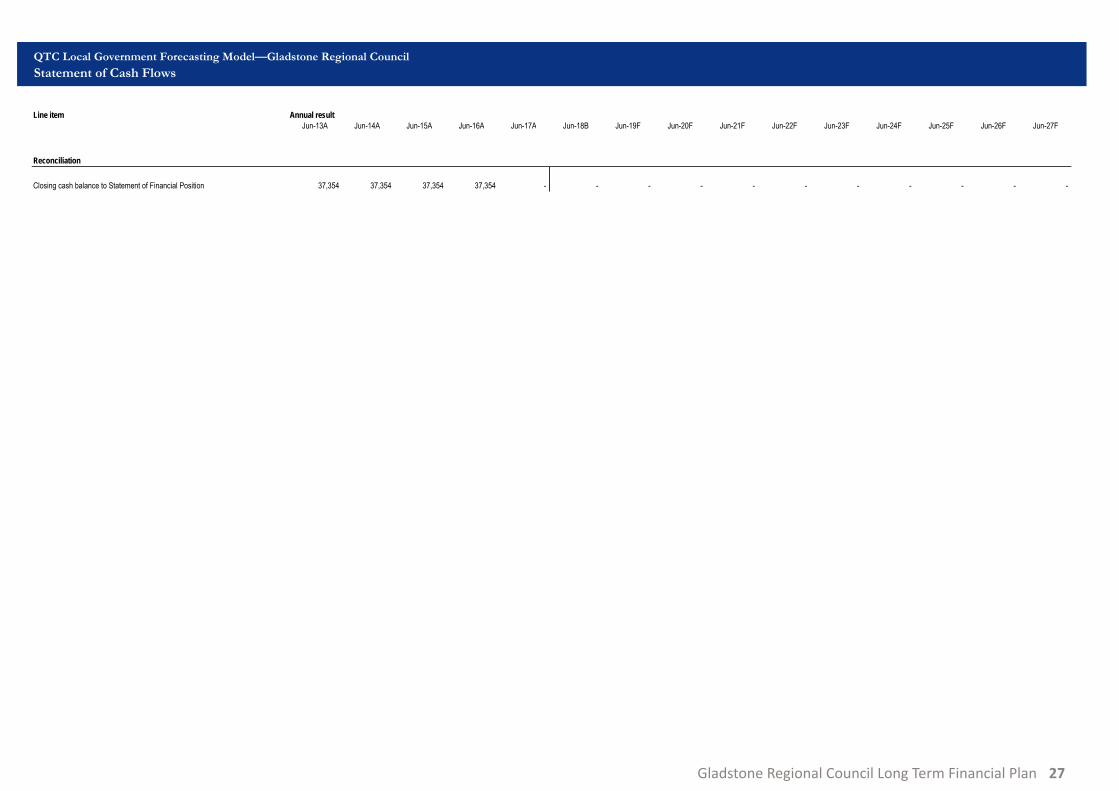
QTC Local Government Forecasting Model—Gladstone Regional CouncilStatement of Cash Flows
Line item Annual resultJun-13A Jun-14A Jun-15A Jun-16A Jun-17A Jun-18B Jun-19F Jun-20F Jun-21F Jun-22F Jun-23F Jun-24F Jun-25F Jun-26F Jun-27F
1 error identified—Whole of Council active
Reconciliation
Closing cash balance to Statement of Financial Position 37,354 37,354 37,354 37,354 - - - - - - - - - - -
QTC Model 17-18 Budget v2 26/06/2017 3:35 PM Page 2 of 2
LGFM v3.0.1'CashFlow'
28Gladstone Regional Council Long Term Financial Plan
Appendix 4Key Financial Sustainability Metrics
QTC Local Government Forecasting Model—Gladstone Regional CouncilDashboard Summary1 error identified—Whole of Council active
All outputs are in thousands ($'000) unless otherwise indicated
Budget Forecast
Key financial sustainability metrics Target Jun-13A Jun-14A Jun-15A Jun-16A Jun-17A Jun-18B Jun-19F Jun-20F Jun-21F Jun-22F Jun-23F Jun-24F Jun-25F Jun-26F Jun-27F
Operating surplus ratio 0% to 10% 3.2% 0.8% 0.3% 1.2% 6.5% 1.0% 1.6% 1.3% 1.3% 1.4% 2.5% 2.9% 3.9% 4.1% 4.3%3.0 2.0 2.0 3.0 3.0 2.0 3.0 3.0 3.0 3.0 3.0 3.0 3.0 3.0 3.0
Cash expense cover ratio > 3 months 10.2 8.3 9.5 9.1 10.0 5.8 4.3 4.0 3.3 2.6 2.8 3.1 4.3 3.7 3.03.0 3.0 3.0 3.0 3.0 3.0 3.0 3.0 2.0 1.0 1.0 2.0 3.0 3.0 1.0
Asset sustainability ratio > 90% 201.1% 193.8% 126.4% 67.3% 65.5% 102.4% 98.6% 66.3% 61.6% 80.3% 64.0% 54.0% 48.2% 43.8% 46.8%3.0 3.0 3.0 1.0 1.0 3.0 3.0 1.0 1.0 1.0 1.0 1.0 1.0 1.0 1.0
Average useful life of depreciable assets 50.9 51.2 47.3 46.5 48.6 48.7 48.8 46.7 45.7 44.6 45.3 44.7 44.8 43.5 44.0na na na na na na na na na na na na na na na
Net financial liabilities ratio <= 60% 51.1% 53.2% 41.3% 27.8% 24.8% 41.1% 43.0% 37.3% 33.9% 31.5% 24.7% 16.9% 4.8% 1.9% 0.1%3.0 3.0 3.0 3.0 3.0 3.0 3.0 3.0 3.0 3.0 3.0 3.0 3.0 3.0 3.0
Council controlled revenue ratio > 60% 73.2% 81.0% 81.7% 84.5% 82.5% 85.9% 86.3% 86.4% 86.8% 87.2% 87.5% 87.8% 88.0% 88.2% 88.5%3.0 3.0 3.0 3.0 3.0 3.0 3.0 3.0 3.0 3.0 3.0 3.0 3.0 3.0 3.0
Total debt service cover ratio > 2 times 8.6x 2.7x 2.8x 3.1x 3.8x 3.0x 3.3x 3.5x 3.7x 4.2x 4.7x 4.9x 5.2x 5.4x 5.7x3.0 3.0 3.0 3.0 3.0 3.0 3.0 3.0 3.0 3.0 3.0 3.0 3.0 3.0 3.0
Capital expenditure ratio 4.9x 2.9x 1.7x 1.1x 1.1x 2.3x 1.8x 1.3x 1.1x 1.2x 1.0x 1.0x 0.8x 1.1x 1.2xna na na na na na na na na na na na na na na
Actual
QTC Model 17-18 Budget v2 26/06/2017 3:34 PM Page 3 of 3
LGFM v3.0.1'DashSumm'
29Gladstone Regional Council Long Term Financial Plan
QTC Local Government Forecasting Model—Gladstone Regional CouncilDashboard Summary1 error identified—Whole of Council active
All outputs are in thousands ($'000) unless otherwise indicated
Budget Forecast
Key financial sustainability metrics Target Jun-13A Jun-14A Jun-15A Jun-16A Jun-17A Jun-18B Jun-19F Jun-20F Jun-21F Jun-22F Jun-23F Jun-24F Jun-25F Jun-26F Jun-27F
Operating surplus ratio 0% to 10% 3.2% 0.8% 0.3% 1.2% 6.5% 1.0% 1.6% 1.3% 1.3% 1.4% 2.5% 2.9% 3.9% 4.1% 4.3%3.0 2.0 2.0 3.0 3.0 2.0 3.0 3.0 3.0 3.0 3.0 3.0 3.0 3.0 3.0
Cash expense cover ratio > 3 months 10.2 8.3 9.5 9.1 10.0 5.8 4.3 4.0 3.3 2.6 2.8 3.1 4.3 3.7 3.03.0 3.0 3.0 3.0 3.0 3.0 3.0 3.0 2.0 1.0 1.0 2.0 3.0 3.0 1.0
Asset sustainability ratio > 90% 201.1% 193.8% 126.4% 67.3% 65.5% 102.4% 98.6% 66.3% 61.6% 80.3% 64.0% 54.0% 48.2% 43.8% 46.8%3.0 3.0 3.0 1.0 1.0 3.0 3.0 1.0 1.0 1.0 1.0 1.0 1.0 1.0 1.0
Average useful life of depreciable assets 50.9 51.2 47.3 46.5 48.6 48.7 48.8 46.7 45.7 44.6 45.3 44.7 44.8 43.5 44.0na na na na na na na na na na na na na na na
Net financial liabilities ratio <= 60% 51.1% 53.2% 41.3% 27.8% 24.8% 41.1% 43.0% 37.3% 33.9% 31.5% 24.7% 16.9% 4.8% 1.9% 0.1%3.0 3.0 3.0 3.0 3.0 3.0 3.0 3.0 3.0 3.0 3.0 3.0 3.0 3.0 3.0
Council controlled revenue ratio > 60% 73.2% 81.0% 81.7% 84.5% 82.5% 85.9% 86.3% 86.4% 86.8% 87.2% 87.5% 87.8% 88.0% 88.2% 88.5%3.0 3.0 3.0 3.0 3.0 3.0 3.0 3.0 3.0 3.0 3.0 3.0 3.0 3.0 3.0
Total debt service cover ratio > 2 times 8.6x 2.7x 2.8x 3.1x 3.8x 3.0x 3.3x 3.5x 3.7x 4.2x 4.7x 4.9x 5.2x 5.4x 5.7x3.0 3.0 3.0 3.0 3.0 3.0 3.0 3.0 3.0 3.0 3.0 3.0 3.0 3.0 3.0
Capital expenditure ratio 4.9x 2.9x 1.7x 1.1x 1.1x 2.3x 1.8x 1.3x 1.1x 1.2x 1.0x 1.0x 0.8x 1.1x 1.2xna na na na na na na na na na na na na na na
Actual
QTC Model 17-18 Budget v2 26/06/2017 3:34 PM Page 3 of 3
LGFM v3.0.1'DashSumm'
30Gladstone Regional Council Long Term Financial Plan
ADMINISTRATION CENTRESGladstone, 101 Goondoon StreetCalliope, 5 Don Cameron DriveMiriam Vale, 36 Roe Street
RURAL TRANSACTION CENTRESAgnes Water, 71 Springs RoadMount Larcom, Raglan Street
COMMUNITY CENTRESAgnes Water, 71 Springs RoadBoyne Tannum, Cnr Wyndham & Hayes Avenue, Boyne IslandCalliope, 5 Don Cameron DriveMiriam Vale, 36 Roe Street
GENERAL INFORMATIONPhone 07 4970 0700Fax 07 4975 8500Email [email protected] www.gladstone.qld.gov.au

31Gladstone Regional Council Long Term Financial Plan