Embed Size (px)
Citation preview
~ounra~ of chromafogiaphy, 199 (1980) 3X5-369 Eketier ScieWfic Publishing Company, Amsterdam -Printed in The Ne&erIa.u&
CEEROM. 13,124
G&S SU&ACE ANALYTICAL STUDIES IN THE PREPARATION OF OPEN TUBULAR COLUMNS FOR GAS CHRQMATOGRAPHY
BOB W. WRIGHT and MDXON L. LEE*
Departtnm~ of Chemtkhy, Brigham Young Uziversity, Provo, UT84602 (U.S.A.)
and
SUSAN W. GRAHAM, LAWRENCE V. PHILLIPS’ and DAVID M. HERCULES
Department of Chemistry. Univekity of Pittsburgh, Pitrsbragh. PA 15260 (U.S.A.)
SUMMARY
Modern surface analytical techniques, Auger electron spectroscopy and X-ray photoelectron spectroscopy, have been used to study the chemical compositions of glass surfaces which have been treated according to various procedures used in the preparation of glass capillary columus. Auger electron spectroscopy was found to be particularly valuable because the electron beam could be focused OQ the interior wall of the capillary column.
It was found that leaching Pyrex glass with 20% HCl solution at 110°C for 48 h produced a nearly pure silica surface which retained its integrity after heat treat- ments at 400°C. Leaching of soft glass was not complete.
Chromatograpbic performance evaluations showed that Pyrex columns that were leached with aqueous acid solutions and subsequently silylated at 400°C were extremely well deactivated and produced excellent non-polar phase columns.
JNT’RODUCITON
Even with the many successes of capillary column gas chromatography, many workers are still reluctant to take full advantage of the technique. This may he attrib- uted in part to the discrepancies, irreproducibilities, and disappointments in column preparation which are often experienced. In fact, column preparation has often been accused of being a poorly understood art rather than a science. knprovements in column technology have most often heen empirical and developed mainly by trial and error. Certainly, an understanding of the chemical composition of the surf&z would be an important factor in the preparation and chromatographic performance of capillary cofumns. Until recently, surface compositions were only inferred from indirect evidences and were got directly obtainabIe. Fortunately, however, sophisti- cated stiaee analytical instrumentation utilizing electron spectroscopy [e.g. Auger
* Present address: Inficon Leybold-Heraeus Inc., E. Syracuse, NY 13057, U.S.A.
m21-9673/8opt3twwm 1%02.25 0 1980 Elsevier Scientiiic Publishing Company
356 B. W. WRIGEFT et al.
electron spectroscopy (AES) and X-ray photoelectron spectroscopy (XPS or ESCA)] and ion spectroscopy [e.g. secondary ion mass spectrometry (SIMS) and ion scatter- ing spectroscopy (ISS)] have been developed in the last few years, which permit analysis of the surface from the top monolayer into the bulk material.
In a recent report by Lee et ,aZ.l it was shown that AES is particularly valuable in the analysis of glass capillary columns because the electron beam can be focused on the interior wall of the column. It was reported that columns which were treated with HCl gas and washed with formic acid2 exhibited better deactivation and a higher degree of inertness toward sensitive compounds than columns in which the “acid leaching” was omitted. Analysis showed that the formic acid removed most of the sodium and calcium from the glass surface.
In this paper the results of a comprehensive study of the chemistry occurring on the glass surface during column preparation is presented. Starting with the drawing procedure and continuing throughout the entire preparation sequence, the compo- sitions of glass capillary column surfaces were examined by AES. Various leaching procedures were studied with particular emphasis being placed on the purity of the silica surface formed, the depth of the silica layer, and the stability of the silica layer towards back-diffusion of ions at elevated temperatures. When columns are properly acid-leached and further deactivated by high-temperature silylation, highly efficient, well deactivated, and thermally stable columns are obtained.
In addition to AES, ESCA was also employed to obtain complementary and more sensitive surface data. In addition to providing information about the chemical state of atoms on surfaces, it also provides a “softer” method of analysis since X-rays rather than high-intensity electrons are used to irradiate the sample. This is particu- larly important in the analysis of insulating materials such as glasses because the danger of damaging the surface or accidentally sputtering away the top monolayer is completely eliminated. The chemical composition of the glass as a function of depth (or distance from the surface) can be obtained by ion milling which gradually erodes away the upper surface layers and exposes new material for analysis. However, due to sample size requirements, glass slides in&ad of actual capillary columns were studied using ESCA techniques.
EXPERIMENTAL
Column preparation Glass capillary columns were drawn from two types of glass; Kimble R6 Flint
(soda-lime) (Kimble Glass Products, Toledo, OH, U.S.A.) and Coming 7740 Pyrex (Corning Glass Works, Corning, NY, U.S.A.). During the drawing process several columns were purged with pure dry oxygen.
Capillary columns were dynamically leached by forcing 20 % HCl at ca. 110°C (the boiling point) through the column. This was done by placing the column in an oven such that both ends were extended to the outside. One end of the cohmm was
connected with heat-shrinkable PTFE tubing to a 50-ml reagent reservoir, while the other end was left free to allow purge liquids to drip into a collection vessel. Generally, long lengths (Le. 90 m) of capillary were leached with 50 ml of acid for approximately 48 h. After all the acid solution had passed through the column, the oven was heated to 400°C and held for 12 h. After cooling to llO”C, an additional 50 ml of20% HCl
PREPARATION OF OPEN TUBULAR COLUMNS FOR GC 357
were added to the reagent reservoir and the reaching procedure was repeated. After all of the acid had passed through the column, the reagent reservoir was rinsed and filled with deionized water which was then forced rapidly through the column to remove any acid residues. The column was dried and dehydrated by increasing the oven temperature to 150°C while continuing to purge the column with nitrogen for about I2 h. Static hydrochloric acid leaching was done according to the methods outlined by Grob et QC.“-‘.
Columns were dynamically silylated in the following manner: A column was broken into the desired finished length and placed in the oven so that both ends were extended outside the oven. One end was connected to a bubbler with heat-shrinkable FIFE. While the oven was heated to the appropriate temperature (usually 4ClO”Q a few milliliters of the silylating reagent(s) were placed in the bubbler. Dry nitrogen was used to carry the silylation vapors through the column for a period of approximately 48 h. A 5:l mixture of hexamethyldisilazane (HMDS) and trimethylchlorosilane (TMCS) (Applied Science Labs., State College, PA, I_I.S.A.)6*7 was generally used, while in some instances HMDS was used alone. For columns longer than 15 m, the bubbler was disconnected after 24 h and reconnected to the other end of the column and silylation continued for an additional 24 h. After silylation, the oven was cooled to 2ClO”C, the bubbler removed, and dry nitrogen passed directly through the column for about 30 min to flush out any non-reacted silylation vapors. Static silylation was done according to the procedures outlined by Grob et 01.~~~.
Columns were coated statically with SE-52 as described by Bouche and Ver- zele9. To facilitate coating, pentane was used as the solvent1o and the column ends were sealed with Apiezon N. The stationary phase solution was of such concentration that a 0.25-pm thick film was deposited. Fresh coating solutions were prepared weekly to avoid possible problems of stationary phase decomposition11*12.
GQS chromatography A Varian 1400 gas chromatograph was used with a home-built injection port
and a modified flame-ionization detector (FID) inlet. Helium at a linear velocity of 50 cm/set was used a~ the carrier gas. Injections were made at room temperature, and after elution of the solvent peak, the oven was temperature programmed at a pre- selected rate. In order to prevent saturation of column active sites and a resultant decrease in the sensitivity of column performance indicators (peak shape and effi- ciency), small quantities of various test compounds were injected. The sensitivity of the instrument was adjusted to give full-scale response for approximately 20 ng.
Glass slide preparation Glass slides were made from Kimble EXAX soft glass and Corning 7740 Pyrex
glass. The Pyrex slides were of the same bulk composition as were the Pyrex capillary columns, however, the soft glass slides were of a slightly different bulk composition (see Tables I and II). The slides were cut to a size suitable for ESCA analysis (CQ. 1 cmz) and cleaned with deionized water.
The glass slides were leached in a 20 % HCl solution by mounting in preleached fluorocarbon holders and placing in the boiling (ca. llO°C) leaching solution for various lengths at time. The volume of the acid in the reaction vessel @a0 ml) was sufEiciently large that a minimal increase in ion concentration occurred during leach-
358 .- B. W.-WRIGHT et al.
ing: After removal from the acid bath, the slides were rinsed three times in deio_nized water and allowed to dry in room air.
The glass slides were heated in a mullle furnace at a temperature of 406 & 10°C under a flowing inert gas atmosphere for various lengths of time.
Surface ~~2ly.k AES analyses of the inner capillary surfaces were accomplished with a Physical
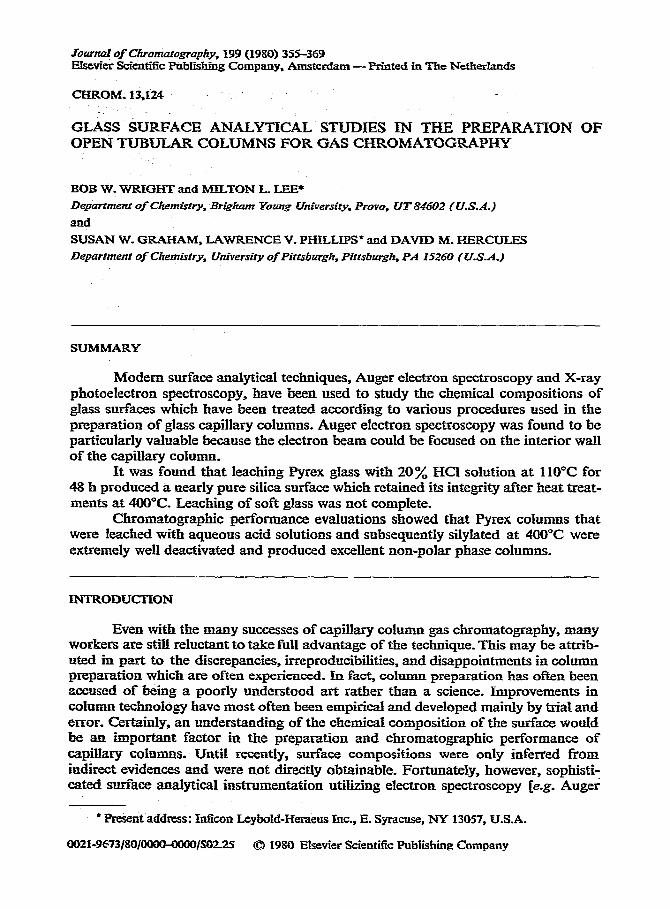
Electronics Industries Model 545 scanning Auger microprobe. The capillaries were cracked lengthwise to expose the tier surface, mounted on the sample carrousel and evacuated in the instrument vacuum chamber. The inner bore of each capillary was located with the absorbed current image and the Auger beam focussed on the interior. The Auger beam was reduced to minimum beam current (< 1 nA), slightly defocused with the electron gun objective lens, rastered over a 70 x 70 pm area, and accelerated at 3 keV. The vacuum in the instrument during analysis was below 5 - KF tom.
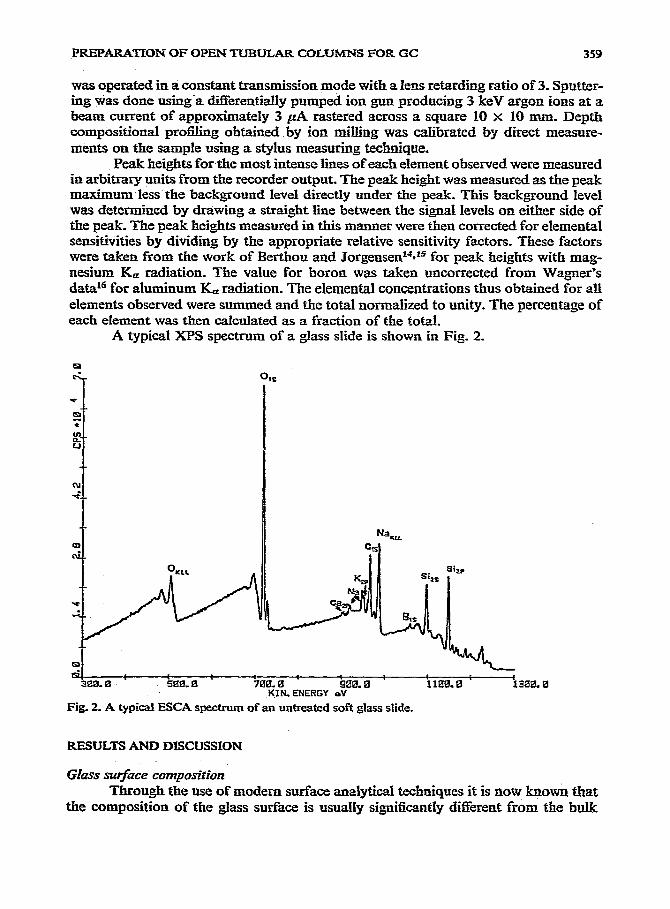
The spectra were recorded on an x-y plotter and the peak heights manually measured. The observed peak heights were normal&d (using relative sensitivity factors for the appropriate Auger lines) to relative atomic concentrations13. The total of the atomic concentrations was set to unity and the relative percentages of each element present were then calculated. A typical Auger spectrum obtained from the interior of a glass capillary column is shown in Fig. I.
ENERGY (ev)
Fig. 1. A typical Auger ekctron spectrum of the interior surface of an untreated Pyrex glass capillary cohlmn.
Due to the geometry and small size of the glass capillary column samples, depth profiling by argon ion milling caused excessive charging and meaniugful data were unobtainable.
XPS analyses of the glass slide surfaces were done using a Leybold-Heraeus LHS-10 XPS/AES/SIMS spectrometer with multichannel averaging. All sampIes were irradiated with magnesium I& X-rays at 240 w power. Each analysis consisted of adding sixteen 1-min scans from 300 to 1300 eV with 4096 data points. The analyzer
PREPkRATXW OF OPEN TUBULAR COLUh4MS FOR GC 359
was operated in a constant transmission mode with a lens retarding ratio of 3. Sputter-
ing wits done using-a differentially pumped ion gun producing 3 keV argon ions at a beam current of approximately 3 yA rastered across a square LO x 10 mm. Depth compositionai pro&g obtained by ion milling was calibrated tij direct measure- ments on the sample using a stylus measuring technique.
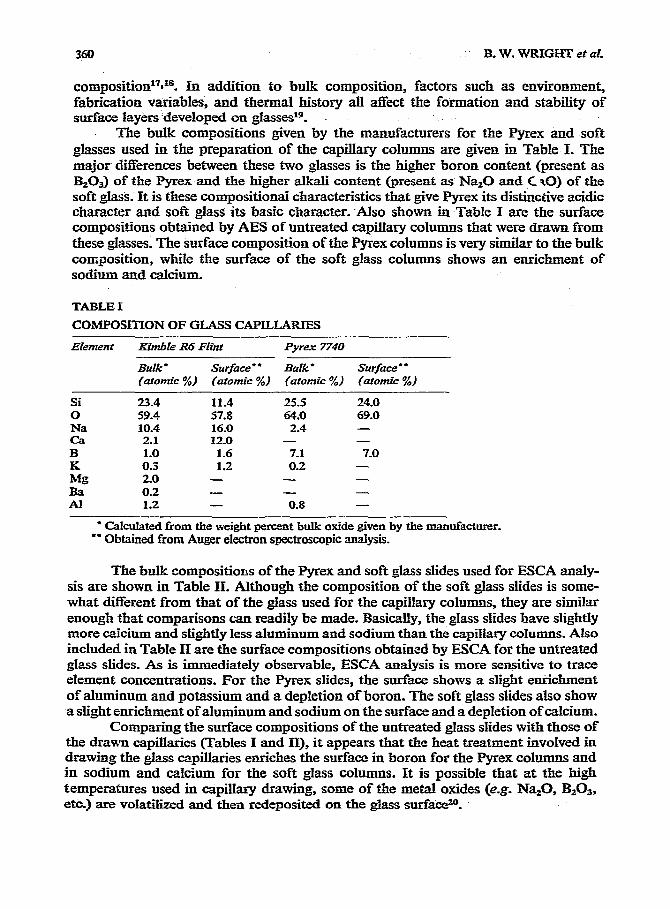
Peak heights for the most intense lmes of each element observed were measured in arbitrary units from the recorder output. The peak height was measured as the peak maximnm less the background level directly under the peak. This background level was determined by drawing a straight line between the signal levels on either side of the peak. The peak heights measured in this manner were then corrected for elemental sensitivities by dividing by the appropriate relative sensitivity factors. These factors were taken from the work of Berthou and JorgensexP*” for peak heights with mag- nesium -& radiation. The value for boron was taken uncorrected from Wagner’s dataI6 for aluminum K, radiation. The elemental concentrations thus obtained for all elements observed were summed and the total normalized to unity. The percentage of each element was then calculated as a fraction of the total.
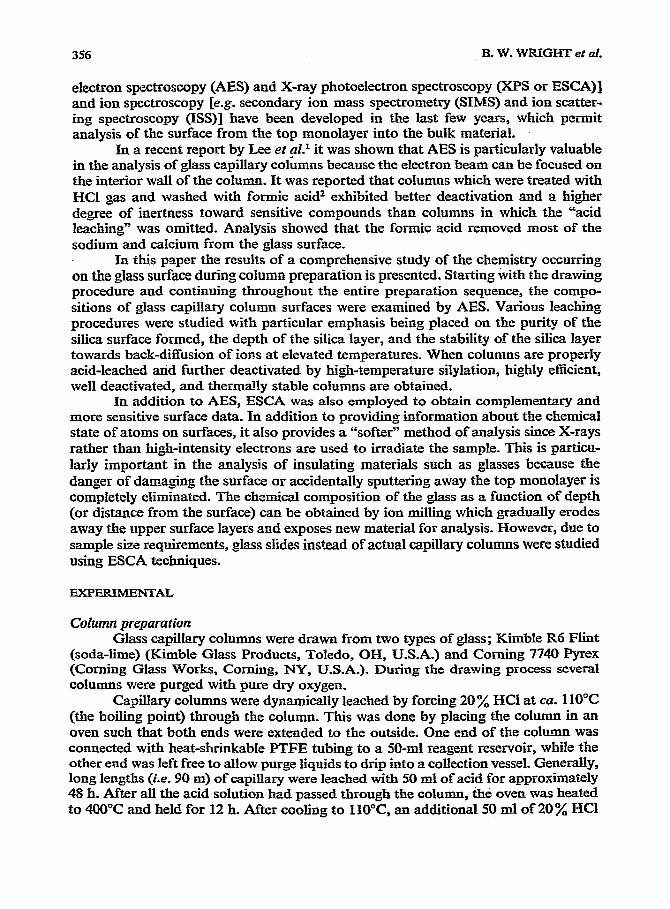
A typical XPS spectrum of a glass slide is shown in Fig. 2.
sic 38&E s0n.a 70& 0 S0& 0 1100.0 1300.0
KIUENERGY eV
Fig. 2. A typical ESCA qxctnxn of an untreated soft glass slide.
RESULTS AND DISCUSSION
Through the use of modern surface analytical techniques it is QOW known that the composition of the glass surface is usuaIIy significantly different from the bulk
composition17~z8. En addition to bulk composition, factors such as environment, fabrication variables, and thermal history all affect the formation and stability of surface layers :deveiopecl on gla.sseslg.
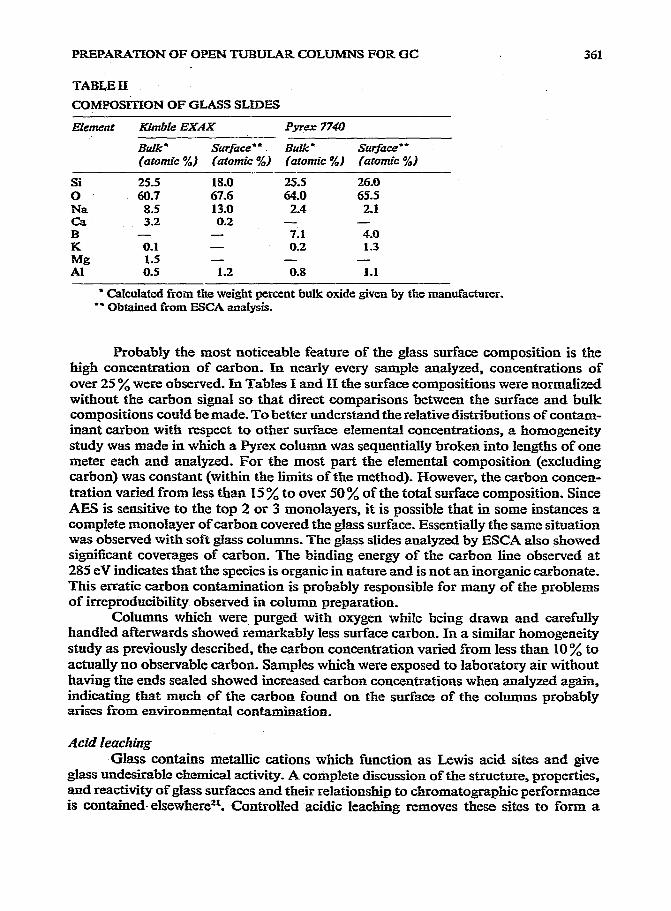
The bulk compositions given by the manufacturers for the Pyrex and soft glasses used in the preparation of the capillary columns are given in Table I. The major differences between these two glasses is the higher boron content (present as BtOj) of the Pyrex and the higher alkali content (present as Na20 and CqO) of the soft glass. It is these compositional characteristics that give Pyrex its distinc&ive acidic character and soft glass its basic character. -Also shown in Table I are the surface compositions obtained by A333 of untreated capillary columns that were drawn from these glasses. The surface composition of the Pyrex columns is very similar to the bulk composition, while the surface of the soft glass columns shows an enrichment of sodium and calcium.
TABLE I
COMPOSITION OF GLASS CAPILLARIES
Eiemel7t
Si 0 Na ca B K
Mz Ba Al
Enzble R6 Fiint Pyrex 7740
Bulk’ Surface * l Bulk’ Swface* * (atomic %) (atomic %) (atomic %) (atomic %)
23.4 11.4 25.5 24.0 59.4 57.8 64.0 69.0 10.4 16.0 2.4 - 2.1 120 - -
1.0 1.6 7.1 7.0 0.3 1.2 0.2 - 20 - - - 0.2 - - - 1.2 - 0.8 -
* Cakulated from the weight percent bulk oxide given by the manufacturer. l * Obtained from Ausr electron spectroscopic analysis.
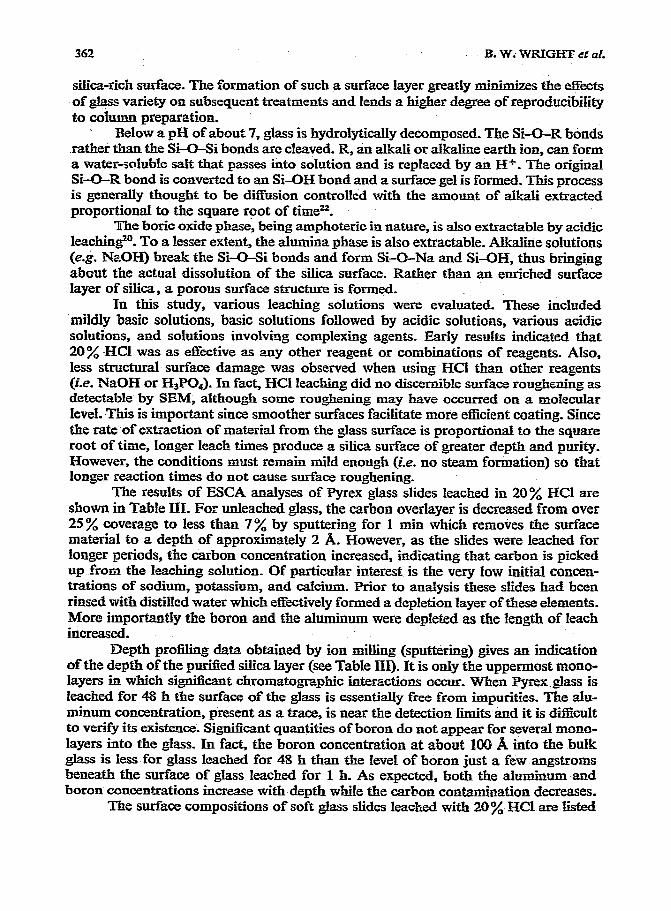
The bulk compositions of the Pyrex and soft glass slides used for ESCA analy- sis are shown in Table II. Although the composition of the soft glass slides is some- what different from that of the glass used -for the capillary columns, they are similar enough that comparisons can readily be made. Basically, the glass slides have slightly more calcium and slightly less aluminum and sodium than the capillary columns. Also included in Table IT are the surface compositions obtained by ESCA for the untreated glass slides. As is immediately observable, ESCA analysis is more sensitive to trace element concentrations. For the Pyrex slides, the surface shows a slight etichment of aluminum and potassium and a depletion of boron. The soft glass slides also show a slight enrichment of aluminum and sodium on the surface and a depletion of calcium.
Comparing the surface compositions of the untreated glass slides with those of the drawn capillaries (Tables I and II), it appears that the heat treatment involved in drawing the glass capillaries enriches the surface in boron for the Pyrex columns and in sodium and calcium for the soft glass columns. Tt is possible that at the high temperatures used in capillary drawing, some of the metal oxides (e.g. Na,O, B,O,, etc.) are voIatilized and then redeposited on the glass su&&~G~.
PREPARAI’TON OF OPEN ‘FUBULrAR CCILUM.NS FOR GC 361
TABLE II CGMPOStiQN OF GLASS SLIDES
Element Kimble EXAX Pyn?x 7740
Bulk’ Surface”. B&c’ Surface ** (atomic %) (atomic %) (atomic %) (atomic %)
Si 25.5 18.0 25.5 26.0 0 60.7 67.6 64.0 65.5 Na 8.5 13.0 2.4 2.1 ca 3.2 0.2 - - B - - 7.1 4.0 K 0.1 - 0.2 1.3 Mg 1.5 - - -
Al 0.5 1.2 0.8 1.1
l calculated from the weight percent bulk oxide given by the manufacturer. ** Obtained from ESCA an&is.
Probably the most noticeable feature of the glass surface composition is the high concentration of carbon. In nearly every sample analyzed, concentrations of over 25 ‘$A were observed. In Tables I and II the surface compositions were normalized without the carbon signal so that direct comparisons between the surface and bulk compositions could be made. To better understand the relative distributions of contam- inant carbon with respect to other surface elemental concentrations, a homogeneity study was made in which a Pyrex column was sequentially broken into lengths of one meter each and analyzed. For the most part the elemental composition (excluding carbon) was constant (within the limits of the method). However, the carbon concen- tration varied from less than 15 % to over 50% of the total surface composition. Since AES is sensitive to the top 2 or 3 monolayers, it is possible that in some instances a complete monolayer of carbon covered the glass surface. Essentially the same situation was observed with soft glass columns. The glass slides analyzed by ESCA also showed significant coverages of carbon. The binding energy of the carbon line observed at 285 eV indicates that the species is organic in nature and is not an inorganic carbonate. This erratic carbon contamination is probably responsible for many of the problems of irreproducibility observed in column preparation.
Columns which were, purged with oxygen while being drawn and carefully handled afterwards showed remarkably less surface carbon. In a similar homogeneity study as previously described, the carbon concentration varied from less than 10 oA to actually no observable carbon. Samples which were exposed to laboratory air without having the ends sealed showed increased carbon concentrations when analyzed again, indicating that much of the carbon found on the surface of the columns probably arises from environmental contamination-
Glass contains metallic cations which function as Lewis acid sites and give glass undesirable chemical activity. A complete discussion of the structure, properties, and reactivity of glass surfaces and their relationship to chromatographic performance is contained. elsewhere21. Controlled acidic leaching removes these sites to form a
362 B. W; WJUGJSX et cd.
silica-rich surface. The formation of such a surface layer greatly minimixes the effects of glass variety on subsequent treatments and lends a higher degree of reproducibility to cohunn preparation.
i Below a pH of about 7, glass is hydrolytically decomposed. The S&U-R bonds rather than the Si-O-Si bonds are cleaved. R, an alkali or alkaline earth ion, can form a water-soluble salt that passes into solution and is replaced by an Hf. The original S&O-R bond is converted to an Si-OH bond and a surface gel is formed. This process is generally thought to be diiusion controlled with the amount of alkali extracted proportional to the square root of time”.
The boric oxide phase, being amphoteric in nature, is also extractable by acidic lea~hing2~. To a lesser extent, the alumina phase is also extractable. Alkaline solutions (e-i. NaOEi) break the Si-OGi bonds and form Si-O-Na and S&OH, thus bringing about the actual dissolution of the silica surface. Rather than an enriched surface layer of silica, a porous surface structure is formed.
In this study, various leaching solutions were evaluated. These included mildly basic solutions, basic solutions followed by acidic solutions, various acidic solutions, and solutions involving complexing agents. Early results indicated that 20% HCl was as effective as any other reagent or combinations of reagents. Also, less structural surface damage was observed when using HCl than other reagents (i.e. NaOH or H3PO& In fact, HCl leaching did no discernible surface roughening as detectable by SEM, although some roughening may have occu.rred on a modular level. This is important since smoother surfaces facilitate more efficient coating. Since the r&e -of extraction of material from the glass surface is proportional to the square root of time, longer leach times produce a silica surface of greater depth and purity. However, the conditions must remain mild enough (i.e. no steam formation) so that longer reaction times do not cause surface roughening.
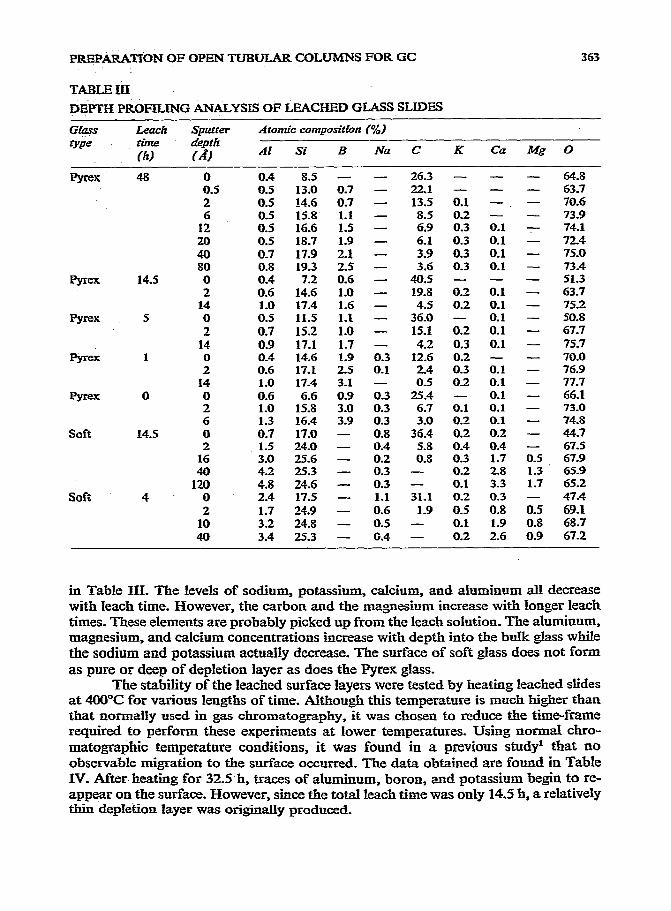
The results of ESCA analyses of Pyrex glass slides leached in 20% HCl are shown in Table III. For unleached glass, the carbon overlayer is decreased from over 25% coverage to less than 7% by sputtering for 1 min which removes the surface material to a depth of approximately 2 A. However, as the slides were leached for longer periods, the carbon concentration increased, indicating that carbon is picked up from the leaching solution. Of particular interest. is the very low initial concen- trations of sodium, potassium, and calchun. Prior to analysis these slides had been rinsed with distilled water which effectively formed a depletion layer of these elements. More impor&~~tiy the boron and the aluminum were depleted as the length of leach increased.
Depth profXng data obtained by ion milling (sputtering) gives an indication of the depth of the purified silica layer (see Table m). It is only the uppermost mono- layers in which signi&ant chromatographic interactions occur. When Pyrex.glass is leached for 48 h the surface of the glass is essentially free from impurities. The aht- minum concentration, present as a trace, is near the detection limits and it-is difficult to verify its existence. Sign&ant quantities of boron do not appear for several mono- layers into the glass. In fact, the boron concentration at about 100 A into the bulk glass is less for glass leached for 48 h than the level of boron just a few angstroms beneath the surface of glass leached for 1 h. As expected, both the aluminumand boron concentrations increase with depth while the carbon contamination decreases.
The surface compositions of soft glass slides leached with 20% HCl are listed
PREPARAtiON OF OPEN TUBULAR COLUMNS FOR GC
TABLE III
363
D~itfTH PRkILING ANALYSIS OF LEACHED GLASS SLIDES
GL9U.T Leach Sputter Atomic composition (o/o)
Al Si B Na C K ca Mg 0
Pyrex 48 0 0.5 2
126 20 40 80
Pyrex 14.5 0 2
14 Pyrex 5 0
2 14
Pyrex 1 0 2
I4 0 0
2 6
Soft 14.5 0 2
16 40
120 Soft 4 0
2 10 40
0.4 8.5 - - 0.5 13.0 0.7 - 0.5 14.6 0.7 - it; 16.6 15.8 1.5 1.1 - -
0.5 18.7 1.9 - 0.7 17.9 2.1 - 0.8 19.3 2.5 - 0.4 7.2 0.6 - 0.6 14.6 1.0 - 1.0 17.4 1.6 - 0.5 11.5 1.1 - 0.7 15.2 1.0 - 0.9 17.1 1.7 - 0.4 14.6 1.9 0.3 0.6 17.1 2.5 0.1 1.0 17.4 3.1 - 0.6 6.6 0.9 0.3 1.0 15.8 3.0 0.3 1.3 16.4 3.9 0.3 0.7 17.0 - 0.8 1.5 24.0 - O-4 3.0 25.6 - 0.2 4.2 2.5.3 - 0.3 4.8 24.6 - 0.3 2.4 17.5 - 1.1 1.7 24.9 - 0.6 3.2 24.8 - 0.5 3.4 25.3 - 0.4
26.3 - - 22.1 - - 13.5 0.1 - 8.5 0.2 - 6.9 0.3 0.1 6.1 0.3 0.1 3.9 0.3 0.1 3.6 0.3 0.1
40.5 - - 19.8 0.2 0.1 4.5 0.2 0.1
36.0 - 0.1 15.1 0.2 0.1 4.2 0.3 0.1
12.6 0.2 - 24 0.3 0.1 0.5 03 0.1
25.4 - 0.1 6.7 0.1 0.1 3.0 0.2 0.1
36.4 0.2 0.2 5.8 0.4 0.4 0.a 0.3 1.7
- 0.2 2.8 - 0.1 3.3 31.1 0.2 0.3 1.9 OS 0.8
- 0.1 1.9 - 0.2 2.6
- 64.8 - 63.7 - 70.6 - 73.9 - 74.1 - 72.4 - 75.0 - 73.4 - 51.3 - 63.7 - 75.2 - 50.8 - 67.7 - 75.7 - 70.0 - 76.9 - 77.7 - 66.1 - 73.0 - 74.8 - 44.7 - 67.5 0.5 67.9 1.3 65.9 1.7 65.2 - 47.4 0.5 69.1 0.8 68.7 0.9 67.2
in Table III. The levels of sodium, potassium, calcium, and aluminum all decrease with leach time. However, the carbon and the magnesium increase with longer leach times. These elements are probably picked up from the leach solution. The aluminum, magnesium, and calcium concentrations increase with depth into the bulk glass while the sodium and potassium actually decrease. The surface of soft glass does not form as pure or deep of depletion layer as does the Pyrex glass.
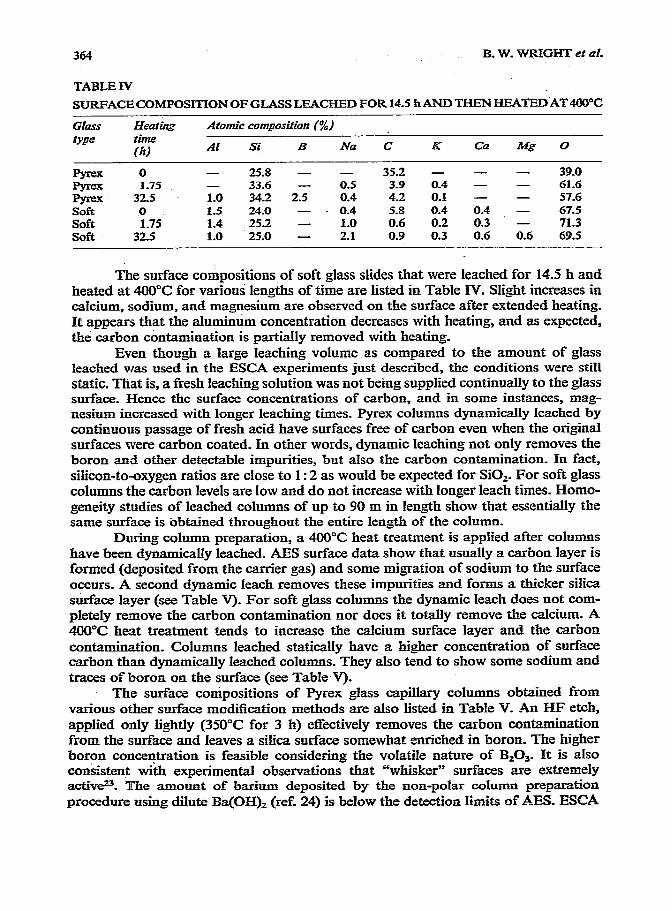
The stability of the leached surface layers were tested by heating leached slides at 400°C for various lengths of time. Although this temperatire is much bigber than that normally used in gas chromatography, it was chosen to reduce the time-frame required to perform these experiments at lower temperatures. Using normal chro- mafogra&ic temperature conditions, it was found in a previous study’ that no
observable migration to the surface occurred. The data obtained are found in Table IV. After. heating for 32.5 h, traces of aluminum, boron, and potassium begin to re- appear on the surface. However, since the total leach time was only 14.5 h, a relatively thin depletion layer was originally produced_
364 B. W. WRIGHT et al.
TABLE IV
SURFACE COMPOSITION OF GLASS LEACHED FOR 14.5 h AND THEN HEATED AT 400°C
GhS
type Heat& time thl
Atomic composition (%)
Al Si B Na C K Ca Mg 0
0 - 25.8 - - 35.2 - - - 39.0 1.75 - 33.6 - 0.5 3.9 0.4 - - 61.6
Pyrex 32.5 1.0 34.2 2.5 0.4 4.2 0.1 - - 57.6 Soft 0 1.5 24-O - - 0.4 5.8 0.4 0.4 - 67.5 Soft 1.7s 1.4 25.2 - 1.0 0.6 0.2 0.3 - 71.3 soft 32s 1.0 25.0 - 2.1 0.9 0.3 0.6 0.6 69.S
The surface compositions of soft glass slides that were leached for 14.5 h and heated at 400°C for various lengths of time are listed in Table IV. Slight increases in caIcium, sodium, and magnesium are observed on the surface after extended heating. It appears that the aluminum concentration decreases with heating, and as expected, the carbon contamination is partially removed with heating.
Even though a large leaching volume as compared to the amount of glass leached was used in the ESCA experiments just described, the conditions were still static. That is, a fresh leaching solution was not being supplied continually to the glass surface. Hence the surface concentrations of carbon, and in some instances, mag- nesium increased with longer leaching rimes. Pyrex columns dynamically leached by continuous passage of fresh acid have surfaces free of carbon even when the original surfaces were carbon coated. In other words, dynamic leaching not only removes the boron and other detectable impurities, but also the carbon contamination. In fact, silicon-to-oxygen ratios are close to 1: 2 as would be expected for SiO,. For soft glass columns the carbon levels are low and do not increase with longer leach times. Homo- geneity studies of leached columns of up to 90 m in length show that essentially the same surface is ;obtained throughout the entire length of the column.
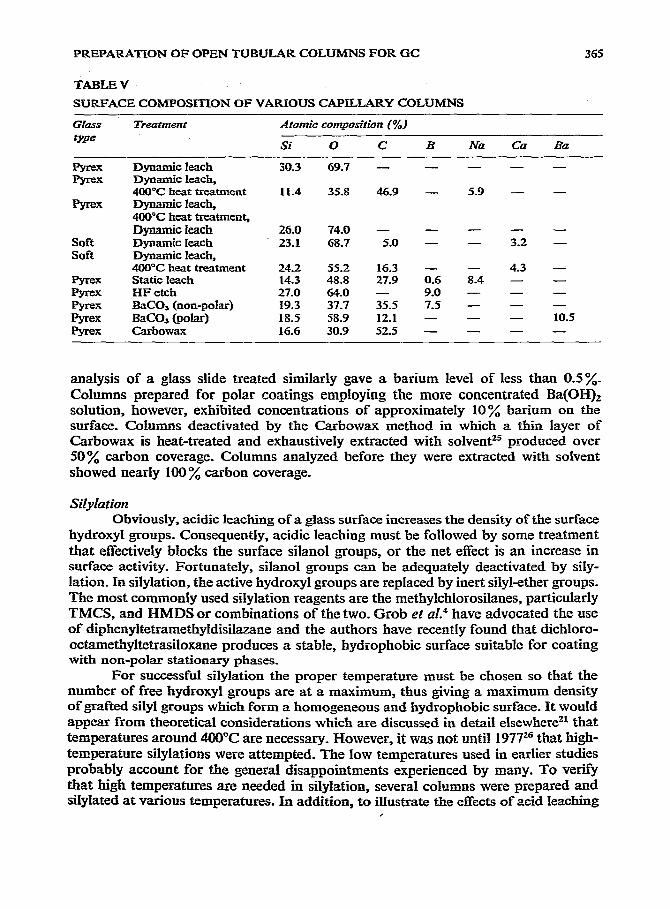
During column preparation, a 400°C heat treatment is applied after columns have been dynamically leached. AES surface data show that usually a carbon layer is formed (deposited from the carrier gas) and some migration of sodium to the surface occurs. A second dynamic leach removes these impurities and forms a thicker silica surface layer (see Table V). For soft glass columns the dynamic leach does not com- pletely remove the carbon contamination nor does it totally remove the calcium. A 400°C heat treatment tends to increase the calcium surface layer and the carbon contamination. Columns leached statically have a higher concentration of surface carbon than dynamically leached columns. They also tend to show some sodium and traces of boron on the surface (see Table V).
The surface conipositions of Pyrex glass capillary columns obtained from various other surface modification methods are also listed in Table V. _4n HF etch, applied only lightly (350°C for 3 h) effectively removes the carbon contamination from the surface and leaves a silica surface somewhat enriched in boron. The higher boron concentration is feasible considering the volatile nature of B,O,. It is also cos.&stent with experimental observations that “whisker” surfaces are extremely act&?_ 7l%e amount of barium deposited by the non-polar column preparation procedure using dilute Ba(OH), (ref. 24) is below the detection limits of AES. ESCA
PREPARATION OF OPEN TUBULAR COLUMNS FOR GC 365
TABLE V SUEWACE COMPOSITION OF VARIOUS CAPILLARY COLUMNS
Gk2S.S we
Atomic composition (%)
Si 0 c B Na Ca Ba
Dynamic leach Dynamic leach, 400°C heat treatment Dynamic leach, 400°C heat treatment, Dynamic Ieach Dynamic leach Dynamic leach, 400°C heat treatment static leach HF etch Baco, (non-polar) BaCO, (polar) Carbowax
30.3 69.7 - - - - -
11.4 35.8 46.9 - 5.9 - -
26.0 74.0 - - - - - 23.1 68.7 5.0 - - 3.2 -
24.2 55.2 16.3 - - 4.3 - 14.3 48.8 27.9 0.6 8.4 - - 27.0 64.0 - 9.0 - - - 19.3 37.7 35.5 7.5 - - - 18.5 58.9 12.1 - - - 10.5 16.6 30.9 52.5 - - - -
analysis of a glass slide treated similarly gave a barium level of less than 0.5%. Columns prepared for polar coatings employing the more concentrated Ba(OH)z solution, however, exhibited concentrations of approximately 10% barium on the surface. Columns deactivated by the Carbowax method in which a thin layer of Carbowax is heat-treated and exhaustively extracted with solvenP produced over 50% carbon coverage. Columns analyzed before they were extracted with solvent showed nearly 100% carbon coverage.
My Zation Obviously, acidic leaching of a glass surface increases the density of the surface
hydroxyl groups. Consequently, acidic leaching must be followed by some treatment that effectively blocks the surface silanol groups, or the net effect is an increase in surface activity. Fortunately, silanol groups can be adequately deactivated by sily- lation. In silylation, the active hydroxyl groups are replaced by inert silyl-ether groups. The most commonly used silylation reagents are the methylchlorosilanes, particularly TMCS, and HMDS or combinations of the two. Grob et al.’ have advocated the use of diphenyltetramethyldisilazane and the authors have recently found that dichloro- octamethyltetrasiloxane produces a stable, hydrophobic surface suitable for coating with norr-polar stationary phases.
For successful silylation the proper temperature must be chosen so that the number of free hydroxyl groups are at a maximum, thus giving a maximum density of grafted silyl groups which form a homogeneous and hydrophobic surface. It would appear from theoretical considerations which are discussed in detail elsewherezl that temperatures around 400°C are necessary. However, it was not until 197726 that high- temperature silylations were attempted. The low temperatures used in earlier studies probably account for the general disappointments experienced by many. To verify that high temperatures are needed in silylation, several columns were prepared and silylated at various temperatures. In addition, to illustrate the effects of acid leaching
I
366 B. W. WRZGEFT et ai.
&chrorn~~0gra@i~ performance, several columns were prepared without ieaching. A -dynamic method of silylation was used. That is, fresh silylation vapors were con- tinually purged through the column which was maintained at a suitable silylation tenqxxa~e. Although this procedure protided an assured excess of silylation reagent, the problem of excess si!ylation as discussed by Grab et aL4 was eliminated. The concentrations of liberated reaction products of the silylation reactioas such a.%N& (from -S) could not build up and react with the glass since the column was constantly purged.
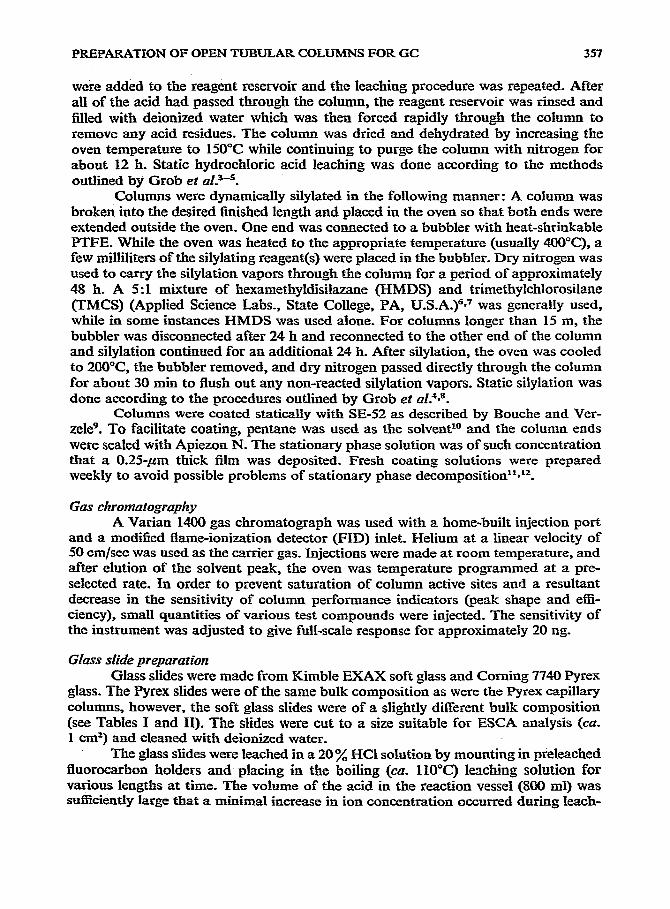
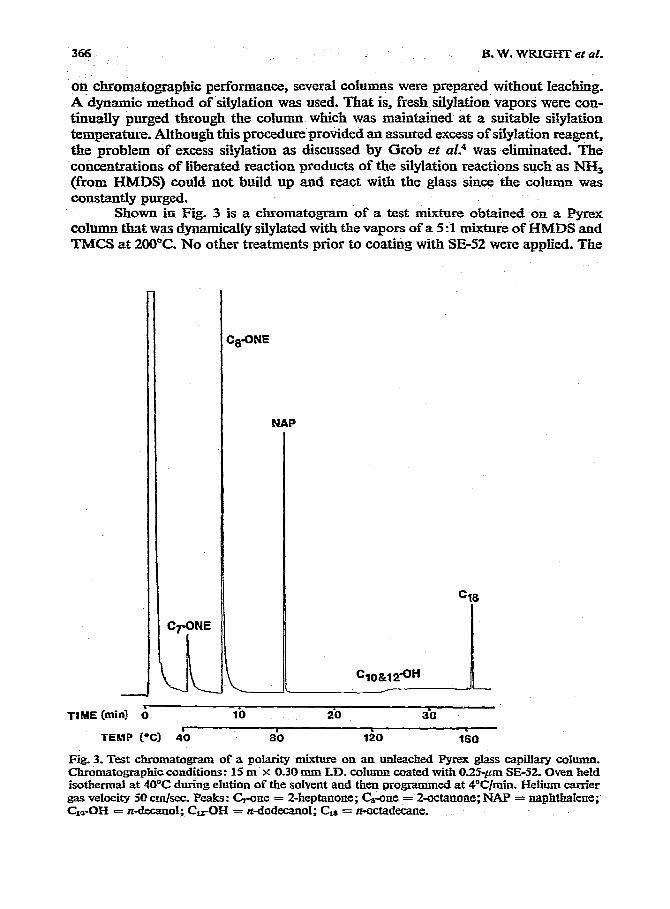
Shown in Fig. 3 is a chromatogram ‘of a test mixture obtained on a Pyrex column that was dynamically silylated with the vapors of a 5 :I mixture of HMDs and TMCS at 200°C. No other treatments prior to coating with SE-52 were applied. The
NAP
r
TIME (min! 0 10 20 30 I
TEhlP i-C) 40 I
80 120 160
Fig. 3. Test chromatogram of a polarity mixture on an unleached Pyrex glass capillary column. Chromatographic conditions: 15 m X 0.30 mm I.D. column coated with 0.25I_rm SE-52. Oven held isothermal at 40°C during elution of the soIve.nt and then programmed at CC/min. Helium carrier gas velocity 50 cm/xc. Peaks: C,-one = 2-heptanone; G-one = 2-octanone; NAP = naph&aIene; Clo_OH = n-ciecanol; C,-OH = n-dodecanol; C,, = n-actadecane.
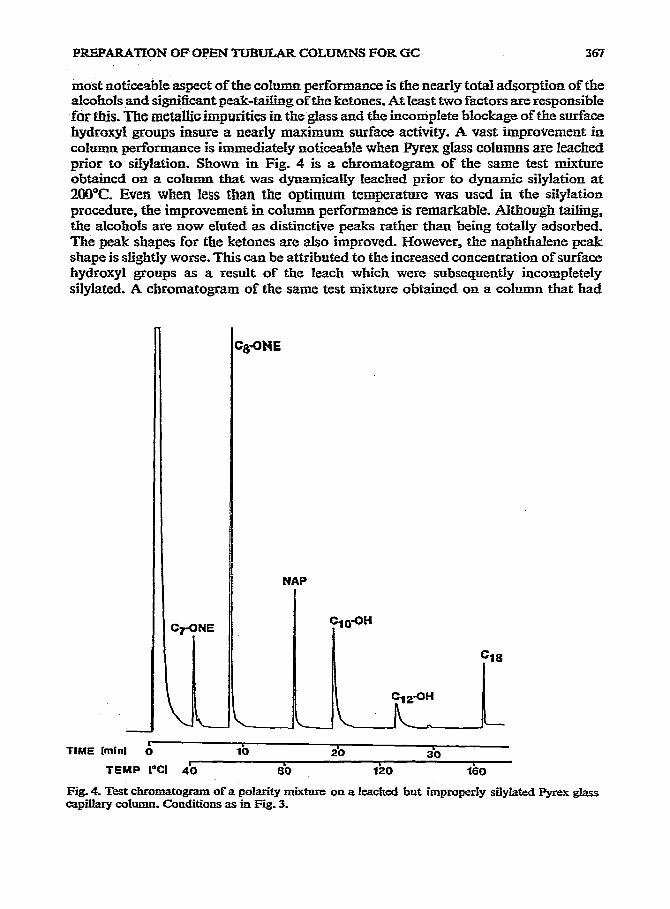
PRSPARATION OF OPEN TUBULAR COL-S FOR GC 367
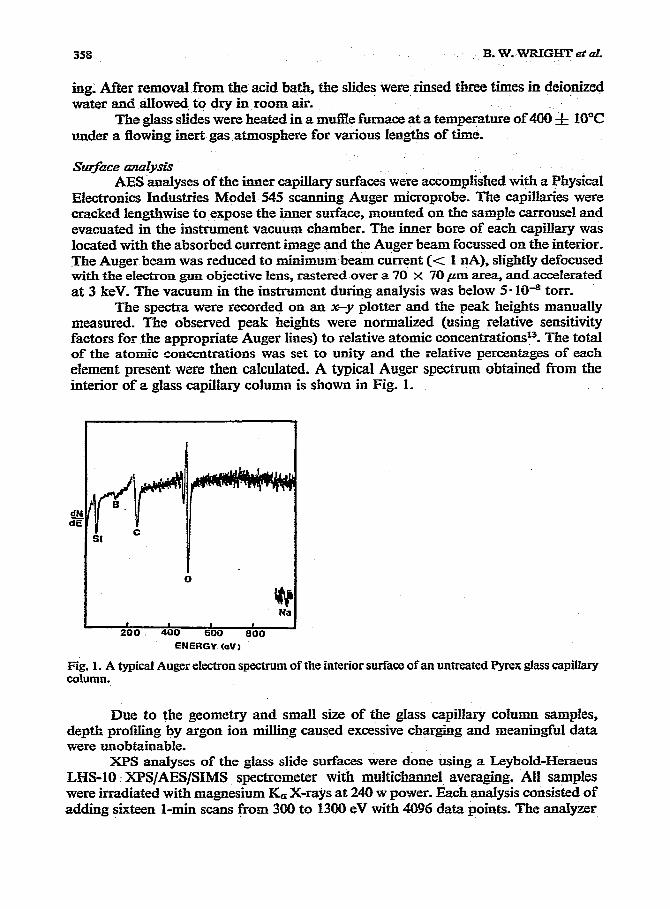
tiost noticeable aspect of the column performance is the m&y total adsorption of the &ohols and signi5i~t peak-tailing of the ketones. At feast two factors are responsible fdt this. The metallic imputities in the-giass and the incomplete blockage of the surf&e hydroxyl groups insure a nearly maximum surface activity. A vast improvement in column performance is immediately noticeable when Pyrex glass c~Iumns are leached prior to silyk&on. Shown in Fig. 4 is a cbromatogram of the same test mixture obtained on a column that was dynamically leached prior to dynamic silyylation at 2OWC. Even when less than the optimum temperame was used in the silylation procedure, the improvement in column performance is remarkable. Although tailing, the alcohols are now eluted as distinctive peaks rather than being totally adsorbed. The peak shapes for the ketones are also improved. However, the naphthalene peak shape is slightly worse. This can be attributed to the increased concentration of surface hydroxyl groups as a resuit of the leach which were subsequently incompletely silylated. A chromatogram of the same test mixture obtained on a column that had
NAP
- L
TIME fminl 0 10 b
20 30 L
TEMP PC1 40 L
80 120 160
Fig. 4. Test chromatogram of a polarity mixture OIL a leached but improperly sirylated Pyrex glass capillary dumn. Conditions as in Fig_ 3.
368 . ,:- -B. W. WRIGHT et. ai.
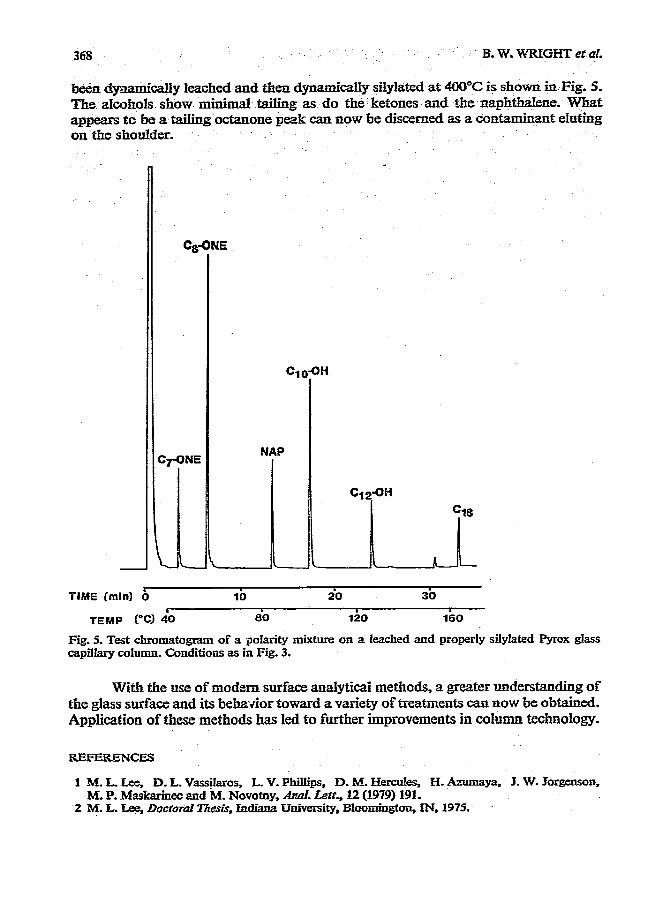
b&x dynaki&lly leached and then dynamically +lylated at 44JO”C is shown-in Fig. 5. Th-, al-ho&. show minimal tailing as do the I ketones azd the. nap&baIene. What appeals to be a tailing octanone peak can noiv be discerned as a contaminant eIufing on the shoulder.
J
C7QNE
i L_
NAP
OH
Cl 2-434
TIME (min) L 0 10 20 30
‘ TEMP (“C) 40 80 120 160
Fig. 5. Test chromatogram of a polarity mixture on a leached aad properly silylated Pyrex &S.S capillary column. Conditions as in Fig. 3.
With the use of modem surface ana.lyti~S methods, a greater understanding of the glass surface and its behavior toward a variety of treatments can now be obtained. Application of these methods has led to further improvements in column technology.
1 M.L.Lee, D.L.Vass+ros, L.V.PhilIips. D.M.Hera&s, ELAnmaya, J. W.Jorgenson. M. P. Maskarinec and M. NoVotny, Anal. Let& 12 (1979) 191.
2 M. L. Lee, Docroral T/i&.., Indiana U nkessity, Bloomington, iN, 1975.
PREPAUTIQN OF OPEN TUBULAR COLUMNS FGR GC 369
3 g. Grab, G. Grob and K. Grab, Jr., Cfrromaf~graphia, LO (1977) 181. 4 K. Gr_qb; G. Grob and K. Grab, Jr., i. High Resolut. Chromatogr. Chromafogr. Common.. 2
(1979) 31. 5 K. Grab, 6. Grab and K. Grob, Jr., J. High Resoiut. Chromatogr. Chromatogr. Commrm.. 2
1979) 527. 6 M. Novotny and K. Ttxarik, Chramcrcagrrrphia, 1 (1968) 332. 7 M. Novofny, L. Blomberg and K. D. BartIe, J. Chror~~&ogr. SC& 8 (1970) 390. 8 K. Grab, G. Grab and K. Grab, Jr.. J. Hfgi? Resolti. Chromarogr. Chromafogr. Commun., 2
(1979) 677. 9 I. Bouche and M. Verzele, J. Gas Chromatogr., 6 (1968) 501.
10 K. Grab, J. High Resolut. Chromatogr. Chromatogr. Common., 1 (1978) 93. 11 K. Grob and G. Grab, I. H&h Resokt. Chromatogr. Chromutogr. Commun.. 1 (1978) 221. 12 A. Venema, L. 6. J. v.d. Ven and H. v-d. Steege, I. High Resolut. Chromatogr. Chromatogr.
Commun., 2 (1979) 69. 13 N&&book of Auger EceCrron Spectroscopy, Physical Electronics fndustries, Eden Prairie, MN,
2nd edm, 1976. 14 C. K. Jorgensen ad H. Berthou, Faanky Di.scuss. Chem. Sot., 54 (1973) 269. 15 H. Berthou and C. K. Jorgensen, Anal. Chem., 47 (1975) 482. 16 C. D. Wagner. AnaC. Chem.. 44 (1972) 1050. 17 S. M. Eudd, in D. E. Day (Editor). G.&s Surfuces, North-Holland, Amsterdam, 1975, p. 55. 18 D. M. Sanders and L. L. Hench. 1. Amer. Cerum. Sot., 52 (1973) 666. 19 L. L. Heuch and D. E. Clark, J. Non-C’~JS~. Soli%, 28 (1978) 83. 20 A. M. Filbert and M. L. Hair. A&an. Cmros. Sci. Tech&., 5 (1976) 1. 21 M. ti. Lee and B. W. Wright, J. Chromatogr., 184 (1980) 235. 22 T. M. Ef-Shamy. J. Jisis and R. W. Douglas, Glass Tech., 13 (1972) 81. 23 G. Schomburg, H. Husmann and F. Weeke, Chromatographia, 10 (1977) 580. 24 K. Grob, Jr., G. Grob and K. Grob, J. High Resolut. Chromatogr. Chromatogr. Commtm., 1
(1978) 149. 25 D. A. Cronin, J. Chromatogr., 97 (1974) 263. 26 Th. WeLscb, W. Engewald and Ch. KIaucIce. Chromatographriz. 10 (1977) 22.


![Novel concepts for fast capillary gas chromatography · The most important breakthrough in gas chromatography was the introduction of open tubular columns by Golay in 1958 [2]. Compared](https://img.pdfslide.net/doc/110x75/602a7cd6983fc41f792ea361/novel-concepts-for-fast-capillary-gas-chromatography-the-most-important-breakthrough.jpg)