Embed Size (px)
Citation preview
2013-14 School Accountability Report Card — Published during the 2014-15 school yearIn accordance with state and federal requirements, the School Accountability Report Card (SARC) is put forth annually by all public schools as a tool for parents and interested parties to stay informed of the school’s progress, test scores and achievements.
Glenknoll Elementary School CDS Code: 30-66647-6030027
6361 Glenknoll Drive Yorba Linda, CA 92886 • Phone: (714) 986-7140 • Grades: K-6 www.glenknoll.org • Douglas Slonkosky, Principal • Email: [email protected]
Superintendent’s MessageDear PYLUSD community,
Orange County historians tell us that the Placentia School District dates back to 1878; Yorba Linda School District formed about 40 years later in 1911. Pioneers in those early years established one-room schoolhouses and, with courage, hard work, and clear vision, laid the foundation for the present-day award-winning education system that we enjoy. I am incredibly proud to serve the Placentia-Yorba Linda Unified School District community as superintendent. Our educational heritage gives me much to be thankful for, as well as a keen desire to be a good steward of all that our schools and students represent and have achieved. Inspired by the past, I welcome all of you to join with me in continuing to build our school communities and equip our students for the future.
In the spirit of building toward the future, our district has undertaken some very important work. Last year marked the launch of The PYLUSD Advantage, a pivotal and significant five-year commitment and plan of action for our school district. Providing a framework for aligning our organization around core values, The PYLUSD Advantage guides our decision-making, aligns the priorities in our programs, and ultimately ensures that all of our students will receive an outstanding and comprehensive education.
People—our students first and foremost, our district employees, families and others in our supportive community—are the heart and soul of the Placentia-Yorba Linda Unified School District. That is clear. To safeguard this vital commitment and to provide a foundation of educational excellence, we have identified five key Focus Areas.
• Academic Achievement: We will expect all students to demonstrate academic achievement in order to emerge college and career ready.
• Effective Instruction and Leadership: We will continue to support a dynamic and high-quality instructional program to build lifelong habits of learning.
• Engaged Community: We will establish a culture that encourages positive relationships among our students, staff, and parents as well as educational and business partners.
• Safe and Respectful Environment: We will foster a safe and respectful atmosphere to promote the emotional health, safety and well-being of students, staff and parents.
• Optimized Resources: We will ensure that all fiscal and capital resources maximize educational opportunities.
The 2014-15 school year provides us an opportunity to write another chapter of new successes and legacy in the history of our school district. We are grateful for the support of each of you—students, staff members, parents, and the community—as we embark on this important work and look forward with much anticipation to a wonderful year.
Sincerely,
Doug Domene, Ed.D. Superintendent
Placentia-Yorba Linda Unified School DistrictDoug Domene, Superintendent Email: [email protected]
1301 E. Orangethorpe Avenue
Placentia, CA 92870 Phone: (714) 986-7000
www.pylusd.org
Para español visita: www.pylusd.org
PYLUSD: Where...
CollaborationCommunicationCritical Thinking
CreativityDigital Citizenship
DiscoveryExcellenceInnovationTeamworkThe Future
Happens!
Core Values - What We Stand For and RepresentExcellence We relentlessly pursue excellence in all academic and organizational endeavors.
Collaboration We work together with all members of our school community to ensure student success.
Integrity We foster relationships that promote respect, service and honesty to ensure the well-being of all students.
Innovation We embrace a culture that celebrates ingenuity and inspires intellectual exploration.
Governing Board
Eric Padget President
Judi Carmona Vice President
Karin Freeman Clerk
Carrie Buck Trustee
Carol Downey Trustee
District Vision StatementWe are committed to being a dynamic learning community that prepares each and every student for success now and in the future.
District Mission StatementWe hold high expectations for all students through rigorous and relevant educational experiences that challenge them to become responsible, ethical, and engaged citizens.
2013-14 School Accountability Report Card2
School SafetyA comprehensive Safe Schools Action Plan has been developed and is reviewed and updated annually by the School Safety Planning Committee. The School Safety Plan was approved by the School Site Council. Two areas of emphasis for this plan are addressed in the following goals: Component 1—to en-sure that all students and staff members are provided with a safe, clean and secure school environment; component 2—to further develop an organizational structure that creates a consistent, safe, proactive and positive climate on our school campus. Repairs and housekeeping are performed in a timely man-ner to ensure that buildings and grounds are safe and attractive. Fire drills are held each month, and there is a schoolwide Disaster Preparedness Plan in place.
The School Safety Plan was last reviewed, updated, and discussed with the school faculty in November 2014.
Principal’s MessageGlenknoll Elementary School has a strong academic and community focus. We are proud to be a Cali-fornia Distinguished School. The Glenknoll Cougars have a history of academic excellence and support for all students. We are a PBIS (Positive Behavior Interventions and Supports) school. Students earn Cougar Cards for positive behaviors, and our PTA provides a student store where students can trade their cards for school supplies and school logo items.
Glenknoll has an active PTA that supports our arts, music, and technology programs. Parents take an active part in the school, assisting in classrooms and providing special events for our staff and students.
School DescriptionGlenknoll Elementary School, located in the city of Yorba Linda, has 510 students in grades K-6. The staff consists of a principal, 16 regular classroom teachers, part-time instrumental and vocal music teachers, and a P.E. teacher. In addition, Glenknoll has a full-time resource specialist and a part-time psychologist and speech therapist. Also supporting the school are a library media clerk, computer lab aide, ELD aide, a secretary, custodian, part-time office clerk, and a part-time health clerk. Students are provided a comprehensive curriculum that includes reading, language arts, mathematics, social sci-ence, science, visual and performing arts, physical education, and health. A computer lab and library media center each provide additional educational opportunities for our students. On-site day care is available.
A wide range of special activities such as field trips, assemblies, sixth grade outdoor science camp, and the school garden provide hands-on experiences and help to make learning fun.
2013-14 School YearDemographics
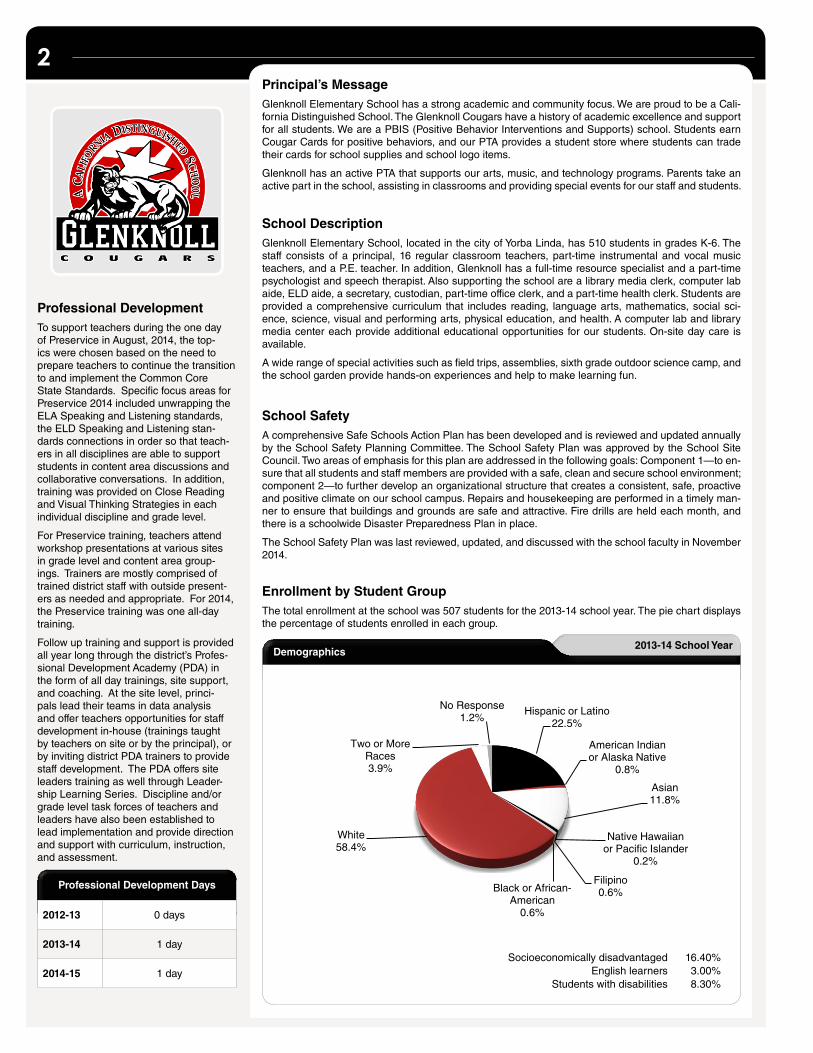
Enrollment by Student GroupThe total enrollment at the school was 507 students for the 2013-14 school year. The pie chart displays the percentage of students enrolled in each group.
Socioeconomically disadvantaged 16.40%English learners 3.00%
Students with disabilities 8.30%
Hispanic or Latino22.5%
American Indian or Alaska Native
0.8%
Asian11.8%
Native Hawaiian or Pacific Islander
0.2%
Filipino0.6%Black or African-
American0.6%
White58.4%
Two or More Races3.9%
No Response 1.2%
Professional DevelopmentTo support teachers during the one day of Preservice in August, 2014, the top-ics were chosen based on the need to prepare teachers to continue the transition to and implement the Common Core State Standards. Specific focus areas for Preservice 2014 included unwrapping the ELA Speaking and Listening standards, the ELD Speaking and Listening stan-dards connections in order so that teach-ers in all disciplines are able to support students in content area discussions and collaborative conversations. In addition, training was provided on Close Reading and Visual Thinking Strategies in each individual discipline and grade level.
For Preservice training, teachers attend workshop presentations at various sites in grade level and content area group-ings. Trainers are mostly comprised of trained district staff with outside present-ers as needed and appropriate. For 2014, the Preservice training was one all-day training.
Follow up training and support is provided all year long through the district’s Profes-sional Development Academy (PDA) in the form of all day trainings, site support, and coaching. At the site level, princi-pals lead their teams in data analysis and offer teachers opportunities for staff development in-house (trainings taught by teachers on site or by the principal), or by inviting district PDA trainers to provide staff development. The PDA offers site leaders training as well through Leader-ship Learning Series. Discipline and/or grade level task forces of teachers and leaders have also been established to lead implementation and provide direction and support with curriculum, instruction, and assessment.
Professional Development Days
2012-13 0 days
2013-14 1 day
2014-15 1 day
33Glenknoll Elementary School
2013-14 School Accountability Report Card
2013-14 Enrollment by Grade
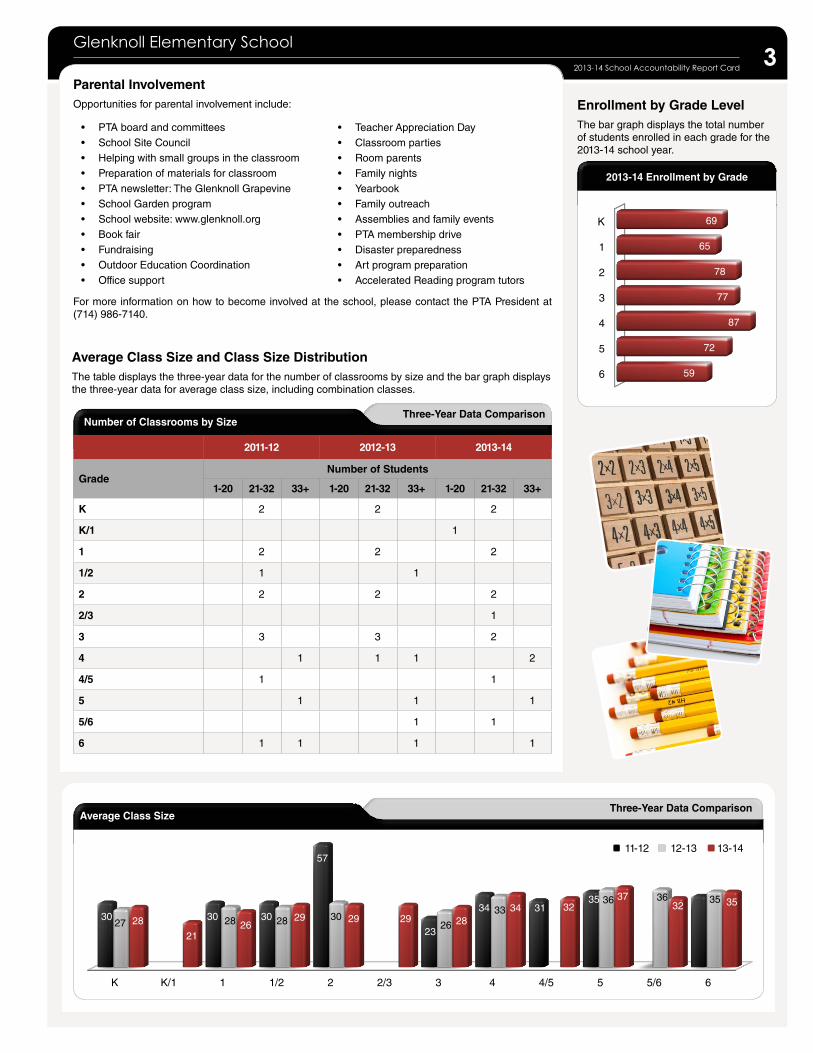
Enrollment by Grade LevelThe bar graph displays the total number of students enrolled in each grade for the 2013-14 school year.
K
1
2
3
4
5
6
69
65
78
77
87
72
59
Parental InvolvementOpportunities for parental involvement include:
• Teacher Appreciation Day• Classroom parties• Room parents• Family nights• Yearbook• Family outreach• Assemblies and family events• PTA membership drive• Disaster preparedness• Art program preparation• Accelerated Reading program tutors
• PTA board and committees• School Site Council• Helping with small groups in the classroom• Preparation of materials for classroom• PTA newsletter: The Glenknoll Grapevine• School Garden program• School website: www.glenknoll.org• Book fair• Fundraising• Outdoor Education Coordination• Office support
For more information on how to become involved at the school, please contact the PTA President at (714) 986-7140.
Average Class SizeThree-Year Data Comparison
Three-Year Data ComparisonNumber of Classrooms by Size
2011-12 2012-13 2013-14
Grade Number of Students
1-20 21-32 33+ 1-20 21-32 33+ 1-20 21-32 33+
K 2 2 2
K/1 1
1 2 2 2
1/2 1 1
2 2 2 2
2/3 1
3 3 3 2
4 1 1 1 2
4/5 1 1
5 1 1 1
5/6 1 1
6 1 1 1 1
Average Class Size and Class Size DistributionThe table displays the three-year data for the number of classrooms by size and the bar graph displays the three-year data for average class size, including combination classes.
11-12 12-13 13-14
K K/1 1 1/2 2 2/3 3 4 4/5 5 5/6 6
30 30 30
57
23
34 3135
33
27 28 28 3026
3336 36 35
28
2126
29 29 29 2834 32
3732 35
2013-14 School Accountability Report Card4
v Scores are not shown when the number of students tested is 10 or less, either because the number of students tested in this category is too small for statistical accuracy or to protect student privacy.
Spring 2014 ResultsStudents Scoring at Proficient or Advanced Levels
Group Science
All students in the district 78%
All students at the school 76%
Male 77%
Female 76%
Black or African-American v
American Indian or Alaska Native v
Asian v
Filipino v
Hispanic or Latino 72%
Native Hawaiian or Pacific Islander v
White 74%
Two or more races v
Socioeconomically disadvantaged 85%
English learners v
Students with disabilities v
Students receiving Migrant Education services v
Three-Year Data ComparisonStudents Scoring at Proficient or Advanced Levels
Glenknoll ES Placentia-Yorba Linda USD California
Subject 10-11 11-12 12-13 10-11 11-12 12-13 10-11 11-12 12-13
English language arts 86% 83% 85% 69% 71% 71% 54% 56% 55%
Mathematics 88% 88% 89% 69% 70% 71% 49% 50% 50%
Standardized Testing and Reporting Results for All Students The table below shows the percentage of students who scored at Proficient or Advanced levels (meeting or exceeding state standards) in English language arts and mathematics. Because of the new CAASPP field-testing in the spring of 2014, there are no scores to be reported. The last available scores under the STAR Program are shown.
California Assessment of Student Performance and Progress Results by Student Group: Science (grades 5, 8 and 10)
California Assessment of Student Performance and Progress/Standardized Testing and Reporting Results Beginning in the 2013-14 school year, the Standardized Testing and Report-ing (STAR) Program was eliminated and replaced by a new set of assess-ments called the California Assessment of Student Performance and Progress (CAASPP).
Because of the state’s adoption of the Common Core State Standards and implementation of a new student-testing system, limited data is available to report in the SARC.
For the 2013-14 school year, the CAASPP included the Smarter Balanced Assess-ments, alternate, science, and other optional assessments.
In the spring of 2014, California began field-testing the Smarter Balanced Assessments in English language arts and mathematics. These tests were not officially scored, so there is no data to report.
The science assessments of CAASPP included the California Standards Test (CST), California Modified Assessment (CMA) and California Alternate Perfor-mance Assessment (CAPA), similar to the STAR Program. Therefore it is acceptable to make comparisons to previous year results.
The CST is a multiple-choice test in sci-ence for varying grade levels. The CMA is a modified assessment for students with disabilities who have an Individual-ized Education Plan (IEP). The CAPA is an alternate assessment for students with significant cognitive disabilities who are unable to take the CST with accommoda-tions or modifications, or the CMA with accommodations.
For more information on the CAASPP assessments, please visit www.cde.ca.gov/ta/tg/ca.
Three-Year Data ComparisonStudents Scoring at Proficient or Advanced Levels
Glenknoll ES Placentia-Yorba Linda USD California
Subject 11-12 12-13 13-14 11-12 12-13 13-14 11-12 12-13 13-14
Science 88% 89% 76% 74% 76% 78% 60% 59% 60%
California Assessment of Student Performance and Progress Results: Science (grades 5, 8 and 10)The tables show the percentage of students in grades 5, 8 and 10 who scored at Proficient or Advanced levels (meeting or exceeding state standards) in science.
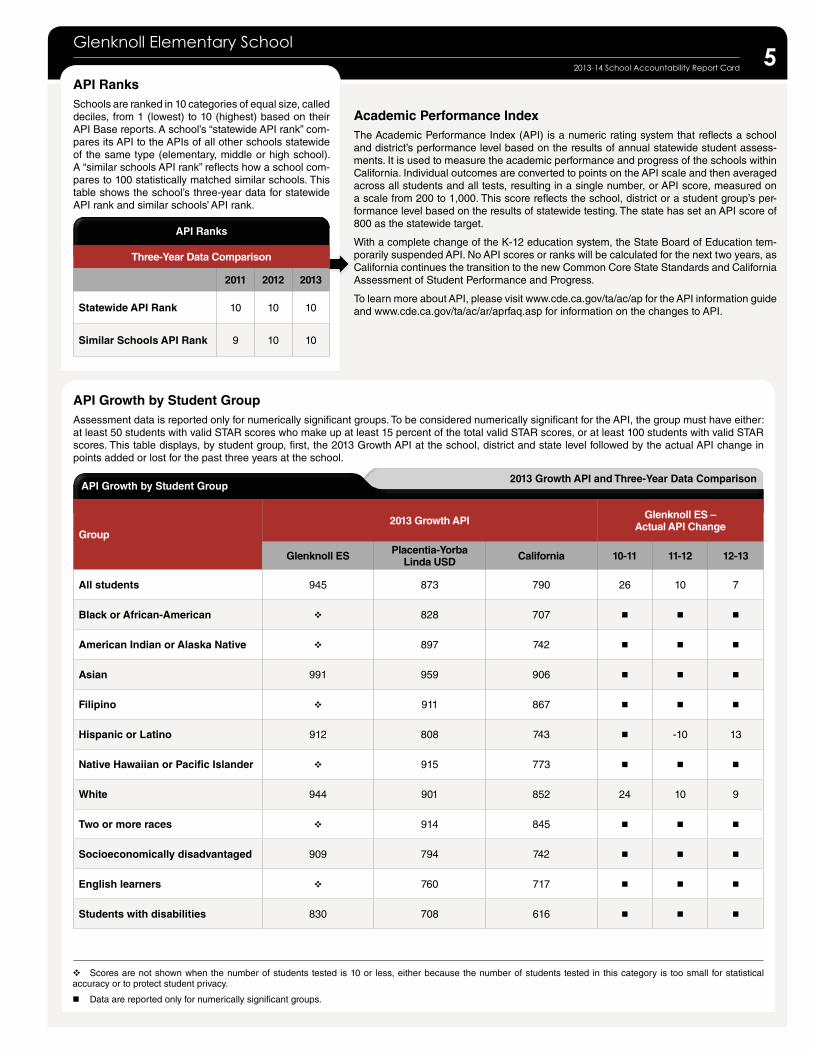
Academic Performance IndexThe Academic Performance Index (API) is a numeric rating system that reflects a school and district’s performance level based on the results of annual statewide student assess-ments. It is used to measure the academic performance and progress of the schools within California. Individual outcomes are converted to points on the API scale and then averaged across all students and all tests, resulting in a single number, or API score, measured on a scale from 200 to 1,000. This score reflects the school, district or a student group’s per-formance level based on the results of statewide testing. The state has set an API score of 800 as the statewide target.
With a complete change of the K-12 education system, the State Board of Education tem-porarily suspended API. No API scores or ranks will be calculated for the next two years, as California continues the transition to the new Common Core State Standards and California Assessment of Student Performance and Progress.
To learn more about API, please visit www.cde.ca.gov/ta/ac/ap for the API information guide and www.cde.ca.gov/ta/ac/ar/aprfaq.asp for information on the changes to API.
5Glenknoll Elementary School
2013-14 School Accountability Report Card
API Ranks
Three-Year Data Comparison
2011 2012 2013
Statewide API Rank 10 10 10
Similar Schools API Rank 9 10 10
nData are reported only for numerically significant groups.
v Scores are not shown when the number of students tested is 10 or less, either because the number of students tested in this category is too small for statistical accuracy or to protect student privacy.
2013 Growth API and Three-Year Data ComparisonAPI Growth by Student Group
Group2013 Growth API Glenknoll ES –
Actual API Change
Glenknoll ES Placentia-Yorba Linda USD California 10-11 11-12 12-13
All students 945 873 790 26 10 7
Black or African-American v 828 707 n n n
American Indian or Alaska Native v 897 742 n n n
Asian 991 959 906 n n n
Filipino v 911 867 n n n
Hispanic or Latino 912 808 743 n -10 13
Native Hawaiian or Pacific Islander v 915 773 n n n
White 944 901 852 24 10 9
Two or more races v 914 845 n n n
Socioeconomically disadvantaged 909 794 742 n n n
English learners v 760 717 n n n
Students with disabilities 830 708 616 n n n
API Growth by Student GroupAssessment data is reported only for numerically significant groups. To be considered numerically significant for the API, the group must have either: at least 50 students with valid STAR scores who make up at least 15 percent of the total valid STAR scores, or at least 100 students with valid STAR scores. This table displays, by student group, first, the 2013 Growth API at the school, district and state level followed by the actual API change in points added or lost for the past three years at the school.
API RanksSchools are ranked in 10 categories of equal size, called deciles, from 1 (lowest) to 10 (highest) based on their API Base reports. A school’s “statewide API rank” com-pares its API to the APIs of all other schools statewide of the same type (elementary, middle or high school). A “similar schools API rank” reflects how a school com-pares to 100 statistically matched similar schools. This table shows the school’s three-year data for statewide API rank and similar schools’ API rank.
2013-14 School Accountability Report Card6
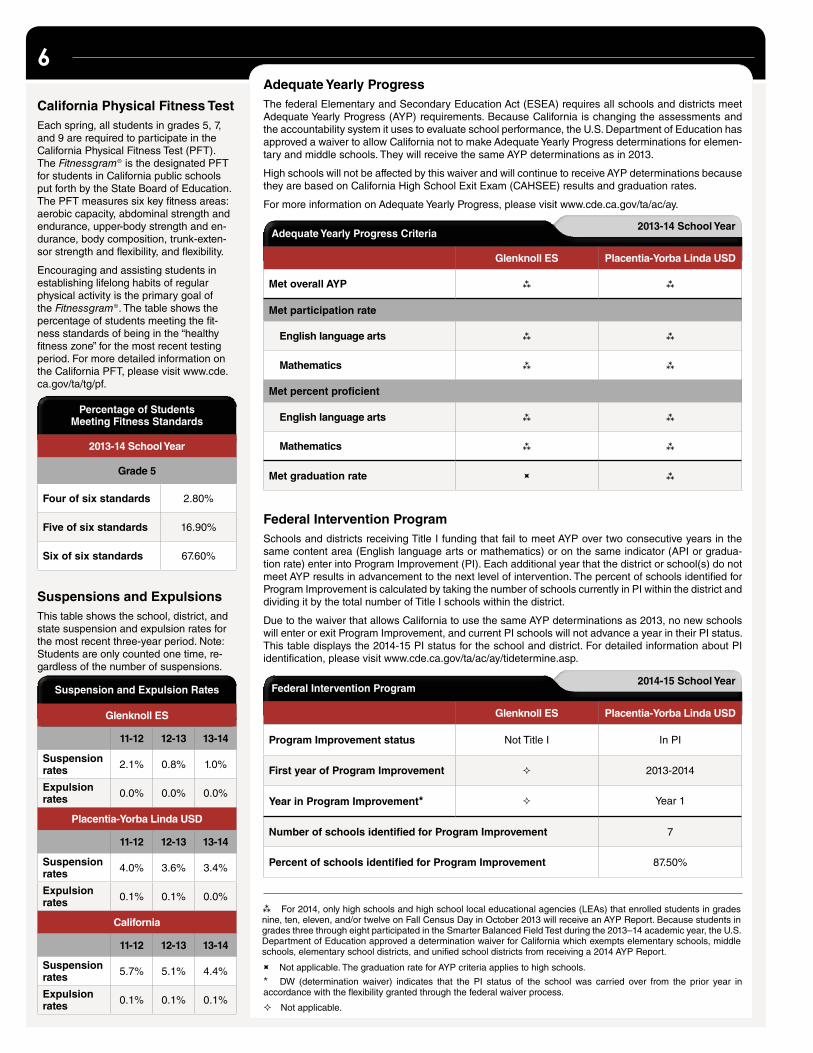
2013-14 School YearAdequate Yearly Progress Criteria
Glenknoll ES Placentia-Yorba Linda USD
Met overall AYP
Met participation rate
English language arts
Mathematics
Met percent proficient
English language arts
Mathematics
Met graduation rate ÷
Adequate Yearly ProgressThe federal Elementary and Secondary Education Act (ESEA) requires all schools and districts meet Adequate Yearly Progress (AYP) requirements. Because California is changing the assessments and the accountability system it uses to evaluate school performance, the U.S. Department of Education has approved a waiver to allow California not to make Adequate Yearly Progress determinations for elemen-tary and middle schools. They will receive the same AYP determinations as in 2013.
High schools will not be affected by this waiver and will continue to receive AYP determinations because they are based on California High School Exit Exam (CAHSEE) results and graduation rates.
For more information on Adequate Yearly Progress, please visit www.cde.ca.gov/ta/ac/ay.
2014-15 School YearFederal Intervention Program
Glenknoll ES Placentia-Yorba Linda USD
Program Improvement status Not Title I In PI
First year of Program Improvement ² 2013-2014
Year in Program Improvement* ² Year 1
Number of schools identified for Program Improvement 7
Percent of schools identified for Program Improvement 87.50%
Federal Intervention ProgramSchools and districts receiving Title I funding that fail to meet AYP over two consecutive years in the same content area (English language arts or mathematics) or on the same indicator (API or gradua-tion rate) enter into Program Improvement (PI). Each additional year that the district or school(s) do not meet AYP results in advancement to the next level of intervention. The percent of schools identified for Program Improvement is calculated by taking the number of schools currently in PI within the district and dividing it by the total number of Title I schools within the district.
Due to the waiver that allows California to use the same AYP determinations as 2013, no new schools will enter or exit Program Improvement, and current PI schools will not advance a year in their PI status. This table displays the 2014-15 PI status for the school and district. For detailed information about PI identification, please visit www.cde.ca.gov/ta/ac/ay/tidetermine.asp.
Percentage of Students Meeting Fitness Standards
2013-14 School Year
Grade 5
Four of six standards 2.80%
Five of six standards 16.90%
Six of six standards 67.60%
² Not applicable.
For 2014, only high schools and high school local educational agencies (LEAs) that enrolled students in grades nine, ten, eleven, and/or twelve on Fall Census Day in October 2013 will receive an AYP Report. Because students in grades three through eight participated in the Smarter Balanced Field Test during the 2013–14 academic year, the U.S. Department of Education approved a determination waiver for California which exempts elementary schools, middle schools, elementary school districts, and unified school districts from receiving a 2014 AYP Report.
÷ Not applicable. The graduation rate for AYP criteria applies to high schools.
DW (determination waiver) indicates that the PI status of the school was carried over from the prior year in accordance with the flexibility granted through the federal waiver process.*
California Physical Fitness TestEach spring, all students in grades 5, 7, and 9 are required to participate in the California Physical Fitness Test (PFT). The Fitnessgram® is the designated PFT for students in California public schools put forth by the State Board of Education. The PFT measures six key fitness areas: aerobic capacity, abdominal strength and endurance, upper-body strength and en-durance, body composition, trunk-exten-sor strength and flexibility, and flexibility.
Encouraging and assisting students in establishing lifelong habits of regular physical activity is the primary goal of the Fitnessgram®. The table shows the percentage of students meeting the fit-ness standards of being in the “healthy fitness zone” for the most recent testing period. For more detailed information on the California PFT, please visit www.cde.ca.gov/ta/tg/pf.
Suspension and Expulsion Rates
Glenknoll ES
11-12 12-13 13-14
Suspension rates 2.1% 0.8% 1.0%
Expulsion rates 0.0% 0.0% 0.0%
Placentia-Yorba Linda USD
11-12 12-13 13-14
Suspension rates 4.0% 3.6% 3.4%
Expulsion rates 0.1% 0.1% 0.0%
California
11-12 12-13 13-14
Suspension rates 5.7% 5.1% 4.4%
Expulsion rates 0.1% 0.1% 0.1%
Suspensions and ExpulsionsThis table shows the school, district, and state suspension and expulsion rates for the most recent three-year period. Note: Students are only counted one time, re-gardless of the number of suspensions.
77Glenknoll Elementary School
2013-14 School Accountability Report Card
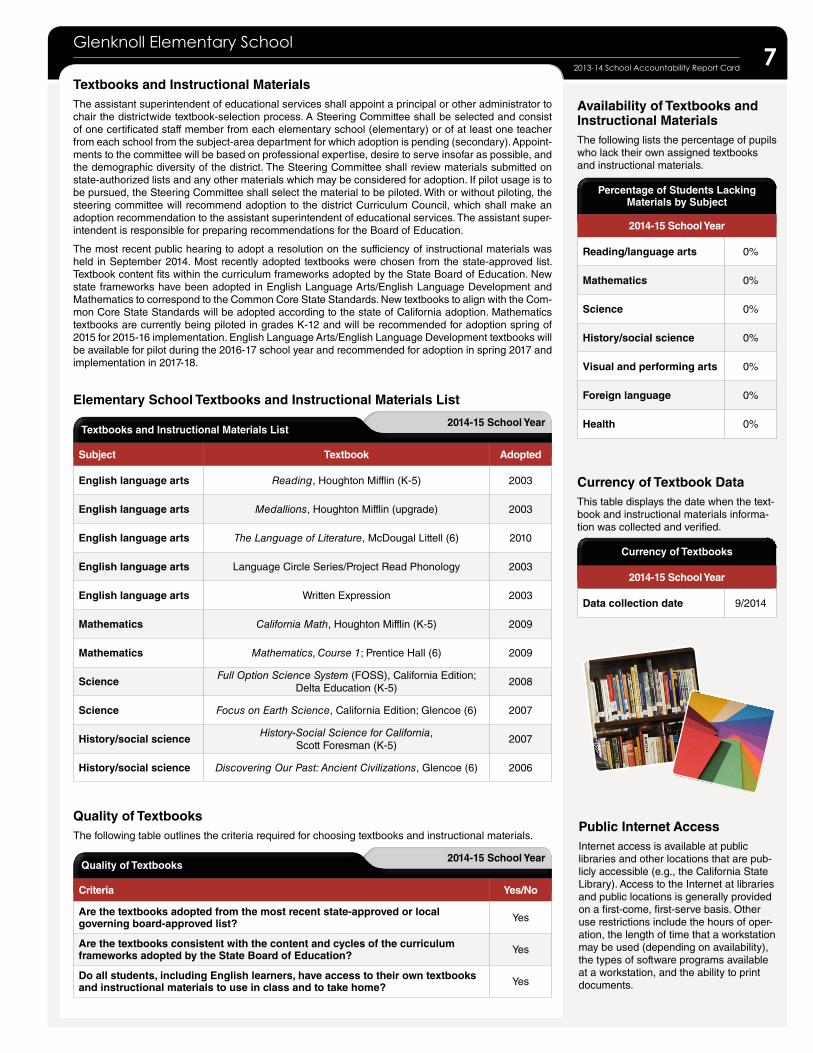
Percentage of Students Lacking Materials by Subject
2014-15 School Year
Reading/language arts 0%
Mathematics 0%
Science 0%
History/social science 0%
Visual and performing arts 0%
Foreign language 0%
Health 0%
Textbooks and Instructional MaterialsThe assistant superintendent of educational services shall appoint a principal or other administrator to chair the districtwide textbook-selection process. A Steering Committee shall be selected and consist of one certificated staff member from each elementary school (elementary) or of at least one teacher from each school from the subject-area department for which adoption is pending (secondary). Appoint-ments to the committee will be based on professional expertise, desire to serve insofar as possible, and the demographic diversity of the district. The Steering Committee shall review materials submitted on state-authorized lists and any other materials which may be considered for adoption. If pilot usage is to be pursued, the Steering Committee shall select the material to be piloted. With or without piloting, the steering committee will recommend adoption to the district Curriculum Council, which shall make an adoption recommendation to the assistant superintendent of educational services. The assistant super-intendent is responsible for preparing recommendations for the Board of Education.
The most recent public hearing to adopt a resolution on the sufficiency of instructional materials was held in September 2014. Most recently adopted textbooks were chosen from the state-approved list. Textbook content fits within the curriculum frameworks adopted by the State Board of Education. New state frameworks have been adopted in English Language Arts/English Language Development and Mathematics to correspond to the Common Core State Standards. New textbooks to align with the Com-mon Core State Standards will be adopted according to the state of California adoption. Mathematics textbooks are currently being piloted in grades K-12 and will be recommended for adoption spring of 2015 for 2015-16 implementation. English Language Arts/English Language Development textbooks will be available for pilot during the 2016-17 school year and recommended for adoption in spring 2017 and implementation in 2017-18.
2014-15 School YearQuality of Textbooks
Criteria Yes/No
Are the textbooks adopted from the most recent state-approved or local governing board-approved list? Yes
Are the textbooks consistent with the content and cycles of the curriculum frameworks adopted by the State Board of Education? Yes
Do all students, including English learners, have access to their own textbooks and instructional materials to use in class and to take home? Yes
Quality of TextbooksThe following table outlines the criteria required for choosing textbooks and instructional materials.
Availability of Textbooks and Instructional MaterialsThe following lists the percentage of pupils who lack their own assigned textbooks and instructional materials.
Currency of Textbooks
2014-15 School Year
Data collection date 9/2014
Currency of Textbook DataThis table displays the date when the text-book and instructional materials informa-tion was collected and verified.
Public Internet AccessInternet access is available at public libraries and other locations that are pub-licly accessible (e.g., the California State Library). Access to the Internet at libraries and public locations is generally provided on a first-come, first-serve basis. Other use restrictions include the hours of oper-ation, the length of time that a workstation may be used (depending on availability), the types of software programs available at a workstation, and the ability to print documents.
2014-15 School YearTextbooks and Instructional Materials List
Subject Textbook Adopted
English language arts Reading, Houghton Mifflin (K-5) 2003
English language arts Medallions, Houghton Mifflin (upgrade) 2003
English language arts The Language of Literature, McDougal Littell (6) 2010
English language arts Language Circle Series/Project Read Phonology 2003
English language arts Written Expression 2003
Mathematics California Math, Houghton Mifflin (K-5) 2009
Mathematics Mathematics, Course 1; Prentice Hall (6) 2009
Science Full Option Science System (FOSS), California Edition; Delta Education (K-5)
2008
Science Focus on Earth Science, California Edition; Glencoe (6) 2007
History/social science History-Social Science for California, Scott Foresman (K-5)
2007
History/social science Discovering Our Past: Ancient Civilizations, Glencoe (6) 2006
Elementary School Textbooks and Instructional Materials List
2013-14 School Accountability Report Card8
2014-15 School Year
2014-15 School Year
Deficiencies and Repairs
Items Inspected Deficiencies, Action Taken or Planned, and Date of Action
Systems Fixed sewage plumbing issue outside room 504 -10/31/2014.
Cleanliness Pest control for large ant hills on primary playground - 11/24/2014.
Electrical Checked wiring plugs after reports of sparked outlets. Fixed on 10/21/2014.
Restrooms/fountainsRepaired toilet in girl’s restroom on 10/20/2014. Fixed leaking toilet in women’s staff restroom - 10/22/2014. Repaired toilet in girls portable restroom - 10/31/2014
External Replaced lifted concrete near multi-purpose room - 10/29/2014. Fixed lock on door to custodial room - 10/27/2014.
• Systems: Gas systems and pipes, sewer, mechanical systems (heating, ventilation and air-conditioning)
• Interior: Interior surfaces (floors, ceilings, walls and window casings)
• Cleanliness: Pest and vermin control, overall cleanliness (school grounds, buildings, rooms and common areas)
• Electrical: Electrical systems (interior and exterior)
• Restrooms/fountains: Restrooms, sinks/drinking fountains (interior and exterior)
• Safety: Fire-safety equipment, emergency systems, hazardous materials (interior and exterior)
• Structural: Structural damage, roofs
• External: Windows, doors, gates, fences, playgrounds, school grounds
School Facility Items Inspected The tables show the results of the school’s most recent inspection using the Facility Inspection Tool (FIT) or equivalent school form. The following is a list of items inspected.
School Facility Good Repair Status This inspection determines the school facility’s good repair status using ratings of good condition, fair condition or poor condition. The overall summary of facility conditions uses ratings of exemplary, good, fair or poor.
School Facility Good Repair Status
Items Inspected Repair Status Items Inspected Repair Status
Systems Good Restrooms/fountains Good
Interior Good Safety Good
Cleanliness Good Structural Good
Electrical Good External Good
Overall summary of facility conditions Good
Date of the most recent school site inspection 10/7/2014
Date of the most recent completion of the inspection form 10/7/2014
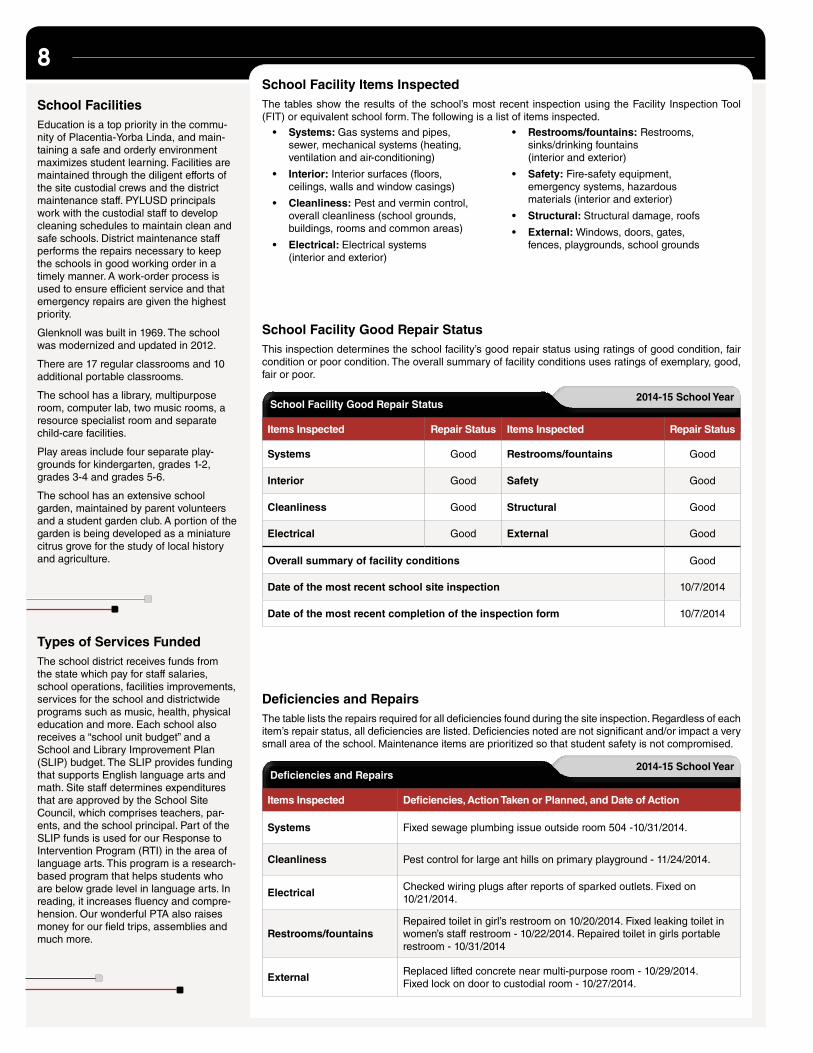
School FacilitiesEducation is a top priority in the commu-nity of Placentia-Yorba Linda, and main-taining a safe and orderly environment maximizes student learning. Facilities are maintained through the diligent efforts of the site custodial crews and the district maintenance staff. PYLUSD principals work with the custodial staff to develop cleaning schedules to maintain clean and safe schools. District maintenance staff performs the repairs necessary to keep the schools in good working order in a timely manner. A work-order process is used to ensure efficient service and that emergency repairs are given the highest priority.
Glenknoll was built in 1969. The school was modernized and updated in 2012.
There are 17 regular classrooms and 10 additional portable classrooms.
The school has a library, multipurpose room, computer lab, two music rooms, a resource specialist room and separate child-care facilities.
Play areas include four separate play-grounds for kindergarten, grades 1-2, grades 3-4 and grades 5-6.
The school has an extensive school garden, maintained by parent volunteers and a student garden club. A portion of the garden is being developed as a miniature citrus grove for the study of local history and agriculture.
Deficiencies and RepairsThe table lists the repairs required for all deficiencies found during the site inspection. Regardless of each item’s repair status, all deficiencies are listed. Deficiencies noted are not significant and/or impact a very small area of the school. Maintenance items are prioritized so that student safety is not compromised.
Types of Services FundedThe school district receives funds from the state which pay for staff salaries, school operations, facilities improvements, services for the school and districtwide programs such as music, health, physical education and more. Each school also receives a “school unit budget” and a School and Library Improvement Plan (SLIP) budget. The SLIP provides funding that supports English language arts and math. Site staff determines expenditures that are approved by the School Site Council, which comprises teachers, par-ents, and the school principal. Part of the SLIP funds is used for our Response to Intervention Program (RTI) in the area of language arts. This program is a research-based program that helps students who are below grade level in language arts. In reading, it increases fluency and compre-hension. Our wonderful PTA also raises money for our field trips, assemblies and much more.
99Glenknoll Elementary School
2013-14 School Accountability Report Card
²Not applicable.
Three-Year Data Comparison
Three-Year Data ComparisonTeacher Misassignments and Vacant Teacher Positions
Glenknoll ES
Teachers 12-13 13-14 14-15
Teacher misassignments of English learners 0 0 0
Total teacher misassignments 0 0 0
Vacant teacher positions 0 0 0
2013-14 School YearNo Child Left Behind Compliant Teachers
Percent of Classes in Core Academic Subjects
Taught by Highly Qualified Teachers
Not Taught by Highly Qualified Teachers
Glenknoll ES 100.00% 0.00%
All schools in district 99.16% 0.84%
High-poverty schools in district 99.29% 0.71%
Low-poverty schools in district 99.09% 0.91%
Teacher QualificationsThis table shows information about teacher credentials and teacher qualifications. Teachers without a full credential include teachers with district and university internships, pre-internships, emergency or other permits, and waivers. For more information on teacher credentials, visit www.ctc.ca.gov.
Teacher Misassignments and Vacant Teacher PositionsThis table displays the number of teacher misassignments (positions filled by teachers who lack legal authorization to teach that grade level, subject area, student group, etc.) and the number of vacant teacher positions (not filled by a single designated teacher assigned to teach the entire course at the beginning of the school year or semester). Please note total teacher misassignments includes the num-ber of teacher misassignments of English learners.
Core Academic Classes Taught by Highly Qualified TeachersThe No Child Left Behind Act (NCLB) extended ESEA to require that core academic subjects be taught by Highly Qualified Teachers, defined as having at least a bachelor’s degree, an appropriate California teaching credential, and demonstrated competence for each core academic subject area he or she teaches. The table displays data regarding highly qualified teachers from the 2013-14 school year.
High-poverty schools are defined as those schools with student participation of approximately 40 per-cent or more in the free and reduced priced meals program. Low-poverty schools are those with student participation of approximately 39 percent or less in the free and reduced priced meals program. For more information on teacher qualifications related to NCLB, visit www.cde.ca.gov/nclb/sr/tq.
Academic Counselors and School Support Staff Data
2013-14 School Year
Academic Counselors
FTE of academic counselors 0.0
Ratio of students per academic counselor ²
Support Staff FTE
Social/behavioral or career development counselors 0.2
Library media teacher (librarian) 0.0
Library media services staff (paraprofessional) 0.5
Psychologist 0.2
Social worker 0.0
Nurse On call
Speech/language/hearing specialist 0.2
Resource specialist (non-teaching) 0.0
Academic Counselors and School Support StaffThis table displays information about aca-demic counselors and support staff at the school and their full-time equivalent (FTE).
Teacher Credential Information
Placentia-Yorba Linda USD Glenknoll ES
Teachers 14-15 12-13 13-14 14-15
With full credential 1,058 18 19 22
Without full credential 2 0 0 0
Teaching outside subject area of competence 4 0 0 0
School Mission StatementThe mission of Glenknoll Elementary School is to provide a stimulating and nur-turing environment that supports student academic and personal successes as they acquire the knowledge and develop the skills and creativity necessary to participate effectively in an ever-changing society. All students are encouraged to strive for academic, social, and per-sonal excellence and to provide service to others. Staff and parents believe that all students can achieve high-academic standards, and at Glenknoll, every student is expected and supported to learn.

Data for this year’s SARC was provided by the California Department of Education (CDE), school, and district offices. For additional information on California schools and districts, please visit DataQuest at http://data1.cde.ca.gov/dataquest. DataQuest is an online resource that provides reports for accountability, test data, enrollment, graduates, dropouts, course enrollments, staffing, and data regarding English learners. For further information regarding the data elements and terms used in the SARC see the Academic Performance Index Reports Information Guide located on the CDE API Web page at www.cde.ca.gov/ta/ac/ap. Per Education Code Section 35256, each school district shall make hard copies of its annually updated report card available, upon request, on or before February 1 of each year.
All data accurate as of December 2014.
School Accountability Report Card
PubliShed by:
www.sia-us.com | 800.487.9234
10
School Financial Data
2012-13 Fiscal Year
Total expenditures per pupil $4,564
Expenditures per pupil from restricted sources $409
Expenditures per pupil from unrestricted sources $4,155
Annual average teacher salary $79,253
School Financial DataThe following table displays the school’s average teacher salary and a breakdown of the school’s expenditures per pupil from unrestricted and restricted sources.
Expenditures Per PupilSupplemental/restricted expenditures come from money whose use is controlled by law or by a donor. Money that is designated for specific purposes by the district or governing board is not consid-ered restricted. Basic/unrestricted expen-ditures are from money whose use, except for general guidelines, is not controlled by law or by a donor.
Financial Data The financial data displayed in this SARC is from the 2012-13 fiscal year. The most current fiscal infor-mation available provided by the state is always two years behind the current school year, and one year behind most other data included in this report. For detailed information on school expenditures for all districts in California, see the CDE Current Expense of Education & Per-pupil Spending Web page at www.cde.ca.gov/ds/fd/ec. For information on teacher salaries for all districts in California, see the CDE Certificated Salaries & Benefits Web page at www.cde.ca.gov/ds/fd/cs. To look up expenditures and salaries for a specific school district, see the Ed-Data website at www.ed-data.org.
2012-13 Fiscal YearDistrict Salary Data
Placentia-Yorba Linda USD Similar Sized District
Beginning teacher salary $39,558 $41,761
Midrange teacher salary $73,339 $66,895
Highest teacher salary $92,007 $86,565
Average elementary school principal salary $107,257 $108,011
Average middle school principal salary $111,121 $113,058
Average high school principal salary $122,424 $123,217
Superintendent salary $233,520 $227,183
Teacher salaries — percent of budget 43% 38%
Administrative salaries — percent of budget 5% 5%
District Financial DataThis table displays district teacher and administrative salary information and compares the figures to the state averages for districts of the same type and size based on the salary schedule. Note the district salary data does not include benefits.
2012-13 Fiscal YearFinancial Data Comparison
Expenditures Per Pupil From
Unrestricted Sources
Annual Average Teacher
Salary
Glenknoll ES $4,155 $79,253
Placentia-Yorba Linda USD $5,576 $75,576
California $4,690 $70,720
School and district — percent difference -25.5% +4.9%
School and California — percent difference -11.4% +12.1%
Financial Data ComparisonThis table displays the school’s per-pupil expenditures from unrestricted sources and the school’s aver-age teacher salary and compares it to the district and state data.
English, mathematics and physical education are the only subject areas included in Other Pupil Outcomes (Priority 8) that are reflected in the SARC. 1
School safety plan is the only other local measure of School Climate (Priority 6) that is reflected in the SARC.2
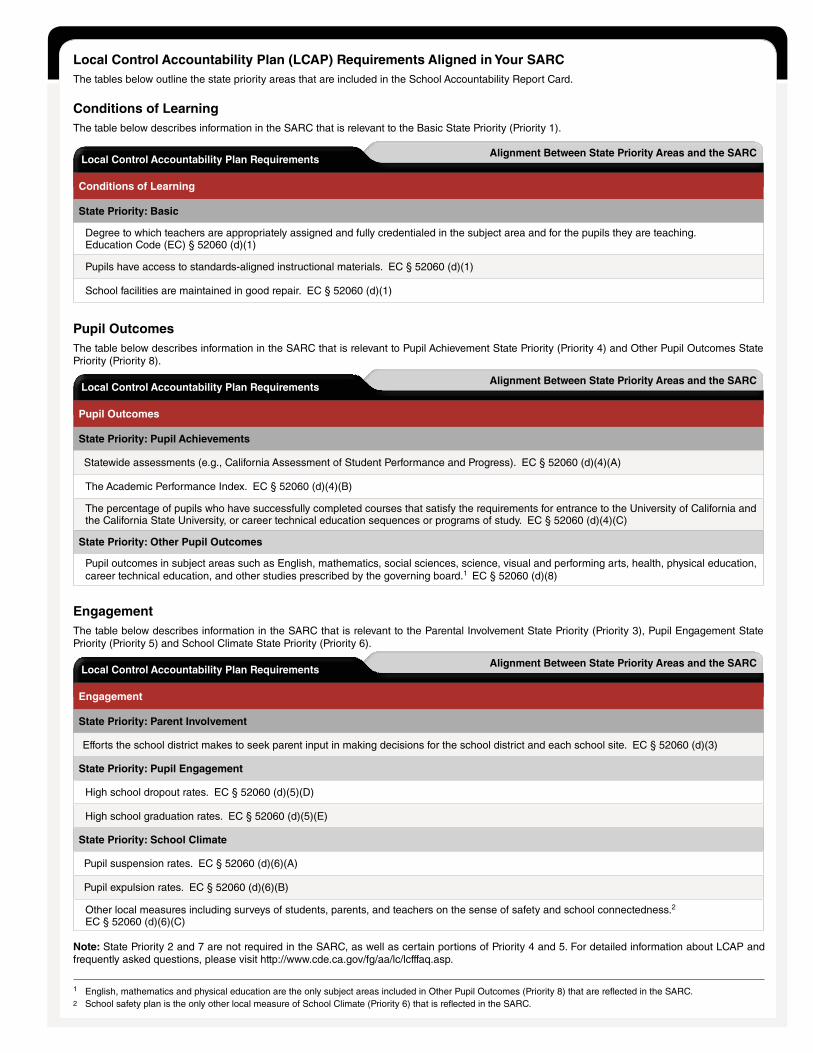
Local Control Accountability Plan (LCAP) Requirements Aligned in Your SARCThe tables below outline the state priority areas that are included in the School Accountability Report Card.
Alignment Between State Priority Areas and the SARCLocal Control Accountability Plan Requirements
Conditions of Learning
State Priority: Basic
Degree to which teachers are appropriately assigned and fully credentialed in the subject area and for the pupils they are teaching. Education Code (EC) § 52060 (d)(1)
Pupils have access to standards-aligned instructional materials. EC § 52060 (d)(1)
School facilities are maintained in good repair. EC § 52060 (d)(1)
Conditions of LearningThe table below describes information in the SARC that is relevant to the Basic State Priority (Priority 1).
Alignment Between State Priority Areas and the SARCLocal Control Accountability Plan Requirements
Pupil Outcomes
State Priority: Pupil Achievements
Statewide assessments (e.g., California Assessment of Student Performance and Progress). EC § 52060 (d)(4)(A)
The Academic Performance Index. EC § 52060 (d)(4)(B)
The percentage of pupils who have successfully completed courses that satisfy the requirements for entrance to the University of California and the California State University, or career technical education sequences or programs of study. EC § 52060 (d)(4)(C)
State Priority: Other Pupil Outcomes
Pupil outcomes in subject areas such as English, mathematics, social sciences, science, visual and performing arts, health, physical education, career technical education, and other studies prescribed by the governing board.1 EC § 52060 (d)(8)
Pupil OutcomesThe table below describes information in the SARC that is relevant to Pupil Achievement State Priority (Priority 4) and Other Pupil Outcomes State Priority (Priority 8).
Alignment Between State Priority Areas and the SARCLocal Control Accountability Plan Requirements
Engagement
State Priority: Parent Involvement
Efforts the school district makes to seek parent input in making decisions for the school district and each school site. EC § 52060 (d)(3)
State Priority: Pupil Engagement
High school dropout rates. EC § 52060 (d)(5)(D)
High school graduation rates. EC § 52060 (d)(5)(E)
State Priority: School Climate
Pupil suspension rates. EC § 52060 (d)(6)(A)
Pupil expulsion rates. EC § 52060 (d)(6)(B)
Other local measures including surveys of students, parents, and teachers on the sense of safety and school connectedness.2 EC § 52060 (d)(6)(C)
EngagementThe table below describes information in the SARC that is relevant to the Parental Involvement State Priority (Priority 3), Pupil Engagement State Priority (Priority 5) and School Climate State Priority (Priority 6).
Note: State Priority 2 and 7 are not required in the SARC, as well as certain portions of Priority 4 and 5. For detailed information about LCAP and frequently asked questions, please visit http://www.cde.ca.gov/fg/aa/lc/lcfffaq.asp.