Embed Size (px)
Citation preview
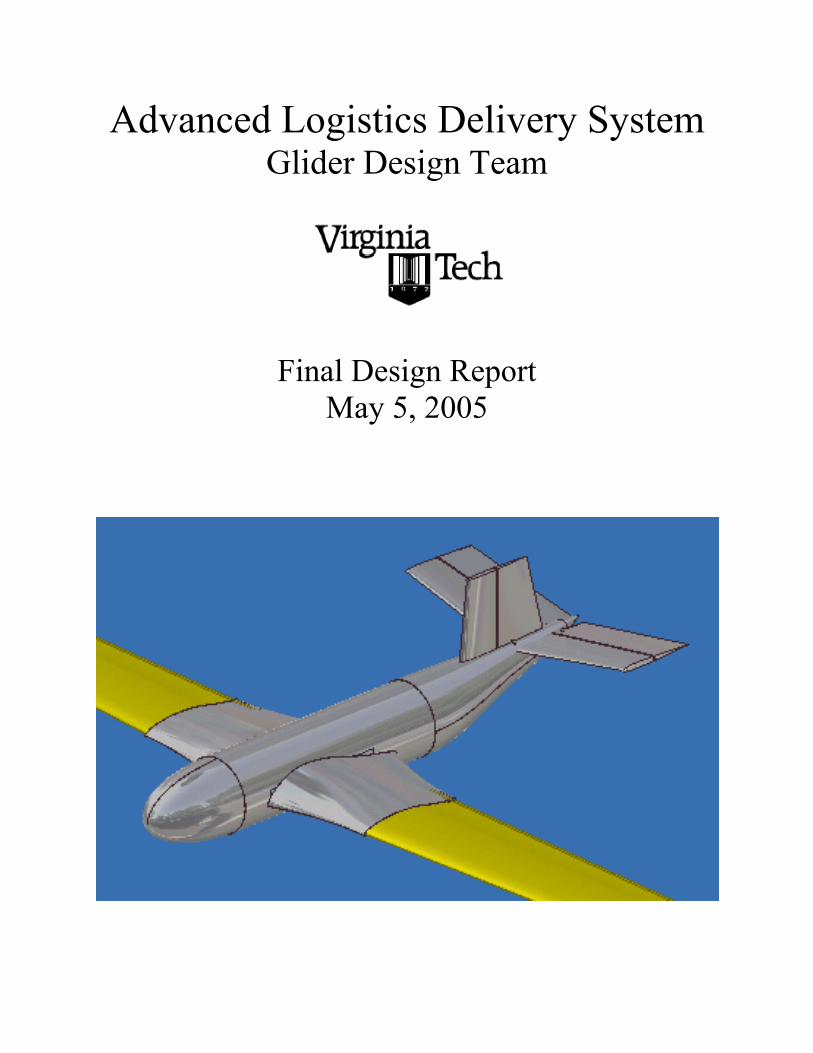
Advanced Logistics Delivery SystemGlider Design Team
Final Design ReportMay 5, 2005
Advanced Logistics Delivery System
ii
Team Members
Chris Imhof
Brian Mohns
Laura Morgan
David Rogers
Adam Russell
Andy Tuggle
Sean Tully
Lesley Walcourt
Charles Walston
Patrick Williams
Faculty Advisor
William H. Mason
Acknowledgment
We would like to acknowledge the Carderock Innovation Center and the Center for
Innovations in Ship Design for providing us with this design project and feedback on it. We
would also like to acknowledge and thank Geoff Hope for his assistance in the lifting assumption
as opposed to the projectile assumption discussed in Chapter 5 of this report.
Advanced Logistics Delivery System
iii
Executive Summary
This report provides the design specifications for an Advanced Logistics Delivery
System. The Advanced Logistics Delivery System (ALDS) will be used to transport supplies to
troops in hostile territories as an alternative to previously implemented techniques such as
convoy lines and airdrops, which endanger soldiers and military personnel. The ALDS is a glider
that is launched from a ship located at a safe distance off the shore of hostile territories. The
glider’s compact launch vehicle will be accelerated down a track that runs through the bottom of
the ship, propelled by an electromagnetic motor system. This glider is then launched at an initial
speed of 500 knots and an initial acceleration of 30g’s. The glider will travel in its compact state
until it reaches the apex of its flight. At that point inflatable wings stored inside the glider launch
vehicle will deploy and carry the glider to its 50 mile range destination. The design premise for
this glider comes from the Carderock Innovation Center and the Center for Innovations in Ship
Design.
This report describes the design process for developing this glider from the initial design
concepts to a final design. An analysis of the glider’s aerodynamics, structures, inflatable wings,
stability and control, weights and center of gravity, avionics system, sizing, and the cost of each
glider is included in this report.

Advanced Logistics Delivery System
iv
Table of ContentsTitle Page………………………………………………………………………………………… iTeam Roaster…………………………………………………………………………………….. iiExecutive Summary…………………………………………………………………………....... iiiTable of Contents………………………………………………………………………………... ivList of Figures …………………………………………………………………………………... viList of Tables …………………………………………………………………....…………….. viiiList of Symbols………………………………………………………………………………….. ixChapter 1: Introduction and Request for Proposal………………………………………………. 1
1.1 Introduction………………………………………………………………………………. 11.2 Request for Proposal………………………………………………………… ………….. 1
Chapter 2: Initial Design Concepts……………………………………………………………… 22.1 Inflatable Wing…………………………………………………………………………... 22.2 Single Hinged Wing……………………………………………………………………... 42.3 Dual Hinged Wing……………………………………………………………………….. 52.4 Telescoping Wings………………………………………………………………………. 62.5 Extension Spar Wing…………………………………………………………………….. 72.6 Variations on Concepts…………………………………………………………………... 7
Chapter 3: Analysis of Initial Design Concepts…………………………………………………. 83.1 Design Comparison Matrix………………………………………………………………. 83.2 Glider Design Selection………………………………………………………………….. 93.3 Final Glider Design……………………………………………………………………... 10
Chapter 4: Final Glider Configuration………………………………………………………….. 104.1 Introduction……………………………………………………………………………... 104.2 Original Glider Configuration……………………………………..……………………. 104.3 Final Glider Configuration……………………………………………………………… 13
Chapter 5: Aerodynamics of the Launch and Climb…………………………………………… 215.1 Introduction……………………………………………………………………………... 215.2 Projectile Motion……………………………………………………………………….. 215.3 Constant Flight Angle…………………………………………………………………... 235.4 Performance Analysis…………………………………………………………………... 255.5 Drag Buildup.…………………………………………………………………………… 28
Chapter 6: Aerodynamics of the Glide…………………………………………………………. 296.1 Introduction……………………………………………………………………………... 296.2 Initial Geometric and Performance Calculations…………….…………………………. 296.3 Airfoil Boundary Layer Analysis……………………………………………………...... 326.4 ALDS Gliding Drag Analysis…………………………………………………………... 356.5 Performance Analysis…………………………………………………………….…….. 36
Chapter 7: Glider Structural Design……………..……………………………………………... 387.1 Introduction……………………………………………………………………………... 387.2 Materials………………………………………………………………………………... 397.3 Structural Analysis of the Fuselage…………………………………………………….. 407.4 Structural Analysis of the Wings……………………………………………………….. 48
Chapter 8: Inflatable Wing Structures………………………………………….……………..... 508.1 Criteria for an Acceptable Wing…………………………………………………….….. 508.2 Original Concepts…………………………………………………………………..…... 528.3 Final Concept…………………………………………………………………………… 53

Advanced Logistics Delivery System
v
8.3 Force, Moment and Pressure Calculations…………………………………………........ 548.4 Material Selection………………………………………………………...…………….. 56
Chapter 9: Wing Deployment…………………………………………………………………... 589.1 Introduction……………………………………………………………………………... 589.2 Primary Inflation………………………………………………………………………... 589.3 Reserve Inflation………………………………………………………………………... 649.4 Future Thoughts………………………………………………………………………… 66
Chapter 10: Weights and Center of Gravity……………………………………………………. 6710.1 Weights………………………………………………………………………………... 6710.2 Center of Gravity…………………………………………………………………….... 71
Chapter 11: Analysis of Glider Stability and Control………………………………………….. 7211.1 Introduction……………………………………………………………………..…….. 7211.2 Constraints………………………………………………………………...…………... 7211.3 Requirements………………………………………………………………………….. 7211.4 Launch Loads………………………………………………………………………….. 7311.5 Wing Deployment…...………………………………………………………………… 7311.6 Control System………………..………………………………………………………. 7411.7 Tail Configuration…………………………………………………………………..…. 7511.8 Conventional Design Process……………………………………………………….… 7811.9 Computer Aided Design………………………………………………………………. 8011.10 Stability Derivatives…..……………………………………………………………... 8011.11 Longitudinal Stability……………………………………………………………...… 8111.12 Pitch Control and Elevator Performance…………………………………………….. 8311.13 Yaw Stability and Rudder Performance……………………………………………... 8611.14 Roll Stability and Control……………………………………………………………. 8711.15 Servo Motors…………………………………………………………………………. 88
Chapter 12: Glider Avionics……………………………………………………………………. 9112.1 Piccolo Plus: An Introduction…………………………………………………………. 9112.2 Components of the Piccolo Plus………………………………………………………. 9312.3 Ground Station………………………………………………………………………… 9412.4 Components of Avionics System……………………………………………………… 9412.5 Avionics Integration to Glider Aircraft………………………………………………... 9612.6 Piccolo Pricing………………………………………………………………………… 97
Chapter 13: Sizing and Relationship to Ship Configuration……………………………………. 9713.1 Introduction……………………………………………………………………………. 9713.2 Glider Storage…………………………………………………………………………. 97
13.2.1 Volume Calculations…………………………………………………………….. 9813.2.2 Glider Arrangement……………………………………………………………... 98
13.3 Glider Storage Conclusions…………………………………………………………… 99Chapter 14: Cost Analysis…………………………………………………………………….. 100
14.1 Individual Glider Costs………………………………………………………………. 10014.2 Costs per Pound Payload Deliverable……………………………………………….. 10014.3 Cost Conclusions…………………………………………………………………….. 102
Chapter 15: Conclusions and Future Work……………………………………………………. 103References……………………………………………………………………………………... 104Appendix A: Equations for Calculations...……………………………………………………. 106Appendix B: Boundary Layer Analysis Output……………………………………………….. 107
Advanced Logistics Delivery System
vi
List of Figures
2.1 Inflatable Wing Glider2.2 Single Hinged Glider2.3 Dual Hinged Glider2.4 Telescoping Wing Glider2.5 Extension Spar Wing with Soft Skin3.1 Glider Decision Tree4.1 Original Glider Launch Vehicle4.2 Top View of Internal Glider Configuration4.3 Original Launch Vehicle Design4.4 Final Glider Design4.5 Payload Box Stacking4.6 Original Glider Side Profile4.7 Final Glider Side Profile4.8 Final Glider Internal Arrangement4.9 Original Glider Sodium Azide Tank Close-up4.10 Rear View of Internal Arrangement of Motors and Avionics Package4.11 Side View of Internal Structures4.12 Dimensioned Top View4.13 Dimensioned Top and Frontal View with Wings Deployed5.1 Projectile Trajectories at Various Launch Angles5.2 Free Body Diagram of ALDS During Launch5.3 Variation of Apogee Height with Launch Angle5.4 Variations in Apogee Height with Span5.5 Variations in Apogee Height with Chord5.6 Variations in Apogee Height with Temperature6.1 Glider Comparison Chart6.2 Taper Ratio versus Efficiency Factor6.3 Exaggerated View of Wing Deflation7.1 Diagram of Loading on Glider7.2 Stringer Displacement along the Frame Edge7.3 Stringer Cross Section7.4 Optimized Stringer Cross Section7.5 Stringer and Skin Panel Numbering Convention7.6 Diagram of Payload Supports7.7 Major Loads on Payload Supports7.8 Frame and Payload Support Optimized Dimensions7.9 Major Loads on Glider Wing8.1 Five Spar Cross Section Concept8.2 Original Fully Inflated Wing Concept8.3 Combination of Original Concepts on Wortmann 170 Airfoil8.4 Cross Section of University of Kentucky’s “Big Blue”8.5a Pressure Coefficient Along Chord8.5b Normalized Lift Along Chord8.6 Section Moment and Spar Diameter along Chord
Advanced Logistics Delivery System
vii
8.7 Individual Required Wrinkling Pressure along Chord9.1 Required Reactant Amounts for Varying Wing Pressure9.2 Inflation Times per Wing9.3 Reserve Inflation Controller Diagram9.4 Reserve Pressure Controller Activity Compared with Pressure Loss10.1 Fuselage Stringer Highlighted for Examining10.2 Glider Weight Distribution10.3 Glider Weight Distribution without Payload and Fuel11.1 Locations of Center of Gravity and Pressure11.2 Center of Pressure Shift Before and After Wing Deployment11.3 Tails being considered for Glider11.4 Final Tail Configuration11.5 Tail Geometry11.6 Typical Fuselage Lengths versus Overall Weight11.7 Surface Area versus Moment Arm Length11.8 Input and Output Properties for Programs used in Design Process11.9 Summary of Primary Stability Derivatives11.10 Coefficient of Pitch Moment versus Lift Coefficient11.11 Coefficient of Pitch Moment versus Lift Coefficient for CG Range11.12 Cm/CL Slopes for Various Elevator Deflections at Desired CG11.13 Cm/CL Slopes for Various Elevator Deflections at Forward CG11.14 Cm/CL Slopes for Various Elevator Deflections at Aft CG11.15 Coefficient of Yaw Moment vs. Yaw Angle11.16 Coefficient of Yaw Moment vs. Rudder Deflection11.17 Roll Rate vs. Rudder Deflection11.18 Design Layout for Motor Connections11.19 Approximate Torque Requirements11.20 Approximate Torque Requirements12.1 Piccolo Plus Avionics Package12.2 Piccolo Plus Block Diagram12.3 Autopilot Commands Page12.4 Map PageB1 Wotmann FX 67-K-170 ContoursB2 Wortmann FX 67-K-150 ContoursB3 Skin Friction-Wortmann FX 67-K-170 Root Airfoil at One Percent DeflationB4 Skin Friction Graph - Wortmann FX 67-K-170 Rigid Root FoilB5 Wortmann FX-67-K-170 Rigid Airfoil OutputB6 Wortmann FX-67-K-170 One Percent Deflated Airfoil OutputB7 Section Lift to Drag Comparison for Root AirfoilB8 Tripped Flow Comparison Graph For Deflated Root AirfoilB9 Wortmann FX 67-K-150 Tip Airfoil at One Percent DeflationB10 Skin Friction Graph - Wortmann FX 67-K-150 Tip FoilB11 Wortmann FX 67-K-150 Rigid Tip Foil OutputB12 Wortmann FX-67-K-150 One Percent Deflated Airfoil OutputB13 Section Lift to Drag Comparison for Tip AirfoilB14 Output of Friction Analysis
Advanced Logistics Delivery System
viii
List of Tables
3.1 Design Comparison Matrix5.1 ALDS Zero Lift Drag Buildup During Launch6.1 Initial Calculations for the ALDS Glider with a Range of 50 Miles6.2 Analyzed Airfoil Profiles6.3 Comparison of Rigid Wing and a One Percent Deflated Wing6.4 Expected Lift to Drag Ratio for the ALDS Glider6.5 Overall Performance Calculations6.6 Overall Performance At Minimum Weight of 1400 lbs.7.1 Carbon Fiber Material Properties7.2 Composite Skin Material Properties7.3 Table of Stringer Stresses7.4 Table of Shear Stresses in Skin10.1 Weights Grouping10.2 Weight Breakdown and Totals10.3 Distance and Moments12.1 Key Characteristics of the Piccolo Plus12.2 Piccolo Pricing14.1 Cost Summary per Glider14.2 Cost Comparison between Delivery MethodsA1 Aerodynamics Equations Table
Advanced Logistics Delivery System
ix
List of Symbols and Abbreviations
ALDS – Advance Logistics Delivery SystemAR – Aspect Ratiob – Wing Spanc – ChordCL – Lift CoefficientCD – Drag CoefficientCD0 - Zero Lift Drag CoefficientCf – Friction CoefficientCG – Center of GravityD – Drage – Oswald’s Efficiency FactorE – Young’s ModulusF – ForceFF – Friction Forceg – Gravitational ConstantL – Liftm – MassM – MomentP – Pressurepsi – Pounds per Square InchR – Gas Constants – PositionS – Planar Surface AreaSwet – Wetted Surface Areat – Timet – ThicknessT – Temperaturev – VelocityW – Weight_ – Launch Angle_ – Density
Advanced Logistics Delivery System
1
Chapter 1: Introduction and Request for Proposal
1.1 Introduction
The Virginia Tech glider team’s objective is to provide a low cost, disposable glider to carry
supplies to troops in hostile territories. The request for proposal for the glider known as the advanced
logistics delivery system (ALDS), comes from the Carderock Innovation Center and the Center for
Innovations in Ship Design. The main project drivers that the glider must achieve to be considered
successful are the range requirement, the payload requirement, and the sizing requirement in addition
to the low cost of the glider. These requirements will be discussed in more detail in the next section.
The glider design fits into a larger project being by the Carderock Center. Carderock wants to
be able to launch a glider from a ship in waters a safe distance off of the coast of hostile zones. The
gliders will deliver supplies to troops in these areas. The glider design presented in this report is a
solution that could be used for this situation. Many of the constraints on the glider occur because the
glider is being launched off of a ship and safe distance away from land. The glider needs to be both
durable to withstand launch accelerations and disposable at the same time.
The glider will undergo three stages of flight on its course from the ship to hostile territory.
The first phase is the launch phase, in which the launch vehicle will travel along the track in the ship
propelled by an electromagnetic motor. The vehicle is then launched from the ship and enters the
climb portion of the flight in which the glider starts at its launch initial velocity and climbs to the apex
of the flight. Before stall occurs at apex of the trajectory the glider’s wings are deployed. The glider
completes the third segment of its flight by gliding back down to the ground to the troops below.
1.2 Request for Proposal
The request for proposal (RFP) comes from the Carderock Innovation Center and the Center of
Innovations in Ship Design. The requirements in the request for proposal come from the economical
Advanced Logistics Delivery System
2
and mission requirements of the navy and from the limitations that the ship places on the glider. The
requirements of the RFP are as follows:
• The glider must have the room and structural stability to carry 1000 pounds of payload.
• The glider without the payload must weigh around 500 pounds.
• The glider must be able to withstand a launch acceleration of 30g’s and a launch speed of 500
knots.
• The glider must be inexpensive and disposable.
• The glider must maintain a cruise speed of 60 knots.
• The glider launch pod dimensions must fit in a tunnel with a 10 ft diameter.
• The glider must have a range of 50 miles.
When the design process began the glider was required to be 15 ft in length. That requirement later
changed and is a key difference between the initial design concepts and the final concept.
Chapter 2: Initial Design Concepts
The first step taken in the design process was to come up with several different design concepts
for the glider. Five different designs were considered and they are discussed in this section.
2.1 Inflatable Wing
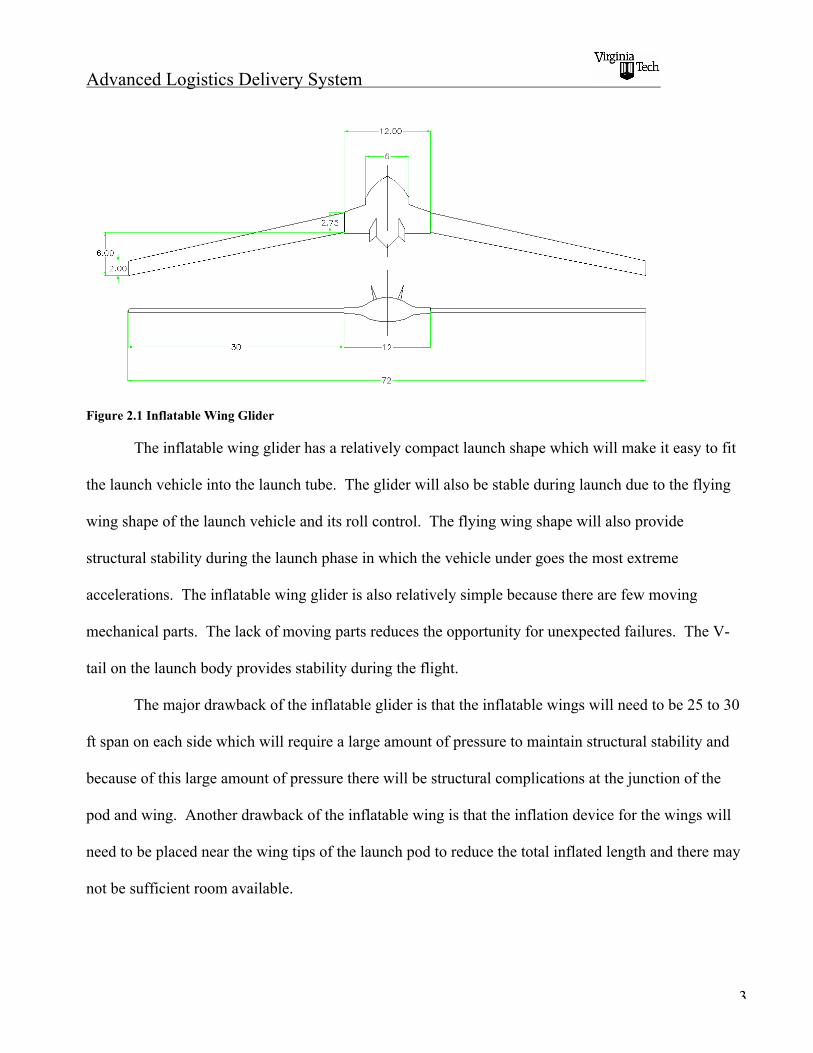
The inflatable wing glider is pictured in figure 2.1. The glider has a flying wing shaped body
and a V-tail for stability. The inflatable wings on the glider will use a gas to increase the pressure in
the wing once the glider reaches apex.
Advanced Logistics Delivery System
3
Figure 2.1 Inflatable Wing Glider
The inflatable wing glider has a relatively compact launch shape which will make it easy to fit
the launch vehicle into the launch tube. The glider will also be stable during launch due to the flying
wing shape of the launch vehicle and its roll control. The flying wing shape will also provide
structural stability during the launch phase in which the vehicle under goes the most extreme
accelerations. The inflatable wing glider is also relatively simple because there are few moving
mechanical parts. The lack of moving parts reduces the opportunity for unexpected failures. The V-
tail on the launch body provides stability during the flight.
The major drawback of the inflatable glider is that the inflatable wings will need to be 25 to 30
ft span on each side which will require a large amount of pressure to maintain structural stability and
because of this large amount of pressure there will be structural complications at the junction of the
pod and wing. Another drawback of the inflatable wing is that the inflation device for the wings will
need to be placed near the wing tips of the launch pod to reduce the total inflated length and there may
not be sufficient room available.
Advanced Logistics Delivery System
4
2.2 Single Hinged Wing
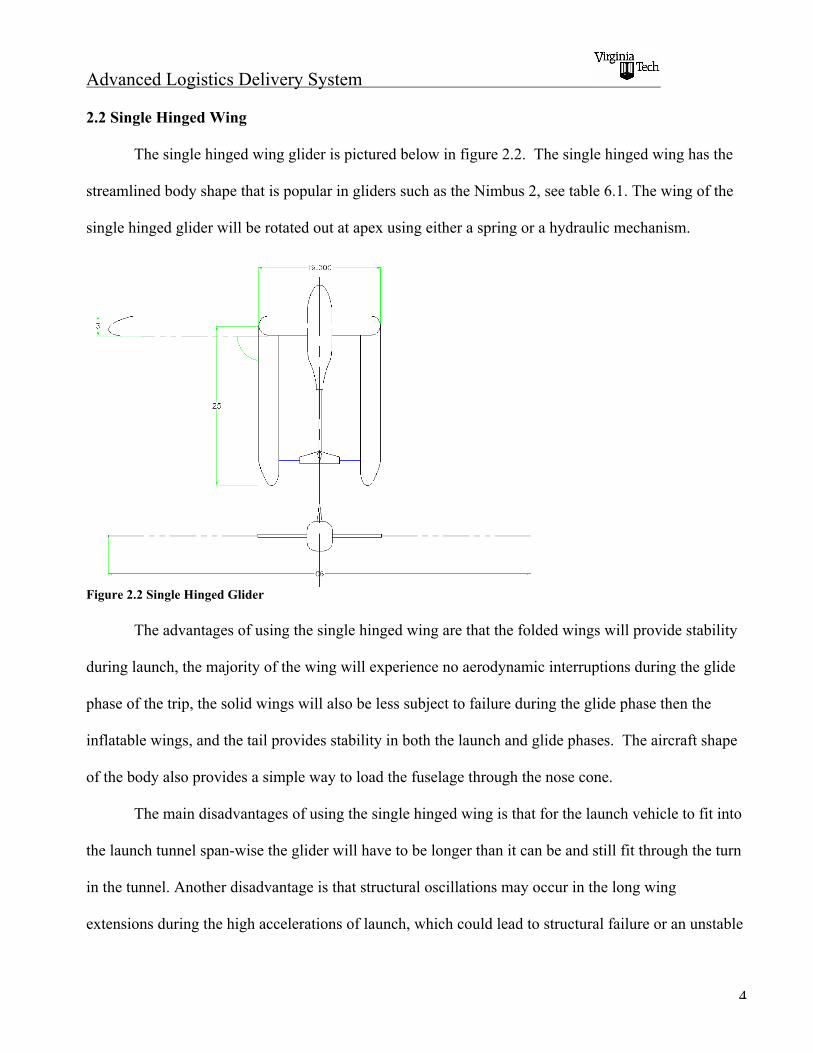
The single hinged wing glider is pictured below in figure 2.2. The single hinged wing has the
streamlined body shape that is popular in gliders such as the Nimbus 2, see table 6.1. The wing of the
single hinged glider will be rotated out at apex using either a spring or a hydraulic mechanism.
Figure 2.2 Single Hinged Glider
The advantages of using the single hinged wing are that the folded wings will provide stability
during launch, the majority of the wing will experience no aerodynamic interruptions during the glide
phase of the trip, the solid wings will also be less subject to failure during the glide phase then the
inflatable wings, and the tail provides stability in both the launch and glide phases. The aircraft shape
of the body also provides a simple way to load the fuselage through the nose cone.
The main disadvantages of using the single hinged wing is that for the launch vehicle to fit into
the launch tunnel span-wise the glider will have to be longer than it can be and still fit through the turn
in the tunnel. Another disadvantage is that structural oscillations may occur in the long wing
extensions during the high accelerations of launch, which could lead to structural failure or an unstable

Advanced Logistics Delivery System
5
climb after launch. Also, during wing deployment large moments may occur because of the large
rotating arm that could send the aircraft into an unstable alignment. A final disadvantage is the long tail
which may be subject to structural failure during launch.
2.3 Dual Hinged Wing
The dual hinged wing has a similar wing design to the single hinged wing except that there are
two hinges that rotate to get the wing to full span. The dual hinged wing fuselage is a simple
aerodynamic shape that allows the tips of the wings to be attached to the fuselage. The wings will be
extended out at apex in a similar manner to the single hinged wing using either a spring or a hydraulic
mechanism. The dual hinged wing glider is pictured in figure 2.3.
Figure 2.3 Dual Hinged Glider
Some qualities of the dual hinged glider that make it desirable are the dual hinged glider has
solid wings that are more resistant to structural failure then the inflatable wing glider. The folded
wings of the glider also create more stability during the launch phase of the flight. The vertical
stabilizer in place of a tail will provide stability in both the launch and glide phases of the trip.
Advanced Logistics Delivery System
6
The dual hinged design however is more mechanically complex then the previous two design
concepts allowing more room for unexpected errors in the wing deployment. Another problem with the
dual hinged glider is that the hinges would have to with stand large loads during all stages of the
gliders flight. The wings again run the risk of oscillating during launch which could lead to structural
instability.
2.4 Telescoping Wings
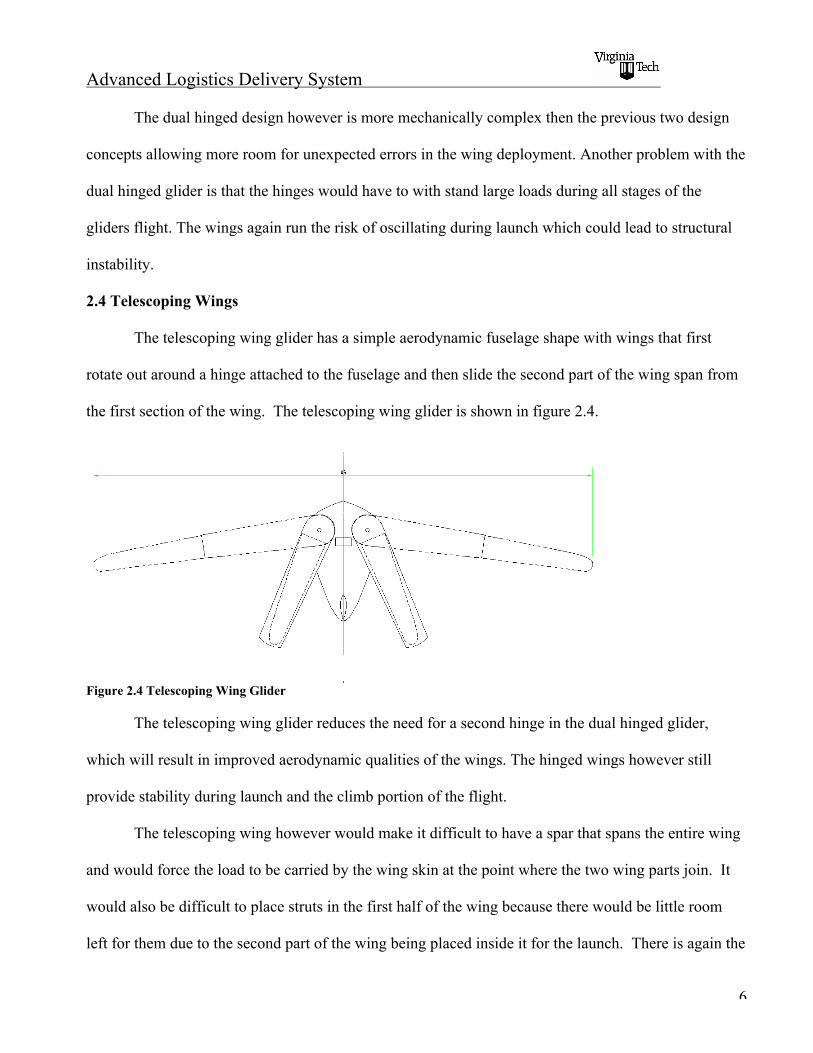
The telescoping wing glider has a simple aerodynamic fuselage shape with wings that first
rotate out around a hinge attached to the fuselage and then slide the second part of the wing span from
the first section of the wing. The telescoping wing glider is shown in figure 2.4.
Figure 2.4 Telescoping Wing Glider
The telescoping wing glider reduces the need for a second hinge in the dual hinged glider,
which will result in improved aerodynamic qualities of the wings. The hinged wings however still
provide stability during launch and the climb portion of the flight.
The telescoping wing however would make it difficult to have a spar that spans the entire wing
and would force the load to be carried by the wing skin at the point where the two wing parts join. It
would also be difficult to place struts in the first half of the wing because there would be little room
left for them due to the second part of the wing being placed inside it for the launch. There is again the
Advanced Logistics Delivery System
7
possibility of failure with the wing deployment system because of the complexity of moving parts that
could be damaged at anytime, particularly during launch under such extreme loads.
2.5 Extension Spar Wing
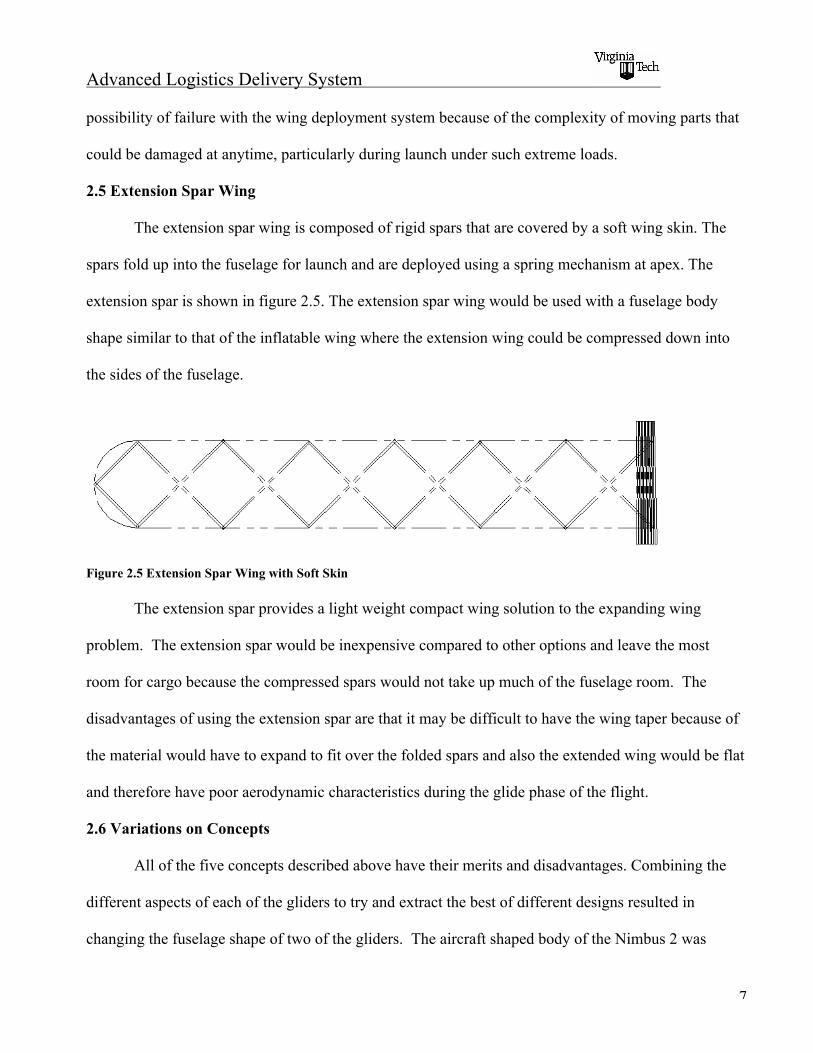
The extension spar wing is composed of rigid spars that are covered by a soft wing skin. The
spars fold up into the fuselage for launch and are deployed using a spring mechanism at apex. The
extension spar is shown in figure 2.5. The extension spar wing would be used with a fuselage body
shape similar to that of the inflatable wing where the extension wing could be compressed down into
the sides of the fuselage.
Figure 2.5 Extension Spar Wing with Soft Skin
The extension spar provides a light weight compact wing solution to the expanding wing
problem. The extension spar would be inexpensive compared to other options and leave the most
room for cargo because the compressed spars would not take up much of the fuselage room. The
disadvantages of using the extension spar are that it may be difficult to have the wing taper because of
the material would have to expand to fit over the folded spars and also the extended wing would be flat
and therefore have poor aerodynamic characteristics during the glide phase of the flight.
2.6 Variations on Concepts
All of the five concepts described above have their merits and disadvantages. Combining the
different aspects of each of the gliders to try and extract the best of different designs resulted in
changing the fuselage shape of two of the gliders. The aircraft shaped body of the Nimbus 2 was
Advanced Logistics Delivery System
8
determined to be more aerodynamic then the flying wing and the simple aerodynamic shape. Therefore
alternate versions of the inflatable wing glider and the dual hinged glider were done with the aircraft
shaped body.
Chapter 3: Analysis of Initial Design Concepts
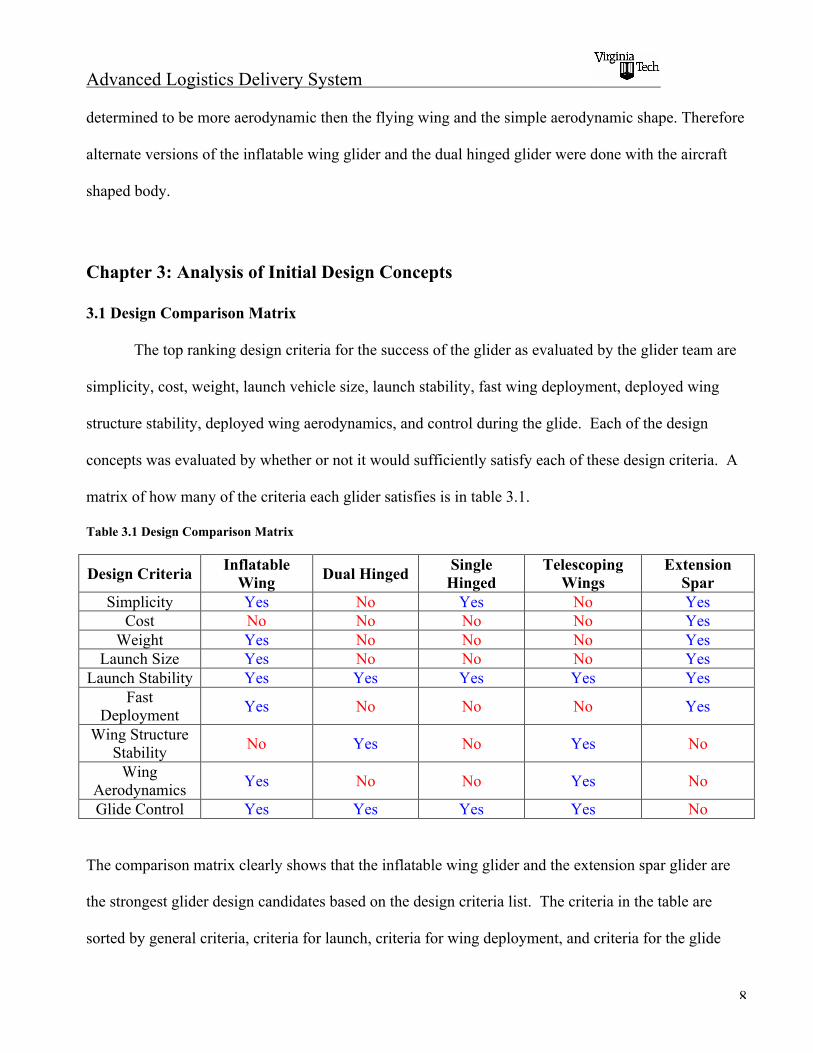
3.1 Design Comparison Matrix
The top ranking design criteria for the success of the glider as evaluated by the glider team are
simplicity, cost, weight, launch vehicle size, launch stability, fast wing deployment, deployed wing
structure stability, deployed wing aerodynamics, and control during the glide. Each of the design
concepts was evaluated by whether or not it would sufficiently satisfy each of these design criteria. A
matrix of how many of the criteria each glider satisfies is in table 3.1.
Table 3.1 Design Comparison Matrix
Design CriteriaInflatable
Wing Dual HingedSingle
HingedTelescoping
WingsExtension
SparSimplicity Yes No Yes No Yes
Cost No No No No YesWeight Yes No No No Yes
Launch Size Yes No No No YesLaunch Stability Yes Yes Yes Yes Yes
FastDeployment Yes No No No Yes
Wing StructureStability No Yes No Yes No
WingAerodynamics Yes No No Yes No
Glide Control Yes Yes Yes Yes No
The comparison matrix clearly shows that the inflatable wing glider and the extension spar glider are
the strongest glider design candidates based on the design criteria list. The criteria in the table are
sorted by general criteria, criteria for launch, criteria for wing deployment, and criteria for the glide
Advanced Logistics Delivery System
9
phase. The inflatable wing glider appears to be a strong candidate in all areas of the criteria whereas
the extension spar glider is only a strong candidate up until the wings are deployed. After that point it
does not satisfy any of the design criteria. The dual hinged wing glider and the telescoping wing glider
also appear to be decent candidates over the actual flight of the glider but they do not satisfy the
overall criteria.
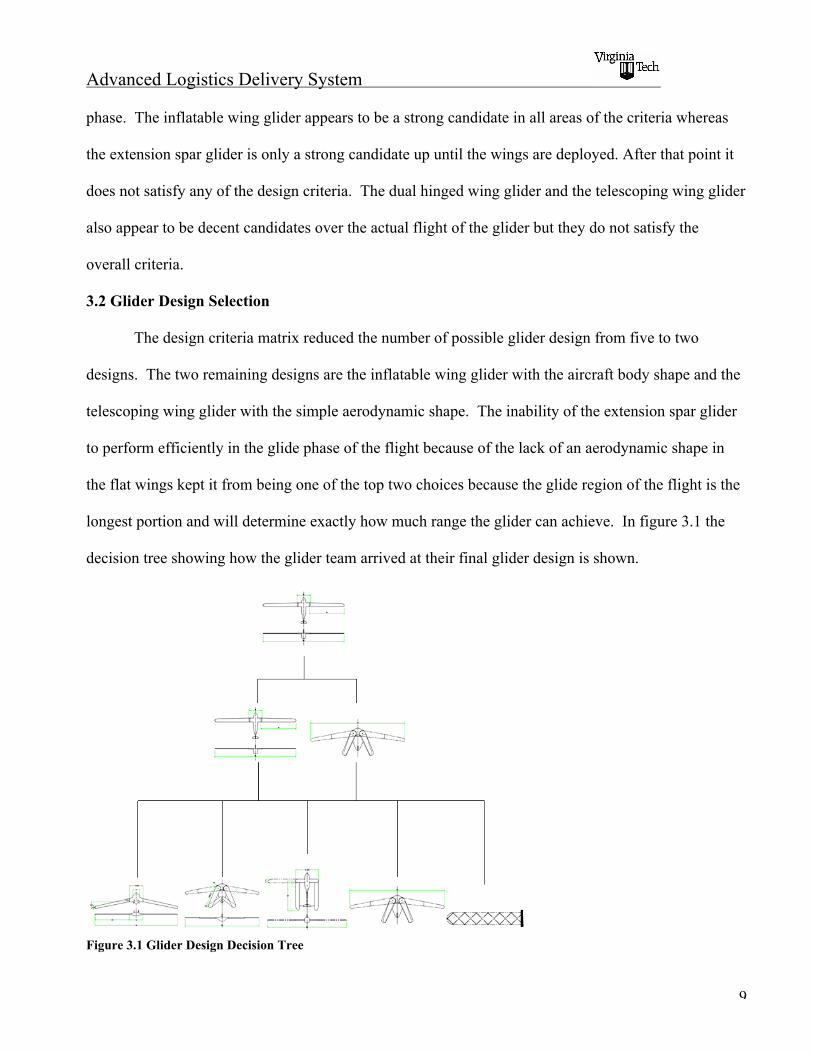
3.2 Glider Design Selection
The design criteria matrix reduced the number of possible glider design from five to two
designs. The two remaining designs are the inflatable wing glider with the aircraft body shape and the
telescoping wing glider with the simple aerodynamic shape. The inability of the extension spar glider
to perform efficiently in the glide phase of the flight because of the lack of an aerodynamic shape in
the flat wings kept it from being one of the top two choices because the glide region of the flight is the
longest portion and will determine exactly how much range the glider can achieve. In figure 3.1 the
decision tree showing how the glider team arrived at their final glider design is shown.
Figure 3.1 Glider Design Decision Tree
Advanced Logistics Delivery System
10
3.3 Final Glider Design
As the decision tree above shows, the final glider design chosen from the initial 5 designs
concepts is the inflatable wing design with the aircraft shaped fuselage. The inflatable wing glider was
chosen for its mechanical simplicity, its potential for being low cost, its low weight, and its potential
for superior aerodynamic performance during wing deployment and the glide. The final configuration
for the inflatable wing glider is discussed in the next chapter.
Chapter 4: Final Glider Configuration
4.1 Introduction
The glider configuration discussed in this section is a general overview of the glider design.
Most of the reasons for why the glider configuration appears this have not yet been discussed, but will
be discussed throughout the remainder of the report. The glider configuration assumes a chemical
reaction of the same type as the one used is car airbags will be used for the inflatable wing deployment.
The actual discussion of how the “airbag” process works is covered in Chapter 9.
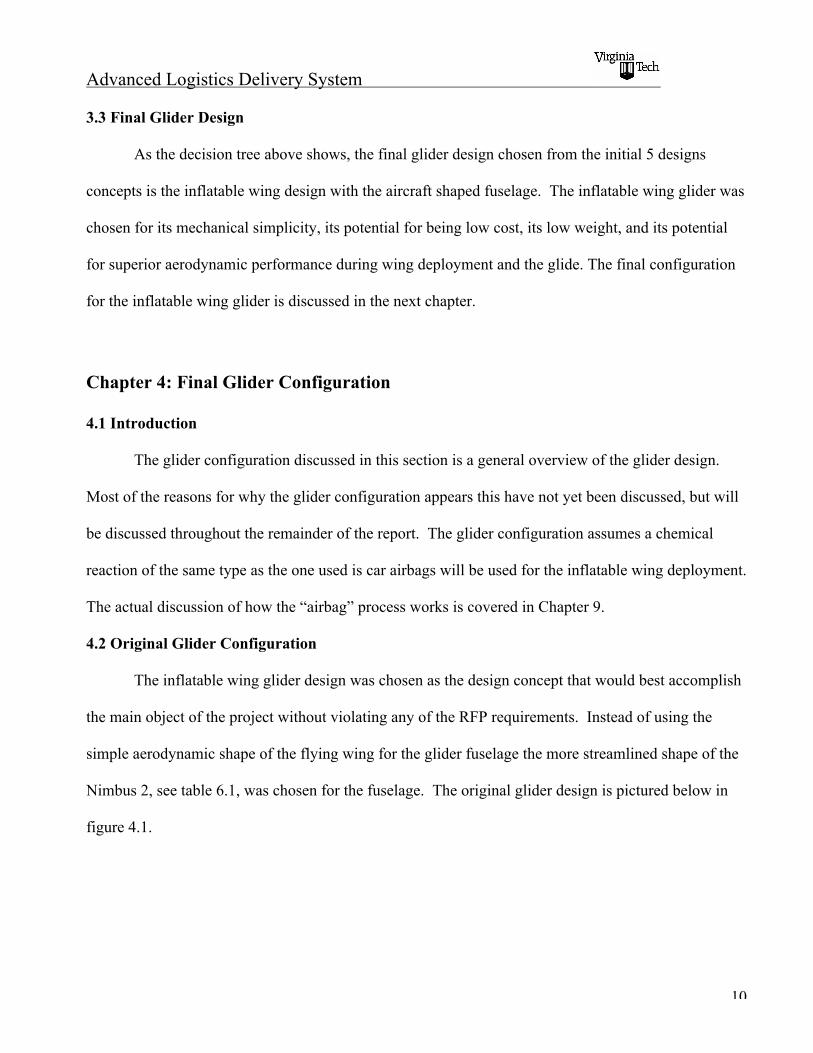
4.2 Original Glider Configuration
The inflatable wing glider design was chosen as the design concept that would best accomplish
the main object of the project without violating any of the RFP requirements. Instead of using the
simple aerodynamic shape of the flying wing for the glider fuselage the more streamlined shape of the
Nimbus 2, see table 6.1, was chosen for the fuselage. The original glider design is pictured below in
figure 4.1.
Advanced Logistics Delivery System
11
Figure 4.1 Original Glider Launch Vehicle
For the inflatable wing glider configuration, the fuselage is separated into three sections. The
nosecone will provide space for the airbag fuel, assuming that a fuel holding tank can be made to the
desired dimensions. The center section of the fuselage will be used mainly to enclose the payload and
direct the airbag fuel to the spars. The rear section of the fuselage will be used to hold the avionics
assembly, including the power supply and antennas. Figure 4.2 shows the internal configuration for
the glider from the top.
Advanced Logistics Delivery System
12
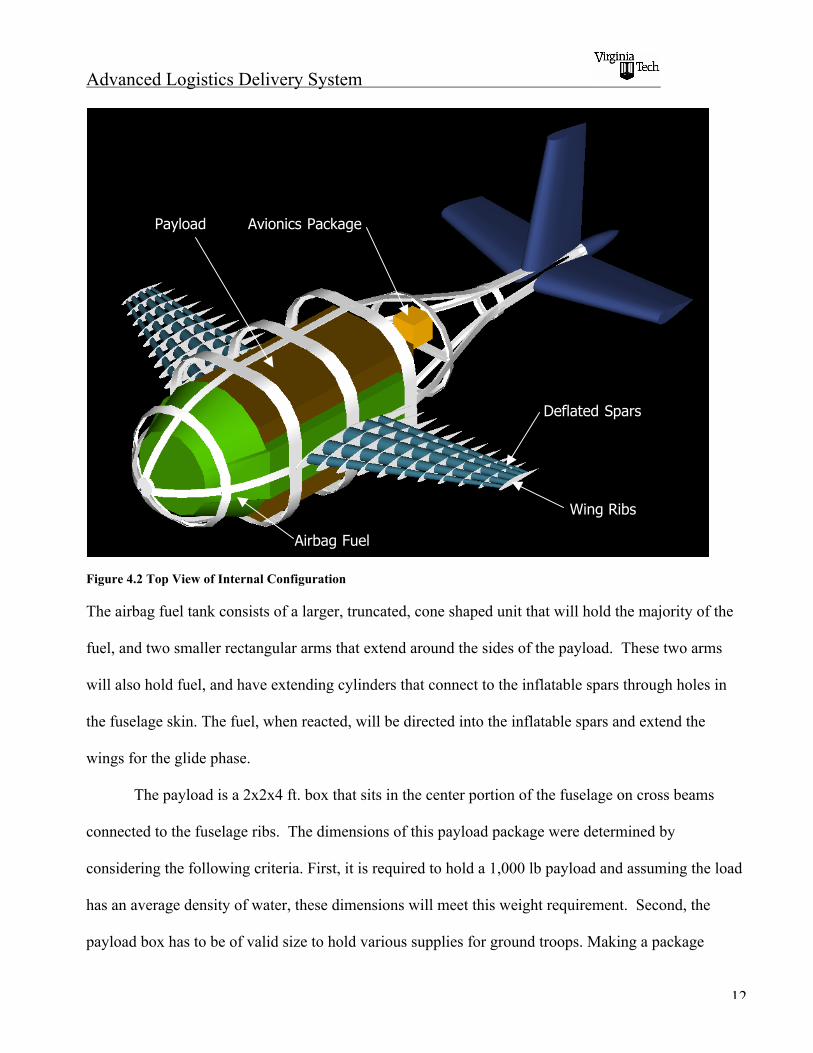
Figure 4.2 Top View of Internal Configuration
The airbag fuel tank consists of a larger, truncated, cone shaped unit that will hold the majority of the
fuel, and two smaller rectangular arms that extend around the sides of the payload. These two arms
will also hold fuel, and have extending cylinders that connect to the inflatable spars through holes in
the fuselage skin. The fuel, when reacted, will be directed into the inflatable spars and extend the
wings for the glide phase.
The payload is a 2x2x4 ft. box that sits in the center portion of the fuselage on cross beams
connected to the fuselage ribs. The dimensions of this payload package were determined by
considering the following criteria. First, it is required to hold a 1,000 lb payload and assuming the load
has an average density of water, these dimensions will meet this weight requirement. Second, the
payload box has to be of valid size to hold various supplies for ground troops. Making a package
Payload
Airbag Fuel
Deflated Spars
Wing Ribs
Avionics Package
Advanced Logistics Delivery System
13
1X1X16 ft. would help in streamlining the fuselage, but restrict bulkier materials that may need to be
transported. Finally, a rectangular shape was chosen rather than a cylindrical so that the payload boxes
could be stacked and stored easily on the ship. This shape will maximize the amount of payload stored
per unit volume of holding space on the ship.
The rear section of the fuselage, although the longest component of the three, does not provide
much room for storage because of it’s streamlined shape. Therefore it houses the avionics package,
power supply, and antennae, which sit behind the fuselage on a cross beam connected to a fuselage rib.
A general assembly procedure for the fuselage and the components that it houses will proceed
as follows. The avionics package will first be mounted in the rear section of the fuselage. The center
section of the fuselage will then be attached to the rear, and the payload will be placed into the center
section and secured in place. The airbag fuel tank will then be secured around the payload with the
“arms” of the airbag fuel going on the right and left sides of the payload. The nosecone will then be
attached to the center component of the fuselage, completing the assembly.
4.3 Final Glider Configuration
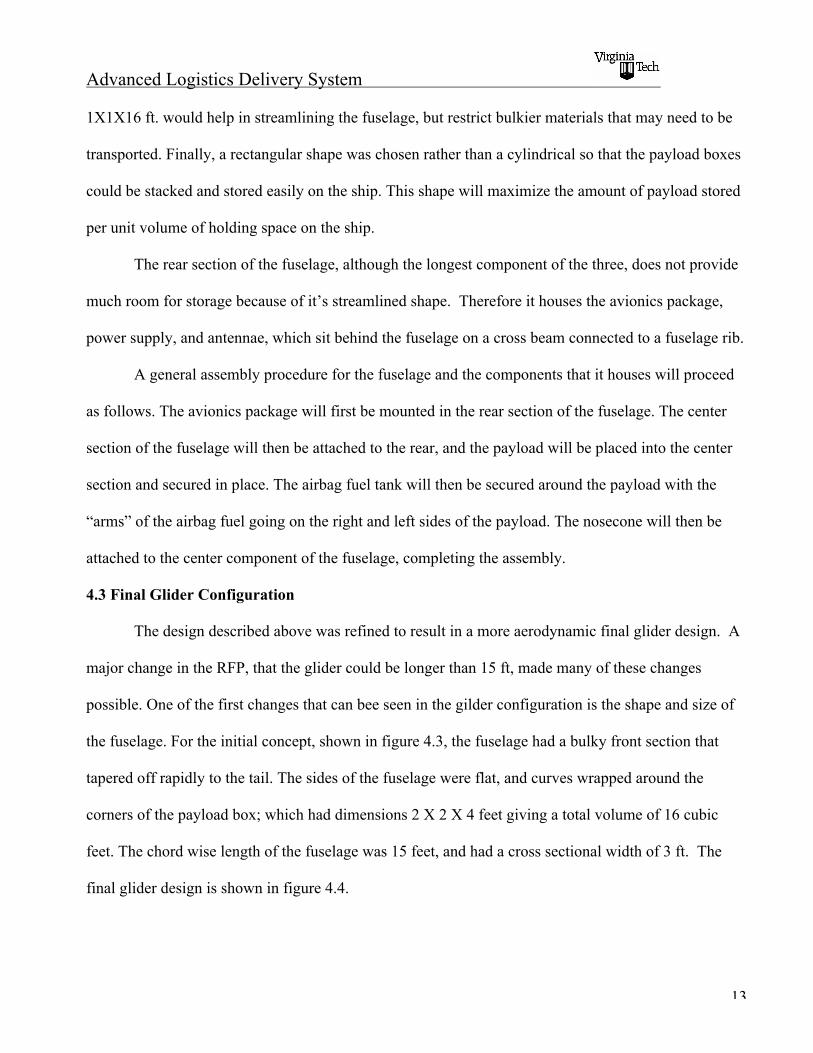
The design described above was refined to result in a more aerodynamic final glider design. A
major change in the RFP, that the glider could be longer than 15 ft, made many of these changes
possible. One of the first changes that can bee seen in the gilder configuration is the shape and size of
the fuselage. For the initial concept, shown in figure 4.3, the fuselage had a bulky front section that
tapered off rapidly to the tail. The sides of the fuselage were flat, and curves wrapped around the
corners of the payload box; which had dimensions 2 X 2 X 4 feet giving a total volume of 16 cubic
feet. The chord wise length of the fuselage was 15 feet, and had a cross sectional width of 3 ft. The
final glider design is shown in figure 4.4.
Advanced Logistics Delivery System
14
Figure 4.3 Original Launch Vehicle Design
Figure 4.4 Final Glider Design
One of the changes made to the glider was the cross sectional shape of the fuselage. It is now
circular with a diameter of 2.5 feet. One of the motivating factors for this change was the decision to
change the size and shape of the payload. The payload used for the final design has dimensions1.5 X
1.5 X 9 feet giving a total volume of 20.25 cubic feet. The change in the payload box was made for
three reasons. The first being that a greater volume of material can be transported, increasing from 16
to 20.25 cubic feet. This volume of 20.25 ft allows for bulkier cargo that is less dense then water and
Advanced Logistics Delivery System
15
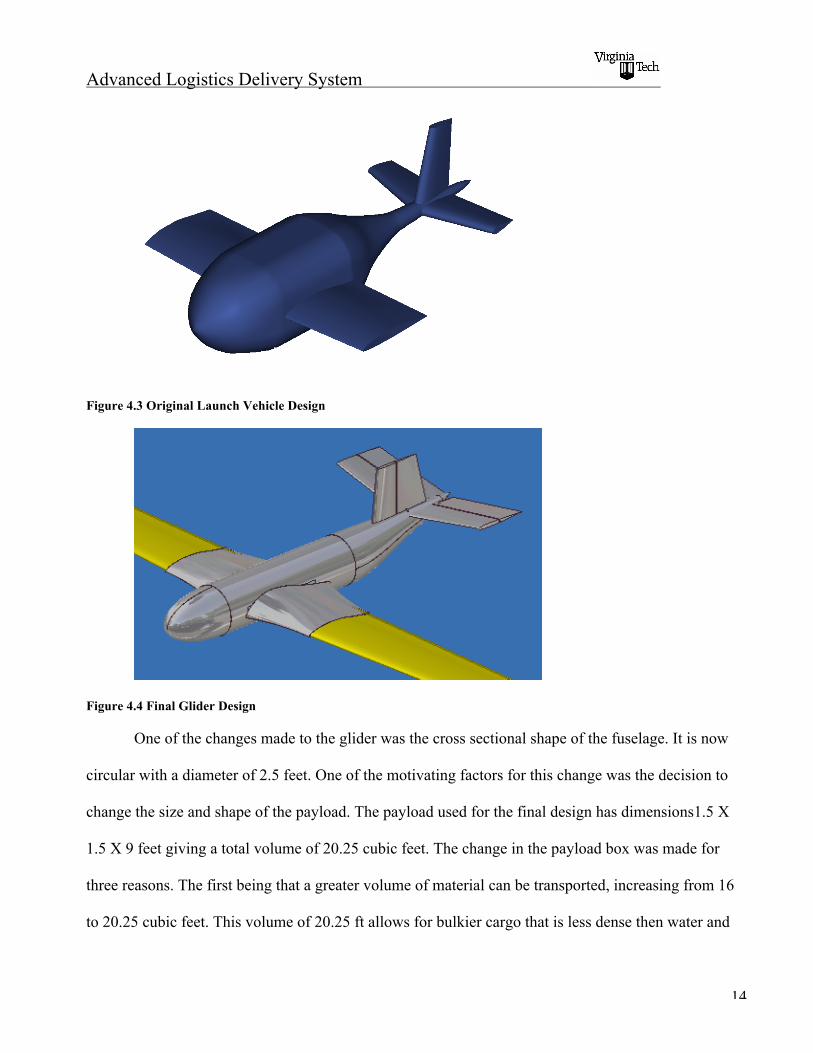
still maintains the 1000 lb payload. The payload is exactly equal to 1000 lbs when 40% dry cargo is
used and 60% wet cargo is used, based on the average dry and wet cargo densities of 21 lb/ft3 and 62.4
lb/ft3 respectively. The second reason is due to the shipping procedures of naval material. Supplies are
currently shipped using 3 X 3 X 3 ft. pallets; the revised shape of the payload box will allow for 3
individual 1.5 X 1.5 X 3 ft. rectangular boxes from each pallet to be loaded into the fuselage, as shown
in figure 4.5.
Figure 4.5 Payload Box Stacking
The third reason for changing the payload dimensions is so that the fuselage can be constructed
in a more streamlined shape. The initial glider concept had abrupt curves that would have caused high
drag due to flow separation. The revised fuselage has a more gradual aft section that will reduce this
problem.
The overall length of the glider has also been changed from 14.5 to 18.5 feet. This was done so
that the new payload box could be contained within the fuselage, and also allowed the tail to be moved
further back, creating greater control moments when control surfaces are deflected. It should also be
noted that the tail has been elevated in the final concept. This was done to reduce the amount of
3 ft
3 ft
9 ft
1.5 ft
Advanced Logistics Delivery System
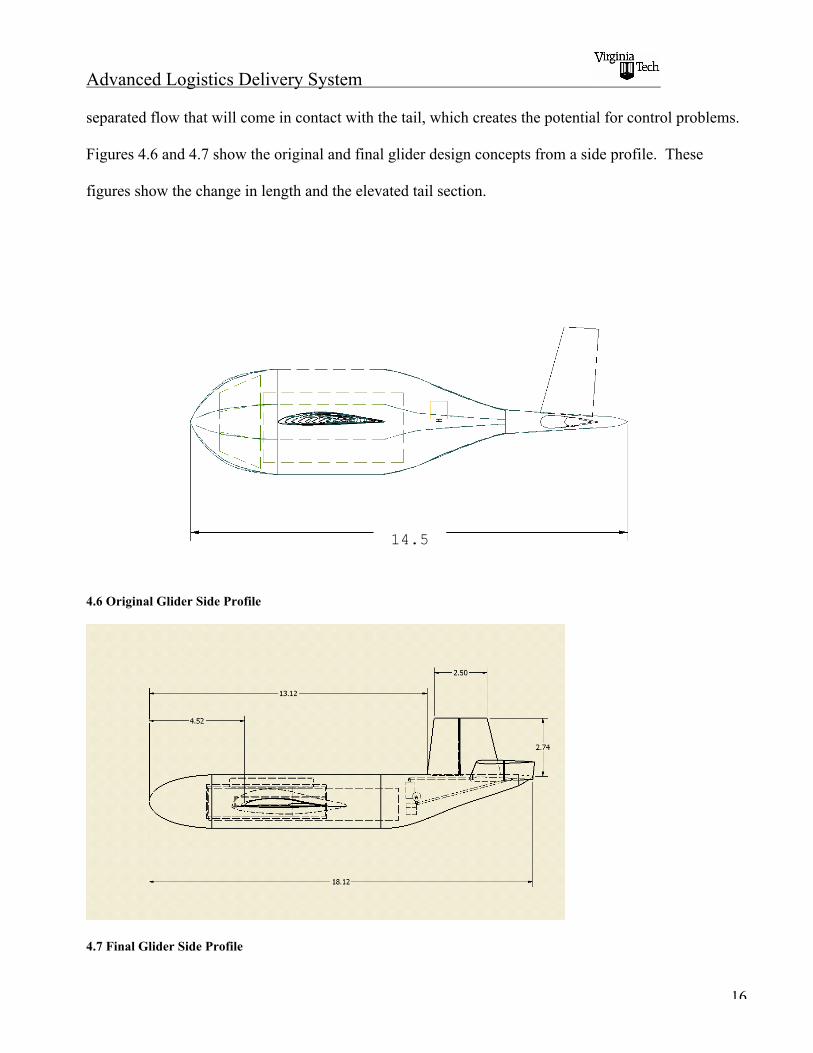
16
separated flow that will come in contact with the tail, which creates the potential for control problems.
Figures 4.6 and 4.7 show the original and final glider design concepts from a side profile. These
figures show the change in length and the elevated tail section.
4.6 Original Glider Side Profile
4.7 Final Glider Side Profile
14.5
Advanced Logistics Delivery System
17
Further design was also done on the solid structure wings that attach to the fuselage and hold
the inflatable wing material. In the initial concept, solid wing sections were shown, but structural
concepts were ambiguous. The final design concept has a banjo frame design that will provide
structural support and allows the necessary volume needed to hold the deflated wing material. This
design will also aid in the streamlining of the fuselage by decreasing the sharp angles at the connection
points of the fuselage and solid wing structures.
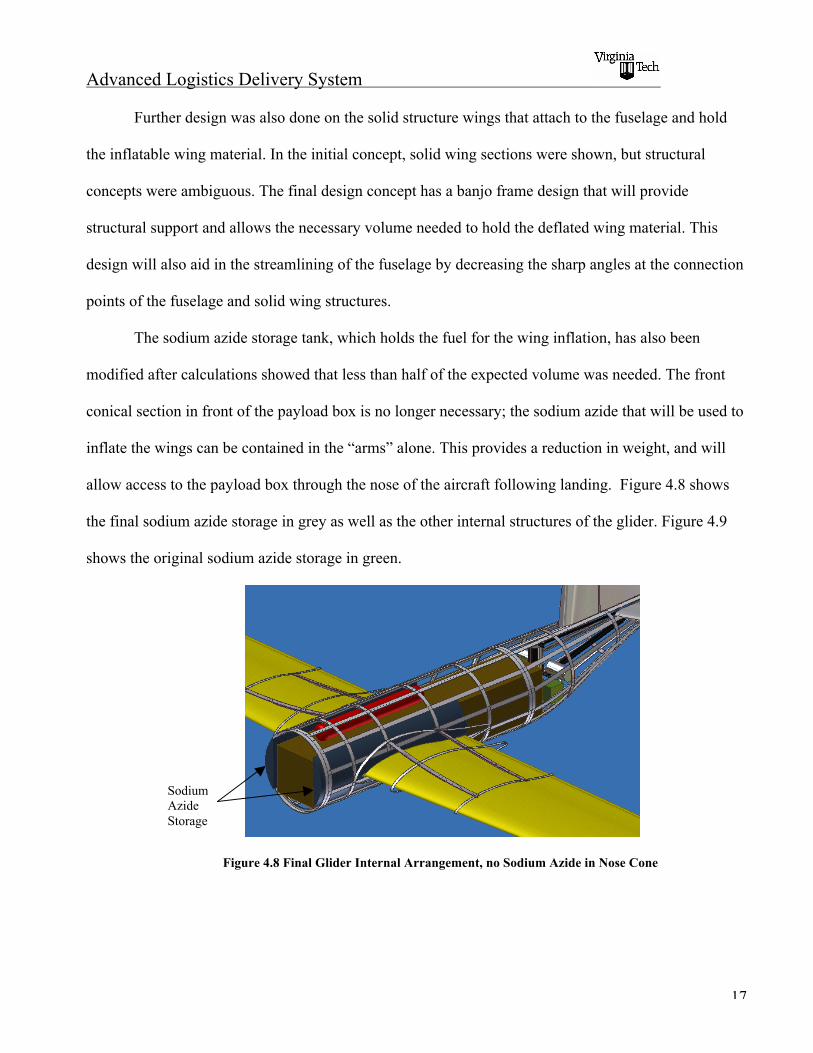
The sodium azide storage tank, which holds the fuel for the wing inflation, has also been
modified after calculations showed that less than half of the expected volume was needed. The front
conical section in front of the payload box is no longer necessary; the sodium azide that will be used to
inflate the wings can be contained in the “arms” alone. This provides a reduction in weight, and will
allow access to the payload box through the nose of the aircraft following landing. Figure 4.8 shows
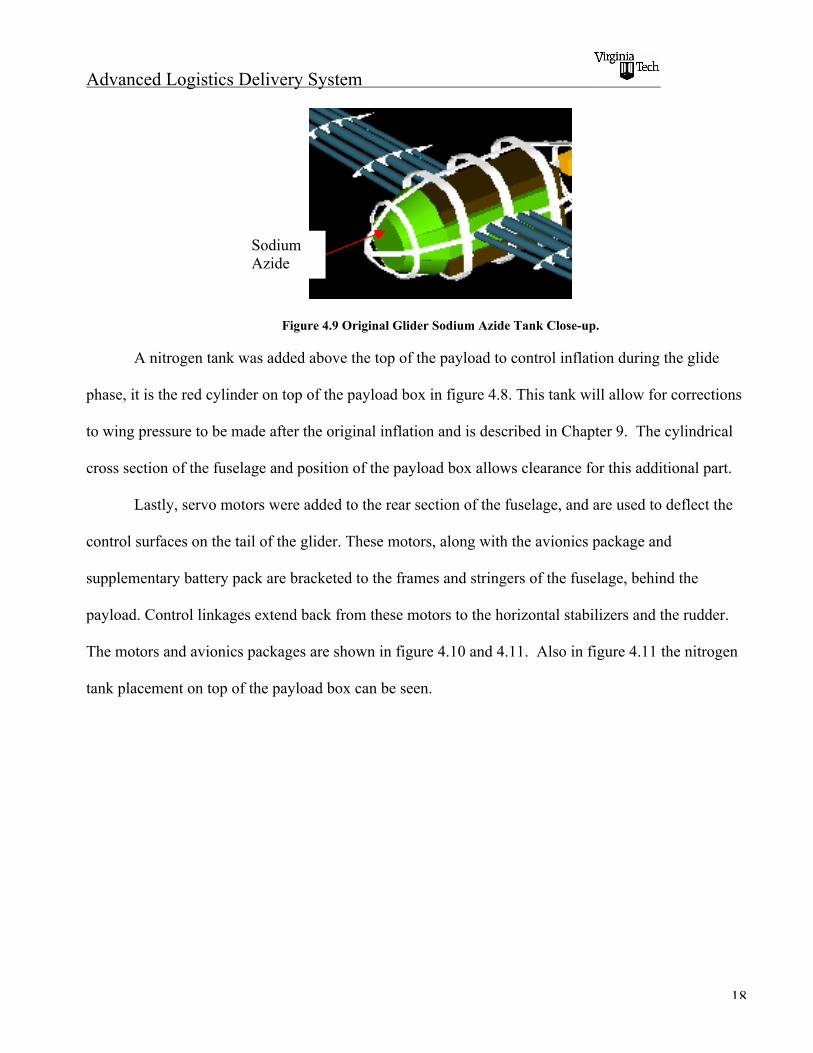
the final sodium azide storage in grey as well as the other internal structures of the glider. Figure 4.9
shows the original sodium azide storage in green.
Figure 4.8 Final Glider Internal Arrangement, no Sodium Azide in Nose Cone
SodiumAzideStorage
Advanced Logistics Delivery System
18
Figure 4.9 Original Glider Sodium Azide Tank Close-up.
A nitrogen tank was added above the top of the payload to control inflation during the glide
phase, it is the red cylinder on top of the payload box in figure 4.8. This tank will allow for corrections
to wing pressure to be made after the original inflation and is described in Chapter 9. The cylindrical
cross section of the fuselage and position of the payload box allows clearance for this additional part.
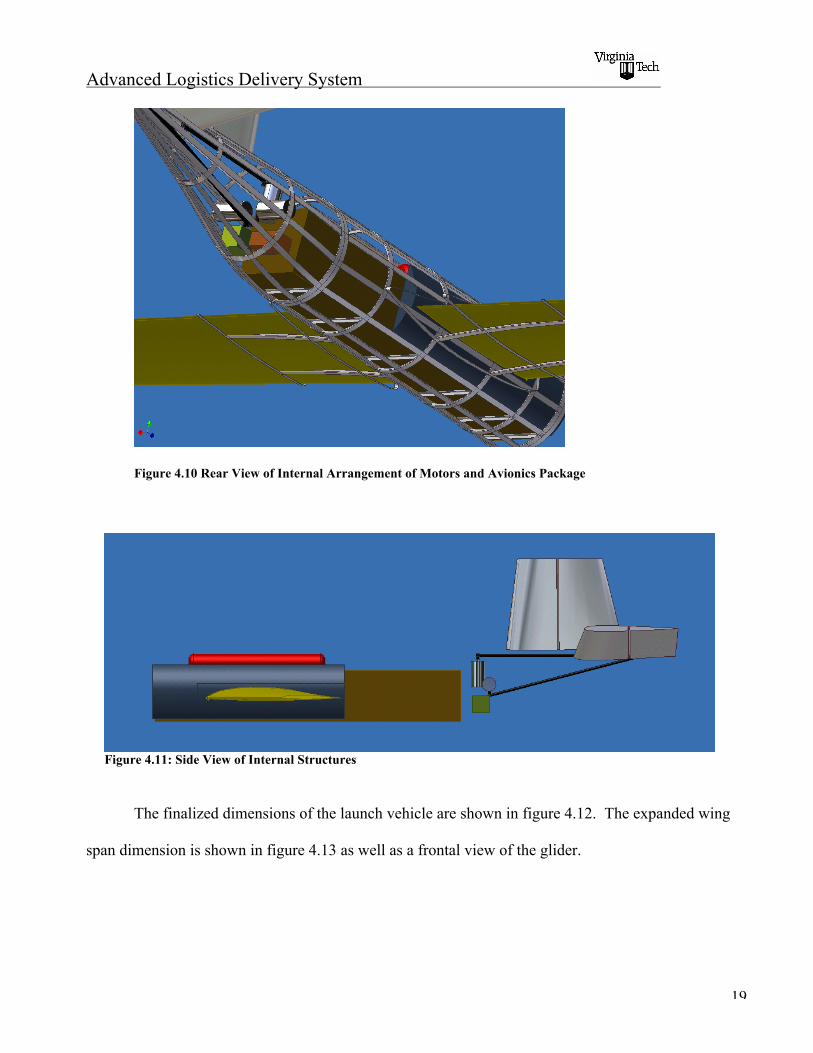
Lastly, servo motors were added to the rear section of the fuselage, and are used to deflect the
control surfaces on the tail of the glider. These motors, along with the avionics package and
supplementary battery pack are bracketed to the frames and stringers of the fuselage, behind the
payload. Control linkages extend back from these motors to the horizontal stabilizers and the rudder.
The motors and avionics packages are shown in figure 4.10 and 4.11. Also in figure 4.11 the nitrogen
tank placement on top of the payload box can be seen.
SodiumAzide
Advanced Logistics Delivery System
19
Figure 4.10 Rear View of Internal Arrangement of Motors and Avionics Package
Figure 4.11: Side View of Internal Structures
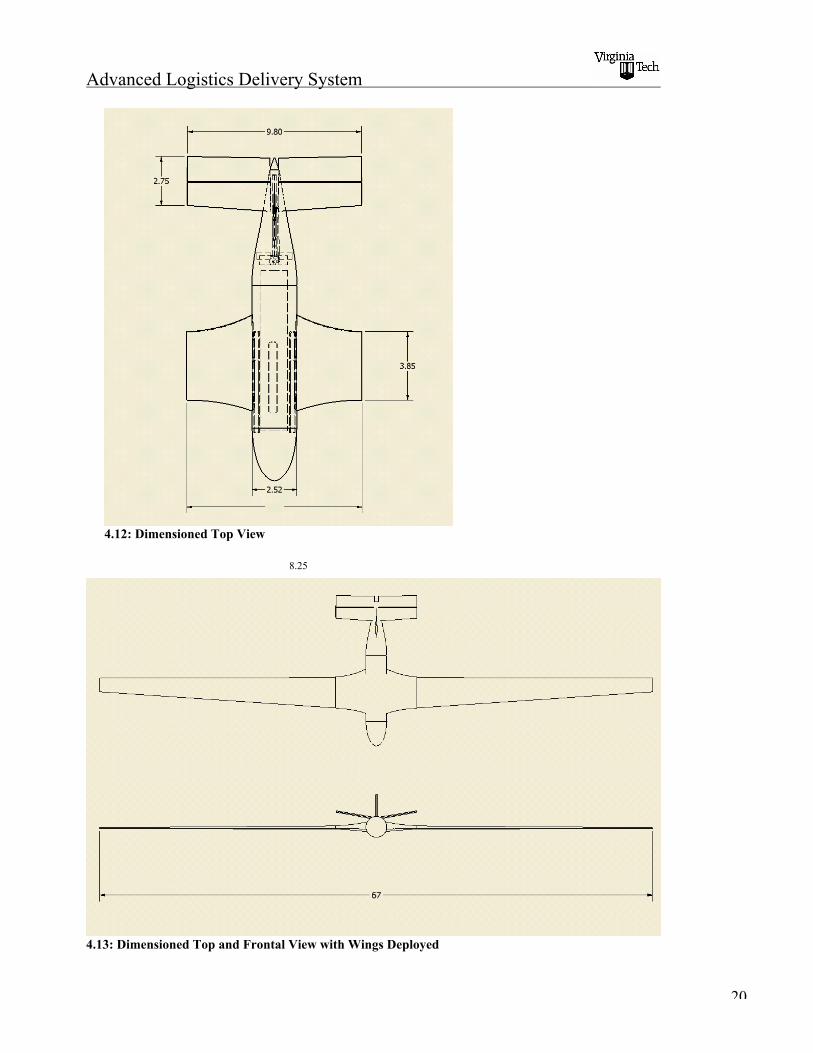
The finalized dimensions of the launch vehicle are shown in figure 4.12. The expanded wing
span dimension is shown in figure 4.13 as well as a frontal view of the glider.
Advanced Logistics Delivery System
20
4.12: Dimensioned Top View
4.13: Dimensioned Top and Frontal View with Wings Deployed
8.25
Advanced Logistics Delivery System
21
Chapter 5: Aerodynamics of the Launch and Climb
5.1 Introduction
There are two key factors in determining the range of a glider: the lift to drag ratio (L/D) and
the altitude at which the wings are deployed. Currently, the best gliders and sailplanes can achieve a
maximum L/D of around 40. This is not expected to be a reasonable approximation for what the
ALDS will be able to achieve because it incorporates an inflatable wing, which will hinder the
aerodynamics of the vehicle. For this reason an L/D ratio of 33 is used as an estimate for this section
of the report. With the 50 mile range requirement and an L/D around 33, the glider needs to reach an
altitude of 8000ft. This section will focus on achieving this height and even surpassing it if possible,
since an increased apogee height would allow for a lower L/D which would in turn lower the costs of
each vehicle. Two different approaches were studied to determine if and how the glider is to achieve
this height. The first was to approximate the motion of the aircraft as a projectile, ignoring all
aerodynamic effects, and the second was to consider controlling the launch vehicle such that it could
generate lift and maintain a constant climb angle, which was suggested by Geoff Hope of Naval
Surface Warfare Center, Carderock Division.
5.2 Projectile Motion
With the projectile motion model, it is assumed that the only force acting on the body is
gravity. This is a considerable approximation since the glider will be launched at a speed of 500 knots
and has aerodynamic controls allowing it to stay aligned with the flow, but was considered to be a
good starting point. The standard kinematics equations (Eqns. 5.1 and 5.2) can be used to determine
the flight path of the body.
Advanced Logistics Delivery System
22
ttd
sd
td
sd
td
sd
ttd
sdt
td
sdss
o
oo
2
2
22
2
2
1
+=
++=(Eqns 5.1 and 5.2)
In these equations, s is the position of the body in the horizontal and vertical directions and t is time.
The derivation of these equations in not included, but can be obtained in any standard physics
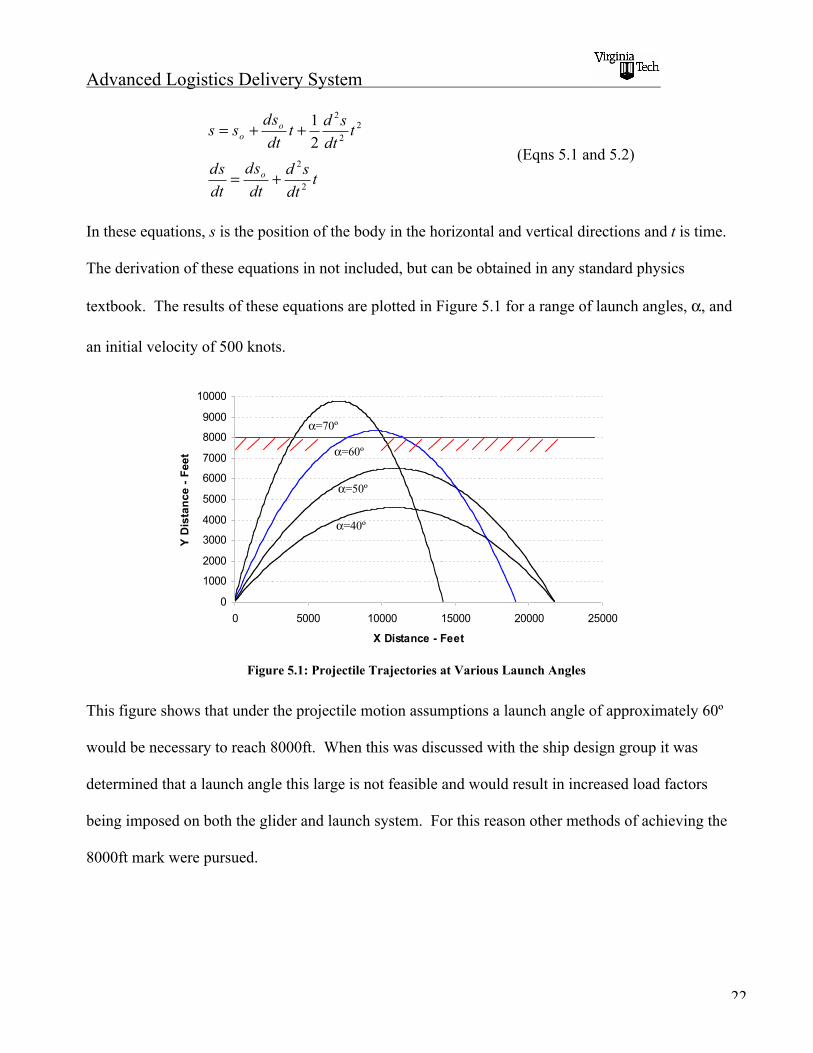
textbook. The results of these equations are plotted in Figure 5.1 for a range of launch angles, !, and
an initial velocity of 500 knots.
0
1000
2000
3000
4000
5000
6000
7000
8000
9000
10000
0 5000 10000 15000 20000 25000
X Distance - Feet
Y D
ista
nc
e -
Fe
et
Figure 5.1: Projectile Trajectories at Various Launch Angles
This figure shows that under the projectile motion assumptions a launch angle of approximately 60º
would be necessary to reach 8000ft. When this was discussed with the ship design group it was
determined that a launch angle this large is not feasible and would result in increased load factors
being imposed on both the glider and launch system. For this reason other methods of achieving the
8000ft mark were pursued.
!=40º
!=50º
!=60º
!=70º
Advanced Logistics Delivery System
23
5.3 Constant Flight Angle
In this situation, the glider is launched from the ship at a given angle and it is assumed to
maintain a straight flight path using its aerodynamic controls. To maintain this flight path the launch
vehicle must continually increase its angle of attack to compensate for the lost velocity. This process
is continued up until a few seconds before the vehicle stalls, at which time the nose is pitched down
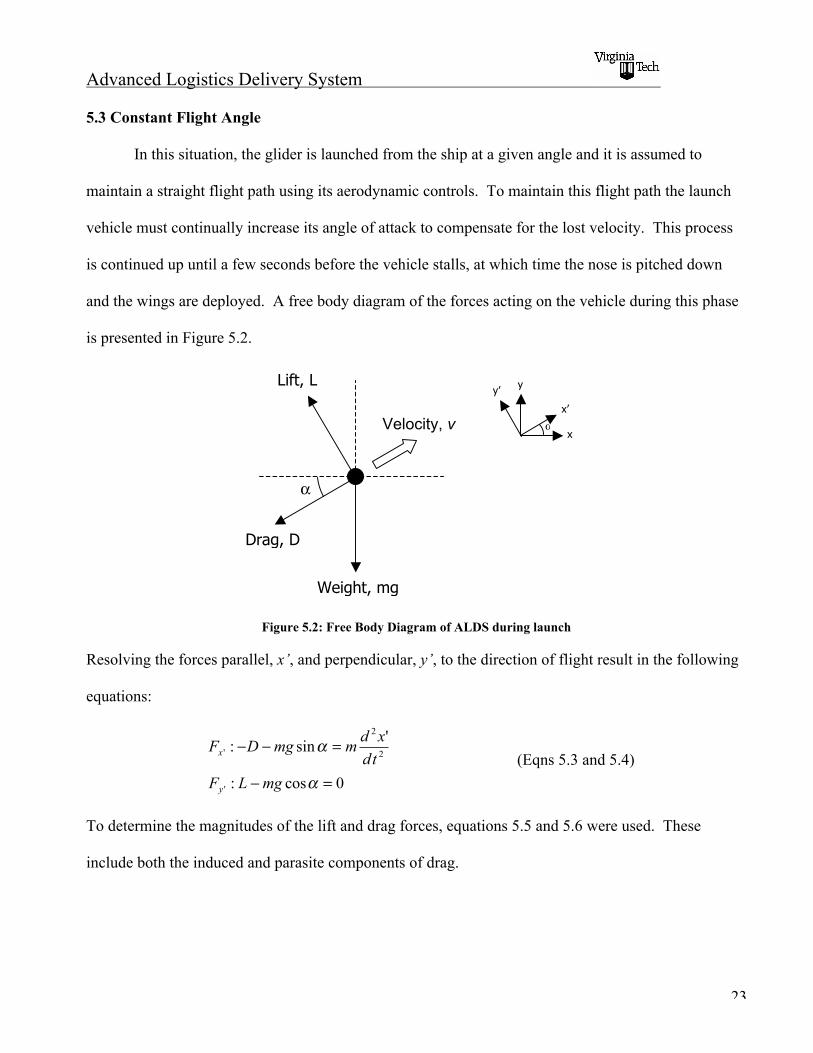
and the wings are deployed. A free body diagram of the forces acting on the vehicle during this phase
is presented in Figure 5.2.
Figure 5.2: Free Body Diagram of ALDS during launch
Resolving the forces parallel, x’, and perpendicular, y’, to the direction of flight result in the following
equations:
0cos:
'sin:
'
2
2
'
=!
=!!
"
"
mgLF
td
xdmmgDF
y
x(Eqns 5.3 and 5.4)
To determine the magnitudes of the lift and drag forces, equations 5.5 and 5.6 were used. These
include both the induced and parasite components of drag.
Weight, mg
Drag, D
Lift, L
!
Velocity, v !x
x’
yy’
Advanced Logistics Delivery System
24
!!"
#$$%
&+==
=
'())
)
AR
CCSVSCVD
SCVL
LDD
L
22
212
21
221
0
(Eqns 5.5 and 5.6) (Bertin, 2002)
In these equations, _ is the density of the air, _ is Oswald’s efficiency factor, S is the planar surface
area, and AR is the aspect ratio of the wing. Substituting equations 5.5 and 5.6 into equations 5.3 and
5.4 yields the following equations of motion:
0'
2
'
sin'
cos' 0
2
21
22
2
2
=
!!"
#$$%
&
''
!!"
#$$%
&'=
td
yd
m
CStd
xd
g
ARStd
xd
mg
td
xdD(
)
*+(
)
(Eqns 5.7 and 5.8)
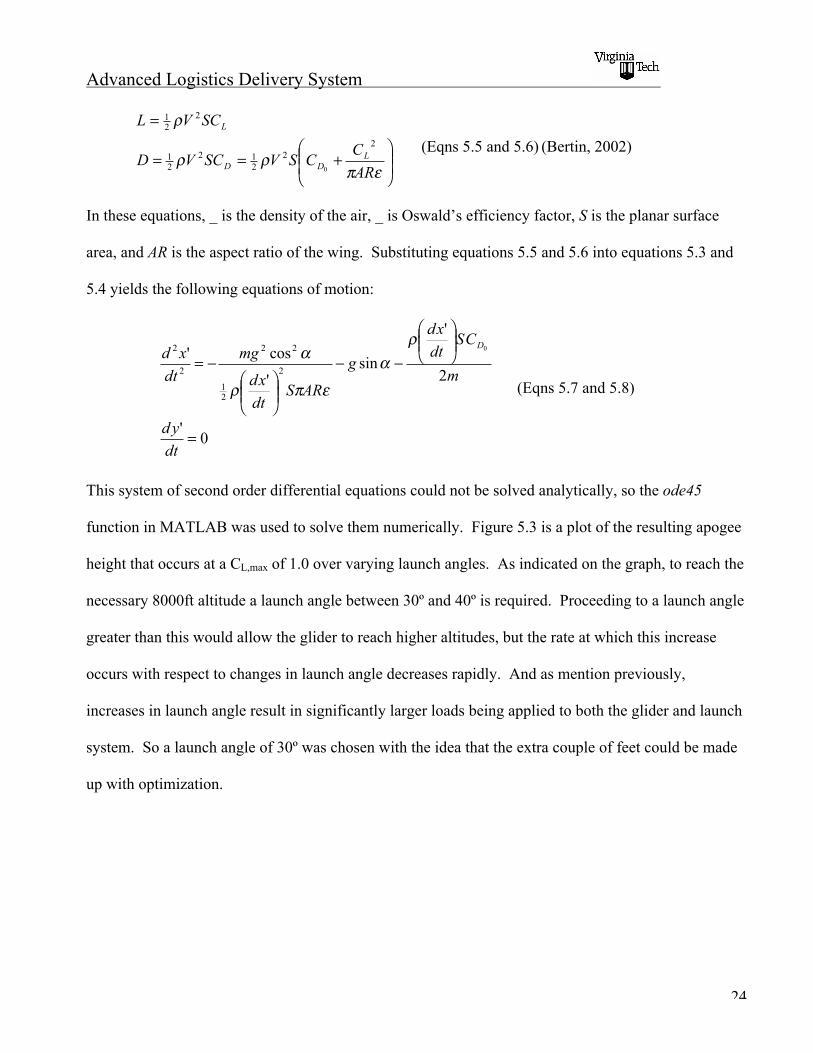
This system of second order differential equations could not be solved analytically, so the ode45
function in MATLAB was used to solve them numerically. Figure 5.3 is a plot of the resulting apogee
height that occurs at a CL,max of 1.0 over varying launch angles. As indicated on the graph, to reach the
necessary 8000ft altitude a launch angle between 30º and 40º is required. Proceeding to a launch angle
greater than this would allow the glider to reach higher altitudes, but the rate at which this increase
occurs with respect to changes in launch angle decreases rapidly. And as mention previously,
increases in launch angle result in significantly larger loads being applied to both the glider and launch
system. So a launch angle of 30º was chosen with the idea that the extra couple of feet could be made
up with optimization.
Advanced Logistics Delivery System
25
0 10 20 30 40 50 60 70 80 900
1000
2000
3000
4000
5000
6000
7000
8000
9000
10000
Launch Angle - Degrees
Apogee Height - Feet
Figure 5.3: Variation of Apogee Height with Launch Angle
5.4 Performance Analysis
The original configuration of the launch vehicle had a wing span of 9.5ft, a chord length of
3.5ft, and a wetted surface area of 270ft2. These dimensions were estimates used to compare and
contrast many of the earlier concepts, but have not been optimized to provide the maximum height
possible. To find these optimal values, sensitivity analyses were run using equations 5.7 and 5.8. To
make these equations as representative as possible, Oswald’s efficiency factor was varied using the
following equation:
!!"
#$$%
&!"#$
%&'=
2
0 1 b
d(( (Equation 5.9) (Raymer, 1999)
where b is the wing span, d is the diameter of the fuselage, and _0 is the estimated value for the
efficiency factor with the wings inflated. This variation in efficiency is necessary because during the
launch phase the wing span is of a similar size compared to the diameter of the fuselage. If this were
Advanced Logistics Delivery System
26
not the case, as with most airplanes, then a change in wing span would have a greatly reduced effect on
the efficiency factor. The results of this study can be seen in the following graphs:
5 6 7 8 9 10
7400
7500
7600
7700
7800
7900
8000
8100
Span - Units in ft
Height - Units in ft
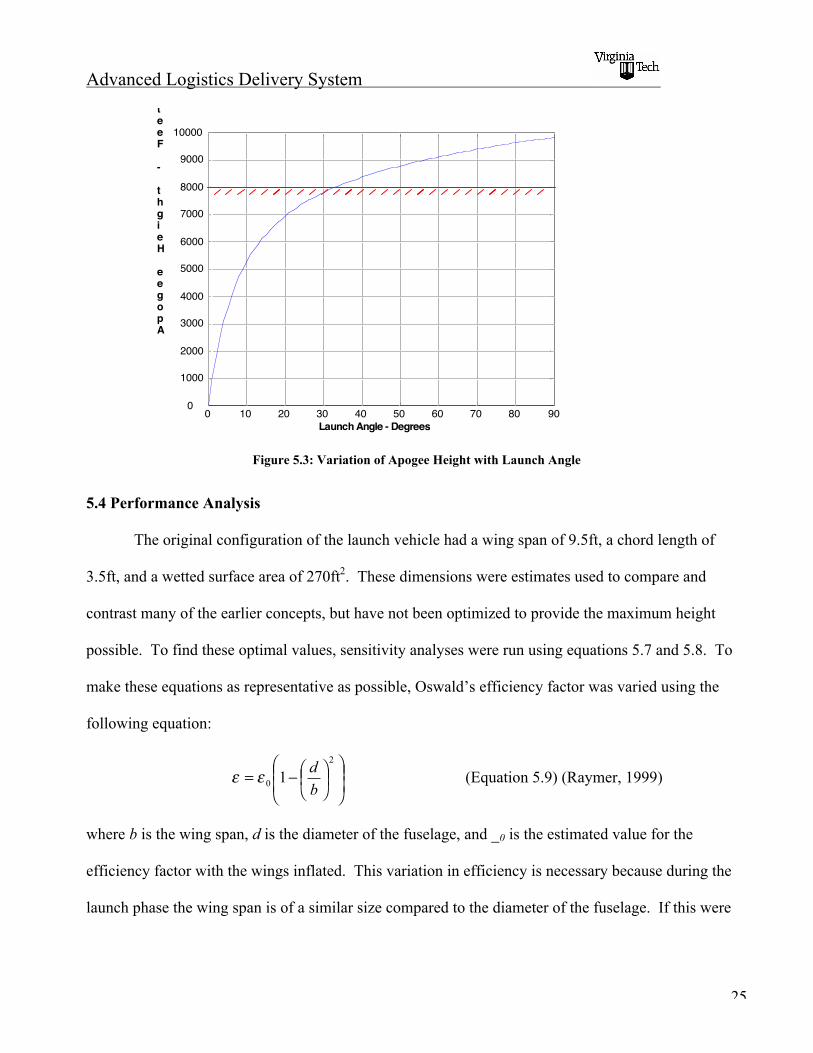
Figure 5.4: Variations in Apogee Height with Span
1 1.5 2 2.5 3 3.5 4 4.5 5
7500
7600
7700
7800
7900
8000
8100
8200
8300
Chord - Units in ft
Height - Units in ft
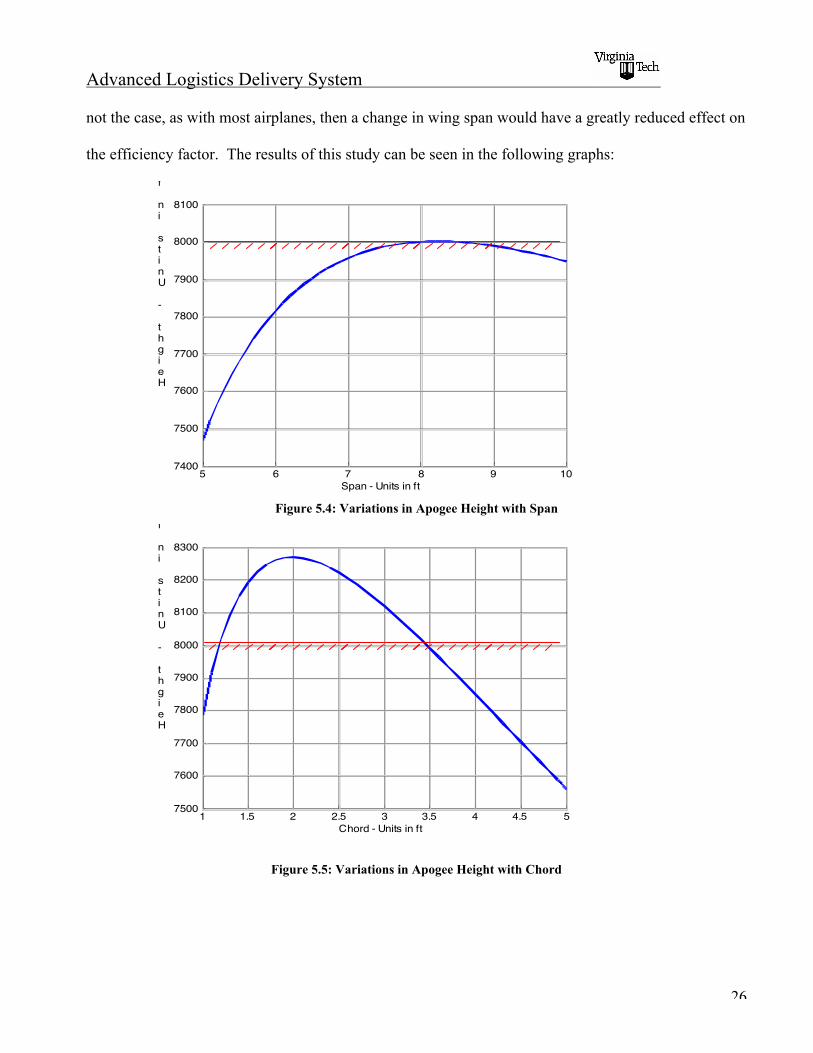
Figure 5.5: Variations in Apogee Height with Chord
Advanced Logistics Delivery System
27
Figure 5.4 shows that the initial wing span of 9.5ft should be decreased to 8.25ft to allow for an
increase of approximately 50ft in altitude. This goes against intuition which would indicate that a
decrease in span would result in a decrease in available lift and therefore a decrease in altitude,
especially since CD0 is assumed to be constant. But upon further review of the equations of motion
(Eqns 5.7 and 5.8), this relationship can be understood by considering the changes in acceleration due
to this decrease in wing span. Figure 5.5, the sensitivity analysis for changes in chord length, also
indicates that the chord length needs to be decreased to achieve higher altitudes. Just a 1ft decrease in
length would allow the glider to gain an extra 200ft of altitude before the inflatable wings would be
deployed. Unfortunately, decreasing the chord length would have an adverse effect on both the
amount of structure in the wing and the flight characteristics during glide. These factors would
decrease the overall range of the glider, so the chord length is left at 3.5ft.
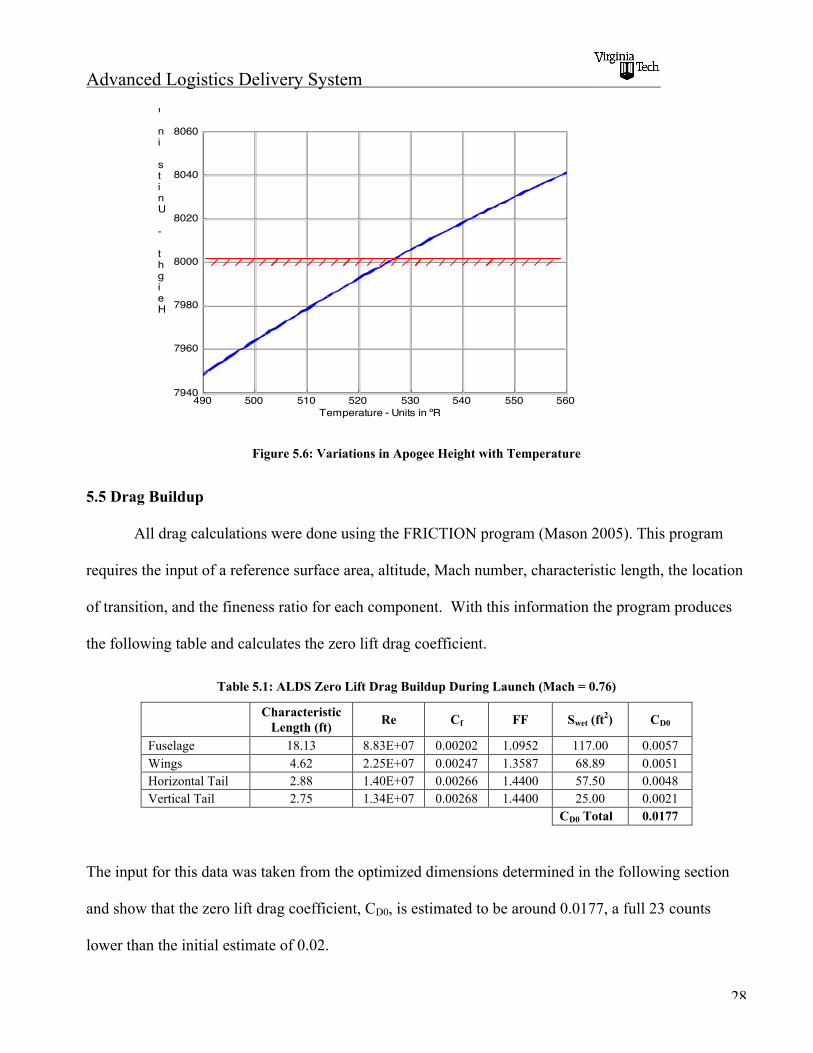
An additional sensitivity analysis was also made for changes in sea level temperature to
determine the range of weather conditions in which the glider would be able to operate. The results of
this analysis are shown in Figure 5.6 and show that the launch vehicle will be able to achieve the
8000ft benchmark in dry weather conditions above 525ºR (65.3ºF).
Advanced Logistics Delivery System
28
490 500 510 520 530 540 550 560
7940
7960
7980
8000
8020
8040
8060
Temperature - Units in ºR
Height - Units in ft
Figure 5.6: Variations in Apogee Height with Temperature
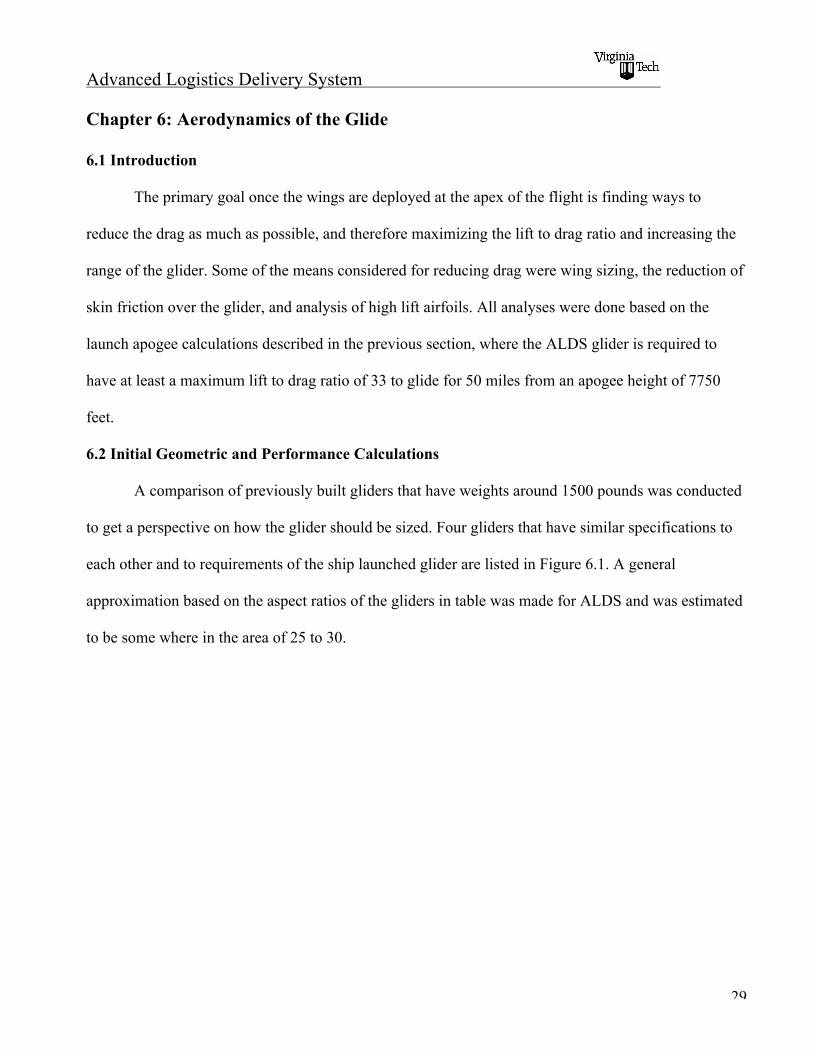
5.5 Drag Buildup
All drag calculations were done using the FRICTION program (Mason 2005). This program
requires the input of a reference surface area, altitude, Mach number, characteristic length, the location
of transition, and the fineness ratio for each component. With this information the program produces
the following table and calculates the zero lift drag coefficient.
Table 5.1: ALDS Zero Lift Drag Buildup During Launch (Mach = 0.76)
CharacteristicLength (ft)
Re Cf FF Swet (ft2) CD0
Fuselage 18.13 8.83E+07 0.00202 1.0952 117.00 0.0057Wings 4.62 2.25E+07 0.00247 1.3587 68.89 0.0051Horizontal Tail 2.88 1.40E+07 0.00266 1.4400 57.50 0.0048Vertical Tail 2.75 1.34E+07 0.00268 1.4400 25.00 0.0021
CD0 Total 0.0177
The input for this data was taken from the optimized dimensions determined in the following section
and show that the zero lift drag coefficient, CD0, is estimated to be around 0.0177, a full 23 counts
lower than the initial estimate of 0.02.
Advanced Logistics Delivery System
29
Chapter 6: Aerodynamics of the Glide
6.1 Introduction
The primary goal once the wings are deployed at the apex of the flight is finding ways to
reduce the drag as much as possible, and therefore maximizing the lift to drag ratio and increasing the
range of the glider. Some of the means considered for reducing drag were wing sizing, the reduction of
skin friction over the glider, and analysis of high lift airfoils. All analyses were done based on the
launch apogee calculations described in the previous section, where the ALDS glider is required to
have at least a maximum lift to drag ratio of 33 to glide for 50 miles from an apogee height of 7750
feet.
6.2 Initial Geometric and Performance Calculations
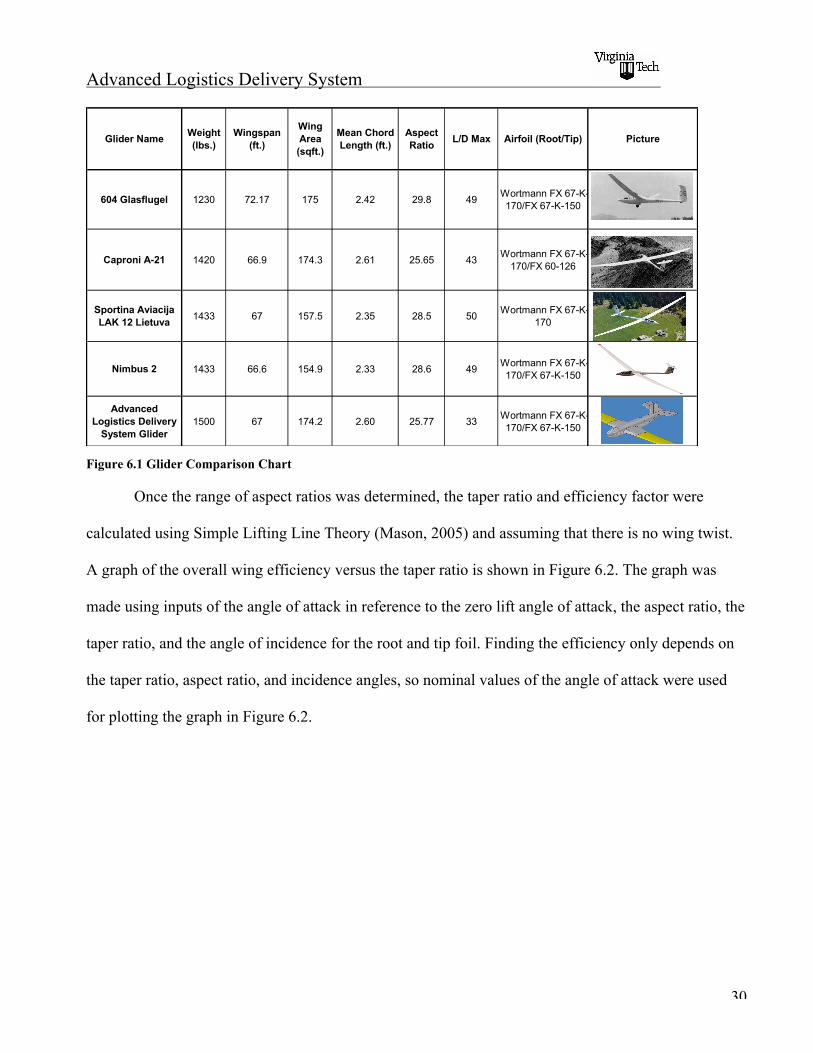
A comparison of previously built gliders that have weights around 1500 pounds was conducted
to get a perspective on how the glider should be sized. Four gliders that have similar specifications to
each other and to requirements of the ship launched glider are listed in Figure 6.1. A general
approximation based on the aspect ratios of the gliders in table was made for ALDS and was estimated
to be some where in the area of 25 to 30.
Advanced Logistics Delivery System
30
Glider NameWeight (lbs.)
Wingspan (ft.)
Wing Area (sqft.)
Mean Chord Length (ft.)
Aspect Ratio
L/D Max Airfoil (Root/Tip) Picture
604 Glasflugel 1230 72.17 175 2.42 29.8 49Wortmann FX 67-K-170/FX 67-K-150
Caproni A-21 1420 66.9 174.3 2.61 25.65 43Wortmann FX 67-K-
170/FX 60-126
Sportina Aviacija LAK 12 Lietuva
1433 67 157.5 2.35 28.5 50Wortmann FX 67-K-
170
Nimbus 2 1433 66.6 154.9 2.33 28.6 49Wortmann FX 67-K-170/FX 67-K-150
Advanced Logistics Delivery
System Glider1500 67 174.2 2.60 25.77 33
Wortmann FX 67-K-170/FX 67-K-150
Figure 6.1 Glider Comparison Chart
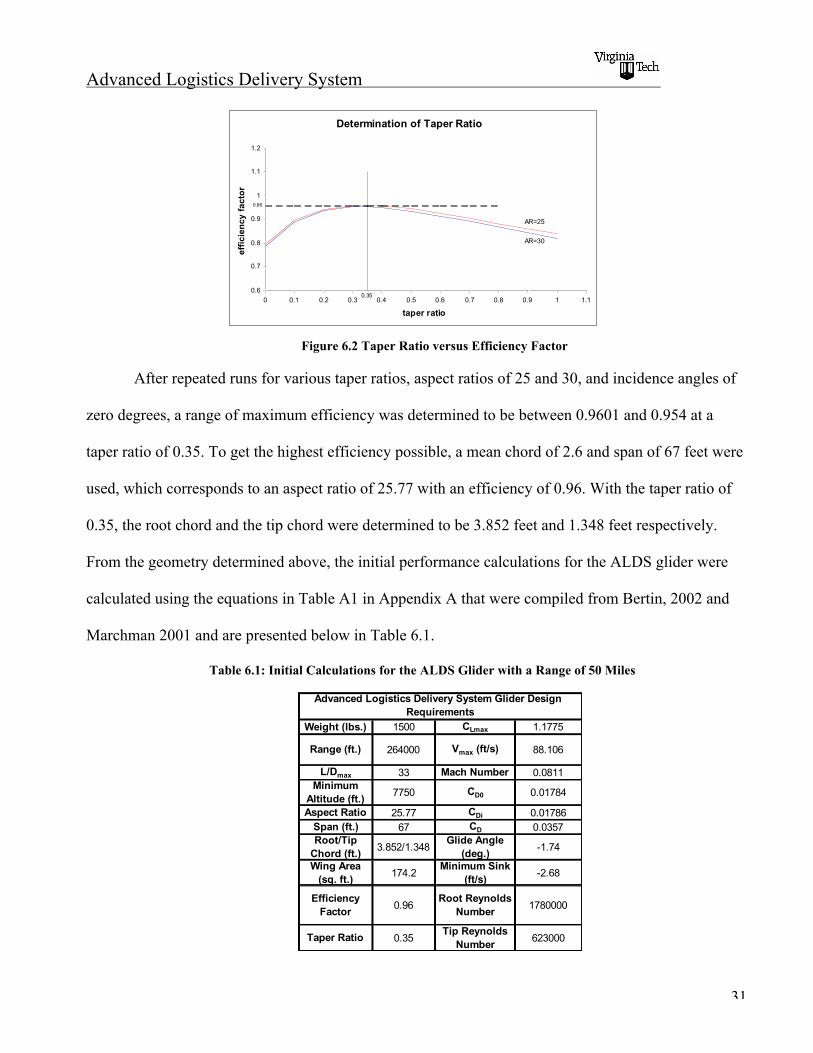
Once the range of aspect ratios was determined, the taper ratio and efficiency factor were
calculated using Simple Lifting Line Theory (Mason, 2005) and assuming that there is no wing twist.
A graph of the overall wing efficiency versus the taper ratio is shown in Figure 6.2. The graph was
made using inputs of the angle of attack in reference to the zero lift angle of attack, the aspect ratio, the
taper ratio, and the angle of incidence for the root and tip foil. Finding the efficiency only depends on
the taper ratio, aspect ratio, and incidence angles, so nominal values of the angle of attack were used
for plotting the graph in Figure 6.2.
Advanced Logistics Delivery System
31
Determination of Taper Ratio
0.6
0.7
0.8
0.9
1
1.1
1.2
0 0.1 0.2 0.3 0.4 0.5 0.6 0.7 0.8 0.9 1 1.1
taper ratio
eff
icie
nc
y f
ac
tor
0.35
AR=30
AR=25
0.96
Figure 6.2 Taper Ratio versus Efficiency Factor
After repeated runs for various taper ratios, aspect ratios of 25 and 30, and incidence angles of
zero degrees, a range of maximum efficiency was determined to be between 0.9601 and 0.954 at a
taper ratio of 0.35. To get the highest efficiency possible, a mean chord of 2.6 and span of 67 feet were
used, which corresponds to an aspect ratio of 25.77 with an efficiency of 0.96. With the taper ratio of
0.35, the root chord and the tip chord were determined to be 3.852 feet and 1.348 feet respectively.
From the geometry determined above, the initial performance calculations for the ALDS glider were
calculated using the equations in Table A1 in Appendix A that were compiled from Bertin, 2002 and
Marchman 2001 and are presented below in Table 6.1.
Table 6.1: Initial Calculations for the ALDS Glider with a Range of 50 Miles
Weight (lbs.) 1500 CLmax 1.1775
Range (ft.) 264000 Vmax (ft/s) 88.106
L/Dmax 33 Mach Number 0.0811Minimum
Altitude (ft.)7750 CD0 0.01784
Aspect Ratio 25.77 CDi 0.01786Span (ft.) 67 CD 0.0357Root/Tip
Chord (ft.)3.852/1.348
Glide Angle (deg.)
-1.74
Wing Area (sq. ft.)
174.2Minimum Sink
(ft/s)-2.68
Efficiency Factor
0.96Root Reynolds
Number1780000
Taper Ratio 0.35Tip Reynolds
Number623000
Advanced Logistics Delivery System Glider Design Requirements

Advanced Logistics Delivery System
32
6.3 Airfoil Boundary Layer Analysis
Skin friction and pressure drag coefficients are the two components of the zero-lift drag
coefficient that can be easily calculated for the wings, fuselage, and tail. The wings account for
roughly fifty percent of the overall zero lift drag coefficient, which makes the wing airfoils the primary
concern, specifically in the case of the ALDS glider, because the majority of its span is comprised of
inflated material. Judging by the previously calculated zero lift drag coefficient of 0.01784, the
estimated zero lift drag coefficient of the wing is 0.00892.
For the ALDS glider, the only way to obtain high lift is from the geometry of the airfoil. For
the airfoil analysis, the airfoils from the gliders in Figure 6.1 were used. Every glider in the chart used
the Wortmann FX 67-K-170 as its root airfoil, which is a good indication of its performance. As for the
tip airfoil, the gliders used the Wortmann FX 60-126, the Wortmann FX 67-K-150, and the Wortmann
67-K-170. The root and tip airfoils that are displayed in Table 6.2 were analyzed at their respective
Reynolds numbers of 1.78x10⁶ and 6.23x10⁵.
Table 6.2: Analyzed Airfoil Profiles
AirfoilThickness
(%c)Leading Edge Radius (%c)
Camber (%c)
Trailing Edge Angle (deg)
Profile
Wortmann FX 67-K-170 0.1701 0.0087 0.0507 16.79
Wortmann FX 67-K-150 0.1498 0.0081 0.0483 9.861
Wortmann FX 60-126 0.1259 0.0095 0.0356 6.52
All the boundary layer analyses were done using XFOIL 6.9 (Drela, 2005). The input
requirements for the program are the Reynolds Number, the Mach number, the airfoil contours, and the
angle of attack. The program can output a variety useful data and can analyze the airfoil over ranges of
Advanced Logistics Delivery System
33
angle of attack or lift coefficients. The primary output analyzed was the point of transition on the
airfoil, the angle of attack that maximum lift to drag ratio occurs, and the value of the zero lift drag
coefficient at the maximum lift to drag ratio of the airfoil. After boundary layer analysis of the root and
tip foils, the Wortmann FX 67-K-170 was determined to be adequate for the root airfoil and the
Wortmann FX 67-K-150 was used for the tip airfoil.
While in flight, the airfoil is going to see a possible decrease in internal pressure as the ALDS
glider decreases in altitude. When the wings are inflated at an altitude of around 8000 feet, the external
pressure will be 10.92 psi and when the glider lands the pressure is going to be around 14.70 psi. The
airfoil will be inflated to a pressure of 1000 psi (justification for this number is found in chapter 8) to
keep rigid against the lifting forces that are expected in the glide phase, so deflation due to the altitude
decrease will be minimal.
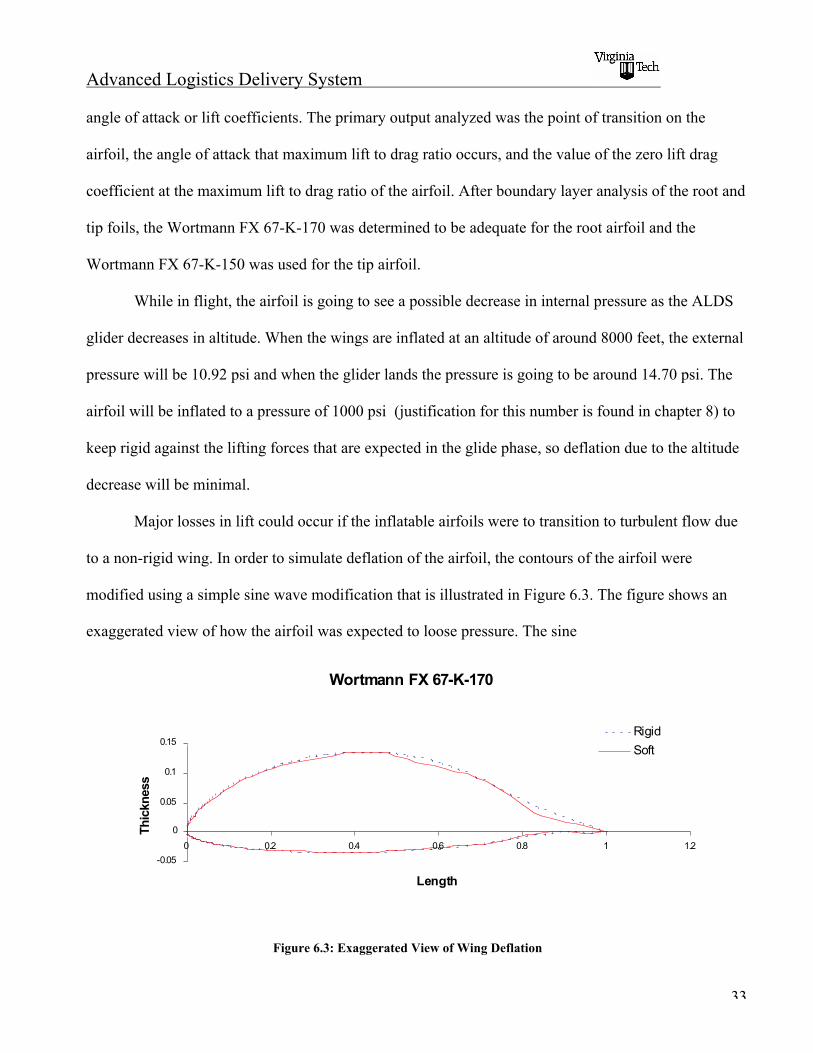
Major losses in lift could occur if the inflatable airfoils were to transition to turbulent flow due
to a non-rigid wing. In order to simulate deflation of the airfoil, the contours of the airfoil were
modified using a simple sine wave modification that is illustrated in Figure 6.3. The figure shows an
exaggerated view of how the airfoil was expected to loose pressure. The sine
Wortmann FX 67-K-170
-0.05
0
0.05
0.1
0.15
0 0.2 0.4 0.6 0.8 1 1.2
Length
Th
ickn
ess
Rigid
Soft
Figure 6.3: Exaggerated View of Wing Deflation

Advanced Logistics Delivery System
34
wave approximation was made so that there was smooth transition between contour points so boundary
layer analysis could be conducted. The wing will be fitted with a pressure valve that will increase the
airfoil pressure from a spare onboard tank if pressure drops by 10 psi, which translates to a one percent
change in the airfoil contour position. The original and modified contours are presented in Figure B1
and Figure B2 in Appendix B. A comparison of the zero-lift drag coefficients and section lift
coefficients for both airfoils are shown in graphs in Figure B7 and Figure B13 in Appendix B and the
maximums are compared in Table 6.3. The graphs show how the Wortmann FX 67-K-170 has a much
greater loss in lift after deflation than the Wortmann FX 67-K-150. Even with a one percent loss of
pressure inside the wing, the zero lift drag on the wing was below the maximum allowable drag
coefficient of 0.00892.
Table 6.3 Comparison of Rigid Wing and a One Percent Deflated Wing
Airfoil Type CD0wing % Change Cl % ChangeRigid 0.00629 1.0651Deflated 0.00765 1.0634Rigid 0.00852 1.0367Deflated 0.00798 0.9373
0.16
9.59
Wortmann FX 67-K-170
Wortmann FX 67-K-150
21.62
-6.34
When the airfoils were deflated one percent, a laminar bubble formed along the upper surface
of the airfoil. Graphs of the skin friction coefficient along the root and tip airfoil shown in Figure B3
and Figure B9 in Appendix B show that a laminar bubble forms at about 0.466 chord for the root
airfoil and a small laminar bubble forms at about 0.5 chord on the tip airfoil. In an effort to further
reduce the drag when the airfoil is partially deflated, the flow was tripped at 0.466 chord and transition
was forced. A comparison of the lift and drag coefficients between the airfoil with the laminar bubble
and the airfoil when the flow was tripped is presented in Figure B8 in Appendix B. The graph showed
that tripping the flow before the formation of the laminar bubble had a relatively small effect on the
overall values of lift and drag of the airfoil.
Advanced Logistics Delivery System
35
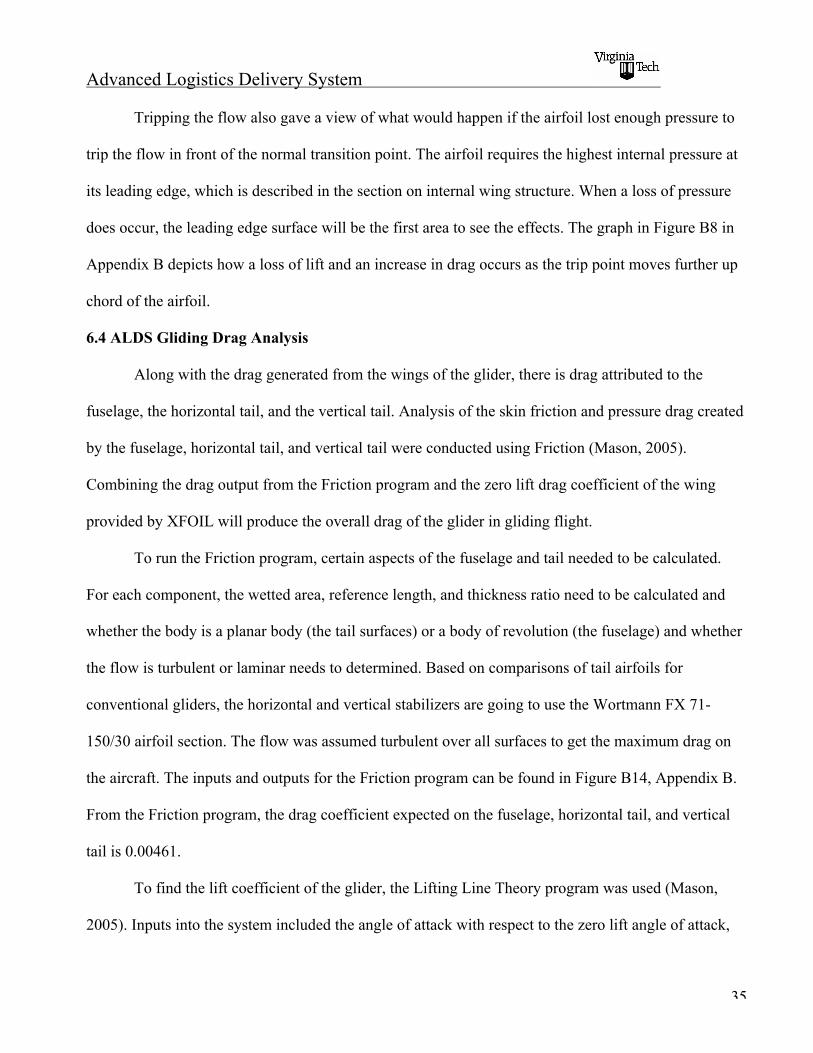
Tripping the flow also gave a view of what would happen if the airfoil lost enough pressure to
trip the flow in front of the normal transition point. The airfoil requires the highest internal pressure at
its leading edge, which is described in the section on internal wing structure. When a loss of pressure
does occur, the leading edge surface will be the first area to see the effects. The graph in Figure B8 in
Appendix B depicts how a loss of lift and an increase in drag occurs as the trip point moves further up
chord of the airfoil.
6.4 ALDS Gliding Drag Analysis
Along with the drag generated from the wings of the glider, there is drag attributed to the
fuselage, the horizontal tail, and the vertical tail. Analysis of the skin friction and pressure drag created
by the fuselage, horizontal tail, and vertical tail were conducted using Friction (Mason, 2005).
Combining the drag output from the Friction program and the zero lift drag coefficient of the wing
provided by XFOIL will produce the overall drag of the glider in gliding flight.
To run the Friction program, certain aspects of the fuselage and tail needed to be calculated.
For each component, the wetted area, reference length, and thickness ratio need to be calculated and
whether the body is a planar body (the tail surfaces) or a body of revolution (the fuselage) and whether
the flow is turbulent or laminar needs to determined. Based on comparisons of tail airfoils for
conventional gliders, the horizontal and vertical stabilizers are going to use the Wortmann FX 71-
150/30 airfoil section. The flow was assumed turbulent over all surfaces to get the maximum drag on
the aircraft. The inputs and outputs for the Friction program can be found in Figure B14, Appendix B.
From the Friction program, the drag coefficient expected on the fuselage, horizontal tail, and vertical
tail is 0.00461.
To find the lift coefficient of the glider, the Lifting Line Theory program was used (Mason,
2005). Inputs into the system included the angle of attack with respect to the zero lift angle of attack,
Advanced Logistics Delivery System
36
the taper ratio, the aspect ratio, and the angle of twist on the wings. The zero lift angle of attack for the
rigid airfoil was -4.671 degrees and –5.107 degrees for the partially deflated airfoil. Each of the airfoils
will achieve a maximum lift to drag ratio at an angle of attack of 5 degrees. Using the taper ratio of
0.35, an aspect ratio of 25.77, and zero twist angle, the lift coefficient from the Lifting Line program
was 0.9781 for the rigid wing and 1.0222 for the one percent deflated wing. The Lifting Line Theory
program also provided the induced drag of the glider, which was 0.01231 for the rigid airfoil and
0.01344 for the one percent deflated airfoil.
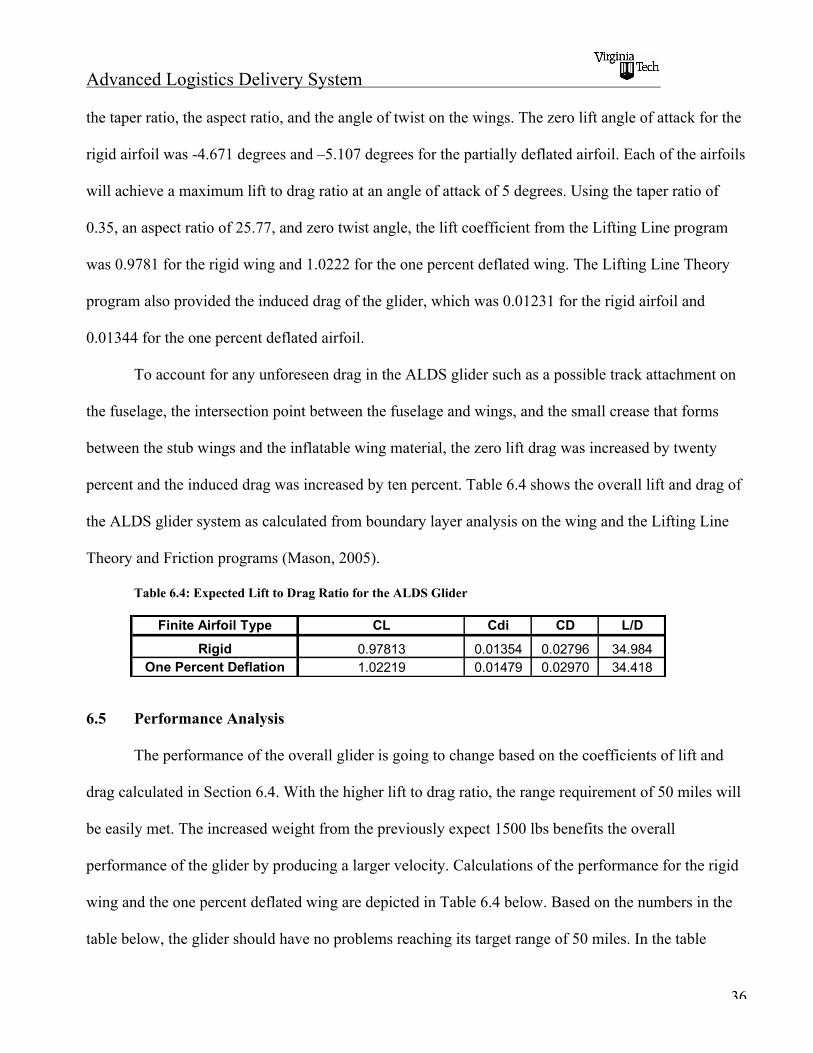
To account for any unforeseen drag in the ALDS glider such as a possible track attachment on
the fuselage, the intersection point between the fuselage and wings, and the small crease that forms
between the stub wings and the inflatable wing material, the zero lift drag was increased by twenty
percent and the induced drag was increased by ten percent. Table 6.4 shows the overall lift and drag of
the ALDS glider system as calculated from boundary layer analysis on the wing and the Lifting Line
Theory and Friction programs (Mason, 2005).
Table 6.4: Expected Lift to Drag Ratio for the ALDS Glider
Finite Airfoil Type CL Cdi CD L/D
Rigid 0.97813 0.01354 0.02796 34.984One Percent Deflation 1.02219 0.01479 0.02970 34.418
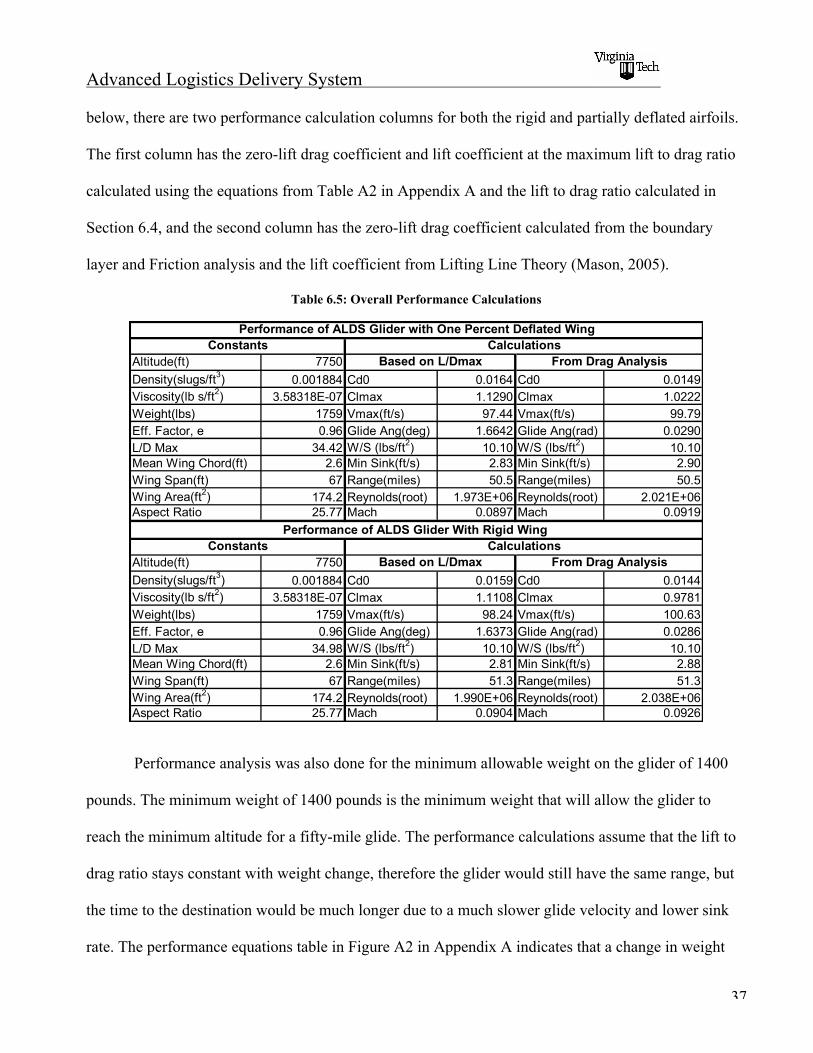
6.5 Performance Analysis
The performance of the overall glider is going to change based on the coefficients of lift and
drag calculated in Section 6.4. With the higher lift to drag ratio, the range requirement of 50 miles will
be easily met. The increased weight from the previously expect 1500 lbs benefits the overall
performance of the glider by producing a larger velocity. Calculations of the performance for the rigid
wing and the one percent deflated wing are depicted in Table 6.4 below. Based on the numbers in the
table below, the glider should have no problems reaching its target range of 50 miles. In the table
Advanced Logistics Delivery System
37
below, there are two performance calculation columns for both the rigid and partially deflated airfoils.
The first column has the zero-lift drag coefficient and lift coefficient at the maximum lift to drag ratio
calculated using the equations from Table A2 in Appendix A and the lift to drag ratio calculated in
Section 6.4, and the second column has the zero-lift drag coefficient calculated from the boundary
layer and Friction analysis and the lift coefficient from Lifting Line Theory (Mason, 2005).
Table 6.5: Overall Performance Calculations
Altitude(ft) 7750
Density(slugs/ft3) 0.001884 Cd0 0.0164 Cd0 0.0149Viscosity(lb s/ft2) 3.58318E-07 Clmax 1.1290 Clmax 1.0222Weight(lbs) 1759 Vmax(ft/s) 97.44 Vmax(ft/s) 99.79Eff. Factor, e 0.96 Glide Ang(deg) 1.6642 Glide Ang(rad) 0.0290L/D Max 34.42 W/S (lbs/ft2) 10.10 W/S (lbs/ft2) 10.10Mean Wing Chord(ft) 2.6 Min Sink(ft/s) 2.83 Min Sink(ft/s) 2.90Wing Span(ft) 67 Range(miles) 50.5 Range(miles) 50.5Wing Area(ft2) 174.2 Reynolds(root) 1.973E+06 Reynolds(root) 2.021E+06Aspect Ratio 25.77 Mach 0.0897 Mach 0.0919
Altitude(ft) 7750
Density(slugs/ft3) 0.001884 Cd0 0.0159 Cd0 0.0144Viscosity(lb s/ft2) 3.58318E-07 Clmax 1.1108 Clmax 0.9781Weight(lbs) 1759 Vmax(ft/s) 98.24 Vmax(ft/s) 100.63Eff. Factor, e 0.96 Glide Ang(deg) 1.6373 Glide Ang(rad) 0.0286L/D Max 34.98 W/S (lbs/ft2) 10.10 W/S (lbs/ft2) 10.10Mean Wing Chord(ft) 2.6 Min Sink(ft/s) 2.81 Min Sink(ft/s) 2.88Wing Span(ft) 67 Range(miles) 51.3 Range(miles) 51.3Wing Area(ft2) 174.2 Reynolds(root) 1.990E+06 Reynolds(root) 2.038E+06Aspect Ratio 25.77 Mach 0.0904 Mach 0.0926
Performance of ALDS Glider with One Percent Deflated Wing
Constants CalculationsBased on L/Dmax From Drag Analysis
Performance of ALDS Glider With Rigid Wing
From Drag AnalysisConstants
Based on L/DmaxCalculations
Performance analysis was also done for the minimum allowable weight on the glider of 1400
pounds. The minimum weight of 1400 pounds is the minimum weight that will allow the glider to
reach the minimum altitude for a fifty-mile glide. The performance calculations assume that the lift to
drag ratio stays constant with weight change, therefore the glider would still have the same range, but
the time to the destination would be much longer due to a much slower glide velocity and lower sink
rate. The performance equations table in Figure A2 in Appendix A indicates that a change in weight

Advanced Logistics Delivery System
38
will have an effect only on the velocity at L/D max, the sink rate, and the Reynolds number. Table 6.5
shows how a lighter weight would change the performance of the glider. Based on these numbers, the
glider should fly at full payload or carry ballast to keep the weight at a maximum.
Table 6.6 Overall Performance At Minimum Weight of 1400 lbs
Altitude(ft) 7750Density(slugs/ft3) 0.001884 Cd0 0.0164 Cd0 0.0149Viscosity(lb s/ft2) 3.58318E-07 Clmax 1.1290 Clmax 1.0222Weight(lbs) 1400 Vmax(ft/s) 86.93 Vmax(ft/s) 89.03Eff. Factor, e 0.96 Glide Ang(deg) 1.6642 Glide Ang(rad) 0.0290L/D Max 34.42 W/S (lbs/ft2) 8.04 W/S (lbs/ft2) 8.04Mean Wing Chord(ft) 2.6 Min Sink(ft/s) 2.52 Min Sink(ft/s) 2.59Wing Span(ft) 67 Range(miles) 50.5 Range(miles) 50.5Wing Area(ft2) 174.2 Reynolds(root) 1.761E+06 Reynolds(root) 1.803E+06Aspect Ratio 25.77 Mach 0.0800 Mach 0.0820
Altitude(ft) 7750Density(slugs/ft3) 0.001884 Cd0 0.0159 Cd0 0.0144Viscosity(lb s/ft2) 3.58318E-07 Clmax 1.1108 Clmax 0.9781Weight(lbs) 1400 Vmax(ft/s) 87.64 Vmax(ft/s) 89.78Eff. Factor, e 0.96 Glide Ang(deg) 1.6373 Glide Ang(rad) 0.0286L/D Max 34.98 W/S (lbs/ft2) 8.04 W/S (lbs/ft2) 8.04Mean Wing Chord(ft) 2.6 Min Sink(ft/s) 2.50 Min Sink(ft/s) 2.57Wing Span(ft) 67 Range(miles) 51.3 Range(miles) 51.3
Wing Area(ft2) 174.2 Reynolds(root) 1.775E+06 Reynolds(root) 1.818E+06Aspect Ratio 25.77 Mach 0.0807 Mach 0.0826
`
Constants CalculationsBased on L/Dmax From Drag Analysis
Performance of ALDS Glider With Rigid Wing
Constants CalculationsBased on L/Dmax From Drag Analysis
Chapter 7: Glider Structural Design
7.1 Introduction
For this project, a majority of the structural emphasis is placed on the fuselage and the wings.
Given the nature of the launch and glide phases of the aircrafts flight, these two components must be
designed under two separate constraints. The fuselage, which will carry the 1000 pound payload, will
be subjected to its greatest loads during the launch phase. During this phase it will encounter force due
to its acceleration down the launch track, and it will also encounter a centripetal force as it travels
through the curved portion of the track. Thus, the frames, stringers and payload supports must be
Advanced Logistics Delivery System
39
designed to handle both of these loads. The stub wings however will not be producing lift during the
launch phase and therefore the high load factor at launch will not affect them nearly as much as the
forces and moments during the gliding portion of flight. For the fuselage as well as the wing structural
design, the forces and moments produced by the payload and lift will be calculated and appropriate
stringers, frames, spars, and skin will be designed.
7.2 Materials
Before the sizing for the structural components could begin it was necessary to choose
appropriate materials. For simplicity few materials will be used, one for the beam-like structural
components (ie, spars, ribs, stringers, and frame) and one for the skin. All of these materials should be
very light weight and have excellent strength. Through much research, it has been concluded that our
glider should be made entirely out of composites. Composites, although expensive, are renowned for
their remarkable strength and light weight. For the beam-like structural components, graphitized
SIGRABOND type 1501 G carbon fiber-reinforced carbon was selected as one of the materials. This
material is known for having excellent tensile stress and very light weight. The material properties of
this type Carbon Fiber can be seen in the tale below. It should be noted, however, that shear strength is
different for varying composite structures, and will not be exactly the same for all carbon fibers. There
is, however, an estimated shear strength for carbon fibers which is used in the following calculations.
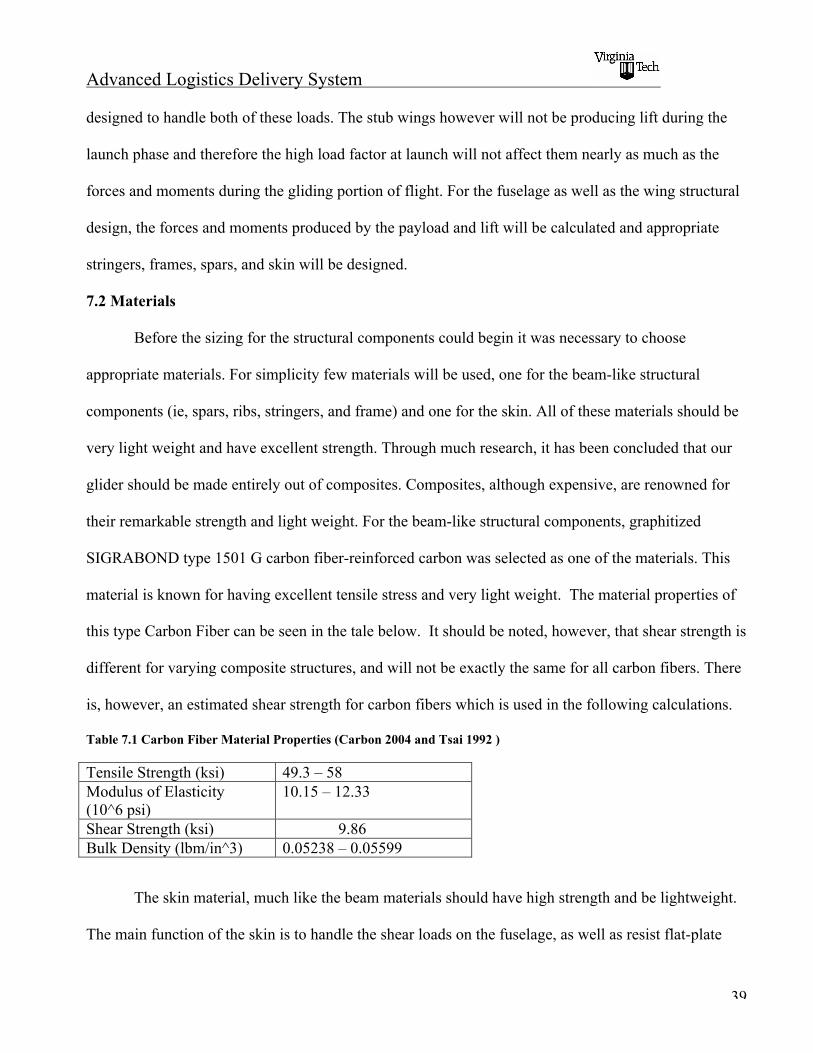
Table 7.1 Carbon Fiber Material Properties (Carbon 2004 and Tsai 1992 )
Tensile Strength (ksi) 49.3 – 58Modulus of Elasticity(10^6 psi)
10.15 – 12.33
Shear Strength (ksi) 9.86Bulk Density (lbm/in^3) 0.05238 – 0.05599
The skin material, much like the beam materials should have high strength and be lightweight.
The main function of the skin is to handle the shear loads on the fuselage, as well as resist flat-plate
Advanced Logistics Delivery System
40
compressive buckling in the wings. Generally, modern aircraft have composites for their skin. One
manufacturer of composite skin material is E-A-R Specialty Composites. Their ISODAMP C-3002
damping composite skin is a good choice for our skin design, and a table of its material properties can
be seen below.
Table 7.2 Composite Skin Material Properties (E-R-A 2002)
Tensile strength (psi) 11893Tear strength (lb/in) 1504
Thickness (in) Weight (lb/ft^2)0.125 0.070.250 0.140.500 0.28
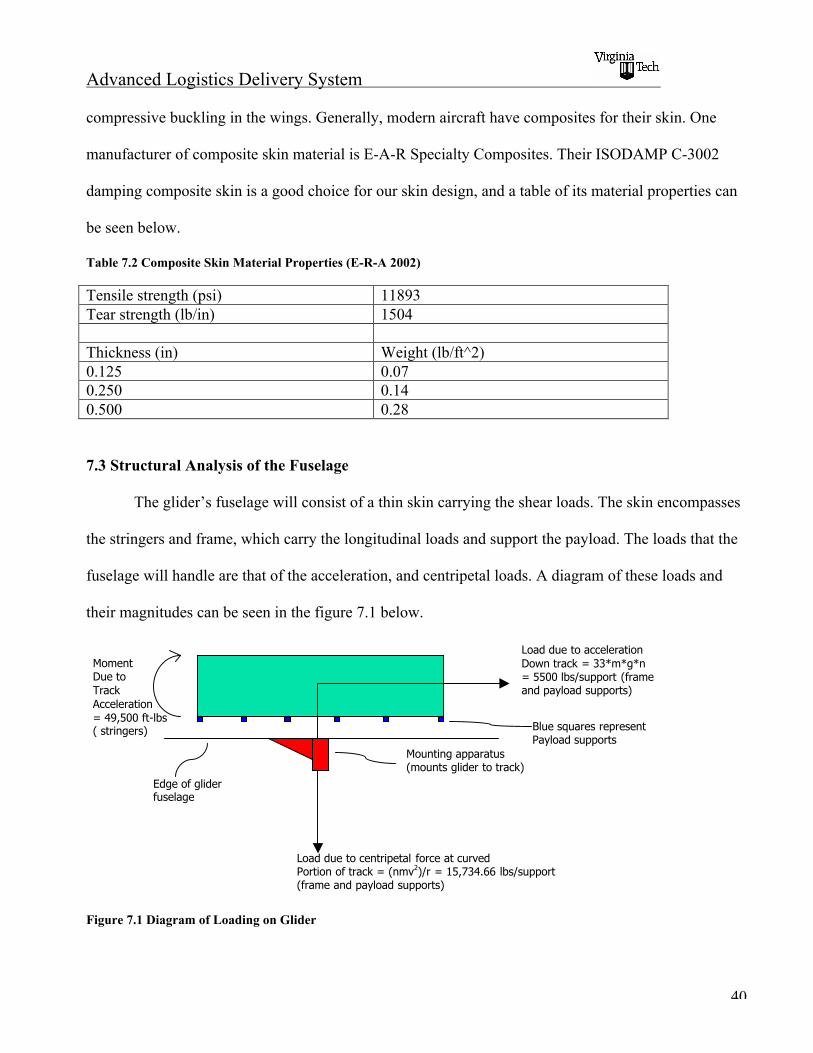
7.3 Structural Analysis of the Fuselage
The glider’s fuselage will consist of a thin skin carrying the shear loads. The skin encompasses
the stringers and frame, which carry the longitudinal loads and support the payload. The loads that the
fuselage will handle are that of the acceleration, and centripetal loads. A diagram of these loads and
their magnitudes can be seen in the figure 7.1 below.
Figure 7.1 Diagram of Loading on Glider
Load due to accelerationDown track = 33*m*g*n= 5500 lbs/support (frameand payload supports)
Load due to centripetal force at curvedPortion of track = (nmv2)/r = 15,734.66 lbs/support(frame and payload supports)
Mounting apparatus(mounts glider to track)
Edge of gliderfuselage
MomentDue toTrackAcceleration= 49,500 ft-lbs( stringers) Blue squares represent
Payload supports
Advanced Logistics Delivery System
41
Stringers and Skin:
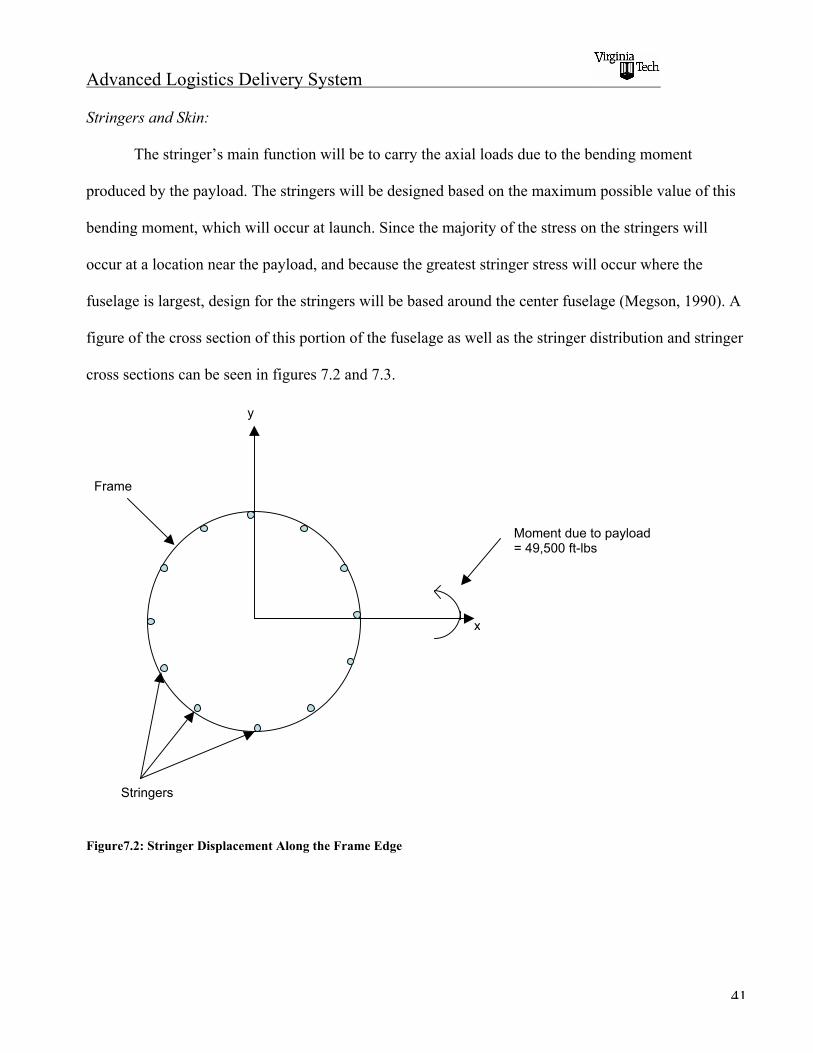
The stringer’s main function will be to carry the axial loads due to the bending moment
produced by the payload. The stringers will be designed based on the maximum possible value of this
bending moment, which will occur at launch. Since the majority of the stress on the stringers will
occur at a location near the payload, and because the greatest stringer stress will occur where the
fuselage is largest, design for the stringers will be based around the center fuselage (Megson, 1990). A
figure of the cross section of this portion of the fuselage as well as the stringer distribution and stringer
cross sections can be seen in figures 7.2 and 7.3.
Figure7.2: Stringer Displacement Along the Frame Edge
Moment due to payload= 49,500 ft-lbs
x
y
Stringers
Frame
Advanced Logistics Delivery System
42
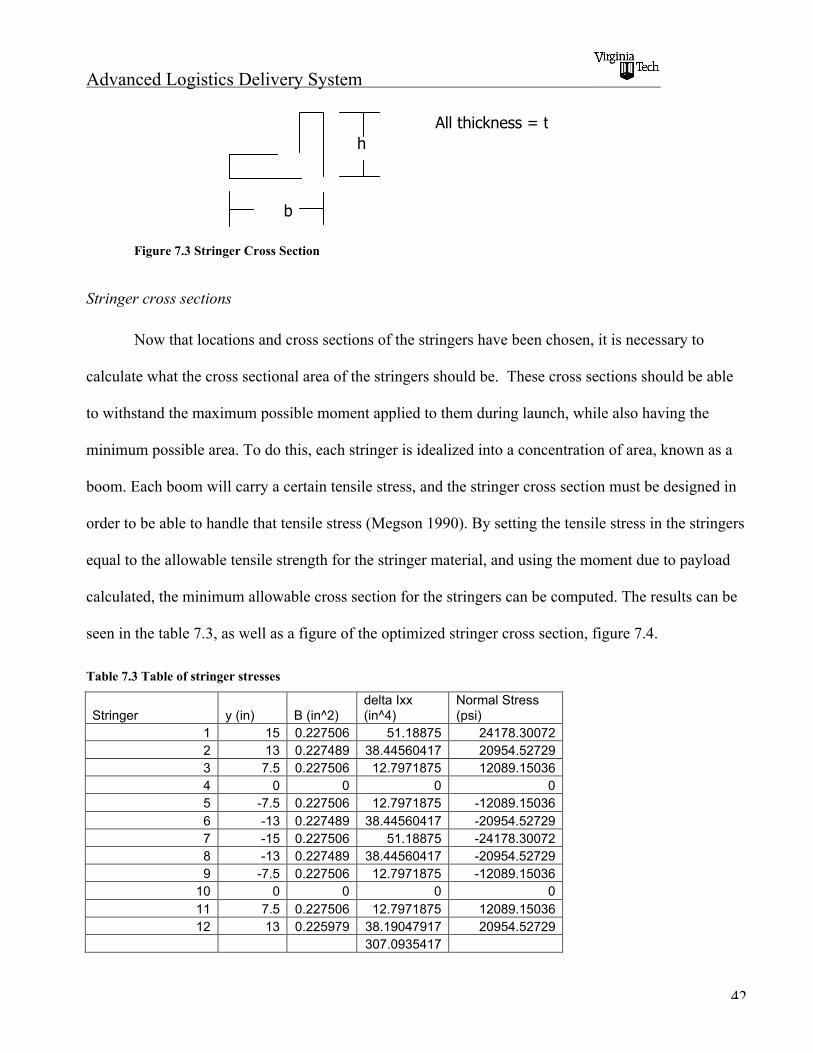
Figure 7.3 Stringer Cross Section
Stringer cross sections
Now that locations and cross sections of the stringers have been chosen, it is necessary to
calculate what the cross sectional area of the stringers should be. These cross sections should be able
to withstand the maximum possible moment applied to them during launch, while also having the
minimum possible area. To do this, each stringer is idealized into a concentration of area, known as a
boom. Each boom will carry a certain tensile stress, and the stringer cross section must be designed in
order to be able to handle that tensile stress (Megson 1990). By setting the tensile stress in the stringers
equal to the allowable tensile strength for the stringer material, and using the moment due to payload
calculated, the minimum allowable cross section for the stringers can be computed. The results can be
seen in the table 7.3, as well as a figure of the optimized stringer cross section, figure 7.4.
Table 7.3 Table of stringer stresses
Stringer y (in) B (in^2)delta Ixx(in^4)
Normal Stress(psi)
1 15 0.227506 51.18875 24178.300722 13 0.227489 38.44560417 20954.527293 7.5 0.227506 12.7971875 12089.150364 0 0 0 05 -7.5 0.227506 12.7971875 -12089.150366 -13 0.227489 38.44560417 -20954.527297 -15 0.227506 51.18875 -24178.300728 -13 0.227489 38.44560417 -20954.527299 -7.5 0.227506 12.7971875 -12089.15036
10 0 0 0 011 7.5 0.227506 12.7971875 12089.1503612 13 0.225979 38.19047917 20954.52729
307.0935417
b
hAll thickness = t
Advanced Logistics Delivery System
43
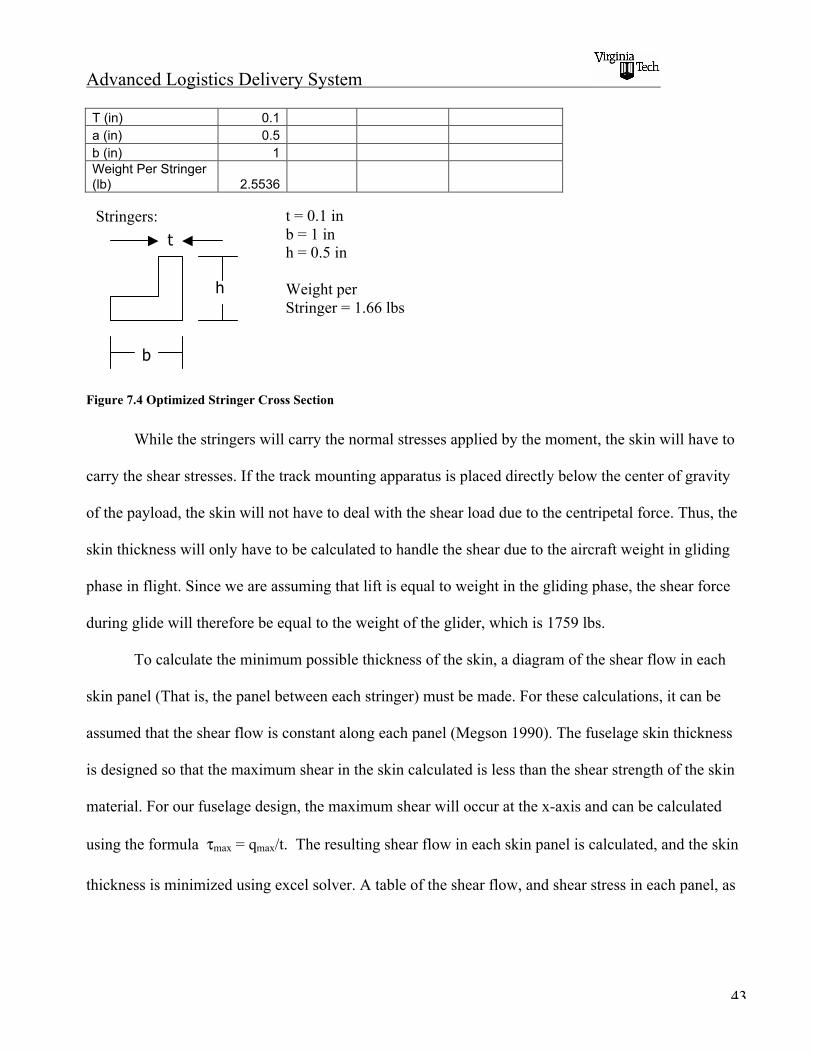
T (in) 0.1a (in) 0.5b (in) 1Weight Per Stringer(lb) 2.5536
Figure 7.4 Optimized Stringer Cross Section
While the stringers will carry the normal stresses applied by the moment, the skin will have to
carry the shear stresses. If the track mounting apparatus is placed directly below the center of gravity
of the payload, the skin will not have to deal with the shear load due to the centripetal force. Thus, the
skin thickness will only have to be calculated to handle the shear due to the aircraft weight in gliding
phase in flight. Since we are assuming that lift is equal to weight in the gliding phase, the shear force
during glide will therefore be equal to the weight of the glider, which is 1759 lbs.
To calculate the minimum possible thickness of the skin, a diagram of the shear flow in each
skin panel (That is, the panel between each stringer) must be made. For these calculations, it can be
assumed that the shear flow is constant along each panel (Megson 1990). The fuselage skin thickness
is designed so that the maximum shear in the skin calculated is less than the shear strength of the skin
material. For our fuselage design, the maximum shear will occur at the x-axis and can be calculated
using the formula "max = qmax/t. The resulting shear flow in each skin panel is calculated, and the skin
thickness is minimized using excel solver. A table of the shear flow, and shear stress in each panel, as
b
h
tStringers: t = 0.1 in
b = 1 inh = 0.5 in
Weight perStringer = 1.66 lbs

Advanced Logistics Delivery System
44
well as the resulting minimum skin thickness can be seen in the table 7.4. A figure of the skin panel
numbering convention can also be seen in the figure 7.5.
skinpanel q (lb/in)
Shear Stress(psi)
1 2 -25.00317154 -5000.6343072 3 -46.67098923 -9334.1978463 4 -59.172575 -11834.5154 5 -59.172575 -11834.5155 6 -46.67098923 -9334.1978466 7 -25.00317154 -5000.6343077 8 0 08 9 21.66781769 -4333.5635389 10 34.16940346 -6833.88069210 11 34.16940346 -6833.88069211 12 21.66781769 -4333.56353812 1 0.143787622 -28.75752434
skin thickness(in) 0.005
Table 7.4 Table of Shear Stresses in Skin
Figure 7.5 Stringer and Skin Panel Numbering Convention
From observing the calculated minimum skin thickness, it is obvious that a thickness of 0.005
inches is impossible to manufacture and retain the given material properties. Thus, the skin thickness
we will use will be one that is a little more standard: 0.02 inches.
x
y
1 2
3
4
5
678
9
10
11
12
Advanced Logistics Delivery System
45
Frames
The major structural consideration when designing the frames is to make sure that the frame
can support the payload under the large loads during launch. To support the payload, a bar acting as a
floor beam will be used to connect the payload to the frames. There will be six of these frames and
floor beams placed under the payload section to support it. It should be noted however, that only four
of these frame sections shall be closed and circular. As a result of the manner in which our wings are
being inflated, for the two frame sections that are adjacent to the wing, there needs to be a gap. The
sodium azide and airbag systems, described in Chapter 9, will be placed in this gap. To account for this
gap, we will assume that the sodium azide and airbag system are packed tight enough so that these two
frame components can still remain rigid. Also, in these two frame components, the frame will extend
out into four spars that will run along the top and bottom sections of the non-inflatable portions of the
wing. A figure of the payload supports attached to the frame and their cross sections, as well as a
figure of the gapped frames with their spars can be seen in figure 7.6.
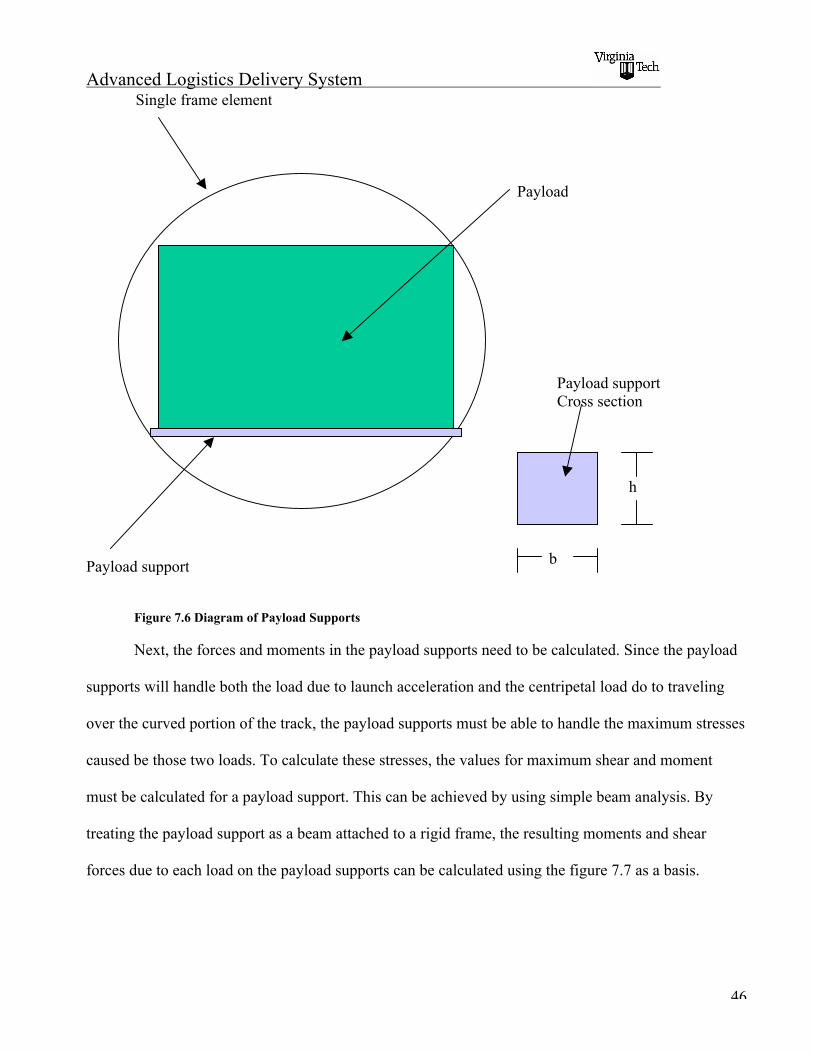
Advanced Logistics Delivery System
46
Figure 7.6 Diagram of Payload Supports
Next, the forces and moments in the payload supports need to be calculated. Since the payload
supports will handle both the load due to launch acceleration and the centripetal load do to traveling
over the curved portion of the track, the payload supports must be able to handle the maximum stresses
caused be those two loads. To calculate these stresses, the values for maximum shear and moment
must be calculated for a payload support. This can be achieved by using simple beam analysis. By
treating the payload support as a beam attached to a rigid frame, the resulting moments and shear
forces due to each load on the payload supports can be calculated using the figure 7.7 as a basis.
Payload support
Payload
Single frame element
b
h
Payload supportCross section
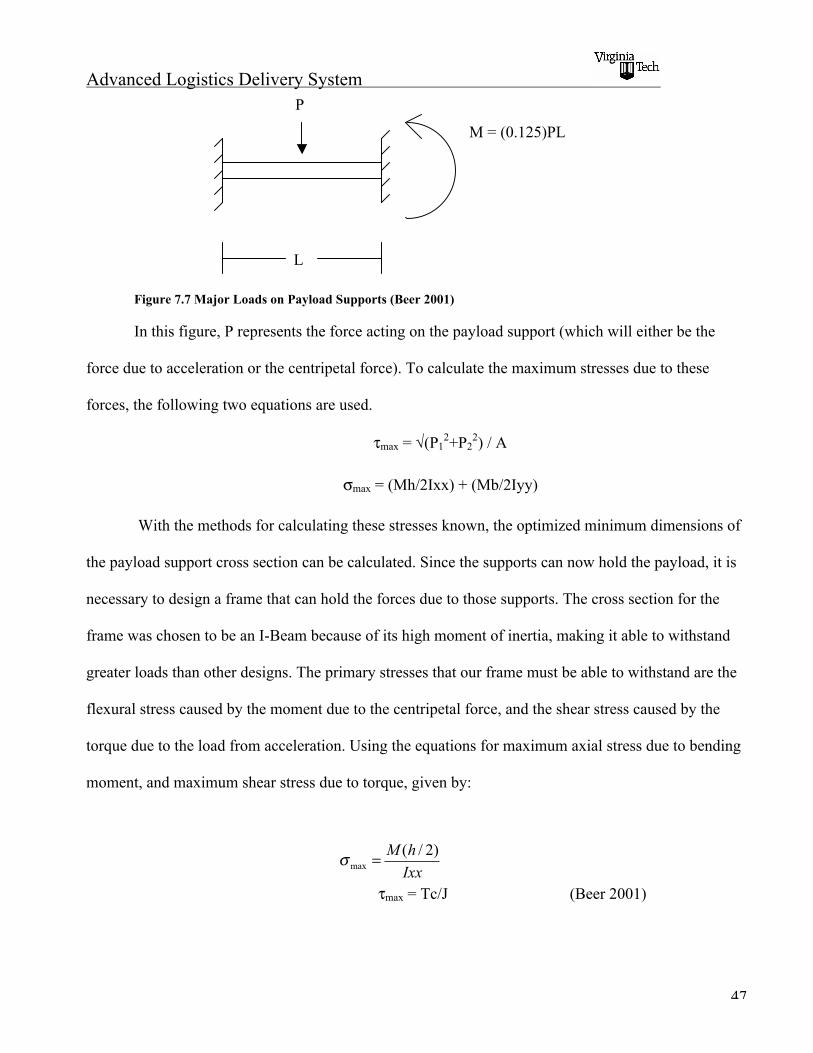
Advanced Logistics Delivery System
47
Figure 7.7 Major Loads on Payload Supports (Beer 2001)
In this figure, P represents the force acting on the payload support (which will either be the
force due to acceleration or the centripetal force). To calculate the maximum stresses due to these
forces, the following two equations are used.
"max = #(P12+P2
2) / A
$max = (Mh/2Ixx) + (Mb/2Iyy)
With the methods for calculating these stresses known, the optimized minimum dimensions of
the payload support cross section can be calculated. Since the supports can now hold the payload, it is
necessary to design a frame that can hold the forces due to those supports. The cross section for the
frame was chosen to be an I-Beam because of its high moment of inertia, making it able to withstand
greater loads than other designs. The primary stresses that our frame must be able to withstand are the
flexural stress caused by the moment due to the centripetal force, and the shear stress caused by the
torque due to the load from acceleration. Using the equations for maximum axial stress due to bending
moment, and maximum shear stress due to torque, given by:
"max = Tc/J (Beer 2001)Ixx
hM )2/(max =!
P
M = (0.125)PL
L
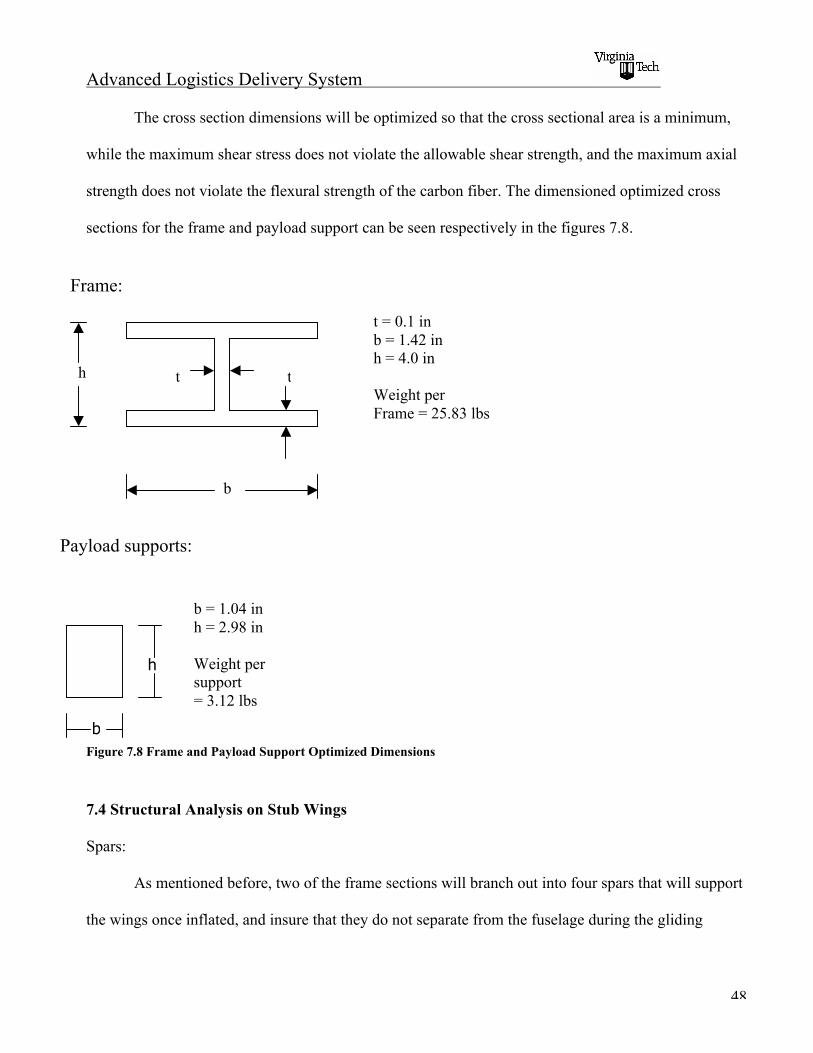
Advanced Logistics Delivery System
48
The cross section dimensions will be optimized so that the cross sectional area is a minimum,
while the maximum shear stress does not violate the allowable shear strength, and the maximum axial
strength does not violate the flexural strength of the carbon fiber. The dimensioned optimized cross
sections for the frame and payload support can be seen respectively in the figures 7.8.
Figure 7.8 Frame and Payload Support Optimized Dimensions
7.4 Structural Analysis on Stub Wings
Spars:
As mentioned before, two of the frame sections will branch out into four spars that will support
the wings once inflated, and insure that they do not separate from the fuselage during the gliding
tt
b
h
Frame:
t = 0.1 inb = 1.42 inh = 4.0 in
Weight perFrame = 25.83 lbs
Payload supports:
b = 1.04 inh = 2.98 in
Weight persupport= 3.12 lbs
b
h
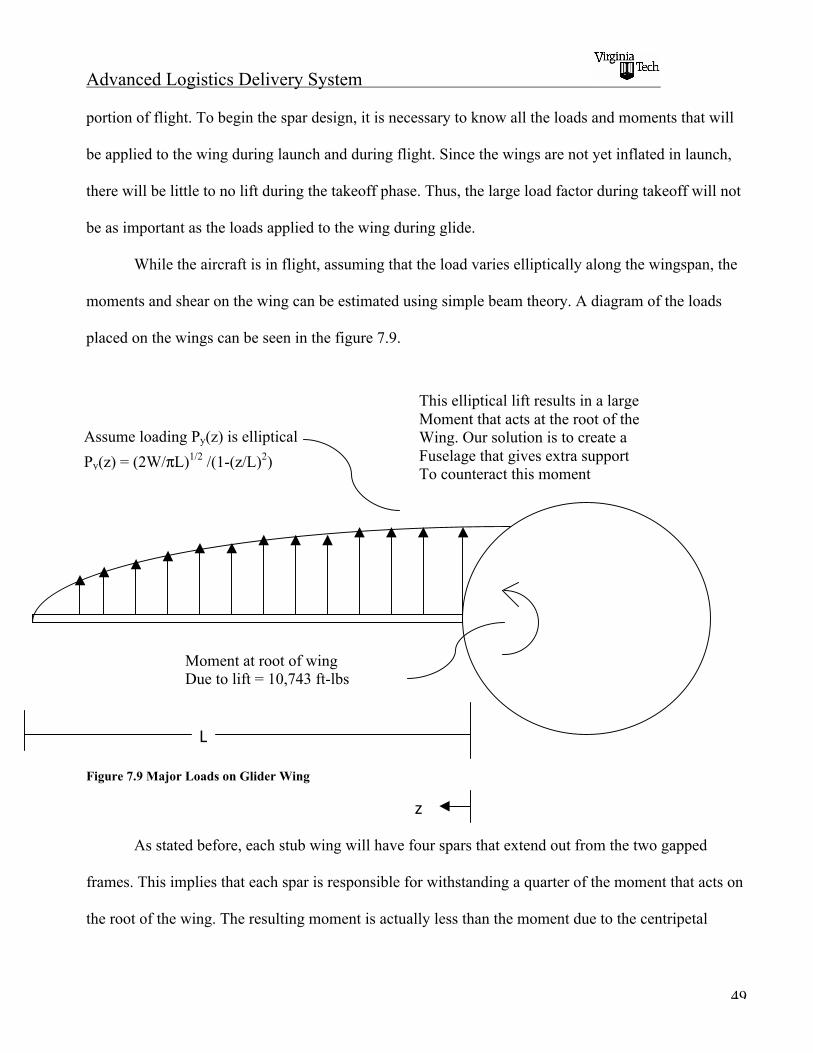
Advanced Logistics Delivery System
49
portion of flight. To begin the spar design, it is necessary to know all the loads and moments that will
be applied to the wing during launch and during flight. Since the wings are not yet inflated in launch,
there will be little to no lift during the takeoff phase. Thus, the large load factor during takeoff will not
be as important as the loads applied to the wing during glide.
While the aircraft is in flight, assuming that the load varies elliptically along the wingspan, the
moments and shear on the wing can be estimated using simple beam theory. A diagram of the loads
placed on the wings can be seen in the figure 7.9.
Figure 7.9 Major Loads on Glider Wing
As stated before, each stub wing will have four spars that extend out from the two gapped
frames. This implies that each spar is responsible for withstanding a quarter of the moment that acts on
the root of the wing. The resulting moment is actually less than the moment due to the centripetal
Py(z) = (2W/%L)1/2 /(1-(z/L)2)
Assume loading Py(z) is elliptical
L
z
This elliptical lift results in a largeMoment that acts at the root of theWing. Our solution is to create aFuselage that gives extra supportTo counteract this moment
Moment at root of wingDue to lift = 10,743 ft-lbs
Advanced Logistics Delivery System
50
launch force for which the frames were originally designed. This means that there needs to be no cross
sectional optimization done on the spars, because the current spar dimensions, equal to that of the
frames, are already designed to handle a moment greater than that produced by the lift. Considering the
fact that the moment produced by the payload at launch is greater then the moment produced by lift at
glide, and that the frame was over designed and included a factor of safety of 1.5, it should be safe to
assume that the frame can handle any additional load factors produced by gusts, sharp turns, etc.
Chapter 8: Inflatable Wing Structures
8.1 Criteria for an Acceptable Wing
The stability and load reaction of inflated structures is a variable that is not easily calculated to
an exact measure. However, careful theoretical analysis can reduce the errors associated with
illustrating the structural stability of, in this case, the glider’s inflatable wing. The structure of this
inflated wing has been altered numerous times in the duration of the design process as various criteria
were introduced. It is important that the following criterion is satisfied in order for this wing to meet
the flight requirements. The first and possibly the most important requirement is that the wing must
not bend a significant amount, meaning no more than 4 feet for a 28 foot wing, when placed under the
aerodynamic loads while in flight, increasing the tip deflection. The tip deflection can be minimized
by insuring that the internal pressure from the gas that the wings will be filled with is large enough to
prevent wrinkling on the top side of the wing. The term “wrinkling” refers to the condition that the
tensile stress due to the internal pressure inside the wing is just equal to the compressive stress due to
the bending. Once the theory behind the close approximations of this required pressure is discussed in
a later section, numerical constraints can be established. Also, Chapter 9 will discuss the process of
Advanced Logistics Delivery System
51
the inflation of the wings as well as describe the properties of the gas that these wings will be filled
with.
Another important attribute is the physical properties of the material chosen for the interior
pressure bearing fabric and the outer wing skin. The inner material must have a high tensile strength
and be able to hold the internal pressure without exploding. The inner material must also have a high
modulus of elasticity, meaning the material is not easily stretched. This insures a low tip deflection
once the wings are deployed, assuming the absence of wrinkling. The main concern for the outer
material is that it must be smooth and durable enough to maximize the aerodynamic potential of the
airfoil. The decision that there will be an inner material covered by an outer material was derived from
the fact that any type of internal cross sectional pattern of an inflated fabric will result in numerous
bumps along the surface, affecting the laminar airflow. So, a generously tightened outer wrap will
help to smooth out the wing surface by filling in the bumps as best as possible. Both of these materials
must also have a low density, because of the strict weight requirement. A low cost for each of these
materials is also important, because of the high number of gliders that will be deployed each day.
Finding the torsion of an inflated structure using theory is imprecise, especially since this wing
is such a large structure composed of fabric rather than the more traditional metal or composite. The
method used in past applications such as the I-2000 was to simulate the loads on a scaled-down model
and record the data24. The required geometric twist that maximizes stability will be found from theory
in a later section, but before that a requirement that will be considered to reduce the twist is an intricate
internal structure. If there are a series of webbed connections inside the wing, this will keep the
individual spars from fluttering independently, increasing the overall stiffness of the wing. Now that
the general constraints of the wing are outlined, the steps taken to decide upon a final structural wing
pattern and material can be described.
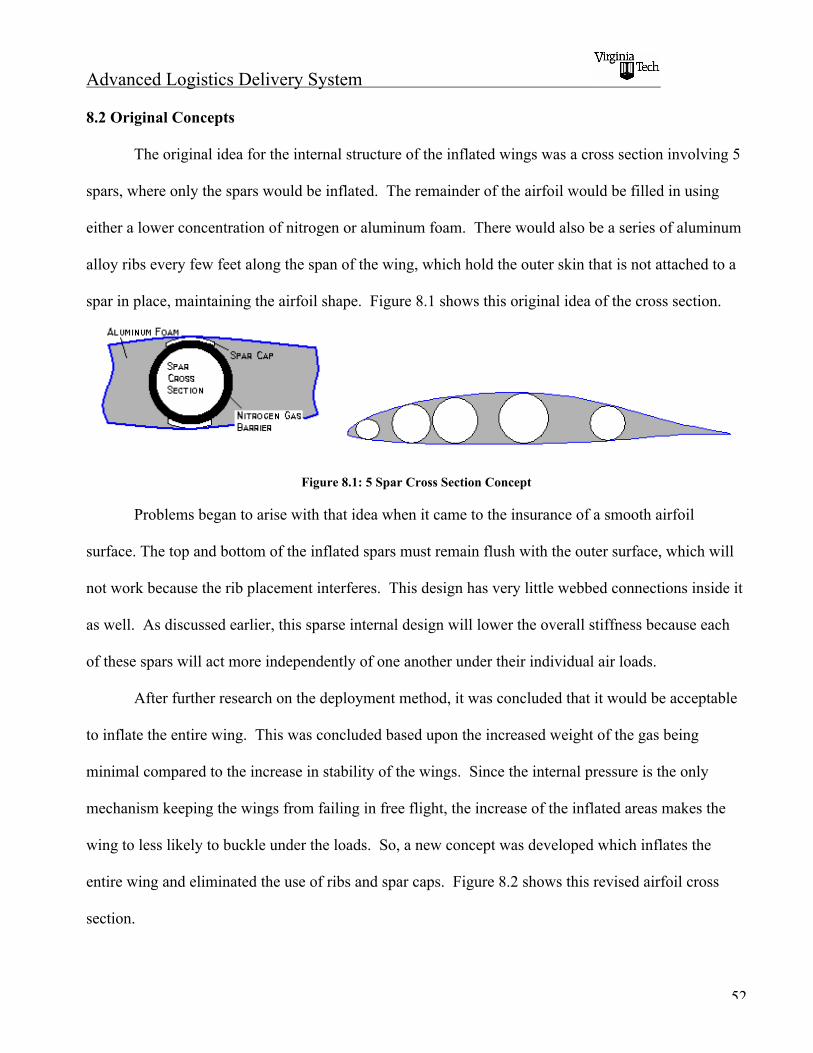
Advanced Logistics Delivery System
52
8.2 Original Concepts
The original idea for the internal structure of the inflated wings was a cross section involving 5
spars, where only the spars would be inflated. The remainder of the airfoil would be filled in using
either a lower concentration of nitrogen or aluminum foam. There would also be a series of aluminum
alloy ribs every few feet along the span of the wing, which hold the outer skin that is not attached to a
spar in place, maintaining the airfoil shape. Figure 8.1 shows this original idea of the cross section.
Figure 8.1: 5 Spar Cross Section Concept
Problems began to arise with that idea when it came to the insurance of a smooth airfoil
surface. The top and bottom of the inflated spars must remain flush with the outer surface, which will
not work because the rib placement interferes. This design has very little webbed connections inside it
as well. As discussed earlier, this sparse internal design will lower the overall stiffness because each
of these spars will act more independently of one another under their individual air loads.
After further research on the deployment method, it was concluded that it would be acceptable
to inflate the entire wing. This was concluded based upon the increased weight of the gas being
minimal compared to the increase in stability of the wings. Since the internal pressure is the only
mechanism keeping the wings from failing in free flight, the increase of the inflated areas makes the
wing to less likely to buckle under the loads. So, a new concept was developed which inflates the
entire wing and eliminated the use of ribs and spar caps. Figure 8.2 shows this revised airfoil cross
section.
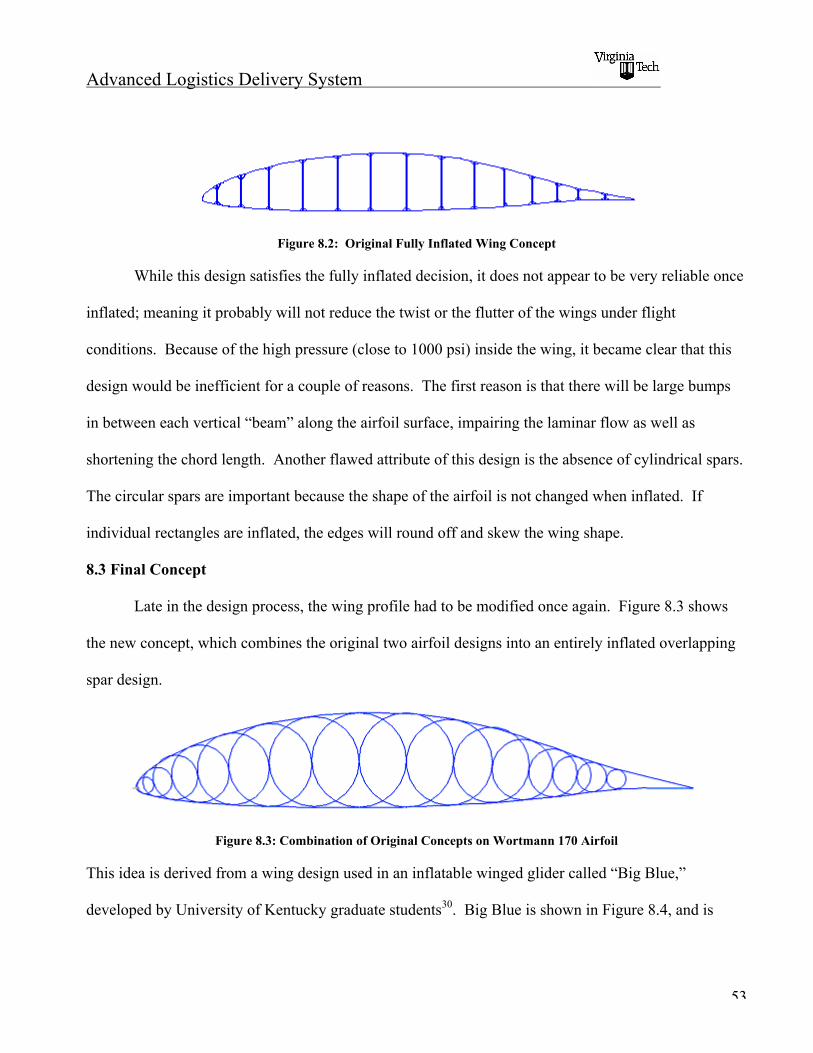
Advanced Logistics Delivery System
53
Figure 8.2: Original Fully Inflated Wing Concept
While this design satisfies the fully inflated decision, it does not appear to be very reliable once
inflated; meaning it probably will not reduce the twist or the flutter of the wings under flight
conditions. Because of the high pressure (close to 1000 psi) inside the wing, it became clear that this
design would be inefficient for a couple of reasons. The first reason is that there will be large bumps
in between each vertical “beam” along the airfoil surface, impairing the laminar flow as well as
shortening the chord length. Another flawed attribute of this design is the absence of cylindrical spars.
The circular spars are important because the shape of the airfoil is not changed when inflated. If
individual rectangles are inflated, the edges will round off and skew the wing shape.
8.3 Final Concept
Late in the design process, the wing profile had to be modified once again. Figure 8.3 shows
the new concept, which combines the original two airfoil designs into an entirely inflated overlapping
spar design.
Figure 8.3: Combination of Original Concepts on Wortmann 170 Airfoil
This idea is derived from a wing design used in an inflatable winged glider called “Big Blue,”
developed by University of Kentucky graduate students30. Big Blue is shown in Figure 8.4, and is
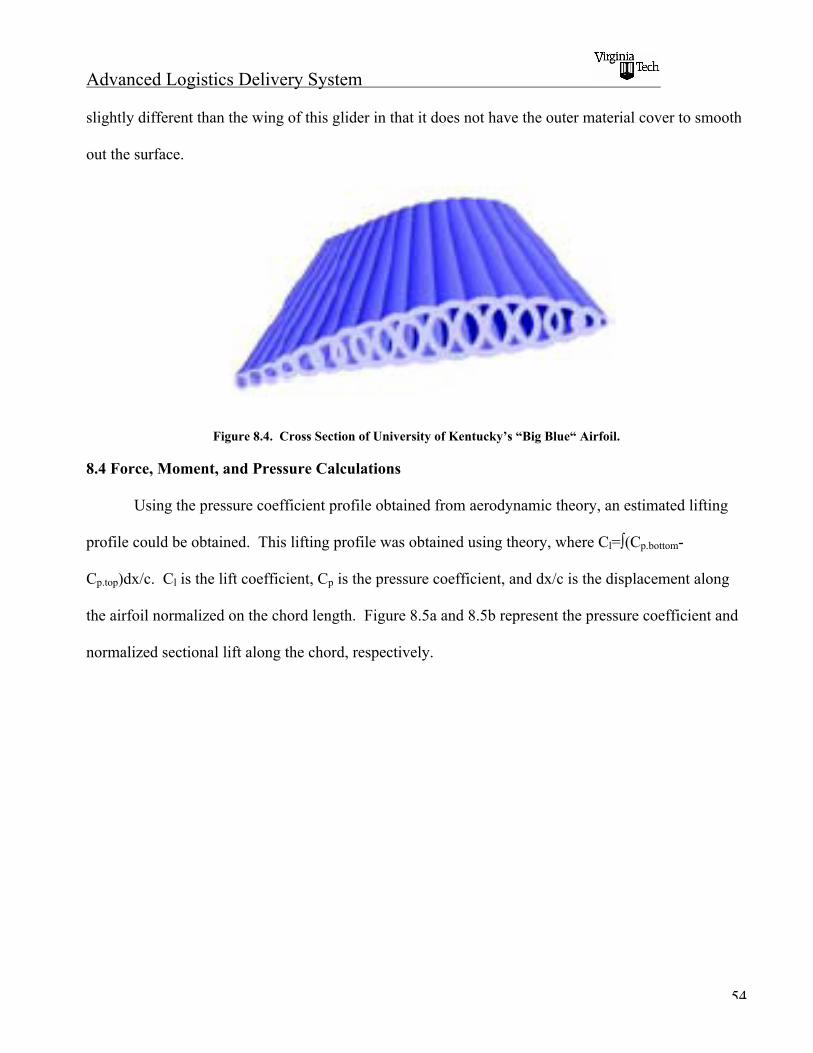
Advanced Logistics Delivery System
54
slightly different than the wing of this glider in that it does not have the outer material cover to smooth
out the surface.
Figure 8.4. Cross Section of University of Kentucky’s “Big Blue“ Airfoil.
8.4 Force, Moment, and Pressure Calculations
Using the pressure coefficient profile obtained from aerodynamic theory, an estimated lifting
profile could be obtained. This lifting profile was obtained using theory, where Cl=∫(Cp.bottom-
Cp.top)dx/c. Cl is the lift coefficient, Cp is the pressure coefficient, and dx/c is the displacement along
the airfoil normalized on the chord length. Figure 8.5a and 8.5b represent the pressure coefficient and
normalized sectional lift along the chord, respectively.
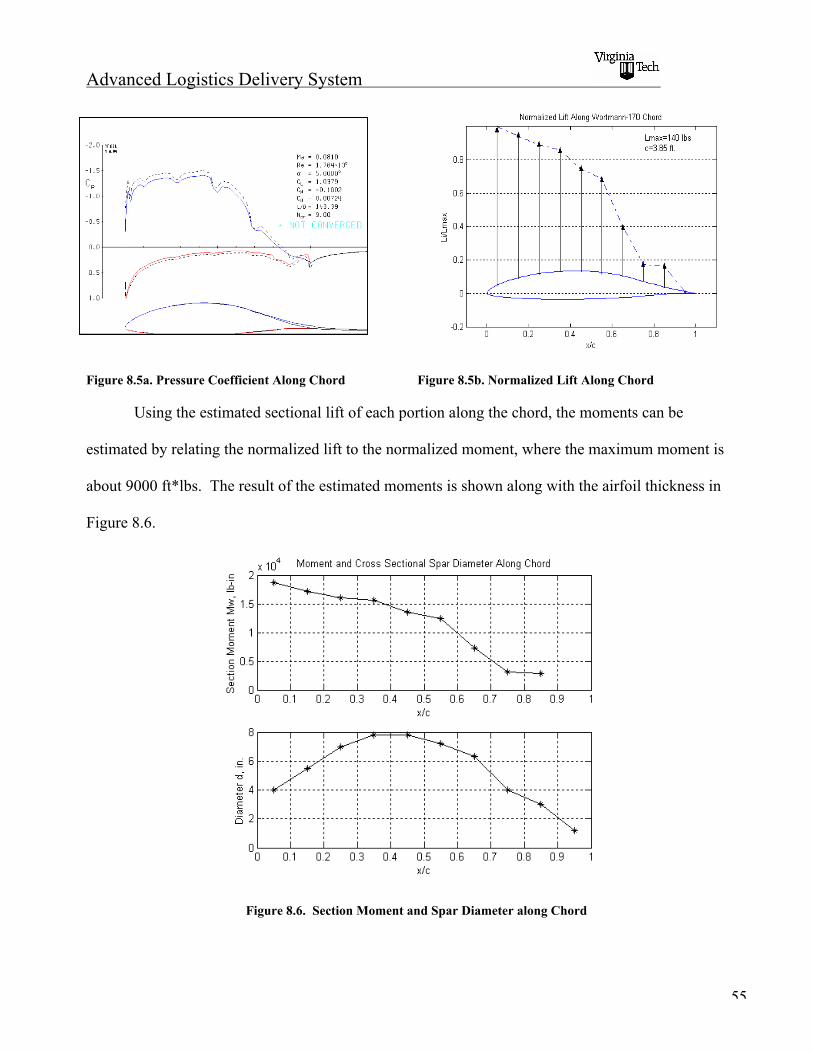
Advanced Logistics Delivery System
55
Figure 8.5a. Pressure Coefficient Along Chord Figure 8.5b. Normalized Lift Along Chord
Using the estimated sectional lift of each portion along the chord, the moments can be
estimated by relating the normalized lift to the normalized moment, where the maximum moment is
about 9000 ft*lbs. The result of the estimated moments is shown along with the airfoil thickness in
Figure 8.6.
Figure 8.6. Section Moment and Spar Diameter along Chord
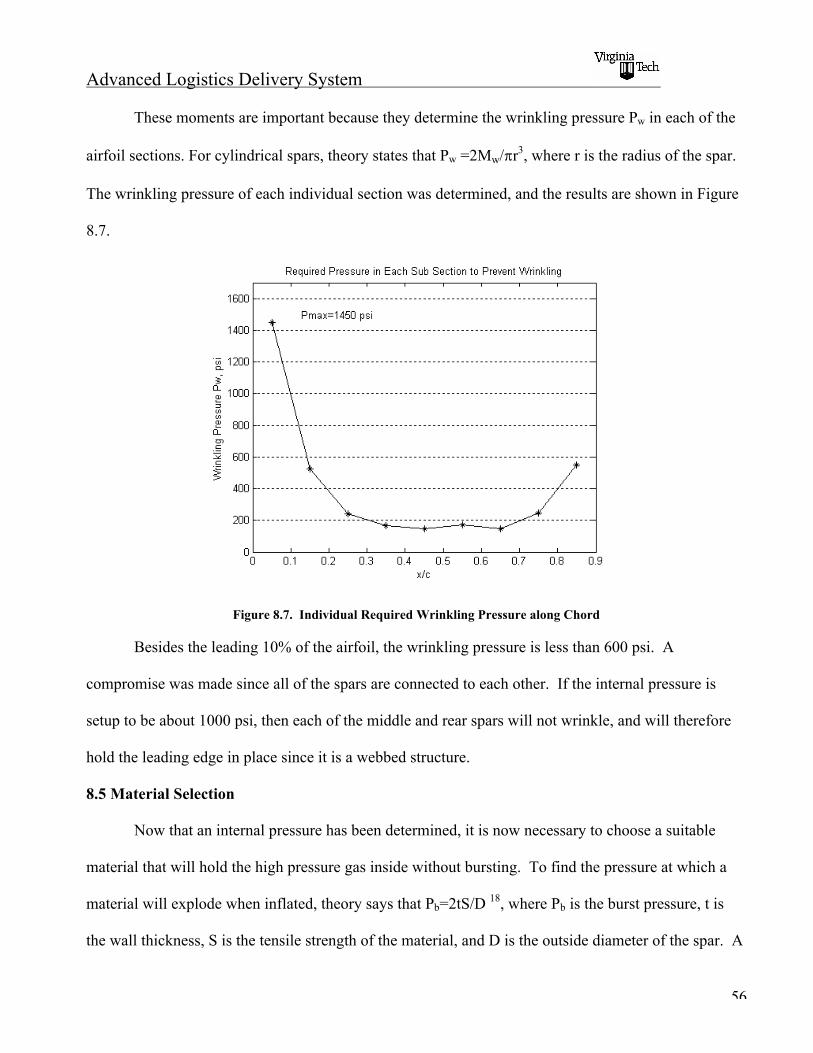
Advanced Logistics Delivery System
56
These moments are important because they determine the wrinkling pressure Pw in each of the
airfoil sections. For cylindrical spars, theory states that Pw =2Mw/"r3, where r is the radius of the spar.
The wrinkling pressure of each individual section was determined, and the results are shown in Figure
8.7.
Figure 8.7. Individual Required Wrinkling Pressure along Chord
Besides the leading 10% of the airfoil, the wrinkling pressure is less than 600 psi. A
compromise was made since all of the spars are connected to each other. If the internal pressure is
setup to be about 1000 psi, then each of the middle and rear spars will not wrinkle, and will therefore
hold the leading edge in place since it is a webbed structure.
8.5 Material Selection
Now that an internal pressure has been determined, it is now necessary to choose a suitable
material that will hold the high pressure gas inside without bursting. To find the pressure at which a
material will explode when inflated, theory says that Pb=2tS/D 18, where Pb is the burst pressure, t is
the wall thickness, S is the tensile strength of the material, and D is the outside diameter of the spar. A
Advanced Logistics Delivery System
57
material that was used on the Mars Pathfinder to soften the landing called Vectran (S=412,000 psi,
t=0.1 in.) was applied to this equation and as it turns out the burst pressure is about 10,500 psi
(Celanese, 2005). So, this material will sustain the internal pressure without bursting. However, as
weight calculations became important near the end of the design, a new material had to be chosen.
Because of the high density of the Vectran, the weight of each wing turned out to be about 400 lbs,
which is unacceptable. The glider will not fly if the wings are this heavy.
Another material, called Vela Carb 335U, is a unidirectional carbon fiber reinforced fabric that
is normally used to strengthen masonry structures and concrete. According to the manufacturers, Edge
Structural Composites, this material can be treated with a urethane epoxy to make it air-tight.
Applying the physical properties of Vela Carb 335U (S=150,000 psi, t=0.023 in.) to the bursting
pressure equation, Pb=880 psi (Edge Structural Composites, 2005). This is unacceptable because this is
less than our chosen pressure of 1000 psi. However, if two layers of this material are used, the
bursting pressure will be twice as high and within the acceptable range. The low density of this
material (_=0.068 lb/ft2) leads to a satisfactory weight of only 79.4 lbs/wing, even with two layers of
the fabric. Dacron, traditionally used in fire hoses, boat sails, and kites, is a suitable material to be
used for the outer fabric covering the wing. The highly smooth fabric is more aerodynamic, and the
overall weight is only about 7.4 lbs/ wing. This leads to an overall wing weight of 174 lbs. for both of
the wings.
Advanced Logistics Delivery System
58
Chapter 9 Wing Deployment
9.1 Introduction
To complete the mission objectives, the unmanned glider requires the ability to deploy wings
rapidly at the apogee of its flight path. The method chosen for wing deployment was to inflate the
wings using nitrogen gas. Inflation was chosen to avoid complications with using a mechanical
system. Nitrogen gas was chosen for the inflation process because it is a stable inert gas which can be
created in chemical reactions or stored in tanks. This chapter is comprised of two sections. The first
section describes the primary inflation system, which will provide the majority of the required nitrogen
gas. The second section describes a backup system which will provide the wings with additional
nitrogen gas when needed.
9.2 Primary Inflation
To create the required pressure in each wing, nitrogen gas was chosen to fill the inflatable
structures. Nitrogen gas was chosen to fill the inflated structures because it can be created using
chemical reactions. This is the same method of inflation used in a standard car airbag or in the Mars
Pathfinder mission. An airbag inflates by igniting sodium azide (NaN3) which decomposes into
potassium (Na) and nitrogen gas (N2). Using this method, it is possible to create massive amounts of
nitrogen gas out of solid reactants stored inside the fuselage of the glider. It is important to note that
sodium azide is a highly volatile substance which requires the utmost care during manufacturing. The
maximum concentration of sodium azide allowed in the workspace is 0.2 mg/m3 air. This provides
positive and negative aspects to the inflation system. The negative aspects include high costs due to
usage of such a harmful material; however, since the substance is so volatile it will only require a small
electrical charge to begin the chemical reactions. The reaction will produce the majority of nitrogen

Advanced Logistics Delivery System
59
gas produced; however, it also creates sodium which could possibly react and destroy the wings.
Therefore the process will require three total chemical reactions, which are listed as follows.
)(_5
1
5
1
5
22
322
222
2223
23
glasssilicatealkalineSiOONaOK
NONaOKKNONa
NNaNaN
!++
++!+
+!
(eqn. 9.1)
The first reaction was described previously using the sodium azide. The second reaction uses
potassium nitrate (KNO3) to stabilize the potentially dangerous sodium byproduct. This reaction will
produce additional nitrogen gas as well as additional harmful byproducts. These byproducts are
neutralized in the third reaction using sodium dioxide (SiO2). By comparing the chemical reactions
above, the amount of nitrogen gas created can be compared to the total amount of reactants required.
In summary, to safely create the nitrogen gas required for inflation, a mixture of sodium azide,
potassium nitrate, and silicon dioxide is required. The amount of this mixture will determine the
amount of nitrogen gas created during the inflation process.
Equation 9.1 is very helpful because it shows how the amounts of reactants in the mixture vary
with the amount of nitrogen gas created. The next step is to determine exactly how much nitrogen gas
is needed to inflate the wings at a predetermined pressure. To do this the ideal gas equation is used to
relate the molar amount, pressure, and volume of the nitrogen gas. This relationship is described in the
following equation.
nVRT
Preq
ft
req =000,8
(eqn. 9.2)
In equation 9.2 Preq represents the pressure required in each wing (The required pressure was
determined in the previous chapter of this report to be 1,000 psi), Vreq is the total volume of all inflated
structures located in each wing, T is the temperature at an altitude of 8,000 feet (This is the altitude at

Advanced Logistics Delivery System
60
which the wings will be deployed), R is the universal gas constant, and n is the molar amount of
nitrogen gas. By analyzing the chemical reactions described in equation 9.1 the molar amount of
nitrogen gas created can be compared to the molar amount of the mixture used in the chemical
reactions. By using the densities of all the reactants in the mixture, the mass of the reactants can be
determined using the following equation.
ft
reqreqMixture T
VPXMASS
000,8
]09.60484.170[3144.82.3)0224.0(2 +!= (eqn. 9.3)
In this equation the variable MASS Mixture is the mass of the mixture required in kilograms to create a
given amount of nitrogen gas. This value is converted into pounds to maintain unit consistency. The
variable X will determine the amount of silicon dioxide required in the reaction to stabilize the system.
X must be equal to one or greater to balance out all harmful byproducts. The amount of silicon dioxide
can be more accurately determined by experimenting with the inflation system. Without testing, this
value it is assumed to be at the minimal case of X equaling one. Once a value for X is determined, the
amount of reactants required to fill each wing can be determined for various pressures and
temperatures. The amount of reactants in pounds compared to the required wing pressure is
summarized in Figure 9.1 for two different temperature values.
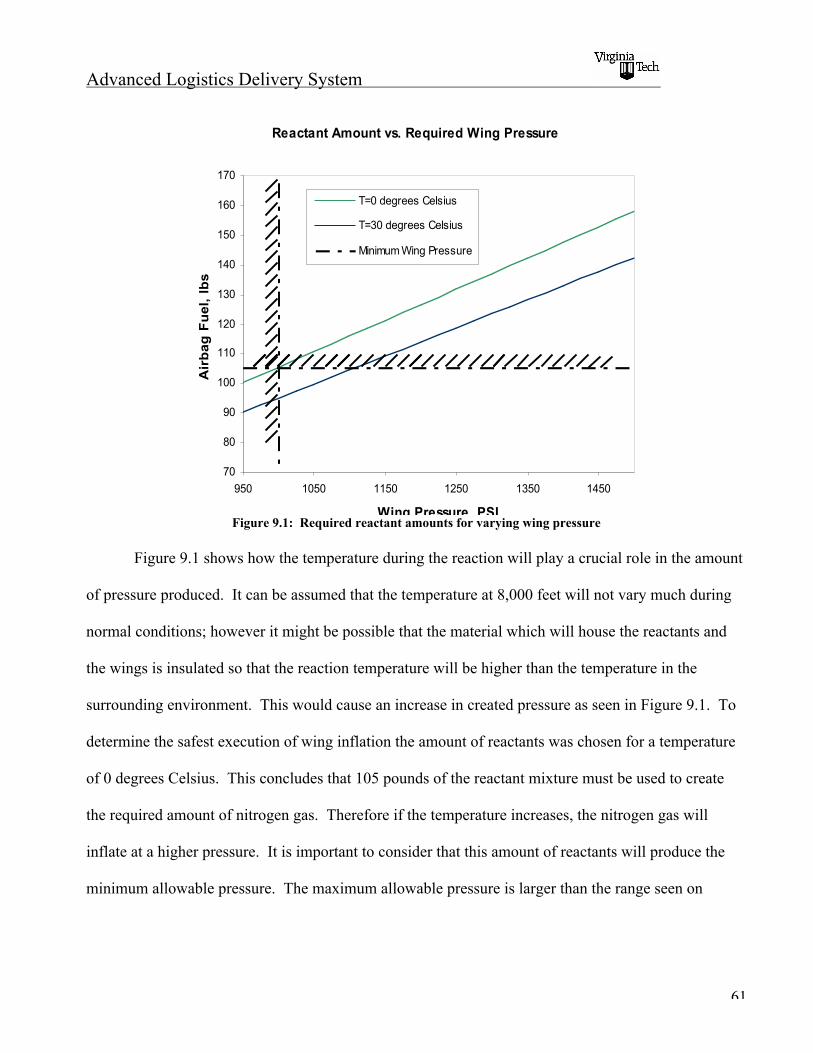
Advanced Logistics Delivery System
61
Reactant Amount vs. Required Wing Pressure
70
80
90
100
110
120
130
140
150
160
170
950 1050 1150 1250 1350 1450
Wing Pressure, PSI
Air
ba
g F
ue
l, l
bs
T=0 degrees Celsius
T=30 degrees Celsius
Minimum Wing Pressure
Figure 9.1: Required reactant amounts for varying wing pressure
Figure 9.1 shows how the temperature during the reaction will play a crucial role in the amount
of pressure produced. It can be assumed that the temperature at 8,000 feet will not vary much during
normal conditions; however it might be possible that the material which will house the reactants and
the wings is insulated so that the reaction temperature will be higher than the temperature in the
surrounding environment. This would cause an increase in created pressure as seen in Figure 9.1. To
determine the safest execution of wing inflation the amount of reactants was chosen for a temperature
of 0 degrees Celsius. This concludes that 105 pounds of the reactant mixture must be used to create
the required amount of nitrogen gas. Therefore if the temperature increases, the nitrogen gas will
inflate at a higher pressure. It is important to consider that this amount of reactants will produce the
minimum allowable pressure. The maximum allowable pressure is larger than the range seen on
Advanced Logistics Delivery System
62
Figure 9.1. By increasing the temperature the minimum amount will only improve the inflatable
structures.
The other advantage of using this inflation system is the fast deployment times it provides. The
theoretical deployment time can be determined by comparing the span of the wing (distance the
inflation process must travel), the cross section of the airfoil (the area which is inflated), the amount of
pressure which the wings will inflate with, and the weight of the wings which will be inflated. These
factors can be related using the following equations.
advv initialfinal 222 =! (eqn. 9.4)
Area
Forceessure =Pr (eqn. 9.5)
Assuming the initial velocity zero the final velocity can be solved in terms of the acceleration and
distance traveled. In this case the distance traveled is the span of the wing. Equation 9.5 can then be
substituted into equation 9.4 using Newton’s Law, F=ma. The final velocity is than used to determine
the time at which it takes the wing to inflate. The results of this ideal situation are summarized in
Figure 9.2. Figure 9.2 shows the times of inflation versus the weight of the wing. Also highlighted in
Figure 9.2 is the determined wing weight of 87 pounds. This value was determined using the final
selection of inflatable structure material in the previous chapter. This shows that at an ideal case, with
the minimum amount of pressure, the wings will deploy in a total time of 0.0217 seconds.
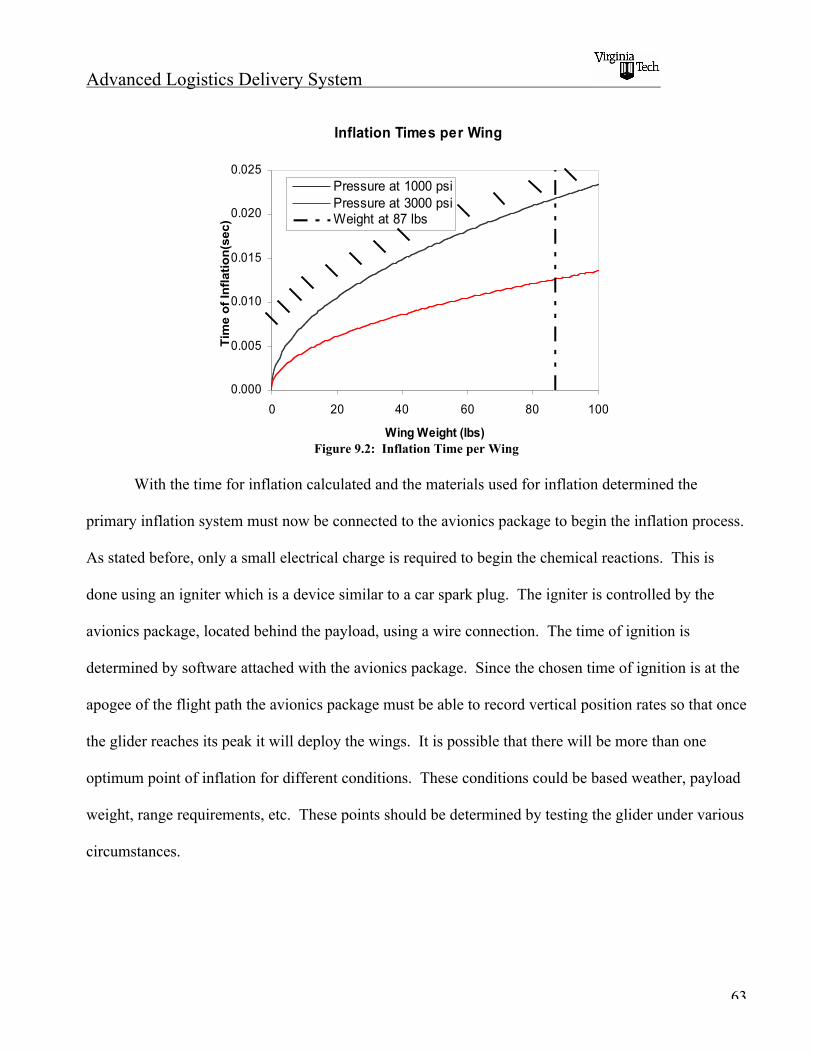
Advanced Logistics Delivery System
63
Inflation Times per Wing
0.000
0.005
0.010
0.015
0.020
0.025
0 20 40 60 80 100
Wing Weight (lbs)
Tim
e o
f In
flati
on
(sec)
Pressure at 1000 psiPressure at 3000 psiWeight at 87 lbs
Figure 9.2: Inflation Time per Wing
With the time for inflation calculated and the materials used for inflation determined the
primary inflation system must now be connected to the avionics package to begin the inflation process.
As stated before, only a small electrical charge is required to begin the chemical reactions. This is
done using an igniter which is a device similar to a car spark plug. The igniter is controlled by the
avionics package, located behind the payload, using a wire connection. The time of ignition is
determined by software attached with the avionics package. Since the chosen time of ignition is at the
apogee of the flight path the avionics package must be able to record vertical position rates so that once
the glider reaches its peak it will deploy the wings. It is possible that there will be more than one
optimum point of inflation for different conditions. These conditions could be based weather, payload
weight, range requirements, etc. These points should be determined by testing the glider under various
circumstances.
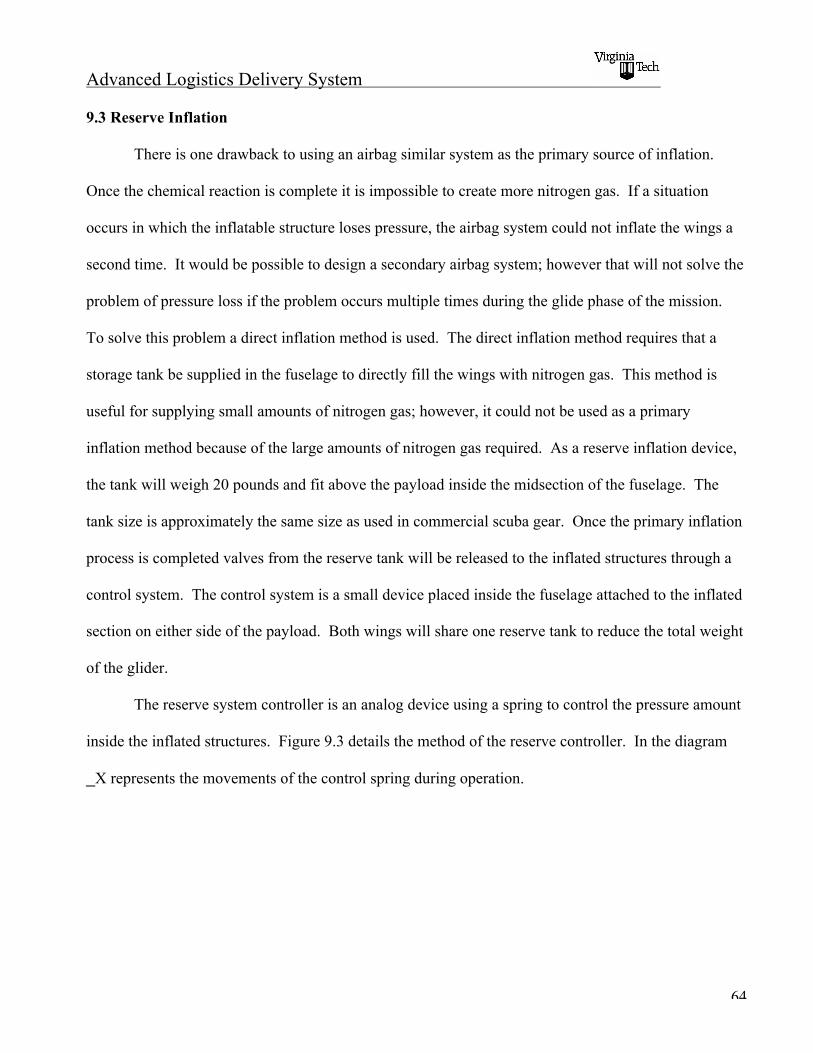
Advanced Logistics Delivery System
64
9.3 Reserve Inflation
There is one drawback to using an airbag similar system as the primary source of inflation.
Once the chemical reaction is complete it is impossible to create more nitrogen gas. If a situation
occurs in which the inflatable structure loses pressure, the airbag system could not inflate the wings a
second time. It would be possible to design a secondary airbag system; however that will not solve the
problem of pressure loss if the problem occurs multiple times during the glide phase of the mission.
To solve this problem a direct inflation method is used. The direct inflation method requires that a
storage tank be supplied in the fuselage to directly fill the wings with nitrogen gas. This method is
useful for supplying small amounts of nitrogen gas; however, it could not be used as a primary
inflation method because of the large amounts of nitrogen gas required. As a reserve inflation device,
the tank will weigh 20 pounds and fit above the payload inside the midsection of the fuselage. The
tank size is approximately the same size as used in commercial scuba gear. Once the primary inflation
process is completed valves from the reserve tank will be released to the inflated structures through a
control system. The control system is a small device placed inside the fuselage attached to the inflated
section on either side of the payload. Both wings will share one reserve tank to reduce the total weight
of the glider.
The reserve system controller is an analog device using a spring to control the pressure amount
inside the inflated structures. Figure 9.3 details the method of the reserve controller. In the diagram
_X represents the movements of the control spring during operation.
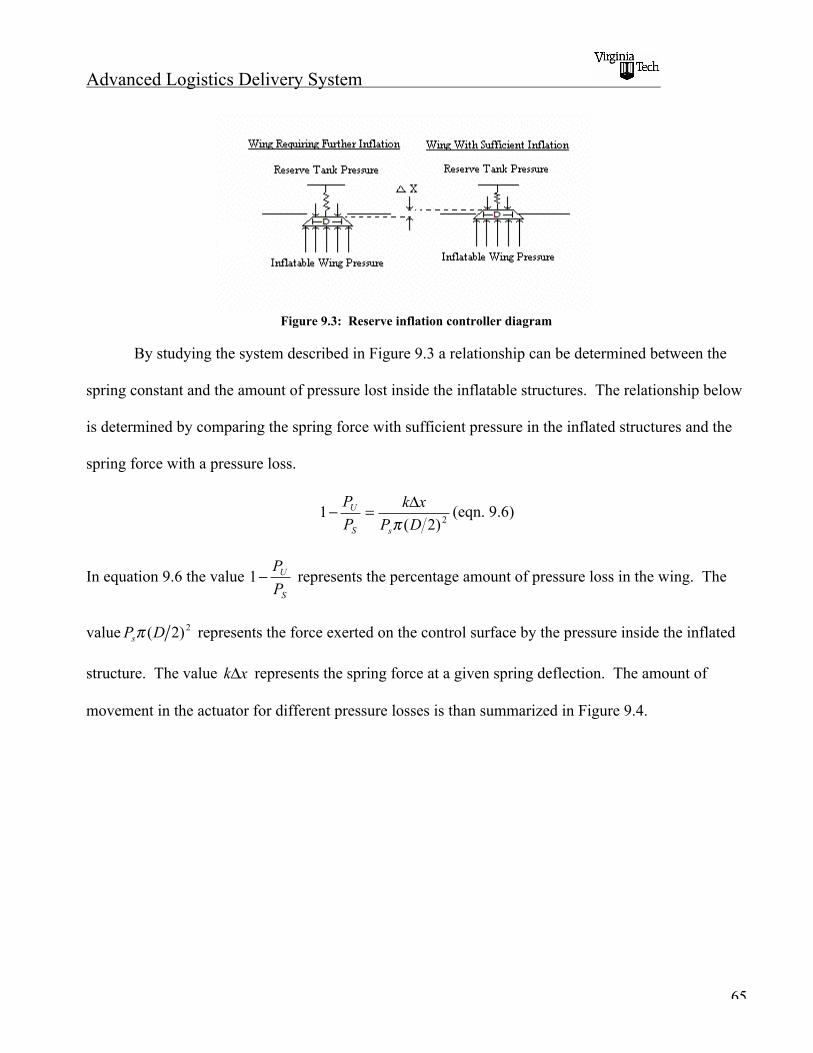
Advanced Logistics Delivery System
65
Figure 9.3: Reserve inflation controller diagram
By studying the system described in Figure 9.3 a relationship can be determined between the
spring constant and the amount of pressure lost inside the inflatable structures. The relationship below
is determined by comparing the spring force with sufficient pressure in the inflated structures and the
spring force with a pressure loss.
2)2(1
DP
xk
P
P
sS
U
!"=# (eqn. 9.6)
In equation 9.6 the value S
U
P
P!1 represents the percentage amount of pressure loss in the wing. The
value 2)2(DPs! represents the force exerted on the control surface by the pressure inside the inflated
structure. The value xk! represents the spring force at a given spring deflection. The amount of
movement in the actuator for different pressure losses is than summarized in Figure 9.4.
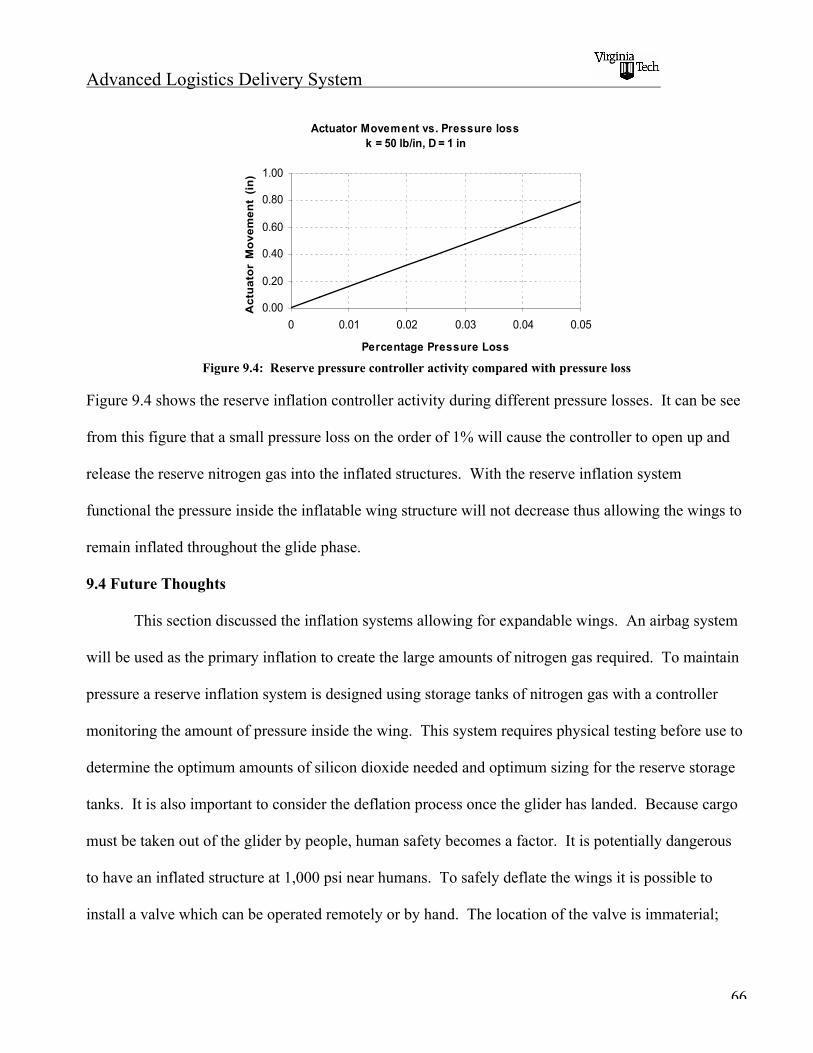
Advanced Logistics Delivery System
66
Actuator Movement vs. Pressure lossk = 50 lb/in, D = 1 in
0.00
0.20
0.40
0.60
0.80
1.00
0 0.01 0.02 0.03 0.04 0.05
Percentage Pressure Loss
Ac
tua
tor
Mo
ve
me
nt
(in
)
Figure 9.4: Reserve pressure controller activity compared with pressure loss
Figure 9.4 shows the reserve inflation controller activity during different pressure losses. It can be see
from this figure that a small pressure loss on the order of 1% will cause the controller to open up and
release the reserve nitrogen gas into the inflated structures. With the reserve inflation system
functional the pressure inside the inflatable wing structure will not decrease thus allowing the wings to
remain inflated throughout the glide phase.
9.4 Future Thoughts
This section discussed the inflation systems allowing for expandable wings. An airbag system
will be used as the primary inflation to create the large amounts of nitrogen gas required. To maintain
pressure a reserve inflation system is designed using storage tanks of nitrogen gas with a controller
monitoring the amount of pressure inside the wing. This system requires physical testing before use to
determine the optimum amounts of silicon dioxide needed and optimum sizing for the reserve storage
tanks. It is also important to consider the deflation process once the glider has landed. Because cargo
must be taken out of the glider by people, human safety becomes a factor. It is potentially dangerous
to have an inflated structure at 1,000 psi near humans. To safely deflate the wings it is possible to
install a valve which can be operated remotely or by hand. The location of the valve is immaterial;
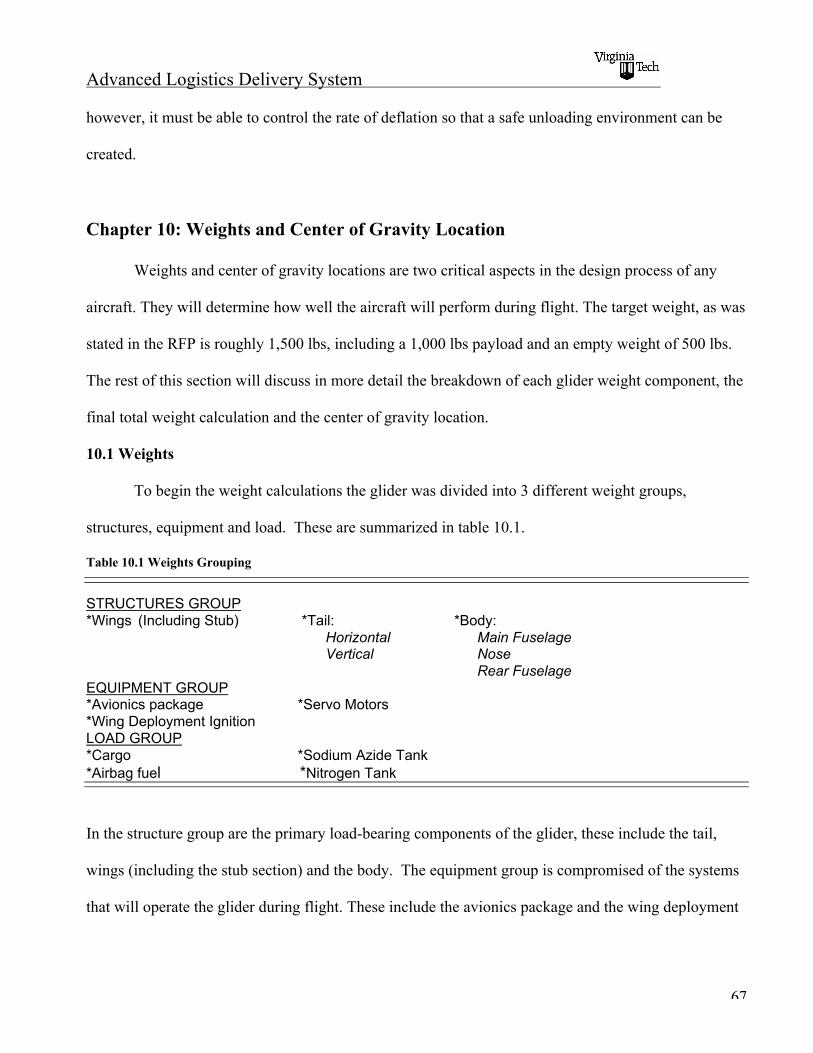
Advanced Logistics Delivery System
67
however, it must be able to control the rate of deflation so that a safe unloading environment can be
created.
Chapter 10: Weights and Center of Gravity Location
Weights and center of gravity locations are two critical aspects in the design process of any
aircraft. They will determine how well the aircraft will perform during flight. The target weight, as was
stated in the RFP is roughly 1,500 lbs, including a 1,000 lbs payload and an empty weight of 500 lbs.
The rest of this section will discuss in more detail the breakdown of each glider weight component, the
final total weight calculation and the center of gravity location.
10.1 Weights
To begin the weight calculations the glider was divided into 3 different weight groups,
structures, equipment and load. These are summarized in table 10.1.
Table 10.1 Weights Grouping
STRUCTURES GROUP*Wings (Including Stub) *Tail: *Body:
Horizontal Main FuselageVertical Nose Rear Fuselage
EQUIPMENT GROUP*Avionics package *Servo Motors*Wing Deployment IgnitionLOAD GROUP*Cargo *Sodium Azide Tank*Airbag fuel *Nitrogen Tank
In the structure group are the primary load-bearing components of the glider, these include the tail,
wings (including the stub section) and the body. The equipment group is compromised of the systems
that will operate the glider during flight. These include the avionics package and the wing deployment
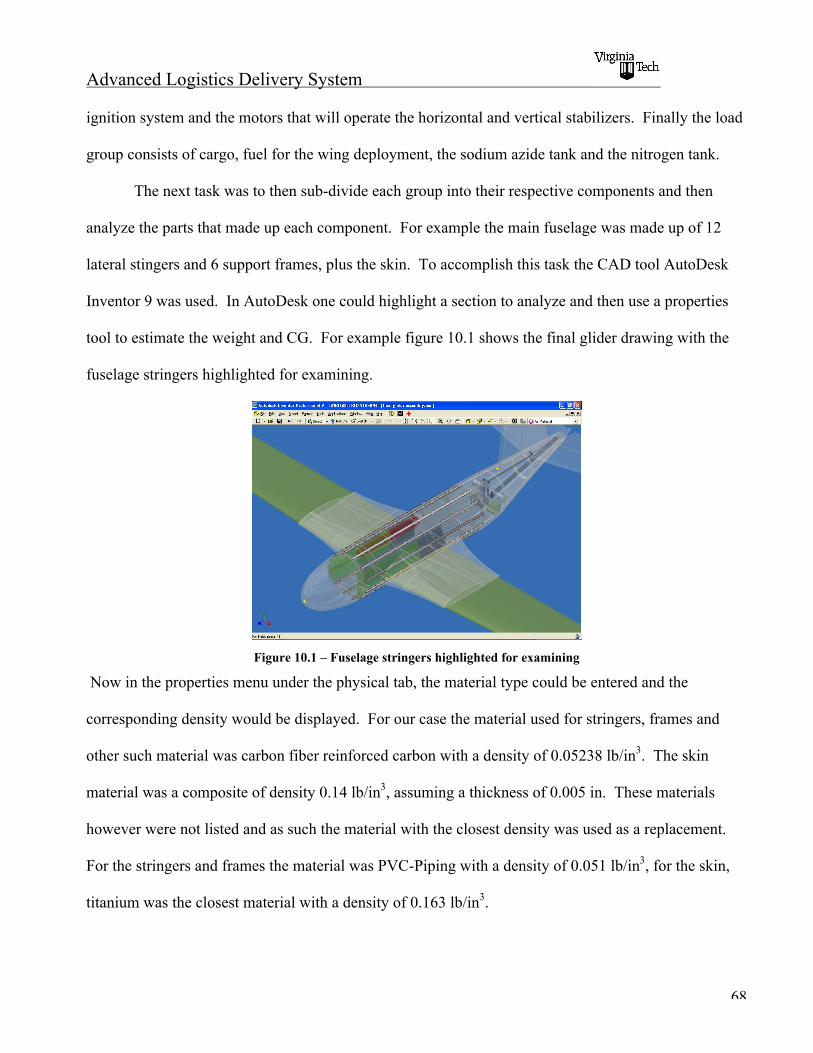
Advanced Logistics Delivery System
68
ignition system and the motors that will operate the horizontal and vertical stabilizers. Finally the load
group consists of cargo, fuel for the wing deployment, the sodium azide tank and the nitrogen tank.
The next task was to then sub-divide each group into their respective components and then
analyze the parts that made up each component. For example the main fuselage was made up of 12
lateral stingers and 6 support frames, plus the skin. To accomplish this task the CAD tool AutoDesk
Inventor 9 was used. In AutoDesk one could highlight a section to analyze and then use a properties
tool to estimate the weight and CG. For example figure 10.1 shows the final glider drawing with the
fuselage stringers highlighted for examining.
Figure 10.1 – Fuselage stringers highlighted for examining
Now in the properties menu under the physical tab, the material type could be entered and the
corresponding density would be displayed. For our case the material used for stringers, frames and
other such material was carbon fiber reinforced carbon with a density of 0.05238 lb/in3. The skin
material was a composite of density 0.14 lb/in3, assuming a thickness of 0.005 in. These materials
however were not listed and as such the material with the closest density was used as a replacement.
For the stringers and frames the material was PVC-Piping with a density of 0.051 lb/in3, for the skin,
titanium was the closest material with a density of 0.163 lb/in3.
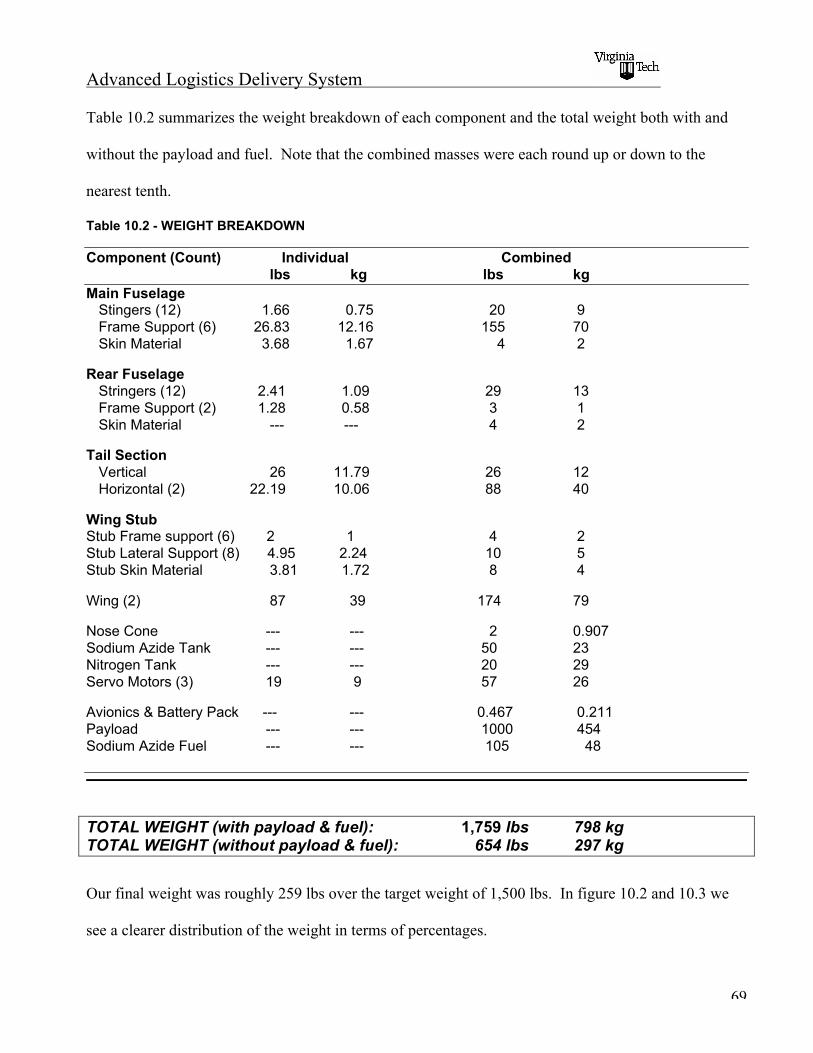
Advanced Logistics Delivery System
69
Table 10.2 summarizes the weight breakdown of each component and the total weight both with and
without the payload and fuel. Note that the combined masses were each round up or down to the
nearest tenth.
Table 10.2 - WEIGHT BREAKDOWN
Component (Count) Individual Combined lbs kg lbs kg
Main FuselageStingers (12) 1.66 0.75 20 9Frame Support (6) 26.83 12.16 155 70Skin Material 3.68 1.67 4 2
Rear FuselageStringers (12) 2.41 1.09 29 13Frame Support (2) 1.28 0.58 3 1Skin Material --- --- 4 2
Tail SectionVertical 26 11.79 26 12Horizontal (2) 22.19 10.06 88 40
Wing StubStub Frame support (6) 2 1 4 2Stub Lateral Support (8) 4.95 2.24 10 5Stub Skin Material 3.81 1.72 8 4
Wing (2) 87 39 174 79
Nose Cone --- --- 2 0.907Sodium Azide Tank --- --- 50 23Nitrogen Tank --- --- 20 29Servo Motors (3) 19 9 57 26
Avionics & Battery Pack --- --- 0.467 0.211Payload --- --- 1000 454Sodium Azide Fuel --- --- 105 48
TOTAL WEIGHT (with payload & fuel): 1,759 lbs 798 kgTOTAL WEIGHT (without payload & fuel): 654 lbs 297 kg
Our final weight was roughly 259 lbs over the target weight of 1,500 lbs. In figure 10.2 and 10.3 we
see a clearer distribution of the weight in terms of percentages.
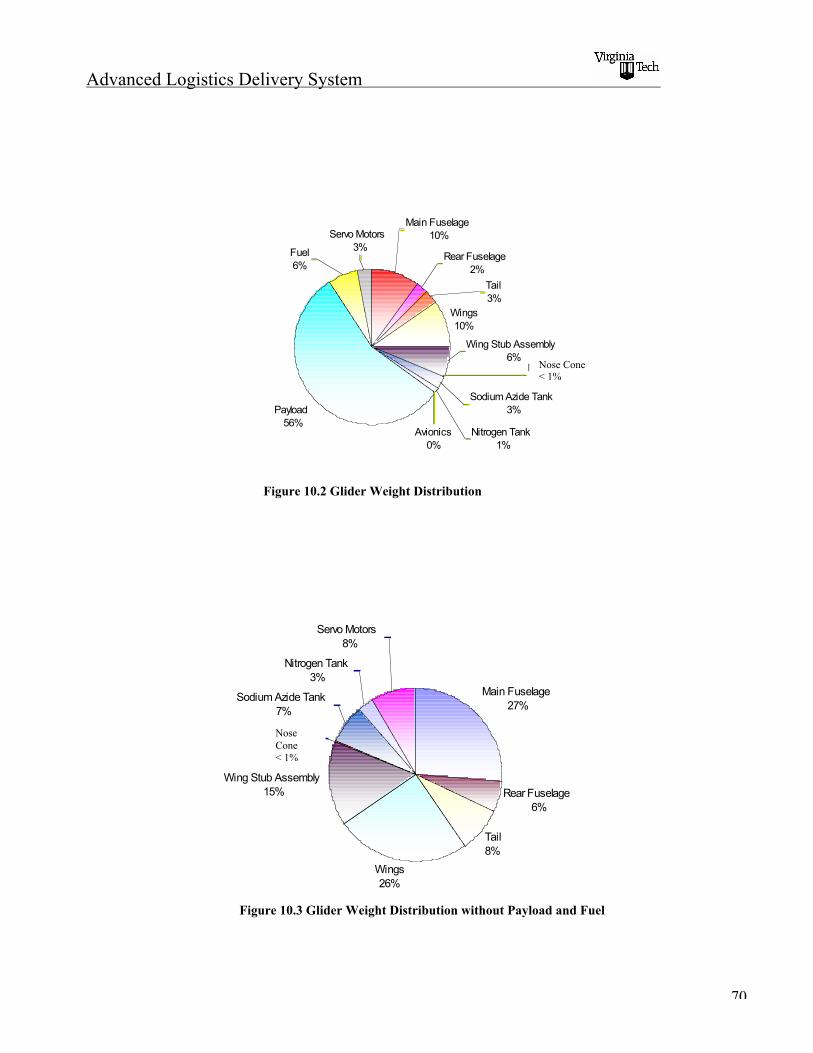
Advanced Logistics Delivery System
70
Figure 3 - Glider Weight Distribution (w/ payload and fuel)
Payload56%
Wings10%
Wing Stub Assembly6%
Sodium Azide Tank3%
Nitrogen Tank1%
Tail3%
Rear Fuselage2%
Main Fuselage10%
Nose Cone0%
Avionics0%
Fuel6%
Servo Motors3%
Figure 4 - Glider Weight Distribution (w/out payload & fuel)
Main Fuselage27%
Rear Fuselage6%
Tail8%
Wings 26%
Wing Stub Assembly15%
Nose Cone0%
Sodium Azide Tank7%
Nitrogen Tank3%
Servo Motors8%
Figure 10.2 Glider Weight Distribution
Figure 10.3 Glider Weight Distribution without Payload and Fuel
Nose Cone< 1%
NoseCone< 1%
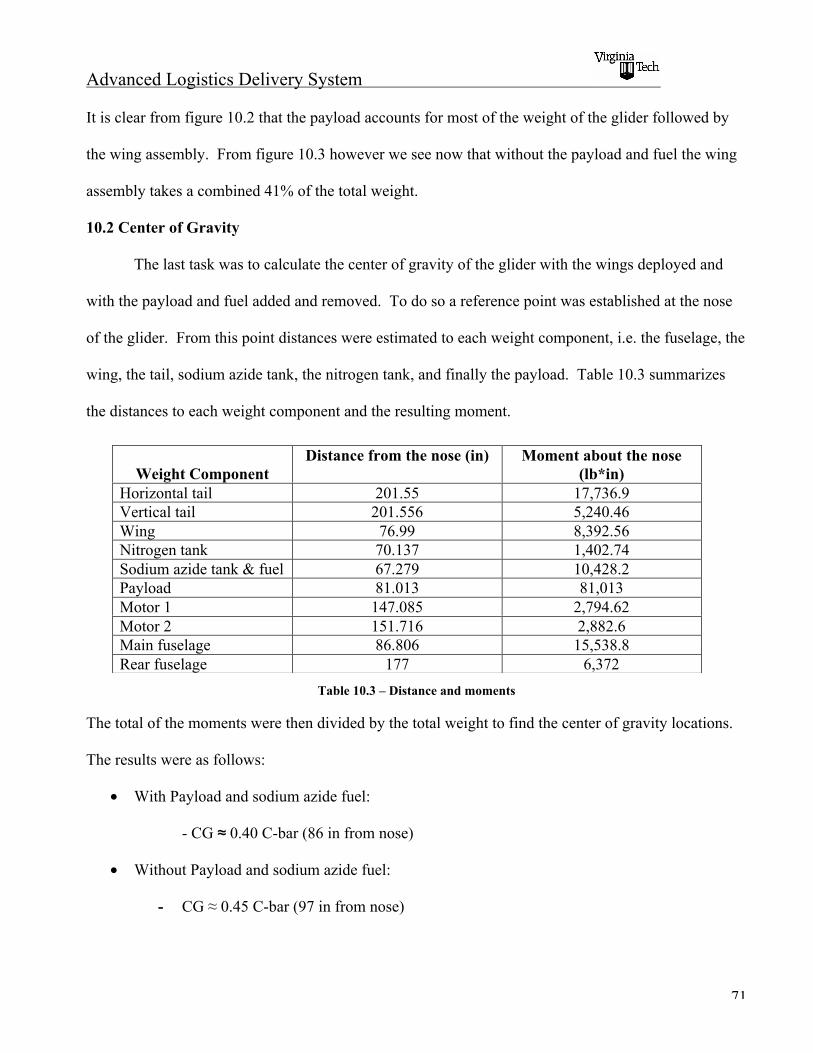
Advanced Logistics Delivery System
71
It is clear from figure 10.2 that the payload accounts for most of the weight of the glider followed by
the wing assembly. From figure 10.3 however we see now that without the payload and fuel the wing
assembly takes a combined 41% of the total weight.
10.2 Center of Gravity
The last task was to calculate the center of gravity of the glider with the wings deployed and
with the payload and fuel added and removed. To do so a reference point was established at the nose
of the glider. From this point distances were estimated to each weight component, i.e. the fuselage, the
wing, the tail, sodium azide tank, the nitrogen tank, and finally the payload. Table 10.3 summarizes
the distances to each weight component and the resulting moment.
Table 10.3 – Distance and moments
The total of the moments were then divided by the total weight to find the center of gravity locations.
The results were as follows:
• With Payload and sodium azide fuel:
- CG ≈ 0.40 C-bar (86 in from nose)
• Without Payload and sodium azide fuel:
- CG ≈ 0.45 C-bar (97 in from nose)
Weight ComponentDistance from the nose (in) Moment about the nose
(lb*in)Horizontal tail 201.55 17,736.9Vertical tail 201.556 5,240.46Wing 76.99 8,392.56Nitrogen tank 70.137 1,402.74Sodium azide tank & fuel 67.279 10,428.2Payload 81.013 81,013Motor 1 147.085 2,794.62Motor 2 151.716 2,882.6Main fuselage 86.806 15,538.8Rear fuselage 177 6,372
Advanced Logistics Delivery System
72
Chapter 11 Analysis of Glider Stability and Control
11.1 Introduction
The following section describes the constraints, processes, and finally the overall aerodynamic
configuration needed to obtain a glider that is both stable and controllable.
11.2 Constraints
The nature of the launch created a list of usually unseen constraints when it comes to glider
design. The narrow tunnel the glider must be launched through limits the glider span and height. The
span constraint limited the solid span of the wings and the overall span of the tail to 10 feet. Due to the
wings being filled completely with inflatable structure, there would not be enough structure in the
wings to allow control surfaces on them. The span constraint on the tail limited the overall tail area
and effectiveness, and will be discussed later in the report. Another constraint due to the launch
process was the overall length of the glider. The overall length was constrained to 18.5 feet for storage
reasons. This would affect the magnitude of the moments the tail would be able to create, as well as
influence the overall sizing of the tail.
11.3 Requirements
There were a few basic requirements that needed to be fulfilled in order to deliver optimum
performance from glider. First, all the constraints listed above needed to be met. Second, the glider
and most importantly the tail boom and tail surfaces must be able to withstand the severe loads
encountered during launch. Next, the glider will be stable and controllable during wing deployment.
The glider must be navigated without the use of an on-board pilot. Finally, the glider must be stable
and controllable during the descent.

Advanced Logistics Delivery System
73
11.4 Launch Loads
The severe loads encountered during launch were mentioned earlier in the structural section of
the report. The tail will undergo loads of 3783.1 pounds backwards and 7244.3 pounds downward.
These loads are large enough to cause concern, but not so large to create major problems.
11.5 Wing deployment
There were two main concerns associated with wing deployment, center of gravity location and
stability during deployment.
Center of gravity
The first issue to be addressed was the location of the center of gravity. This property is a
major concern in the overall design process of this aircraft. The craft will act much like a rocket before
the wings are deployed. For a rocket to be stable, it is necessary for the center of gravity to be located
forward of the neutral point, this can be seen below in Figure 11.1.
Figure 11.1. Locations of center of gravity and center of pressure for stability of rocket or missile.
For the deployed glider to be stable the center of gravity will need to be located forward of the
neutral point. The neutral point however will shift forward, as seen in Figure 11.2 below, on its own
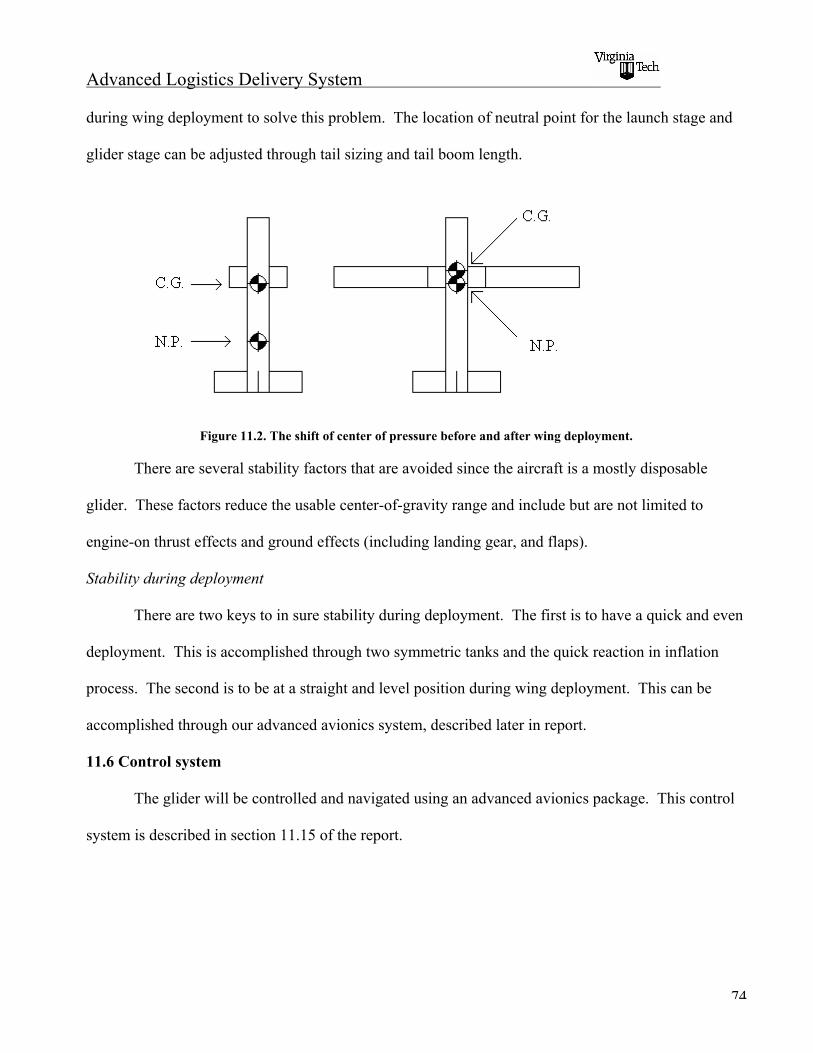
Advanced Logistics Delivery System
74
during wing deployment to solve this problem. The location of neutral point for the launch stage and
glider stage can be adjusted through tail sizing and tail boom length.
Figure 11.2. The shift of center of pressure before and after wing deployment.
There are several stability factors that are avoided since the aircraft is a mostly disposable
glider. These factors reduce the usable center-of-gravity range and include but are not limited to
engine-on thrust effects and ground effects (including landing gear, and flaps).
Stability during deployment
There are two keys to in sure stability during deployment. The first is to have a quick and even
deployment. This is accomplished through two symmetric tanks and the quick reaction in inflation
process. The second is to be at a straight and level position during wing deployment. This can be
accomplished through our advanced avionics system, described later in report.
11.6 Control system
The glider will be controlled and navigated using an advanced avionics package. This control
system is described in section 11.15 of the report.

Advanced Logistics Delivery System
75
11.7 Tail Configuration
The selection of type of tail to be used in this aircraft was a vital decision due to the limited
chances for control surfaces on the wings. The five types of tails considered can be seen in Figure
11.3, they are the conventional tail, T-tail, Y-tail, V-tail, and inverted V-tail.
Figure 11.3. Tails being considered for glider.
Conventional
The main advantage of a conventional tail is reliability. The conventional tail is used on
approximately 70% of all aircraft. Most basic stability and control calculations and theory is based on
the conventional tail. The conventional tail provides adequate stability and control at the lightest
weight.
T-tail
The T-tail has several defining characteristics. The T-tail is heavier then a conventional tail
due to the added structural support needed. The main advantages of the T-tail are that it is a smaller
vertical tail and has the ability to avoid wing wake. The ability to avoid wing wake may be useful if
the wings contain very small control surfaces that are close to fuselage and have high angles of
deflection.
V-tail
The V-tail is another interesting tail configuration. The use of V-tails is being seen more and
more, especially in unmanned air vehicles. The V-tail is intended to reduce the wetted tail area. The
use of a V-tail also creates a larger vertical distance from the wings and therefore reduces the effects of
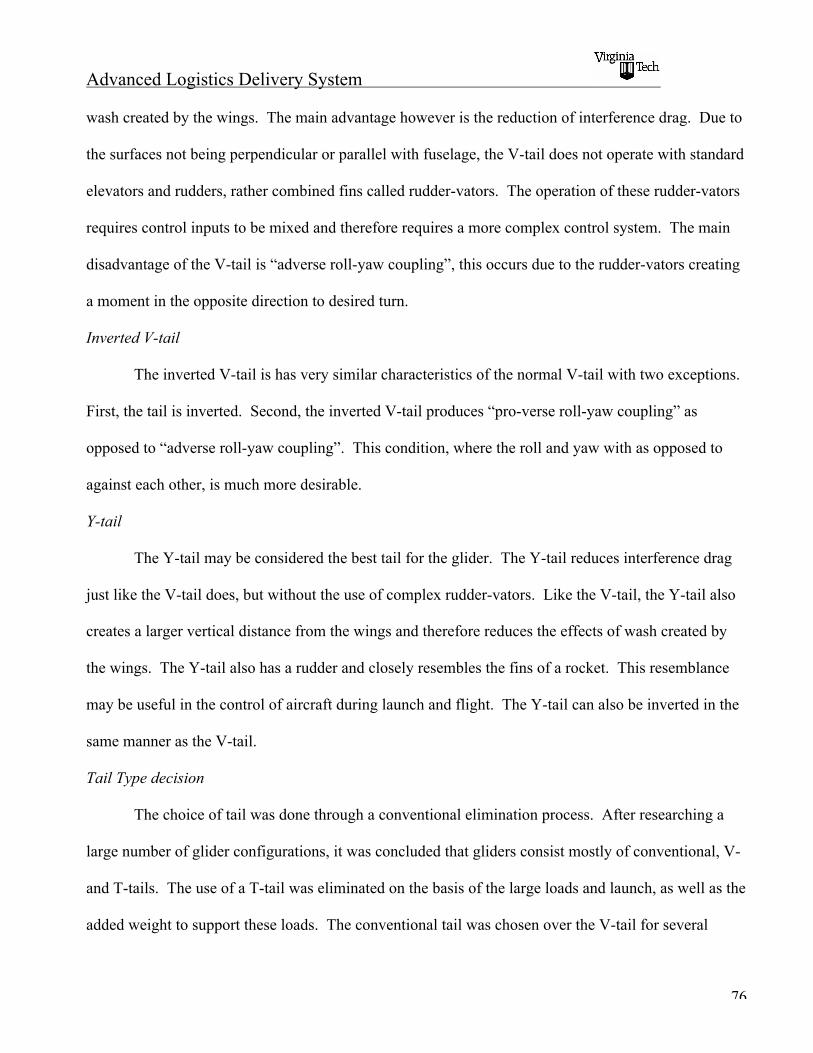
Advanced Logistics Delivery System
76
wash created by the wings. The main advantage however is the reduction of interference drag. Due to
the surfaces not being perpendicular or parallel with fuselage, the V-tail does not operate with standard
elevators and rudders, rather combined fins called rudder-vators. The operation of these rudder-vators
requires control inputs to be mixed and therefore requires a more complex control system. The main
disadvantage of the V-tail is “adverse roll-yaw coupling”, this occurs due to the rudder-vators creating
a moment in the opposite direction to desired turn.
Inverted V-tail
The inverted V-tail is has very similar characteristics of the normal V-tail with two exceptions.
First, the tail is inverted. Second, the inverted V-tail produces “pro-verse roll-yaw coupling” as
opposed to “adverse roll-yaw coupling”. This condition, where the roll and yaw with as opposed to
against each other, is much more desirable.
Y-tail
The Y-tail may be considered the best tail for the glider. The Y-tail reduces interference drag
just like the V-tail does, but without the use of complex rudder-vators. Like the V-tail, the Y-tail also
creates a larger vertical distance from the wings and therefore reduces the effects of wash created by
the wings. The Y-tail also has a rudder and closely resembles the fins of a rocket. This resemblance
may be useful in the control of aircraft during launch and flight. The Y-tail can also be inverted in the
same manner as the V-tail.
Tail Type decision
The choice of tail was done through a conventional elimination process. After researching a
large number of glider configurations, it was concluded that gliders consist mostly of conventional, V-
and T-tails. The use of a T-tail was eliminated on the basis of the large loads and launch, as well as the
added weight to support these loads. The conventional tail was chosen over the V-tail for several
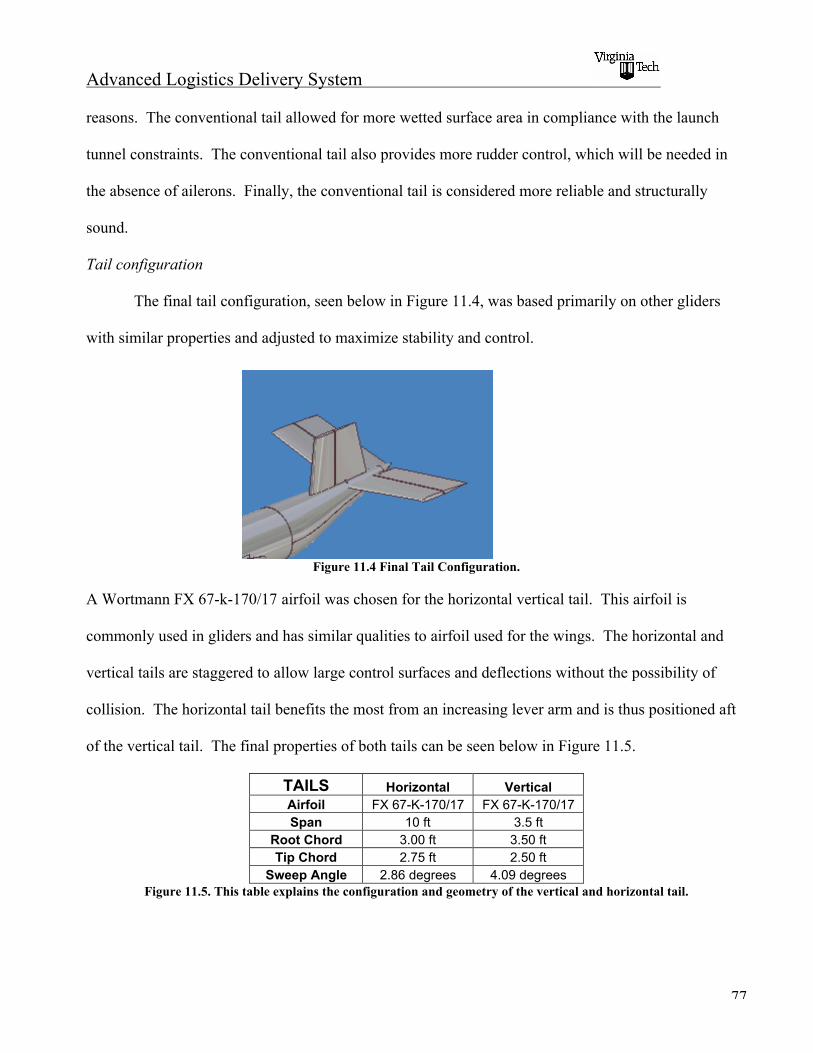
Advanced Logistics Delivery System
77
reasons. The conventional tail allowed for more wetted surface area in compliance with the launch
tunnel constraints. The conventional tail also provides more rudder control, which will be needed in
the absence of ailerons. Finally, the conventional tail is considered more reliable and structurally
sound.
Tail configuration
The final tail configuration, seen below in Figure 11.4, was based primarily on other gliders
with similar properties and adjusted to maximize stability and control.
Figure 11.4 Final Tail Configuration.
A Wortmann FX 67-k-170/17 airfoil was chosen for the horizontal vertical tail. This airfoil is
commonly used in gliders and has similar qualities to airfoil used for the wings. The horizontal and
vertical tails are staggered to allow large control surfaces and deflections without the possibility of
collision. The horizontal tail benefits the most from an increasing lever arm and is thus positioned aft
of the vertical tail. The final properties of both tails can be seen below in Figure 11.5.
TAILS Horizontal VerticalAirfoil FX 67-K-170/17 FX 67-K-170/17Span 10 ft 3.5 ft
Root Chord 3.00 ft 3.50 ftTip Chord 2.75 ft 2.50 ft
Sweep Angle 2.86 degrees 4.09 degreesFigure 11.5. This table explains the configuration and geometry of the vertical and horizontal tail.
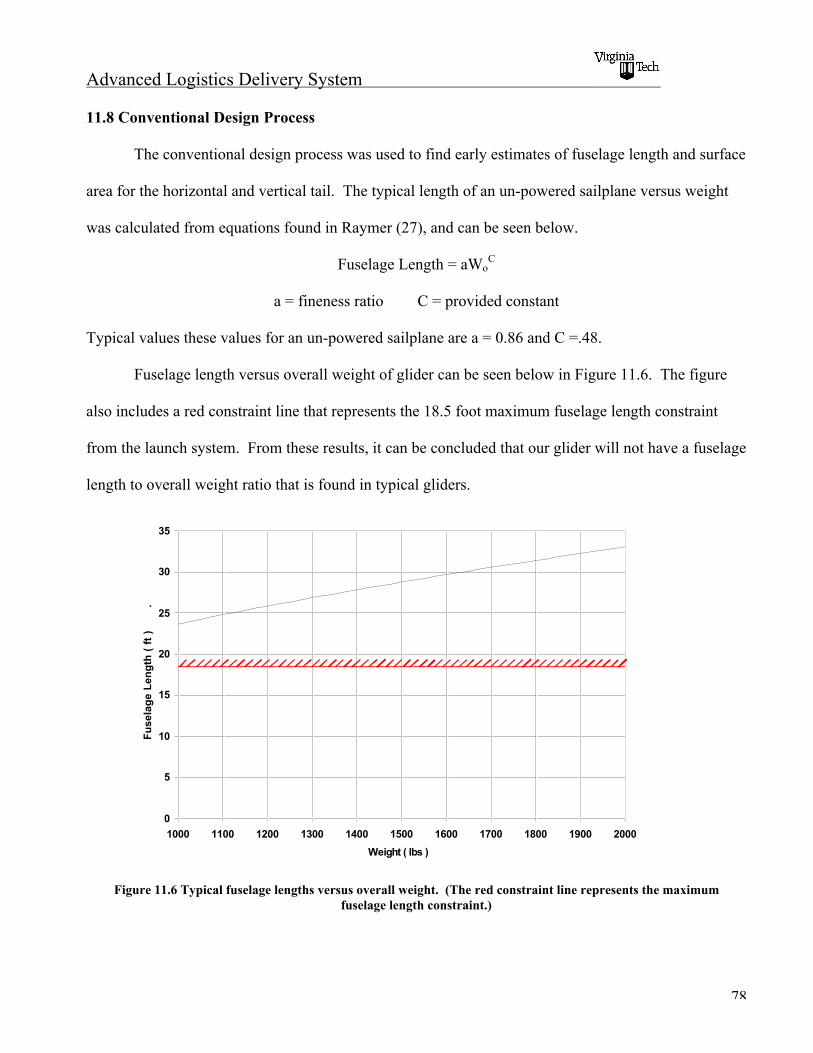
Advanced Logistics Delivery System
78
11.8 Conventional Design Process
The conventional design process was used to find early estimates of fuselage length and surface
area for the horizontal and vertical tail. The typical length of an un-powered sailplane versus weight
was calculated from equations found in Raymer (27), and can be seen below.
Fuselage Length = aWoC
a = fineness ratio C = provided constant
Typical values these values for an un-powered sailplane are a = 0.86 and C =.48.
Fuselage length versus overall weight of glider can be seen below in Figure 11.6. The figure
also includes a red constraint line that represents the 18.5 foot maximum fuselage length constraint
from the launch system. From these results, it can be concluded that our glider will not have a fuselage
length to overall weight ratio that is found in typical gliders.
0
5
10
15
20
25
30
35
1000 1100 1200 1300 1400 1500 1600 1700 1800 1900 2000
Weight ( lbs )
Fu
sela
ge
Len
gth
( f
t )
.
Figure 11.6 Typical fuselage lengths versus overall weight. (The red constraint line represents the maximumfuselage length constraint.)
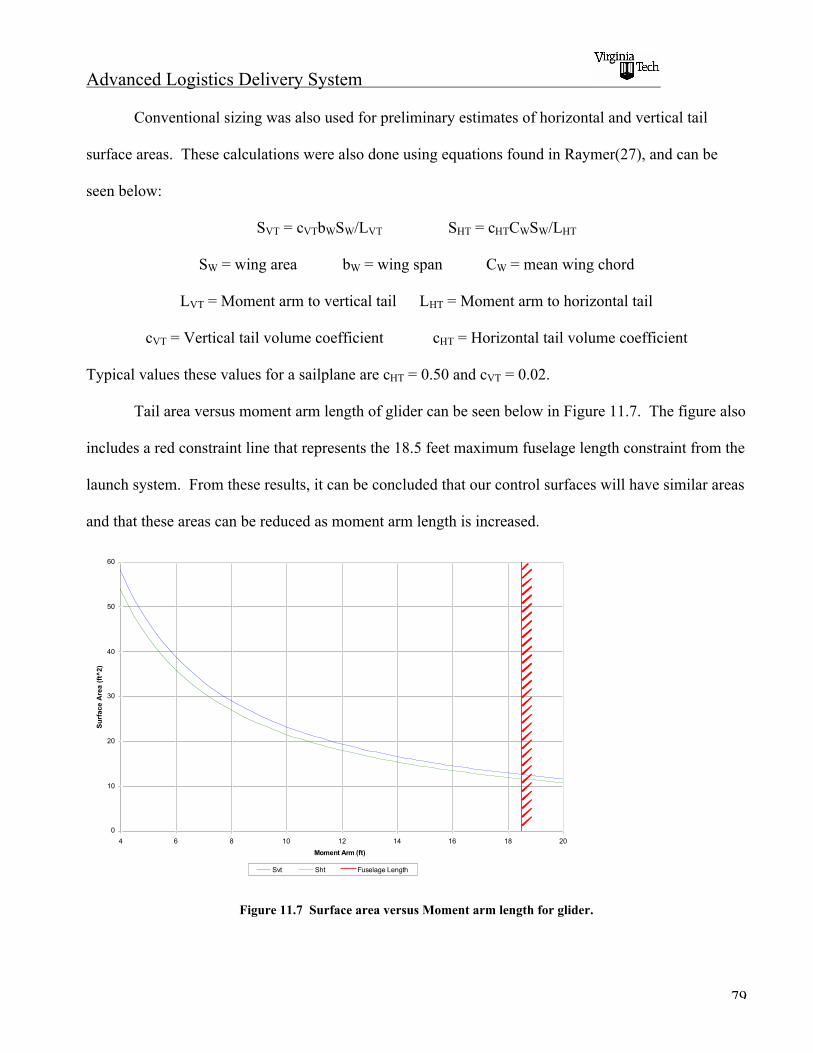
Advanced Logistics Delivery System
79
Conventional sizing was also used for preliminary estimates of horizontal and vertical tail
surface areas. These calculations were also done using equations found in Raymer(27), and can be
seen below:
SVT = cVTbWSW/LVT SHT = cHTCWSW/LHT
SW = wing area bW = wing span CW = mean wing chord
LVT = Moment arm to vertical tail LHT = Moment arm to horizontal tail
cVT = Vertical tail volume coefficient cHT = Horizontal tail volume coefficient
Typical values these values for a sailplane are cHT = 0.50 and cVT = 0.02.
Tail area versus moment arm length of glider can be seen below in Figure 11.7. The figure also
includes a red constraint line that represents the 18.5 feet maximum fuselage length constraint from the
launch system. From these results, it can be concluded that our control surfaces will have similar areas
and that these areas can be reduced as moment arm length is increased.
0
10
20
30
40
50
60
4 6 8 10 12 14 16 18 20
Moment Arm (ft)
Su
rfac
e A
rea
(ft^
2)
Svt Sht Fuselage Length
Figure 11.7 Surface area versus Moment arm length for glider.
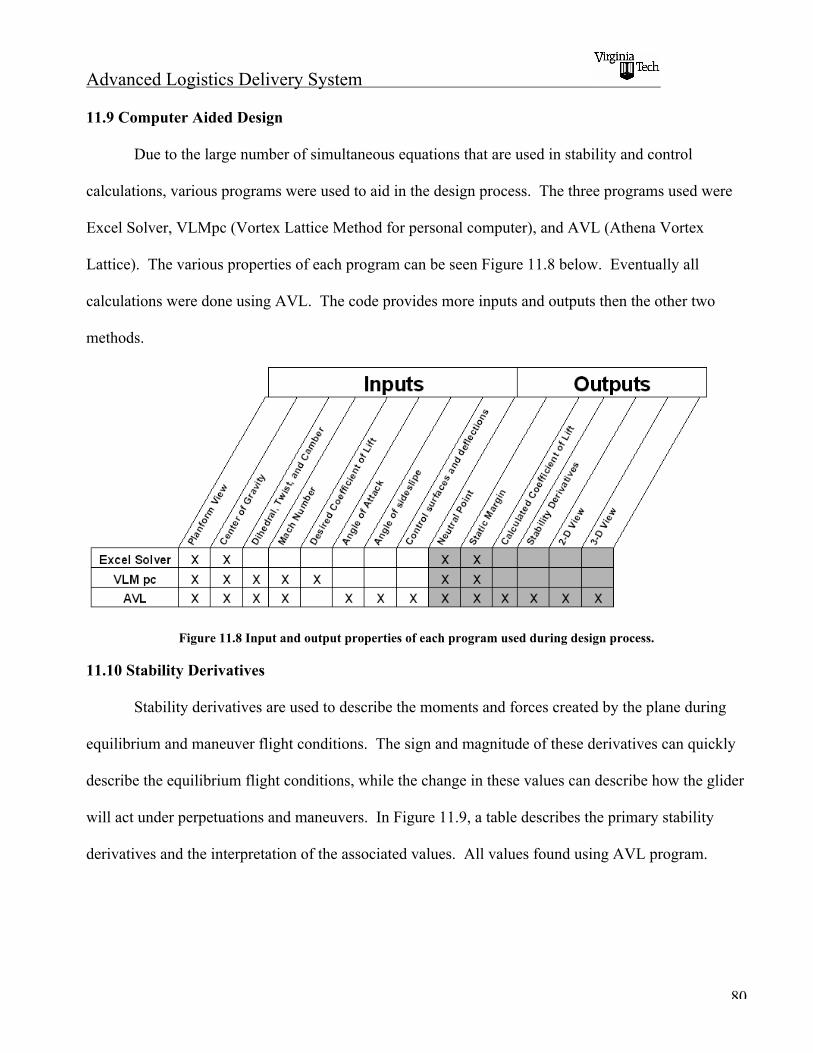
Advanced Logistics Delivery System
80
11.9 Computer Aided Design
Due to the large number of simultaneous equations that are used in stability and control
calculations, various programs were used to aid in the design process. The three programs used were
Excel Solver, VLMpc (Vortex Lattice Method for personal computer), and AVL (Athena Vortex
Lattice). The various properties of each program can be seen Figure 11.8 below. Eventually all
calculations were done using AVL. The code provides more inputs and outputs then the other two
methods.
Figure 11.8 Input and output properties of each program used during design process.
11.10 Stability Derivatives
Stability derivatives are used to describe the moments and forces created by the plane during
equilibrium and maneuver flight conditions. The sign and magnitude of these derivatives can quickly
describe the equilibrium flight conditions, while the change in these values can describe how the glider
will act under perpetuations and maneuvers. In Figure 11.9, a table describes the primary stability
derivatives and the interpretation of the associated values. All values found using AVL program.
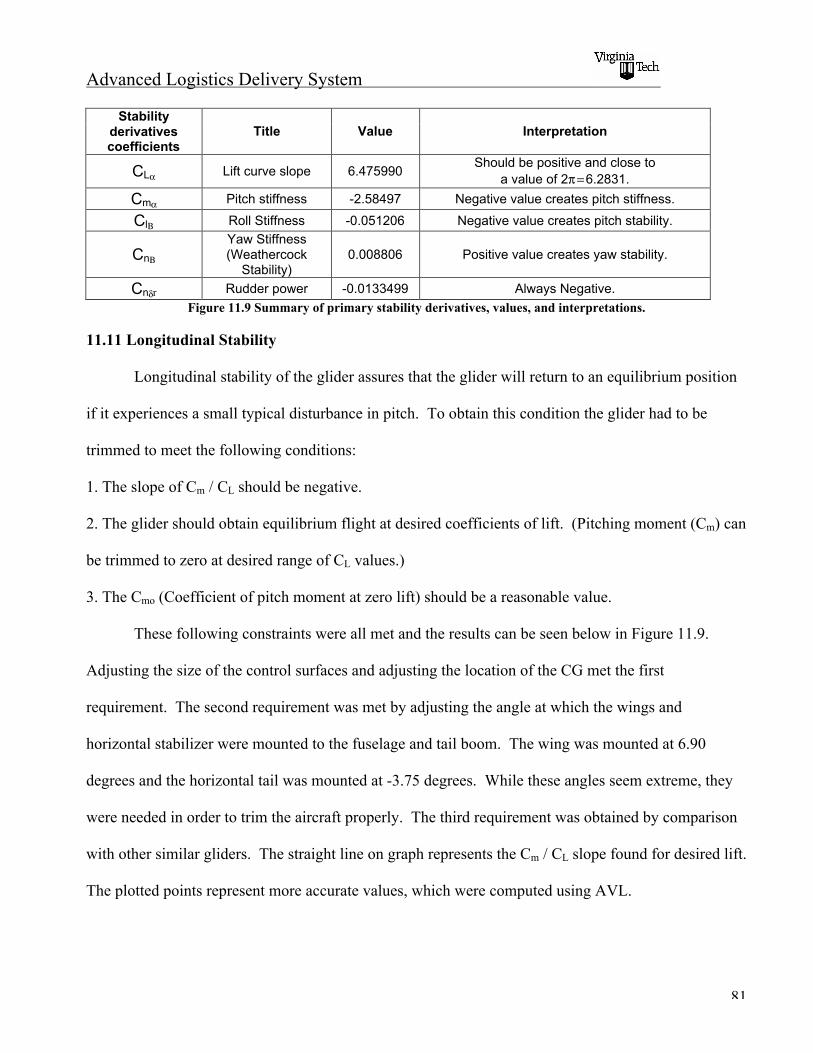
Advanced Logistics Delivery System
81
Stabilityderivativescoefficients
Title Value Interpretation
CL! Lift curve slope 6.475990Should be positive and close to
a value of 2% = 6.2831.
Cm! Pitch stiffness -2.58497 Negative value creates pitch stiffness.
Cl& Roll Stiffness -0.051206 Negative value creates pitch stability.
Cn&
Yaw Stiffness(Weathercock
Stability)0.008806 Positive value creates yaw stability.
Cn'r Rudder power -0.0133499 Always Negative.
Figure 11.9 Summary of primary stability derivatives, values, and interpretations.
11.11 Longitudinal Stability
Longitudinal stability of the glider assures that the glider will return to an equilibrium position
if it experiences a small typical disturbance in pitch. To obtain this condition the glider had to be
trimmed to meet the following conditions:
1. The slope of Cm / CL should be negative.
2. The glider should obtain equilibrium flight at desired coefficients of lift. (Pitching moment (Cm) can
be trimmed to zero at desired range of CL values.)
3. The Cmo (Coefficient of pitch moment at zero lift) should be a reasonable value.
These following constraints were all met and the results can be seen below in Figure 11.9.
Adjusting the size of the control surfaces and adjusting the location of the CG met the first
requirement. The second requirement was met by adjusting the angle at which the wings and
horizontal stabilizer were mounted to the fuselage and tail boom. The wing was mounted at 6.90
degrees and the horizontal tail was mounted at -3.75 degrees. While these angles seem extreme, they
were needed in order to trim the aircraft properly. The third requirement was obtained by comparison
with other similar gliders. The straight line on graph represents the Cm / CL slope found for desired lift.
The plotted points represent more accurate values, which were computed using AVL.
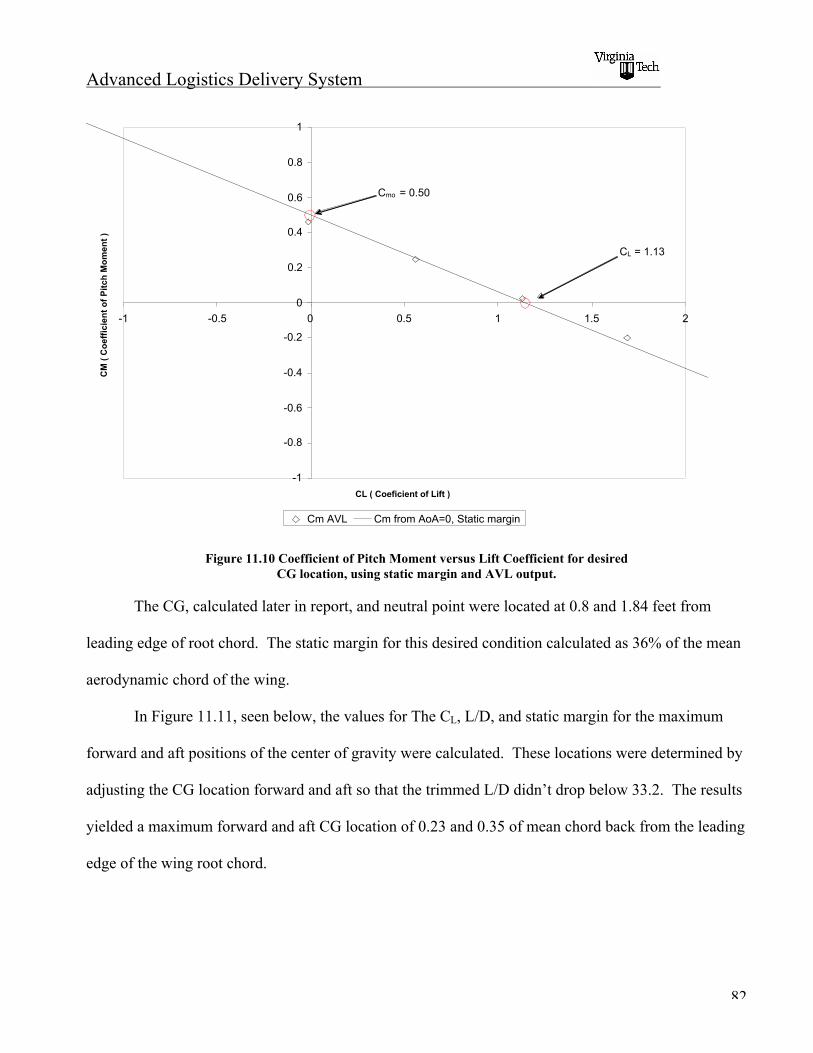
Advanced Logistics Delivery System
82
-1
-0.8
-0.6
-0.4
-0.2
0
0.2
0.4
0.6
0.8
1
-1 -0.5 0 0.5 1 1.5 2
CL ( Coeficient of Lift )
CM
( C
oef
fici
ent
of
Pit
ch M
om
ent
)
Cm AVL Cm from AoA=0, Static margin
Cmo = 0.50
CL = 1.13
Figure 11.10 Coefficient of Pitch Moment versus Lift Coefficient for desiredCG location, using static margin and AVL output.
The CG, calculated later in report, and neutral point were located at 0.8 and 1.84 feet from
leading edge of root chord. The static margin for this desired condition calculated as 36% of the mean
aerodynamic chord of the wing.
In Figure 11.11, seen below, the values for The CL, L/D, and static margin for the maximum
forward and aft positions of the center of gravity were calculated. These locations were determined by
adjusting the CG location forward and aft so that the trimmed L/D didn’t drop below 33.2. The results
yielded a maximum forward and aft CG location of 0.23 and 0.35 of mean chord back from the leading
edge of the wing root chord.

Advanced Logistics Delivery System
83
-0.6
-0.4
-0.2
0
0.2
0.4
0.6
-0.5 0 0.5 1 1.5 2
CL ( Coefficient of Lift Force )
CM
( C
oeffi
cien
t of P
itch
Mom
ent )
CG ForwardCL = 1.05L/D = 34.3Static Margin = 47%
CG AftCL = 1.39L/D = 33.7Static Margin =.36
Figure 11.11 Coefficient of pitch moment versus coefficient of lift for optimum CG location, and maximum forwardand aft CG location.
11.12 Pitch Control and Elevator Performance
Once longitudinal stability has been achieved, pitch control, and effectiveness were determined.
It was important that as the glider performed well even at various CG locations, angles of attack, and
elevator deflections. The desired angle of attack range was set from –5 to 5 degrees. Maximum
elevator deflections were set at ± 20 degrees, this value was determined later in the report. The
maximum and minimum trimmed CL values were set so that corresponding value of L/D would not
drop below 33.2. The forward and aft positions also required a minimum elevator deflection of ±2
degrees to create trim. The different slopes of locations of CG means different elevator deflections are
needed to create trim. In Figure 11.12 below, the trimmed conditions for the glider at the most
desirable CG location can be seen.

Advanced Logistics Delivery System
84
-0.5
-0.4
-0.3
-0.2
-0.1
0
0.1
0.2
0.3
0.4
0.5
0 0.2 0.4 0.6 0.8 1 1.2 1.4 1.6 1.8 2
CL ( Coefficient of Lift Force )
CM
( C
oeffi
cien
t of P
itch
Mom
ent )
!e = 3°
!e = 0°
!e = -5°
" = -5°
" = 5°
CL = 0.86L/D = 33.2
CL = 1.46L/D = 33.3
Figure 11.12 Cm / CL slopes for various elevator deflections at location of desired CG location. The aircraft isconsidered trimmed when dCm is equal to zero. (The red lines represent the minimum and maximum coefficients of
lift necessary to maintain an L/D of at least 22.5.)
With the desired CG location the glider requires elevator deflection range of approximately -5
to 3 degrees. In Figures 11.13 and 11.14, the results for trimmed flight at maximum forward and aft
CG locations can be seen.
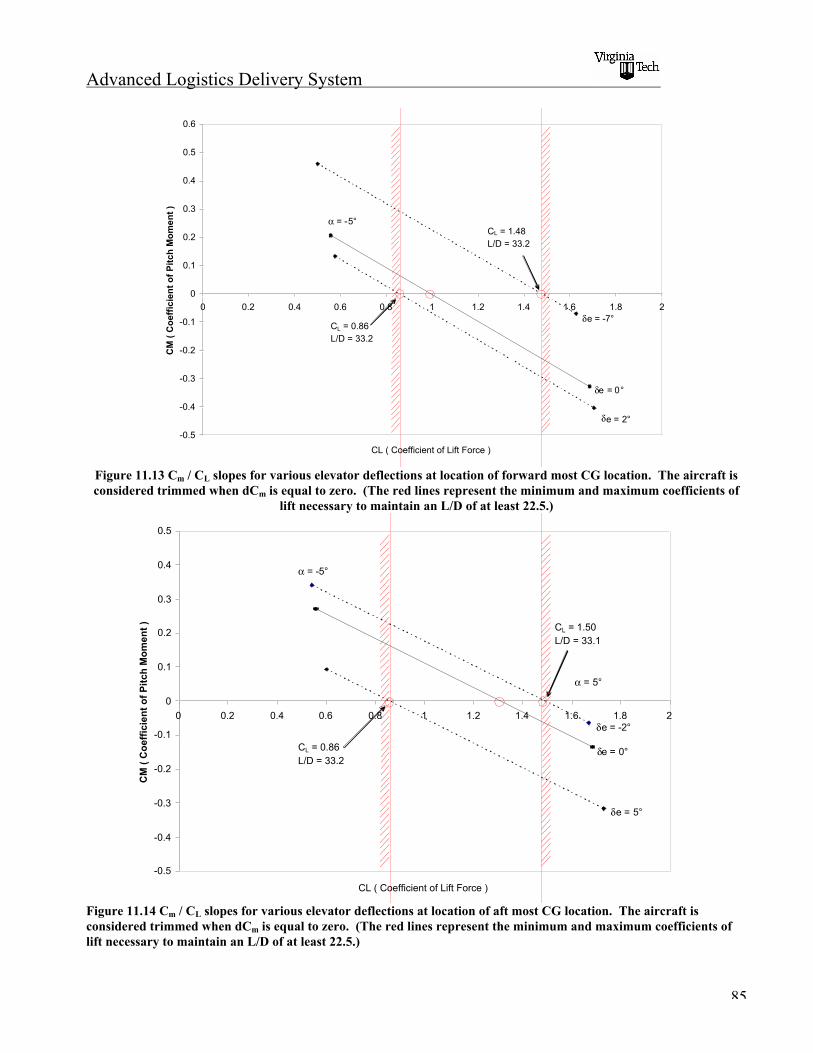
Advanced Logistics Delivery System
85
-0.5
-0.4
-0.3
-0.2
-0.1
0
0.1
0.2
0.3
0.4
0.5
0.6
0 0.2 0.4 0.6 0.8 1 1.2 1.4 1.6 1.8 2
CL ( Coefficient of Lift Force )
CM
( C
oef
fici
ent
of
Pit
ch M
om
ent
)
!e = 2°
!e = 0°
!e = -7°
CL = 1.48L/D = 33.2
CL = 0.86L/D = 33.2
" = -5°
Figure 11.13 Cm / CL slopes for various elevator deflections at location of forward most CG location. The aircraft isconsidered trimmed when dCm is equal to zero. (The red lines represent the minimum and maximum coefficients of
lift necessary to maintain an L/D of at least 22.5.)
-0.5
-0.4
-0.3
-0.2
-0.1
0
0.1
0.2
0.3
0.4
0.5
0 0.2 0.4 0.6 0.8 1 1.2 1.4 1.6 1.8 2
CL ( Coefficient of Lift Force )
CM
( C
oef
fici
ent
of
Pit
ch M
om
ent
)
! = -5°
! = 5°
"e = -2°
"e = 0°
"e = 5°
CL = 0.86L/D = 33.2
CL = 1.50L/D = 33.1
Figure 11.14 Cm / CL slopes for various elevator deflections at location of aft most CG location. The aircraft isconsidered trimmed when dCm is equal to zero. (The red lines represent the minimum and maximum coefficients oflift necessary to maintain an L/D of at least 22.5.)
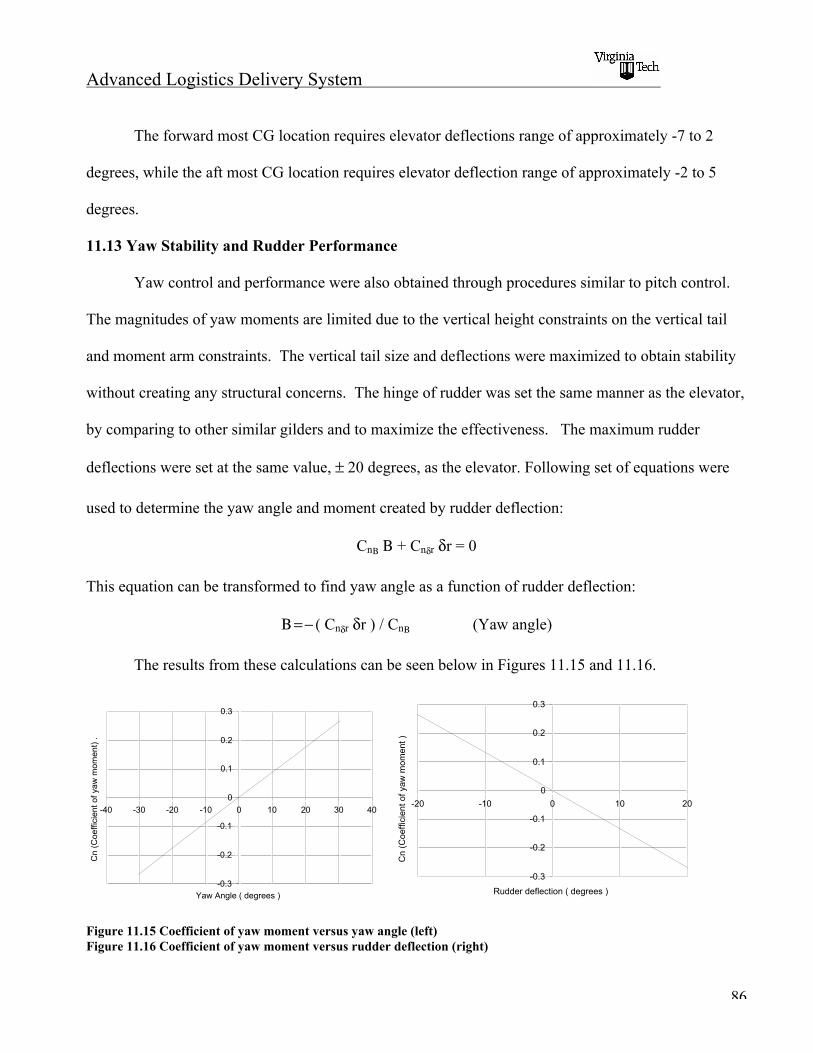
Advanced Logistics Delivery System
86
The forward most CG location requires elevator deflections range of approximately -7 to 2
degrees, while the aft most CG location requires elevator deflection range of approximately -2 to 5
degrees.
11.13 Yaw Stability and Rudder Performance
Yaw control and performance were also obtained through procedures similar to pitch control.
The magnitudes of yaw moments are limited due to the vertical height constraints on the vertical tail
and moment arm constraints. The vertical tail size and deflections were maximized to obtain stability
without creating any structural concerns. The hinge of rudder was set the same manner as the elevator,
by comparing to other similar gilders and to maximize the effectiveness. The maximum rudder
deflections were set at the same value, ± 20 degrees, as the elevator. Following set of equations were
used to determine the yaw angle and moment created by rudder deflection:
Cn& & + Cn'r 'r = 0
This equation can be transformed to find yaw angle as a function of rudder deflection:
& = ( ( Cn'r 'r ) / Cn& (Yaw angle)
The results from these calculations can be seen below in Figures 11.15 and 11.16.
-0.3
-0.2
-0.1
0
0.1
0.2
0.3
-40 -30 -20 -10 0 10 20 30 40
Yaw Angle ( degrees )
Cn
(Coe
ffici
ent o
f yaw
mom
ent)
.
-0.3
-0.2
-0.1
0
0.1
0.2
0.3
-20 -10 0 10 20
Rudder deflection ( degrees )
Cn
(Coe
ffici
ent o
f yaw
mom
ent )
.
Figure 11.15 Coefficient of yaw moment versus yaw angle (left)Figure 11.16 Coefficient of yaw moment versus rudder deflection (right)
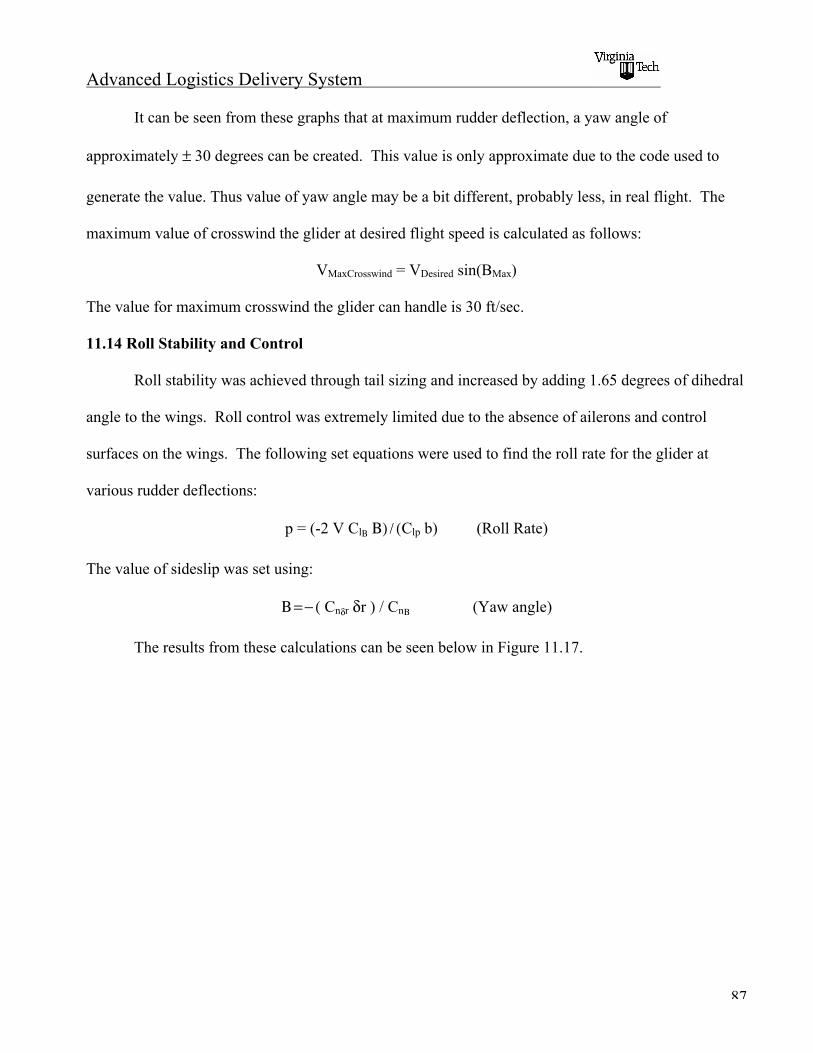
Advanced Logistics Delivery System
87
It can be seen from these graphs that at maximum rudder deflection, a yaw angle of
approximately ± 30 degrees can be created. This value is only approximate due to the code used to
generate the value. Thus value of yaw angle may be a bit different, probably less, in real flight. The
maximum value of crosswind the glider at desired flight speed is calculated as follows:
VMaxCrosswind = VDesired sin(BMax)
The value for maximum crosswind the glider can handle is 30 ft/sec.
11.14 Roll Stability and Control
Roll stability was achieved through tail sizing and increased by adding 1.65 degrees of dihedral
angle to the wings. Roll control was extremely limited due to the absence of ailerons and control
surfaces on the wings. The following set equations were used to find the roll rate for the glider at
various rudder deflections:
p = (-2 V Cl& &) / (Clp b) (Roll Rate)
The value of sideslip was set using:
& = ( ( Cn'r 'r ) / Cn& (Yaw angle)
The results from these calculations can be seen below in Figure 11.17.
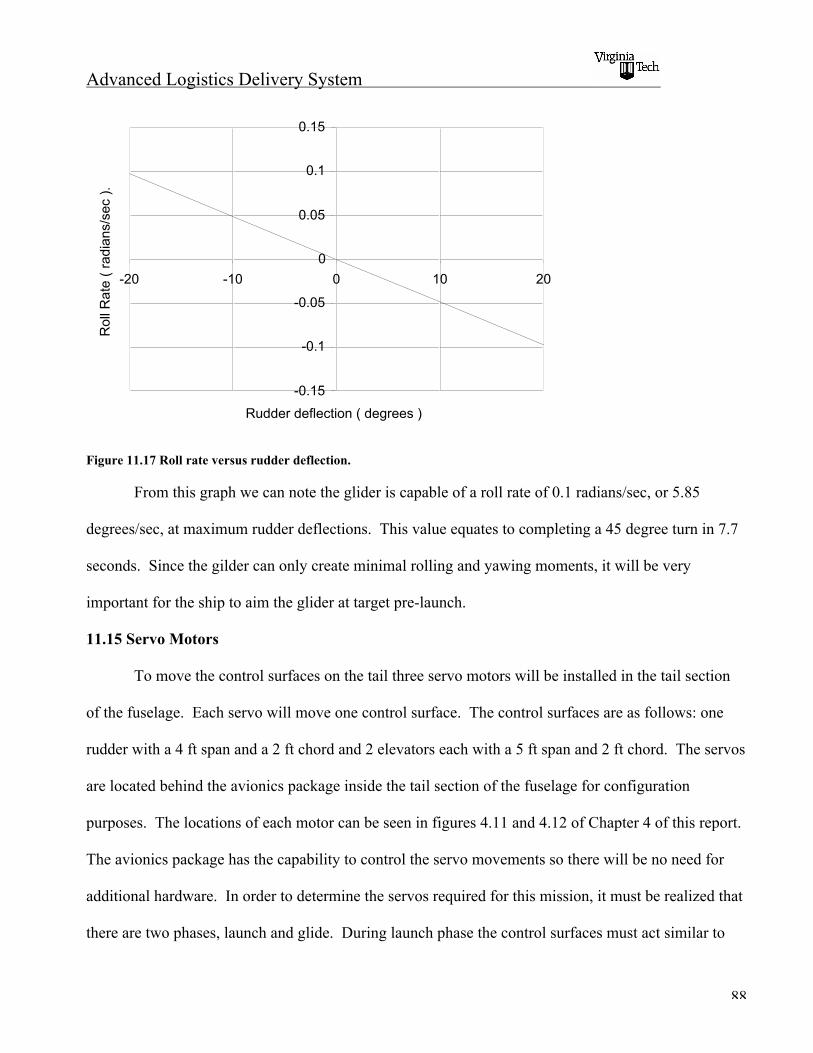
Advanced Logistics Delivery System
88
-0.15
-0.1
-0.05
0
0.05
0.1
0.15
-20 -10 0 10 20
Rudder deflection ( degrees )
Rol
l Rat
e (
radi
ans/
sec
).
Figure 11.17 Roll rate versus rudder deflection.
From this graph we can note the glider is capable of a roll rate of 0.1 radians/sec, or 5.85
degrees/sec, at maximum rudder deflections. This value equates to completing a 45 degree turn in 7.7
seconds. Since the gilder can only create minimal rolling and yawing moments, it will be very
important for the ship to aim the glider at target pre-launch.
11.15 Servo Motors
To move the control surfaces on the tail three servo motors will be installed in the tail section
of the fuselage. Each servo will move one control surface. The control surfaces are as follows: one
rudder with a 4 ft span and a 2 ft chord and 2 elevators each with a 5 ft span and 2 ft chord. The servos
are located behind the avionics package inside the tail section of the fuselage for configuration
purposes. The locations of each motor can be seen in figures 4.11 and 4.12 of Chapter 4 of this report.
The avionics package has the capability to control the servo movements so there will be no need for
additional hardware. In order to determine the servos required for this mission, it must be realized that
there are two phases, launch and glide. During launch phase the control surfaces must act similar to
Advanced Logistics Delivery System
89
control surfaces on a ballistic. During the glide phase the control surfaces must act as those on a
normal sailplane. The servo motors were designed with the glide phase in consideration. This is
because the glide phase will require more control surface movement to change flight paths mid flight.
The launch phase does require some consideration; however, their only criterion is that it maintains
stability up to the point of wing deployment. To compensate for the changing phases the software
accompanying the avionics package must have the ability to vary the gain factors in the avionics so
that the servos will be controlled in two different aspects depending on the phase of the flight.
To decide on a servo motor the required torque on each control surface is determined. This is
done by factoring in the control surface size, the glider velocity and the configuration of the servo to
the control surface. To expedite this process the design software Linkage Design Version 1.01
developed by Envision Designs was used (Blaine, 2005). This software allows the user to configure the
servo-control surface connection. These connections can be seen in Figure 11.18 in which the
maximum deflections of the control surface are shown in dashed lines.
Figure 11.18n Design Layout for Motor Control Surface Connection (drawing is not to scale)
The Linkage Design program also takes in the control surface properties and the speed at which the
glider is traveling. Two speeds were analyzed. The first speed analyzed was the glider cruise speed of
approximately 70 mph. The second speed analyzed was the launch speed estimated at

Advanced Logistics Delivery System
90
500 mph. The results for the estimated torque values for each servo at the glide speed are summarized
in Figure 11.19. The results for the launch phase are summarized in Figure 11.20.
Figure 11.19 Approximate Torque Req. Figure 11.20 Approximate Torque Req.
For the glide phase the servos must be capable of handling about 1500 oz-in of torque. It is important
to note that in Figure 11.19 there is a non-linear relationship between the torque required and the
deflection angles. This is explained through the design configuration shown in Figure 11.18. Each
connection point in Figure 11.18 is connected by a pin, except for the connection at the control surface.
This means that as the motor rotates, there will be a point where the motor will not need to apply as
much torque since the angles it must rotate through will be shortened. Figure 11.19 shows how the
torque requirements for the launch phase for the same size control surfaces. As expected with the large
speed difference, a much larger torque is required. This means that the tail will not be able to deflect
as much during the glide phase. Since the larger control surfaces are designed for the glide phase the
launch phase performance there are two options to solve this problem. The first solution is two use the
tail control surfaces to maintain stability. The second solution is to use smaller control surfaces
attached behind the stub wings. Keeping both solutions in mind a suitable servo motor was chosen.
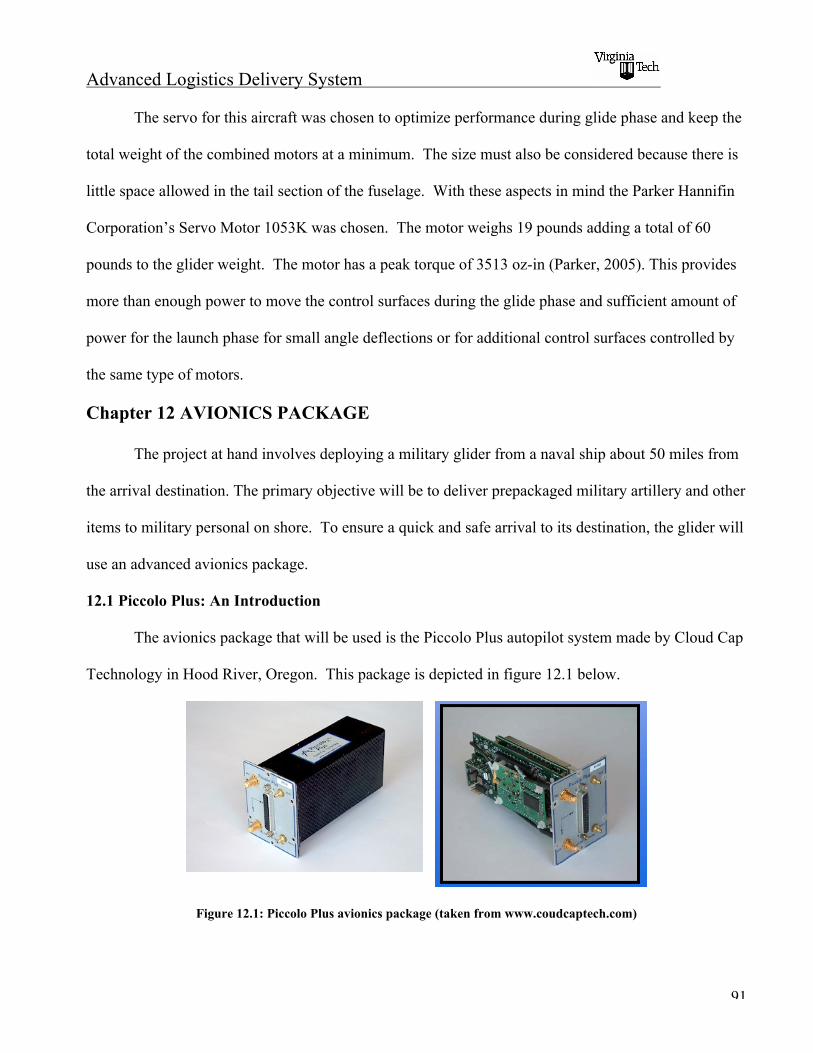
Advanced Logistics Delivery System
91
The servo for this aircraft was chosen to optimize performance during glide phase and keep the
total weight of the combined motors at a minimum. The size must also be considered because there is
little space allowed in the tail section of the fuselage. With these aspects in mind the Parker Hannifin
Corporation’s Servo Motor 1053K was chosen. The motor weighs 19 pounds adding a total of 60
pounds to the glider weight. The motor has a peak torque of 3513 oz-in (Parker, 2005). This provides
more than enough power to move the control surfaces during the glide phase and sufficient amount of
power for the launch phase for small angle deflections or for additional control surfaces controlled by
the same type of motors.
Chapter 12 AVIONICS PACKAGE
The project at hand involves deploying a military glider from a naval ship about 50 miles from
the arrival destination. The primary objective will be to deliver prepackaged military artillery and other
items to military personal on shore. To ensure a quick and safe arrival to its destination, the glider will
use an advanced avionics package.
12.1 Piccolo Plus: An Introduction
The avionics package that will be used is the Piccolo Plus autopilot system made by Cloud Cap
Technology in Hood River, Oregon. This package is depicted in figure 12.1 below.
Figure 12.1: Piccolo Plus avionics package (taken from www.coudcaptech.com)
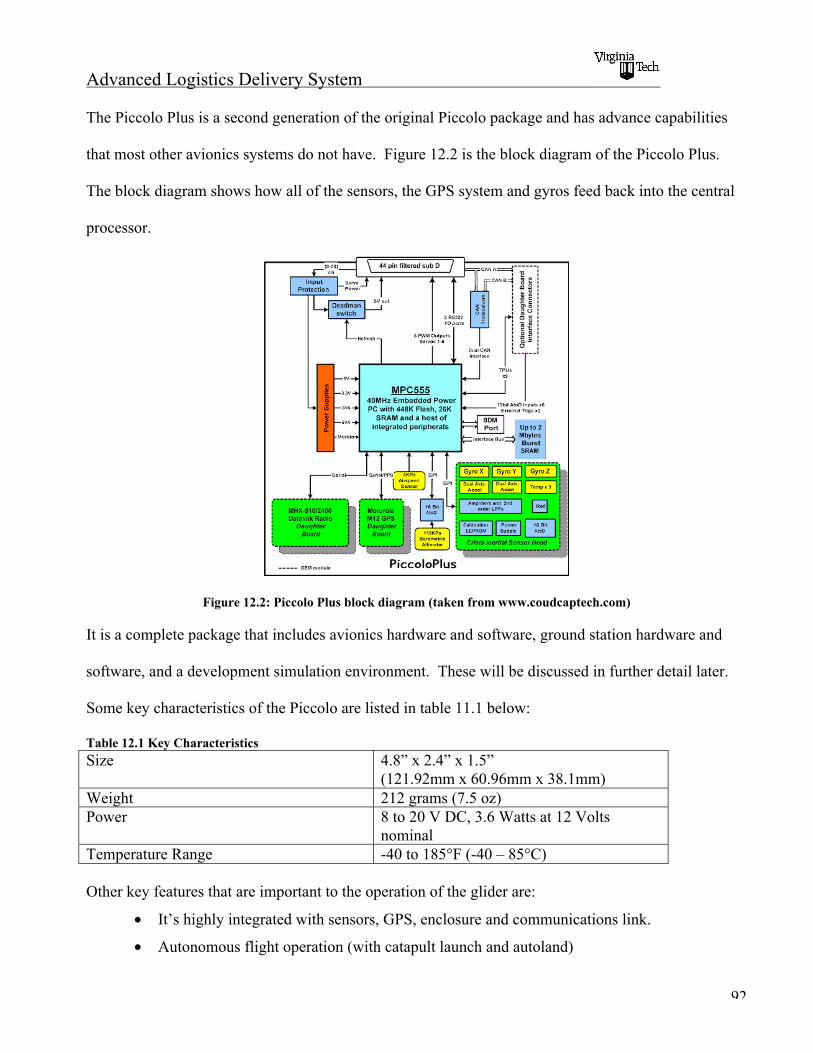
Advanced Logistics Delivery System
92
The Piccolo Plus is a second generation of the original Piccolo package and has advance capabilities
that most other avionics systems do not have. Figure 12.2 is the block diagram of the Piccolo Plus.
The block diagram shows how all of the sensors, the GPS system and gyros feed back into the central
processor.
Figure 12.2: Piccolo Plus block diagram (taken from www.coudcaptech.com)
It is a complete package that includes avionics hardware and software, ground station hardware and
software, and a development simulation environment. These will be discussed in further detail later.
Some key characteristics of the Piccolo are listed in table 11.1 below:
Table 12.1 Key CharacteristicsSize 4.8” x 2.4” x 1.5”
(121.92mm x 60.96mm x 38.1mm)Weight 212 grams (7.5 oz)Power 8 to 20 V DC, 3.6 Watts at 12 Volts
nominalTemperature Range -40 to 185°F (-40 – 85°C)
Other key features that are important to the operation of the glider are:
• It’s highly integrated with sensors, GPS, enclosure and communications link.
• Autonomous flight operation (with catapult launch and autoland)

Advanced Logistics Delivery System
93
• End-user programmability
• It supports up to 10 aircraft with a single operator interface and Ground station (especially
important because of reduced costs)
• Integration with FalconView – an advanced mapping and flight planning system based on
military planning
12.2 Components of the Piccolo Plus
The Piccolo Plus is compromised of several different components each with its own function
within the system. Here are several components that make up the Piccolo:
1. CPU – First there is the brain of the system, the Central Processing Unit, a MPC555
microcontroller. Based on the PowerPC architecture, this unit joins a wide range of interfaces
with a powerful RISC engine that delivers 40 MHz PowerPC operations.
2. Sensors- Inertial sensors and air data sensors are the two primary sensors offered in this
package. The inertial sensors are composed of 3 Tokin CG-16D rate gyros and 3 ADXL202
accelerometers which when combined, allows the Piccolo to operate a variety of aircraft and
installation in any attitude. The air data sensors are compromised of a dual ported mpxv50045
4kPa dynamic pressure sensor, an absolute ported barometric pressure sensor and an air
temperature sensor. These give the Piccolo the ability to measure true air speed and altitude.
3. Navigation-The navigation system used in the Piccolo follows circled paths as defined by
waypoints stored in a typical flight plan. The flight plan can also be changed during flight if
necessary. To obtain position and ground speed for each flight plan, the Piccolo uses a GPS
the Piccolo uses a Motorola M12 GPS. It is capable of making corrections via the data link.
To measure winds the Piccolo fits the true airspeed with the groundspeed.

Advanced Logistics Delivery System
94
4. Datalink- The datalik is used primarily for command and control, autopilot telemetry
differential GPS corrections, and pilot in the loop modes. This datalink also allows multiple
aircraft to be controlled from one ground station.
12.3 Ground station
As previously stated the Piccolo Plus ground station gives the operator the ability to control the
aircraft from a base on the ground. It has the ability to control up to 10 aircraft at once and also
manage the communication link to each of the avionics systems in the aircraft. It uses the same
hardware used for the avionics package, and provides an interface to the pilot in the loop console, a
source that oversees the operation of the ailerons, elevator, rudder, autopilot, flaps, brakes and other
components not applicable to our aircraft. It also provides a command and control stream to the
operator interface PC. Powered will be supplied by a supply unit included with the package. There is
also a battery backup available incase of a power failure.
12.4 Components of Avionics System (Some Operator Interfaces):
Piccolo Autopilot
The autopilot will be used to direct the glider to its destination. The autopilot commands page
will display the status of the commands and allows for updating commands. With various inputs and
parameters entered into the commands page, the glider will be capable of flying unmanned. Figure
12.3 is an example of the autopilot command page.
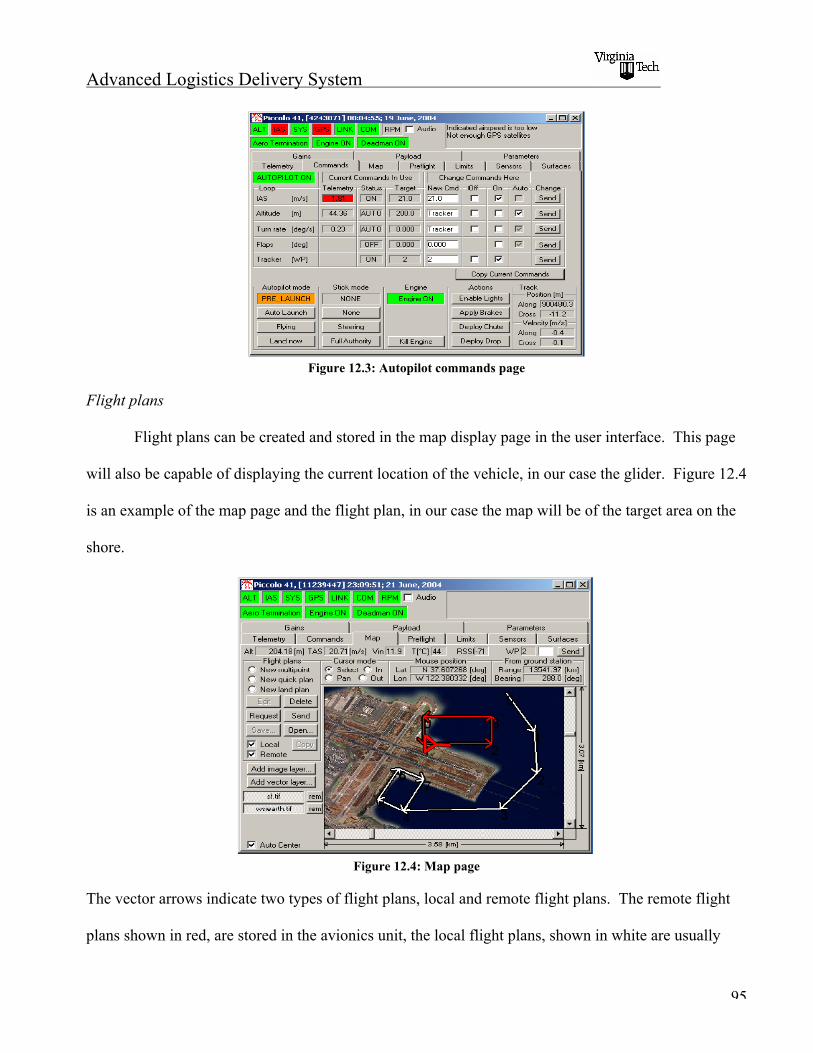
Advanced Logistics Delivery System
95
Figure 12.3: Autopilot commands page
Flight plans
Flight plans can be created and stored in the map display page in the user interface. This page
will also be capable of displaying the current location of the vehicle, in our case the glider. Figure 12.4
is an example of the map page and the flight plan, in our case the map will be of the target area on the
shore.
Figure 12.4: Map page
The vector arrows indicate two types of flight plans, local and remote flight plans. The remote flight
plans shown in red, are stored in the avionics unit, the local flight plans, shown in white are usually
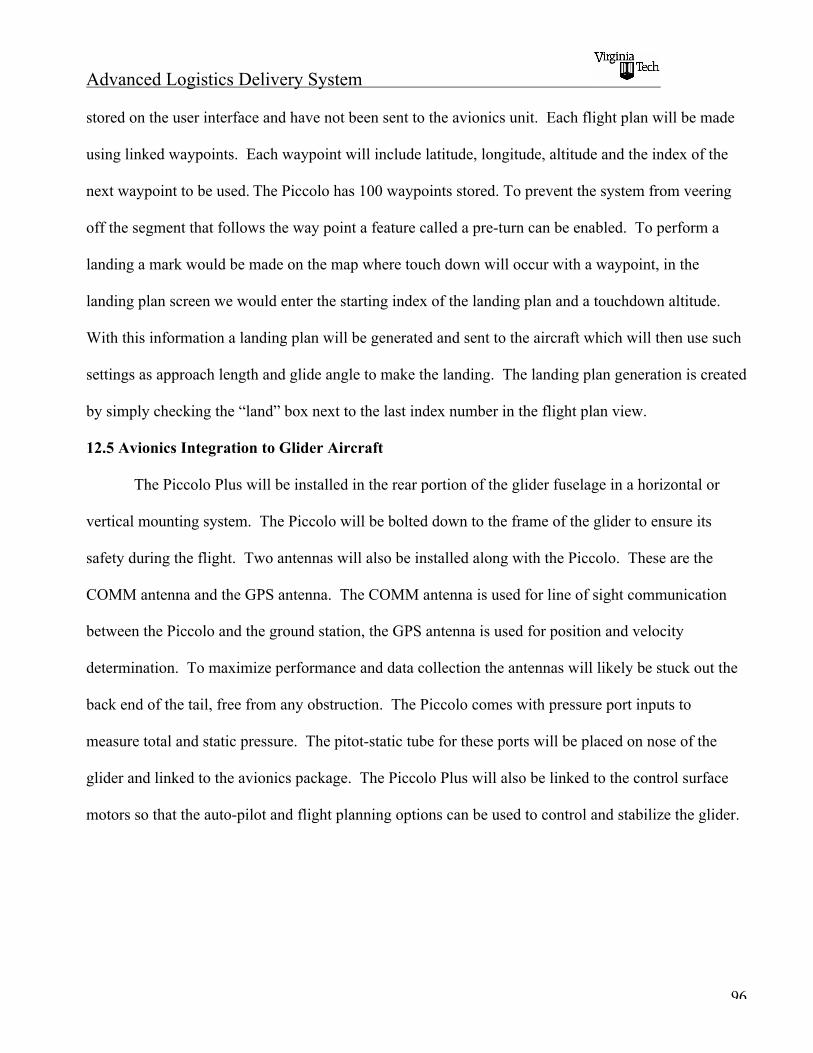
Advanced Logistics Delivery System
96
stored on the user interface and have not been sent to the avionics unit. Each flight plan will be made
using linked waypoints. Each waypoint will include latitude, longitude, altitude and the index of the
next waypoint to be used. The Piccolo has 100 waypoints stored. To prevent the system from veering
off the segment that follows the way point a feature called a pre-turn can be enabled. To perform a
landing a mark would be made on the map where touch down will occur with a waypoint, in the
landing plan screen we would enter the starting index of the landing plan and a touchdown altitude.
With this information a landing plan will be generated and sent to the aircraft which will then use such
settings as approach length and glide angle to make the landing. The landing plan generation is created
by simply checking the “land” box next to the last index number in the flight plan view.
12.5 Avionics Integration to Glider Aircraft
The Piccolo Plus will be installed in the rear portion of the glider fuselage in a horizontal or
vertical mounting system. The Piccolo will be bolted down to the frame of the glider to ensure its
safety during the flight. Two antennas will also be installed along with the Piccolo. These are the
COMM antenna and the GPS antenna. The COMM antenna is used for line of sight communication
between the Piccolo and the ground station, the GPS antenna is used for position and velocity
determination. To maximize performance and data collection the antennas will likely be stuck out the
back end of the tail, free from any obstruction. The Piccolo comes with pressure port inputs to
measure total and static pressure. The pitot-static tube for these ports will be placed on nose of the
glider and linked to the avionics package. The Piccolo Plus will also be linked to the control surface
motors so that the auto-pilot and flight planning options can be used to control and stabilize the glider.
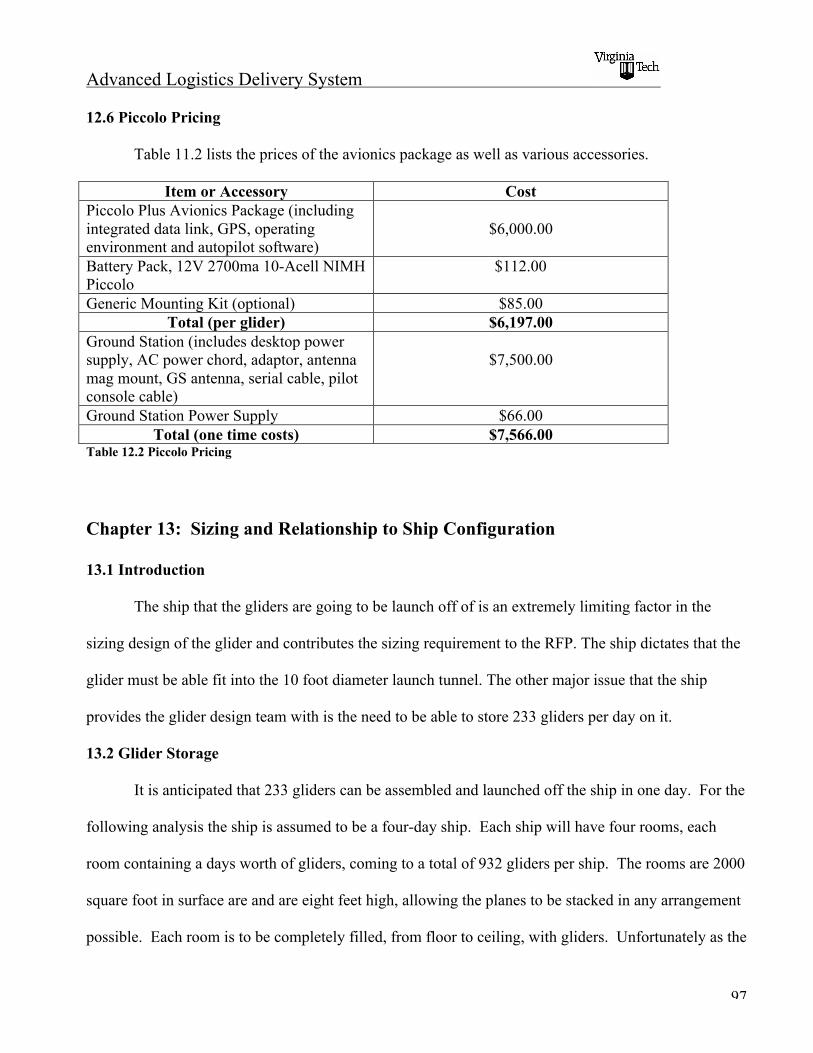
Advanced Logistics Delivery System
97
12.6 Piccolo Pricing
Table 11.2 lists the prices of the avionics package as well as various accessories.
Item or Accessory CostPiccolo Plus Avionics Package (includingintegrated data link, GPS, operatingenvironment and autopilot software)
$6,000.00
Battery Pack, 12V 2700ma 10-Acell NIMHPiccolo
$112.00
Generic Mounting Kit (optional) $85.00Total (per glider) $6,197.00
Ground Station (includes desktop powersupply, AC power chord, adaptor, antennamag mount, GS antenna, serial cable, pilotconsole cable)
$7,500.00
Ground Station Power Supply $66.00Total (one time costs) $7,566.00
Table 12.2 Piccolo Pricing
Chapter 13: Sizing and Relationship to Ship Configuration
13.1 Introduction
The ship that the gliders are going to be launch off of is an extremely limiting factor in the
sizing design of the glider and contributes the sizing requirement to the RFP. The ship dictates that the
glider must be able fit into the 10 foot diameter launch tunnel. The other major issue that the ship
provides the glider design team with is the need to be able to store 233 gliders per day on it.
13.2 Glider Storage
It is anticipated that 233 gliders can be assembled and launched off the ship in one day. For the
following analysis the ship is assumed to be a four-day ship. Each ship will have four rooms, each
room containing a days worth of gliders, coming to a total of 932 gliders per ship. The rooms are 2000
square foot in surface are and are eight feet high, allowing the planes to be stacked in any arrangement
possible. Each room is to be completely filled, from floor to ceiling, with gliders. Unfortunately as the
Advanced Logistics Delivery System
98
following numbers will show it is impossible to fit 233 gliders into such a small room. Just by sheer
volume (ignoring the fact that the gliders can only stack certain ways without interference), a total of
203 gliders can be stored in the given space. Due to the way the parts have been assembled and how
they can physically stack within the required space, only 130 gliders will fit per room.
13.2.1 Volume Calculations
The total volume of an individual plane was determined by calculating the volume of different
pieces of the plane and adding them all together. The glider was divided into four sections. The first
section was the nosecone. The volume of the nosecone was found using inventor. Each of these
pieces will occupy 16,190 cubic inches. The second section was the cylindrical fuselage, with radius
of 30.125 inches and a length of 96 inches. The volume was determined using the equation for the
volume of a cylinder, which is pi*r2*L where r is the radius and L is the length. Each fuselage will
require 68,430 cubic inches of space. The third section was a combination of two identical pieces, the
stub wings. The combined volume of the two wings came out to be 4,928 cubic inches. The fourth
and final part of the plane to be included in the volume calculations was the tail. The tail was divided
into two sub-parts; the main fuselage portion of the tail, and the vertical piece. The volume of the
vertical piece was 522 cubic inches, taken off of inventor. The volume of the fuselage portion of the
tail was estimated by taking two thirds of the volume of the cylindrical fuselage, which was
approximately 45,620 cubic inches. All of the sections were added up and the total volume of a single
glider is estimated to be 135,691 cubic inches. This total volume yields the result that 203 gliders can
be fit in each room based on sheer volume alone.
13.2.2 Glider Arrangement
The configuration that allows the most planes to be stacked in the room divides the room into
three main sections. All the nosecones will be stacked in two rows against one side of the room. Six
Advanced Logistics Delivery System
99
of these pieces can be stacked on top of each other before they reach the maximum height. In one row,
there are 17 stacks, and in the second row there are 5 stacks. The fuselage is the second part of the
configuration. Each fuselage has the stub wings already attached. There are four layers of this part of
the plane. The first layer sits on the floor, with the gliders touching end to end. Five planes will fit in
this fashion to form the first row. The planes also line up wing to wing forming a grid. The wings will
overlap so the gap between it and the neighboring fuselage is 32 inches. This will allow for another
fuselage to be stacked on top of the wings, in between each of the two lower ones. When this is done,
there is room for seven planes to sit side by side in the bottom layer. The whole bottom layer will
contain 35 fuselages with stub wings attached. The second layer will sit on top of the first. Each
fuselage of the gliders in this layer will rest on top of the wings from the row below. Instead of seven
rows of planes, there will only be six. This means that the second layer will consist of 30 planes. The
first and the third layers will have the same number, and the second and the fourth layers will have the
same, totaling to 130 gliders. The third section of the room consists of all the remaining empty space.
The tail section of the glider will be stored in this space. This configuration assumes that the gliders
can be stored on top of one another without sustaining any damage.
13.3 Glider Storage Conclusions
The 2,000 square foot storage room cannot hold all of the 233 gliders. The room dedicated to
storing the gliders consists of 27,648,000 cubic inches. By volume only, the room can hold 203
gliders. That is 30 short of the estimated amount per room. However, this figure does not take into
account the way the gliders are placed in the room. Each plane must stack on top of another plane in a
specific way. Several configurations were considered, but the final design for placing the planes in the
room (described above) allows for a maximum of 130 gliders. 64% of the volume in the room will be
taken up by the plane in its current configuration.
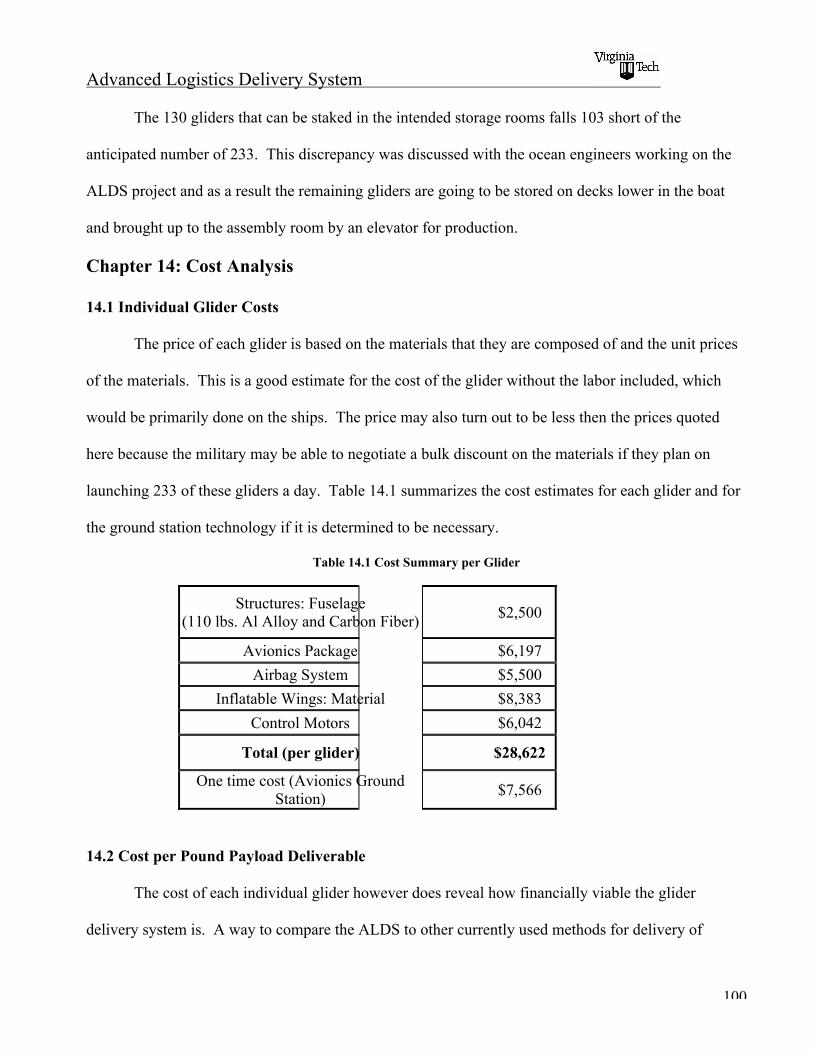
Advanced Logistics Delivery System
100
The 130 gliders that can be staked in the intended storage rooms falls 103 short of the
anticipated number of 233. This discrepancy was discussed with the ocean engineers working on the
ALDS project and as a result the remaining gliders are going to be stored on decks lower in the boat
and brought up to the assembly room by an elevator for production.
Chapter 14: Cost Analysis
14.1 Individual Glider Costs
The price of each glider is based on the materials that they are composed of and the unit prices
of the materials. This is a good estimate for the cost of the glider without the labor included, which
would be primarily done on the ships. The price may also turn out to be less then the prices quoted
here because the military may be able to negotiate a bulk discount on the materials if they plan on
launching 233 of these gliders a day. Table 14.1 summarizes the cost estimates for each glider and for
the ground station technology if it is determined to be necessary.
Table 14.1 Cost Summary per Glider
Structures: Fuselage(110 lbs. Al Alloy and Carbon Fiber) $2,500
Avionics Package $6,197
Airbag System $5,500
Inflatable Wings: Material $8,383
Control Motors $6,042
Total (per glider) $28,622
One time cost (Avionics GroundStation) $7,566
14.2 Cost per Pound Payload Deliverable
The cost of each individual glider however does reveal how financially viable the glider
delivery system is. A way to compare the ALDS to other currently used methods for delivery of
Advanced Logistics Delivery System
101
supplies to troops in hostile territories is by calculating how much each method cost to deliver a pound
of payload to troops. The cost per pound deliverable calculation takes into account all costs that go
into delivering supplies including operational cost and the costs of the ships that the gliders launch
from. The cost per pound payload deliverable for the glider will be compared to the cost per pound
payload deliverable for the C-130 Hercules and the Chinook Heavy-Lift Helicopter two current aircraft
used to deliver supplies to troops. The equation used to calculate the cost per pound payload
deliverable for the glider is:
�
Costlb
=GliderCost+ ShipCost / years
#Launches /Ship / year+ OperationalCosts#Launches /Ship / year
1000lbs.
In the above equation the GliderCost is the cost for each glider that was calculated in the previous
section, the ShipCost is $110.03 million (from the Ocean Design Group), the number of years that the
ship is expected to be in operation for is 20 years. The operational cost for the ship is $59.98 million
per year (from the Ocean Design Group) and since the ship is assumed to be a four day mission ship
that goes out 5 times a year and make 233 launches a day the #Launches/Ship/year is 4660. When all
of those values are plugged in the equation becomes:
�
Costlb
= 28.62 +1.18 +12.87 = $42.67
Therefore it cost $42.67 for each pound of payload delivered to the troops.
The C-130 Hercules is the lowest priced aircraft designed to deliver large amounts of payload
that is currently on the market. The unit cost for a C-130 Hercules is $44.1 million. Operational costs
for the C-130 Hercules in 2002 for the 148 active C-130 Hercules planes in the airforce was $1,198.9
million. The Hercules can carry a maximum payload of 42000 lbs. per trip and can make around 33
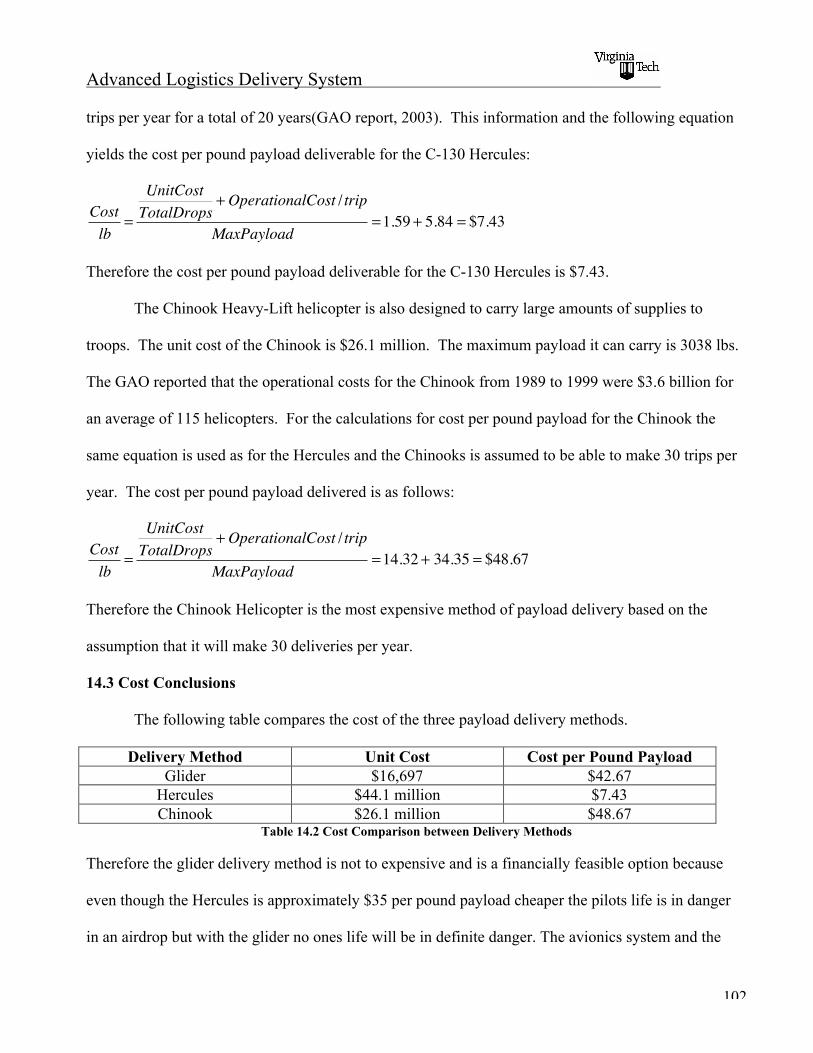
Advanced Logistics Delivery System
102
trips per year for a total of 20 years(GAO report, 2003). This information and the following equation
yields the cost per pound payload deliverable for the C-130 Hercules:
�
Costlb
=
UnitCostTotalDrops
+ OperationalCost / trip
MaxPayload=1.59 + 5.84 = $7.43
Therefore the cost per pound payload deliverable for the C-130 Hercules is $7.43.
The Chinook Heavy-Lift helicopter is also designed to carry large amounts of supplies to
troops. The unit cost of the Chinook is $26.1 million. The maximum payload it can carry is 3038 lbs.
The GAO reported that the operational costs for the Chinook from 1989 to 1999 were $3.6 billion for
an average of 115 helicopters. For the calculations for cost per pound payload for the Chinook the
same equation is used as for the Hercules and the Chinooks is assumed to be able to make 30 trips per
year. The cost per pound payload delivered is as follows:
�
Costlb
=
UnitCostTotalDrops
+ OperationalCost / trip
MaxPayload=14.32 + 34.35 = $48.67
Therefore the Chinook Helicopter is the most expensive method of payload delivery based on the
assumption that it will make 30 deliveries per year.
14.3 Cost Conclusions
The following table compares the cost of the three payload delivery methods.
Delivery Method Unit Cost Cost per Pound PayloadGlider $16,697 $42.67
Hercules $44.1 million $7.43Chinook $26.1 million $48.67
Table 14.2 Cost Comparison between Delivery Methods
Therefore the glider delivery method is not to expensive and is a financially feasible option because
even though the Hercules is approximately $35 per pound payload cheaper the pilots life is in danger
in an airdrop but with the glider no ones life will be in definite danger. The avionics system and the
Advanced Logistics Delivery System
103
motors in the glider are also reusable and could be used either in another glider if recovered or by the
ground troops, which would make the gliders even more cost effective. All of these calculations were
done using assumptions on the usage of each method, the more often any of these methods are used the
more the price per pound payload will decrease.
Chapter 15 Conclusions and Future Work
In this report a glider design was presented that will be capable of sustaining extreme launch
forces and gliding for 50 miles to deliver supplies to troops in hostile territories. The glider design
currently satisfies all of the RFP criteria. It will be capable of obtaining a range of 50 miles, it can
structurally withstand the launch acceleration of 30g’s and launch speed of 500 knots, it is within the
launch size specifications, it has room for the 1000 lb payload and the structural integrity to hold it, the
ability to cruise at 60 knots and although it does weight above 500 lbs it is not so much heavier that it
will be a problem. The $28,622 per glider price tag is a slightly higher cost than would be required
for the glider to be disposable a more realistic number would be approximately $15,000 per glider but
with future analysis we are confident that number can be reduced.

Advanced Logistics Delivery System
104
References:
1.) Beer, Ferdinand P. Mechanics of Materials. Third Edition, McGraw-Hill. New York, NY. ©2001.
2.) Bertin, John J. Aerodynamics for Engineers. 4th Edition. New Jersey: Prentice Hall. © 2002.
3.) Blaine K. Beron-Rawdon. Linkage Design. Version 1.01. Envision Design, 1536 W. St. PMD104, San Pedro CA. Accessed 2005. Available at:members.cox.net/evdesign/pages/about_envision_design.html
4.) Carbon Fiber Reinforced Carbon. http://www.sglcarbon.com. © 2004.
5.) Casidy, Rachel and Regina Frey. “Gas Laws Save Lives: The Chemistry Behind Airbags.”Accessed 2005. Avail. www.chemistry.wustl.edu/~edudev/LabTutorials/Airbags/airbags.html
6.) Celanese. “Vectran Fiber a Unique Combination of Properties for The Most DemandingApplications” Accessed 2005. Avail. http://www.vectranfiber.com/index1.html
7.) Cloud Cap Technology Website. Accessed 2005. www.cloudcaptech.com.8.) Crimi, Peter. “Divergence of an Inflated Wing,” Journal of Aircraft, vol. 37, no. 1, January-
February 2000, pp. 184-186.
9.) Drela, Mark. XFOIL Subsonic Development System. Version 6.9. Massachusetts Institute ofTechnology. Accessed 2005. http://raphael.mit.edu/xfoil/
10.) Drela, Mark. XFOIL 6.9 User’s Guide. Massachusetts Institute of Technology. Accessed 2005.http://raphael.mit.edu/xfoil/xfoil_doc.txt
11.) E-A-R Specialty Composites. Accessed 2005. http://www.earsc.com. © 2002.
12.) Edge Structural Composites. “Fiberbond Technical Data” Accessed 2005. avail.http://www.edgest.com/edgedatacarb335.html
13.) Edwards. “Tech Space – Inflatable Wings Given A Flutter.” July 9, 2001 avail.http://www.spacer.com/news/plane-inflatable-wing-01a.html
14.) Government Accountability Office Report. Information on the Air force’s C-130 Aircraft.Accessed 2005. Avail: http://www.gao.gov/archive/1998/ns98108.pdf
15.) Government Accountability Office Report. Helicopters Cost is Understated. Accessed 2005.Avail: http://161.203.16.4/t2pbat4/150587.pdf
16.) Goodyear Aircraft. ”Engineering Report on the Development of a One-Place Inflatoplane,” April1957. Report Number GER 8146.
Advanced Logistics Delivery System
105
17.) Hoerner, S.F. “Fluid Dynamic Drag”, Published by the author, Vancouver, WA. ©1958.
18.) Hong, Soongu. “A Study on the Modeling Technique of Airbag Cushion Fabric” Accessed 2005.avail.http://www.automotive.tno.nl/Madymo/Publications/UMWorld2002/P07_Airbag_cushion_MOBIS.pdf#search='young%20s%20modulus%20for%20airbag
19.) MandevTubes. “Formulas and Specifications” Accessed 2005. avail.http://www.mandevtubes.com/specs2.html
20.) Marchman, James F. Introductory Aircraft Performance. 2nd Edition. Blacksburg, Virginia: A-1Copies. © 2001
21.) Mars Pathfinder Web Page. Accessed 2005. Avail.http://mpfwww.jpl.nasa.gov/MPF/mpf/mpfairbags.html
22.) Mason, W. H. Simple Lifting Line Theory. Aerospace Engineering Dept. Virginia PolytechnicInstitute and State University. Accessed 2005.http://www.aoe.vt.edu/~mason/Mason_f/MRsoft.html
23.) Mason, W. H. Skin Friction/ Form Factor. Aerospace Engineering Dept. Virginia PolytechnicInstitute and State University. Accessed 2005.http://www.aoe.vt.edu/~mason/Mason_f/MRsoft.html
24.) Megson, T.H.G. Aircraft Structures for Engineering Students Second Edition, Halsted Press,New York, NY, © 1990.
25.) Murray, James E., “Ground and Flight Evaluation of a Small-Scale Inflatable-Winged Aircraft,”Nasa Dryden Flight Research Center, January 2002.
26.) Nihon University Student Group. Airfoil Database. Accessed 2005. http://www.nasg.com/index-e.html
27.) Parker Hannifin Corporation Servo Motor Online Catalog Accessed 2005. avail.http://www.parker.com/compumotor/cat/english/M_Series.pdf
28.) Raymer, Daniel P. “Aircraft Design: A conceptual Approach, Third Addition”. AIAA EducationSeries. New York, NY. © 1999.
29.) Schetz, Joseph A. Boundary Layer Analysis. New Jersey: Prentice Hall. © 1993.
30.) Tsai, Stephen W. Theory of Composites Design, Think Composites, Dayton, OH, ©1992
31.) University of Kentucky, College of Engineering. “Big Blue 3” Accessed 2005. Avail.http://www.engr.uky.edu/~bigblue/
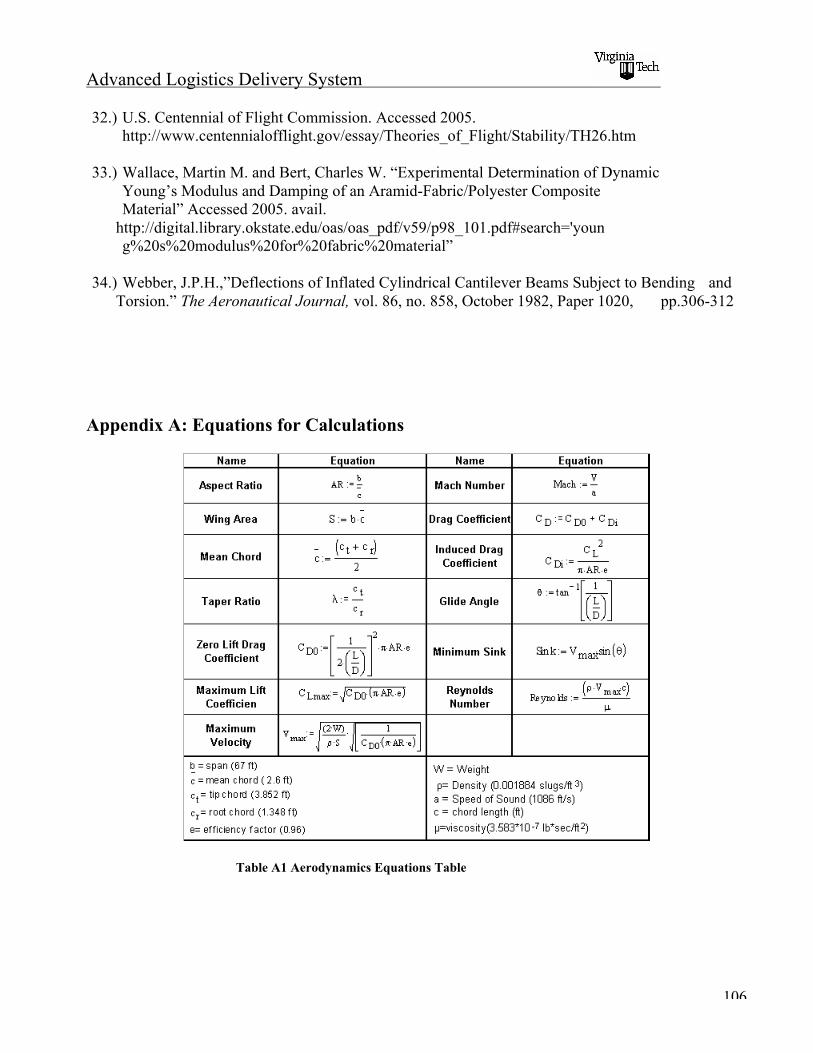
Advanced Logistics Delivery System
106
32.) U.S. Centennial of Flight Commission. Accessed 2005. http://www.centennialofflight.gov/essay/Theories_of_Flight/Stability/TH26.htm
33.) Wallace, Martin M. and Bert, Charles W. “Experimental Determination of Dynamic Young’s Modulus and Damping of an Aramid-Fabric/Polyester Composite Material” Accessed 2005. avail.
http://digital.library.okstate.edu/oas/oas_pdf/v59/p98_101.pdf#search='young%20s%20modulus%20for%20fabric%20material”
34.) Webber, J.P.H.,”Deflections of Inflated Cylindrical Cantilever Beams Subject to Bending andTorsion.” The Aeronautical Journal, vol. 86, no. 858, October 1982, Paper 1020, pp.306-312
Appendix A: Equations for Calculations
Table A1 Aerodynamics Equations Table
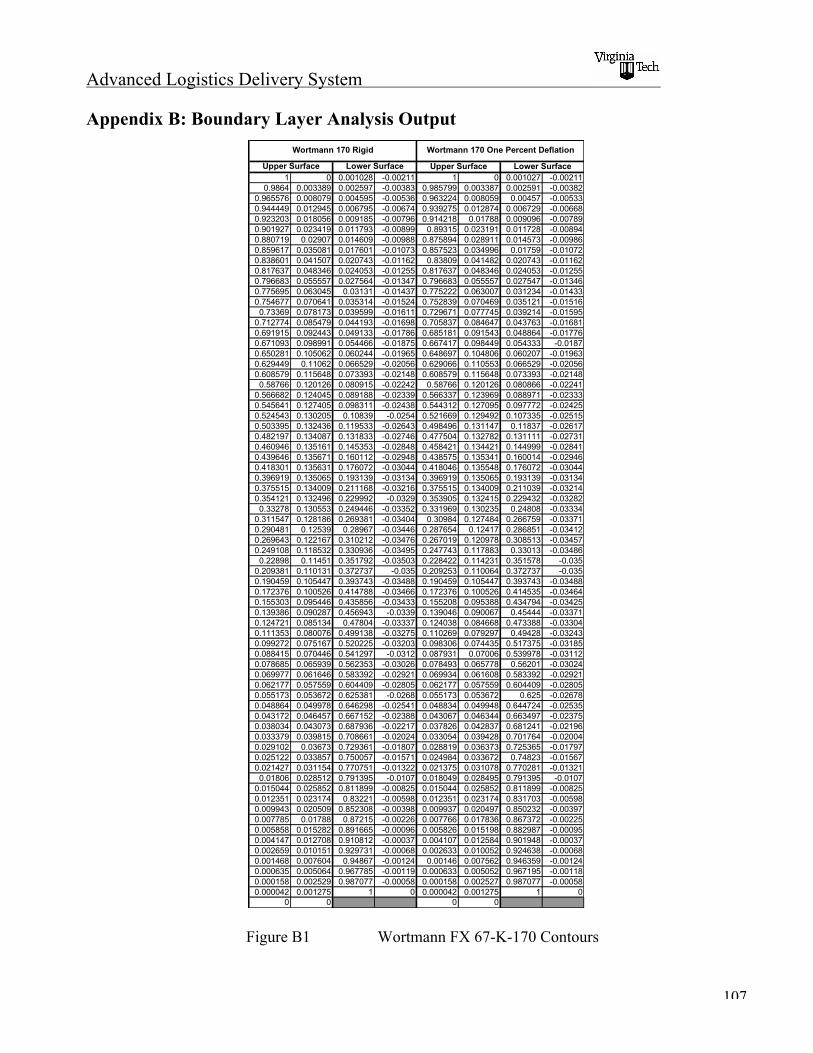
Advanced Logistics Delivery System
107
Appendix B: Boundary Layer Analysis Output
1 0 0.001028 -0.00211 1 0 0.001027 -0.002110.9864 0.003389 0.002597 -0.00383 0.985799 0.003387 0.002591 -0.00382
0.965576 0.008079 0.004595 -0.00536 0.963224 0.008059 0.00457 -0.005330.944449 0.012945 0.006795 -0.00674 0.939275 0.012874 0.006729 -0.006680.923203 0.018056 0.009185 -0.00796 0.914218 0.01788 0.009096 -0.007890.901927 0.023419 0.011793 -0.00899 0.89315 0.023191 0.011728 -0.008940.880719 0.02907 0.014609 -0.00988 0.875894 0.028911 0.014573 -0.009860.859617 0.035081 0.017601 -0.01073 0.857523 0.034996 0.01759 -0.010720.838601 0.041507 0.020743 -0.01162 0.83809 0.041482 0.020743 -0.011620.817637 0.048346 0.024053 -0.01255 0.817637 0.048346 0.024053 -0.012550.796683 0.055557 0.027564 -0.01347 0.796683 0.055557 0.027547 -0.013460.775695 0.063045 0.03131 -0.01437 0.775222 0.063007 0.031234 -0.014330.754677 0.070641 0.035314 -0.01524 0.752839 0.070469 0.035121 -0.015160.73369 0.078173 0.039599 -0.01611 0.729671 0.077745 0.039214 -0.015950.712774 0.085479 0.044193 -0.01698 0.705837 0.084647 0.043763 -0.016810.691915 0.092443 0.049133 -0.01786 0.685181 0.091543 0.048864 -0.017760.671093 0.098991 0.054466 -0.01875 0.667417 0.098449 0.054333 -0.01870.650281 0.105062 0.060244 -0.01965 0.648697 0.104806 0.060207 -0.019630.629449 0.11062 0.066529 -0.02056 0.629066 0.110553 0.066529 -0.020560.608579 0.115648 0.073393 -0.02148 0.608579 0.115648 0.073393 -0.021480.58766 0.120126 0.080915 -0.02242 0.58766 0.120126 0.080866 -0.022410.566682 0.124045 0.089188 -0.02339 0.566337 0.123969 0.088971 -0.023330.545641 0.127405 0.098311 -0.02438 0.544312 0.127095 0.097772 -0.024250.524543 0.130205 0.10839 -0.0254 0.521669 0.129492 0.107335 -0.025150.503395 0.132436 0.119533 -0.02643 0.498496 0.131147 0.11837 -0.026170.482197 0.134087 0.131833 -0.02746 0.477504 0.132782 0.131111 -0.027310.460946 0.135161 0.145353 -0.02848 0.458421 0.134421 0.144999 -0.028410.439646 0.135671 0.160112 -0.02948 0.438575 0.135341 0.160014 -0.029460.418301 0.135631 0.176072 -0.03044 0.418046 0.135548 0.176072 -0.030440.396919 0.135065 0.193139 -0.03134 0.396919 0.135065 0.193139 -0.031340.375515 0.134009 0.211168 -0.03216 0.375515 0.134009 0.211039 -0.032140.354121 0.132496 0.229992 -0.0329 0.353905 0.132415 0.229432 -0.032820.33278 0.130553 0.249446 -0.03352 0.331969 0.130235 0.24808 -0.033340.311547 0.128186 0.269381 -0.03404 0.30984 0.127484 0.266759 -0.033710.290481 0.12539 0.28967 -0.03446 0.287654 0.12417 0.286851 -0.034120.269643 0.122167 0.310212 -0.03476 0.267019 0.120978 0.308513 -0.034570.249108 0.118532 0.330936 -0.03495 0.247743 0.117883 0.33013 -0.034860.22898 0.11451 0.351792 -0.03503 0.228422 0.114231 0.351578 -0.0350.209381 0.110131 0.372737 -0.035 0.209253 0.110064 0.372737 -0.0350.190459 0.105447 0.393743 -0.03488 0.190459 0.105447 0.393743 -0.034880.172376 0.100526 0.414788 -0.03466 0.172376 0.100526 0.414535 -0.034640.155303 0.095446 0.435856 -0.03433 0.155208 0.095388 0.434794 -0.034250.139386 0.090287 0.456943 -0.0339 0.139046 0.090067 0.45444 -0.033710.124721 0.085134 0.47804 -0.03337 0.124038 0.084668 0.473388 -0.033040.111353 0.080076 0.499138 -0.03275 0.110269 0.079297 0.49428 -0.032430.099272 0.075167 0.520225 -0.03203 0.098306 0.074435 0.517375 -0.031850.088415 0.070446 0.541297 -0.0312 0.087931 0.07006 0.539978 -0.031120.078685 0.065939 0.562353 -0.03026 0.078493 0.065778 0.56201 -0.030240.069977 0.061646 0.583392 -0.02921 0.069934 0.061608 0.583392 -0.029210.062177 0.057559 0.604409 -0.02805 0.062177 0.057559 0.604409 -0.028050.055173 0.053672 0.625381 -0.0268 0.055173 0.053672 0.625 -0.026780.048864 0.049978 0.646298 -0.02541 0.048834 0.049948 0.644724 -0.025350.043172 0.046457 0.667152 -0.02388 0.043067 0.046344 0.663497 -0.023750.038034 0.043073 0.687936 -0.02217 0.037826 0.042837 0.681241 -0.021960.033379 0.039815 0.708661 -0.02024 0.033054 0.039428 0.701764 -0.020040.029102 0.03673 0.729361 -0.01807 0.028819 0.036373 0.725365 -0.017970.025122 0.033857 0.750057 -0.01571 0.024984 0.033672 0.74823 -0.015670.021427 0.031154 0.770751 -0.01322 0.021375 0.031078 0.770281 -0.013210.01806 0.028512 0.791395 -0.0107 0.018049 0.028495 0.791395 -0.01070.015044 0.025852 0.811899 -0.00825 0.015044 0.025852 0.811899 -0.008250.012351 0.023174 0.83221 -0.00598 0.012351 0.023174 0.831703 -0.005980.009943 0.020509 0.852308 -0.00398 0.009937 0.020497 0.850232 -0.003970.007785 0.01788 0.87215 -0.00226 0.007766 0.017836 0.867372 -0.002250.005858 0.015282 0.891665 -0.00096 0.005826 0.015198 0.882987 -0.000950.004147 0.012708 0.910812 -0.00037 0.004107 0.012584 0.901948 -0.000370.002659 0.010151 0.929731 -0.00068 0.002633 0.010052 0.924638 -0.000680.001468 0.007604 0.94867 -0.00124 0.00146 0.007562 0.946359 -0.001240.000635 0.005064 0.967785 -0.00119 0.000633 0.005052 0.967195 -0.001180.000158 0.002529 0.987077 -0.00058 0.000158 0.002527 0.987077 -0.000580.000042 0.001275 1 0 0.000042 0.001275 1 0
0 0 0 0
Upper Surface Lower Surface Upper Surface Lower Surface
Wortmann 170 Rigid Wortmann 170 One Percent Deflation
Figure B1 Wortmann FX 67-K-170 Contours
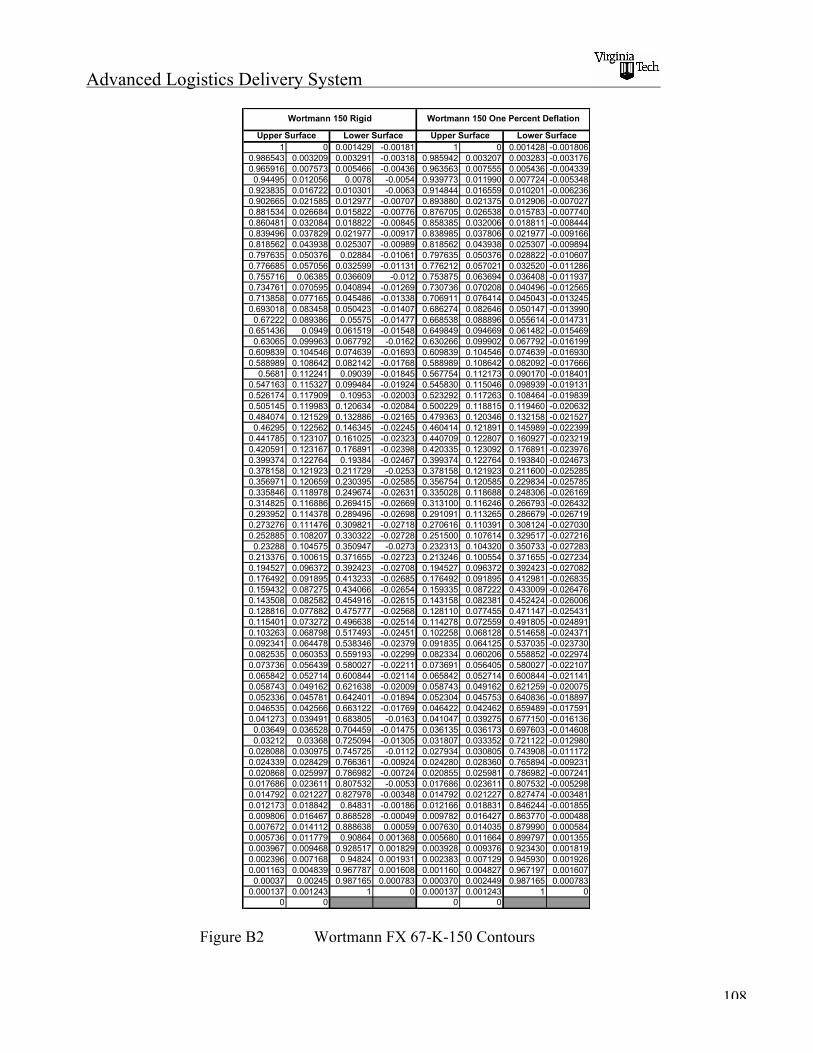
Advanced Logistics Delivery System
108
1 0 0.001429 -0.00181 1 0 0.001428 -0.0018060.986543 0.003209 0.003291 -0.00318 0.985942 0.003207 0.003283 -0.0031760.965916 0.007573 0.005466 -0.00436 0.963563 0.007555 0.005436 -0.0043390.94495 0.012056 0.0078 -0.0054 0.939773 0.011990 0.007724 -0.0053480.923835 0.016722 0.010301 -0.0063 0.914844 0.016559 0.010201 -0.0062360.902665 0.021585 0.012977 -0.00707 0.893880 0.021375 0.012906 -0.0070270.881534 0.026684 0.015822 -0.00776 0.876705 0.026538 0.015783 -0.0077400.860481 0.032084 0.018822 -0.00845 0.858385 0.032006 0.018811 -0.0084440.839496 0.037829 0.021977 -0.00917 0.838985 0.037806 0.021977 -0.0091660.818562 0.043938 0.025307 -0.00989 0.818562 0.043938 0.025307 -0.0098940.797635 0.050376 0.02884 -0.01061 0.797635 0.050376 0.028822 -0.0106070.776685 0.057056 0.032599 -0.01131 0.776212 0.057021 0.032520 -0.0112860.755716 0.06385 0.036609 -0.012 0.753875 0.063694 0.036408 -0.0119370.734761 0.070595 0.040894 -0.01269 0.730736 0.070208 0.040496 -0.0125650.713858 0.077165 0.045486 -0.01338 0.706911 0.076414 0.045043 -0.0132450.693018 0.083458 0.050423 -0.01407 0.686274 0.082646 0.050147 -0.0139900.67222 0.089386 0.05575 -0.01477 0.668538 0.088896 0.055614 -0.0147310.651436 0.0949 0.061519 -0.01548 0.649849 0.094669 0.061482 -0.0154690.63065 0.099963 0.067792 -0.0162 0.630266 0.099902 0.067792 -0.0161990.609839 0.104546 0.074639 -0.01693 0.609839 0.104546 0.074639 -0.0169300.588989 0.108642 0.082142 -0.01768 0.588989 0.108642 0.082092 -0.0176660.5681 0.112241 0.09039 -0.01845 0.567754 0.112173 0.090170 -0.018401
0.547163 0.115327 0.099484 -0.01924 0.545830 0.115046 0.098939 -0.0191310.526174 0.117909 0.10953 -0.02003 0.523292 0.117263 0.108464 -0.0198390.505145 0.119983 0.120634 -0.02084 0.500229 0.118815 0.119460 -0.0206320.484074 0.121529 0.132886 -0.02165 0.479363 0.120346 0.132158 -0.0215270.46295 0.122562 0.146345 -0.02245 0.460414 0.121891 0.145989 -0.0223990.441785 0.123107 0.161025 -0.02323 0.440709 0.122807 0.160927 -0.0232190.420591 0.123167 0.176891 -0.02398 0.420335 0.123092 0.176891 -0.0239760.399374 0.122764 0.19384 -0.02467 0.399374 0.122764 0.193840 -0.0246730.378158 0.121923 0.211729 -0.0253 0.378158 0.121923 0.211600 -0.0252850.356971 0.120659 0.230395 -0.02585 0.356754 0.120585 0.229834 -0.0257850.335846 0.118978 0.249674 -0.02631 0.335028 0.118688 0.248306 -0.0261690.314825 0.116886 0.269415 -0.02669 0.313100 0.116246 0.266793 -0.0264320.293952 0.114378 0.289496 -0.02698 0.291091 0.113265 0.286679 -0.0267190.273276 0.111476 0.309821 -0.02718 0.270616 0.110391 0.308124 -0.0270300.252885 0.108207 0.330322 -0.02728 0.251500 0.107614 0.329517 -0.0272160.23288 0.104575 0.350947 -0.0273 0.232313 0.104320 0.350733 -0.0272830.213376 0.100615 0.371655 -0.02723 0.213246 0.100554 0.371655 -0.0272340.194527 0.096372 0.392423 -0.02708 0.194527 0.096372 0.392423 -0.0270820.176492 0.091895 0.413233 -0.02685 0.176492 0.091895 0.412981 -0.0268350.159432 0.087275 0.434066 -0.02654 0.159335 0.087222 0.433009 -0.0264760.143508 0.082582 0.454916 -0.02615 0.143158 0.082381 0.452424 -0.0260060.128816 0.077882 0.475777 -0.02568 0.128110 0.077455 0.471147 -0.0254310.115401 0.073272 0.496638 -0.02514 0.114278 0.072559 0.491805 -0.0248910.103263 0.068798 0.517493 -0.02451 0.102258 0.068128 0.514658 -0.0243710.092341 0.064478 0.538346 -0.02379 0.091835 0.064125 0.537035 -0.0237300.082535 0.060353 0.559193 -0.02299 0.082334 0.060206 0.558852 -0.0229740.073736 0.056439 0.580027 -0.02211 0.073691 0.056405 0.580027 -0.0221070.065842 0.052714 0.600844 -0.02114 0.065842 0.052714 0.600844 -0.0211410.058743 0.049162 0.621638 -0.02009 0.058743 0.049162 0.621259 -0.0200750.052336 0.045781 0.642401 -0.01894 0.052304 0.045753 0.640836 -0.0188970.046535 0.042566 0.663122 -0.01769 0.046422 0.042462 0.659489 -0.0175910.041273 0.039491 0.683805 -0.0163 0.041047 0.039275 0.677150 -0.0161360.03649 0.036528 0.704459 -0.01475 0.036135 0.036173 0.697603 -0.0146080.03212 0.03368 0.725094 -0.01305 0.031807 0.033352 0.721122 -0.0129800.028088 0.030975 0.745725 -0.0112 0.027934 0.030805 0.743908 -0.0111720.024339 0.028429 0.766361 -0.00924 0.024280 0.028360 0.765894 -0.0092310.020868 0.025997 0.786982 -0.00724 0.020855 0.025981 0.786982 -0.0072410.017686 0.023611 0.807532 -0.0053 0.017686 0.023611 0.807532 -0.0052980.014792 0.021227 0.827978 -0.00348 0.014792 0.021227 0.827474 -0.0034810.012173 0.018842 0.84831 -0.00186 0.012166 0.018831 0.846244 -0.0018550.009806 0.016467 0.868528 -0.00049 0.009782 0.016427 0.863770 -0.0004880.007672 0.014112 0.888638 0.00059 0.007630 0.014035 0.879990 0.0005840.005736 0.011779 0.90864 0.001368 0.005680 0.011664 0.899797 0.0013550.003967 0.009468 0.928517 0.001829 0.003928 0.009376 0.923430 0.0018190.002396 0.007168 0.94824 0.001931 0.002383 0.007129 0.945930 0.0019260.001163 0.004839 0.967787 0.001608 0.001160 0.004827 0.967197 0.0016070.00037 0.00245 0.987165 0.000783 0.000370 0.002449 0.987165 0.0007830.000137 0.001243 1 0 0.000137 0.001243 1 0
0 0 0 0
Wortmann 150 Rigid Wortmann 150 One Percent Deflation
Upper Surface Lower Surface Upper Surface Lower Surface
Figure B2 Wortmann FX 67-K-150 Contours
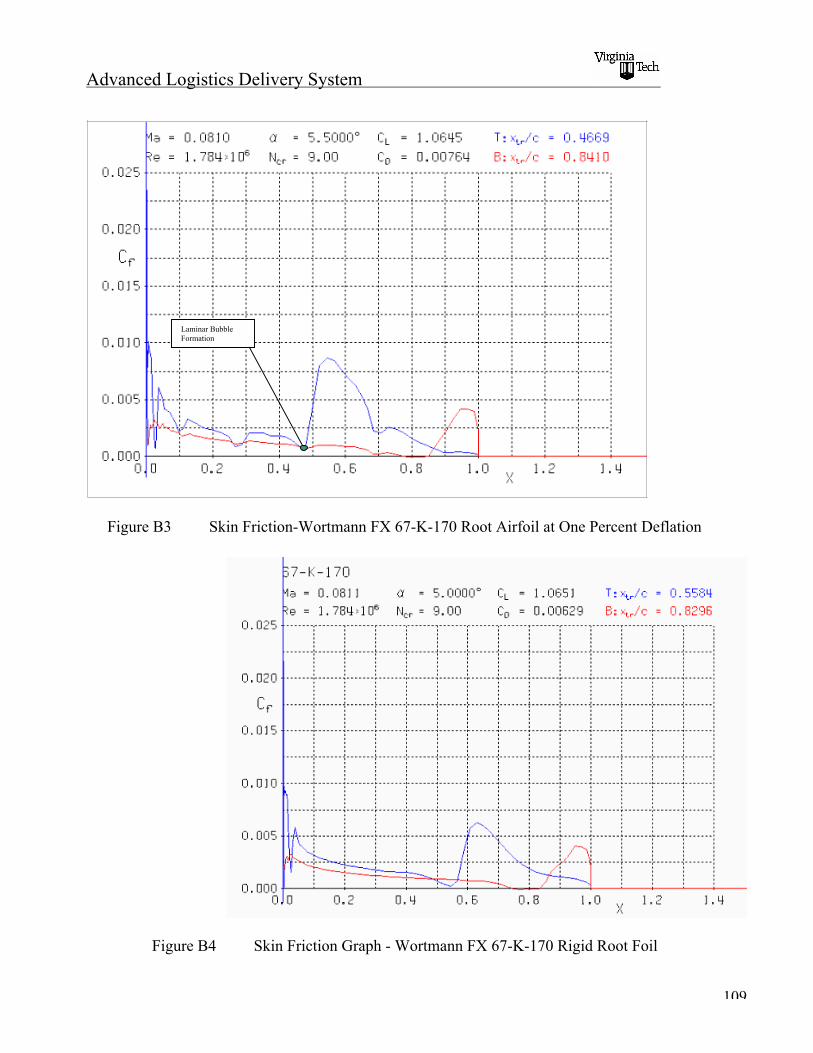
Advanced Logistics Delivery System
109
Figure B3 Skin Friction-Wortmann FX 67-K-170 Root Airfoil at One Percent Deflation
Figure B4 Skin Friction Graph - Wortmann FX 67-K-170 Rigid Root Foil
Laminar BubbleFormation
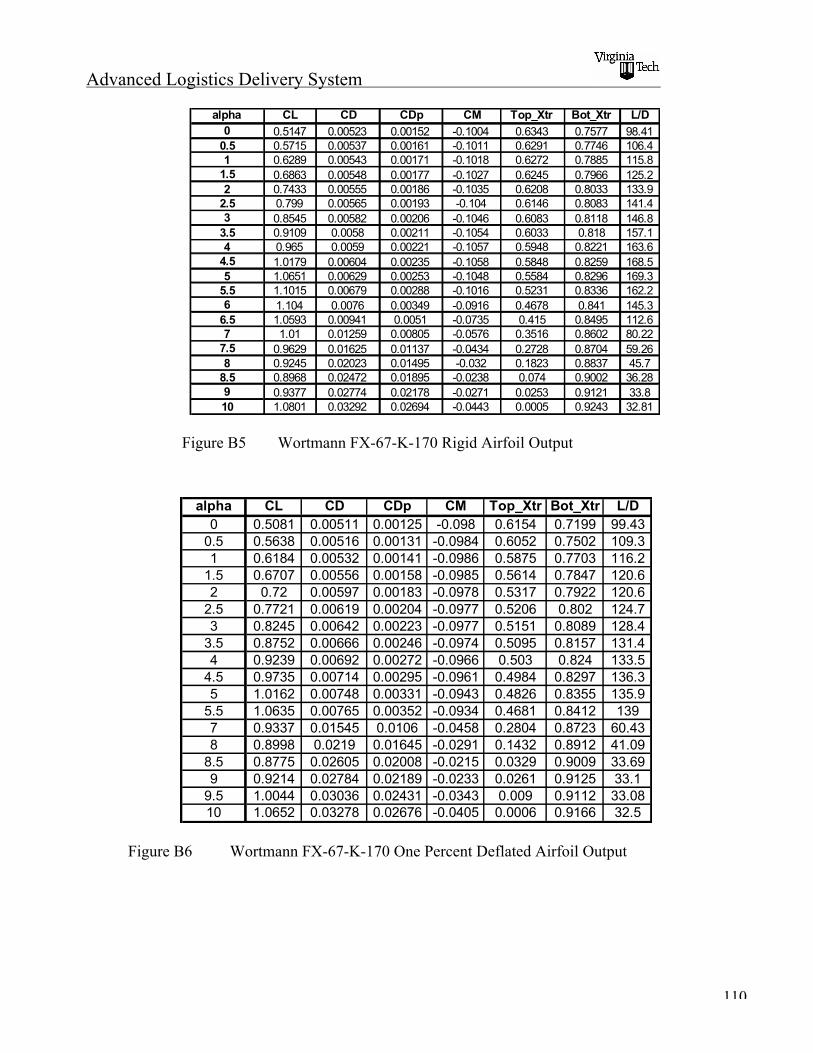
Advanced Logistics Delivery System
110
alpha CL CD CDp CM Top_Xtr Bot_Xtr L/D0 0.5147 0.00523 0.00152 -0.1004 0.6343 0.7577 98.410.5 0.5715 0.00537 0.00161 -0.1011 0.6291 0.7746 106.41 0.6289 0.00543 0.00171 -0.1018 0.6272 0.7885 115.81.5 0.6863 0.00548 0.00177 -0.1027 0.6245 0.7966 125.22 0.7433 0.00555 0.00186 -0.1035 0.6208 0.8033 133.92.5 0.799 0.00565 0.00193 -0.104 0.6146 0.8083 141.43 0.8545 0.00582 0.00206 -0.1046 0.6083 0.8118 146.83.5 0.9109 0.0058 0.00211 -0.1054 0.6033 0.818 157.14 0.965 0.0059 0.00221 -0.1057 0.5948 0.8221 163.64.5 1.0179 0.00604 0.00235 -0.1058 0.5848 0.8259 168.55 1.0651 0.00629 0.00253 -0.1048 0.5584 0.8296 169.35.5 1.1015 0.00679 0.00288 -0.1016 0.5231 0.8336 162.26 1.104 0.0076 0.00349 -0.0916 0.4678 0.841 145.36.5 1.0593 0.00941 0.0051 -0.0735 0.415 0.8495 112.67 1.01 0.01259 0.00805 -0.0576 0.3516 0.8602 80.227.5 0.9629 0.01625 0.01137 -0.0434 0.2728 0.8704 59.268 0.9245 0.02023 0.01495 -0.032 0.1823 0.8837 45.78.5 0.8968 0.02472 0.01895 -0.0238 0.074 0.9002 36.289 0.9377 0.02774 0.02178 -0.0271 0.0253 0.9121 33.810 1.0801 0.03292 0.02694 -0.0443 0.0005 0.9243 32.81
Figure B5 Wortmann FX-67-K-170 Rigid Airfoil Output
alpha CL CD CDp CM Top_Xtr Bot_Xtr L/D0 0.5081 0.00511 0.00125 -0.098 0.6154 0.7199 99.430.5 0.5638 0.00516 0.00131 -0.0984 0.6052 0.7502 109.31 0.6184 0.00532 0.00141 -0.0986 0.5875 0.7703 116.21.5 0.6707 0.00556 0.00158 -0.0985 0.5614 0.7847 120.62 0.72 0.00597 0.00183 -0.0978 0.5317 0.7922 120.62.5 0.7721 0.00619 0.00204 -0.0977 0.5206 0.802 124.73 0.8245 0.00642 0.00223 -0.0977 0.5151 0.8089 128.43.5 0.8752 0.00666 0.00246 -0.0974 0.5095 0.8157 131.44 0.9239 0.00692 0.00272 -0.0966 0.503 0.824 133.54.5 0.9735 0.00714 0.00295 -0.0961 0.4984 0.8297 136.35 1.0162 0.00748 0.00331 -0.0943 0.4826 0.8355 135.95.5 1.0635 0.00765 0.00352 -0.0934 0.4681 0.8412 1397 0.9337 0.01545 0.0106 -0.0458 0.2804 0.8723 60.438 0.8998 0.0219 0.01645 -0.0291 0.1432 0.8912 41.098.5 0.8775 0.02605 0.02008 -0.0215 0.0329 0.9009 33.699 0.9214 0.02784 0.02189 -0.0233 0.0261 0.9125 33.19.5 1.0044 0.03036 0.02431 -0.0343 0.009 0.9112 33.0810 1.0652 0.03278 0.02676 -0.0405 0.0006 0.9166 32.5
Figure B6 Wortmann FX-67-K-170 One Percent Deflated Airfoil Output
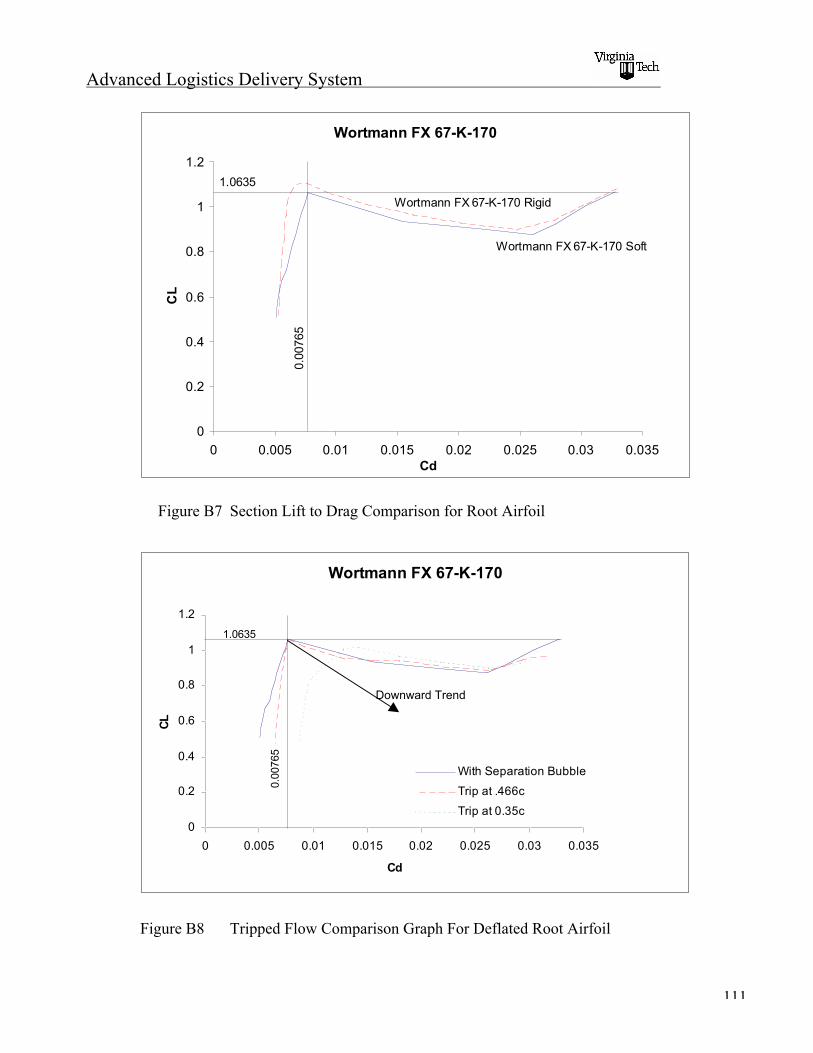
Advanced Logistics Delivery System
111
Wortmann FX 67-K-170
0
0.2
0.4
0.6
0.8
1
1.2
0 0.005 0.01 0.015 0.02 0.025 0.03 0.035Cd
CL
0.00
765
1.0635
Wortmann FX 67-K-170 Rigid
Wortmann FX 67-K-170 Soft
Figure B7 Section Lift to Drag Comparison for Root Airfoil
Wortmann FX 67-K-170
0
0.2
0.4
0.6
0.8
1
1.2
0 0.005 0.01 0.015 0.02 0.025 0.03 0.035
Cd
CL
With Separation Bubble
Trip at .466c
Trip at 0.35c
0.00
765
1.0635
Figure B8 Tripped Flow Comparison Graph For Deflated Root Airfoil
Downward Trend
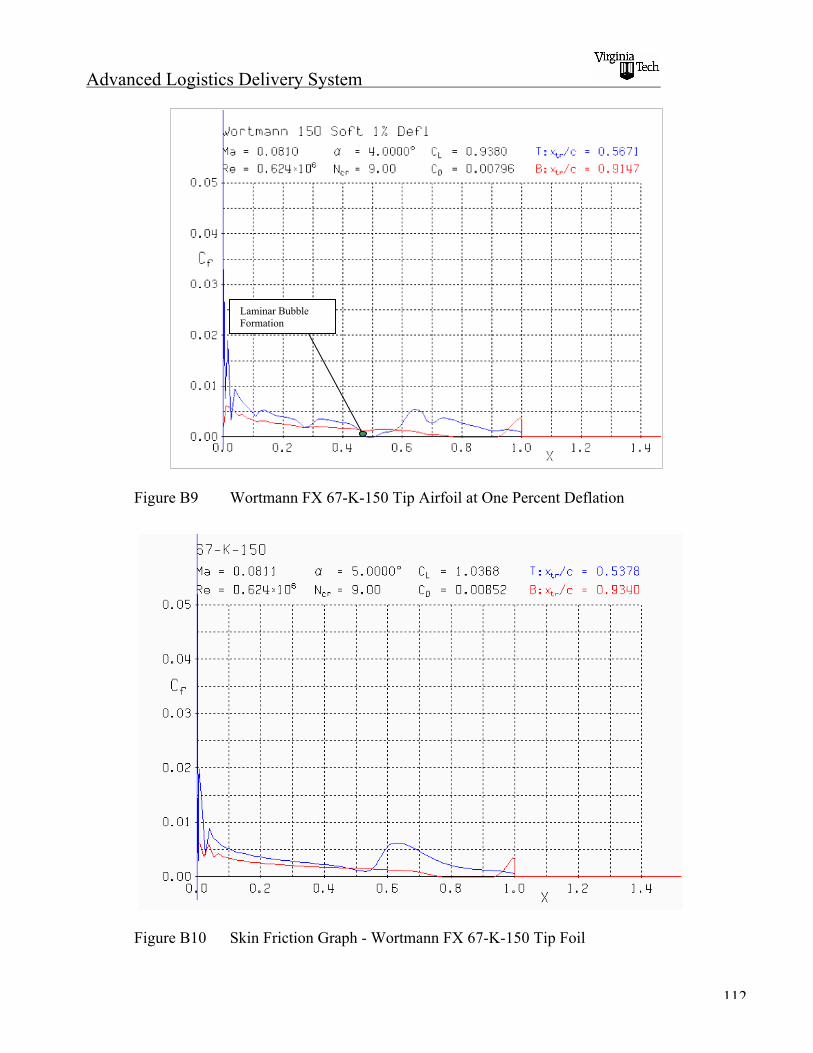
Advanced Logistics Delivery System
112
Figure B9 Wortmann FX 67-K-150 Tip Airfoil at One Percent Deflation
Figure B10 Skin Friction Graph - Wortmann FX 67-K-150 Tip Foil
Laminar BubbleFormation
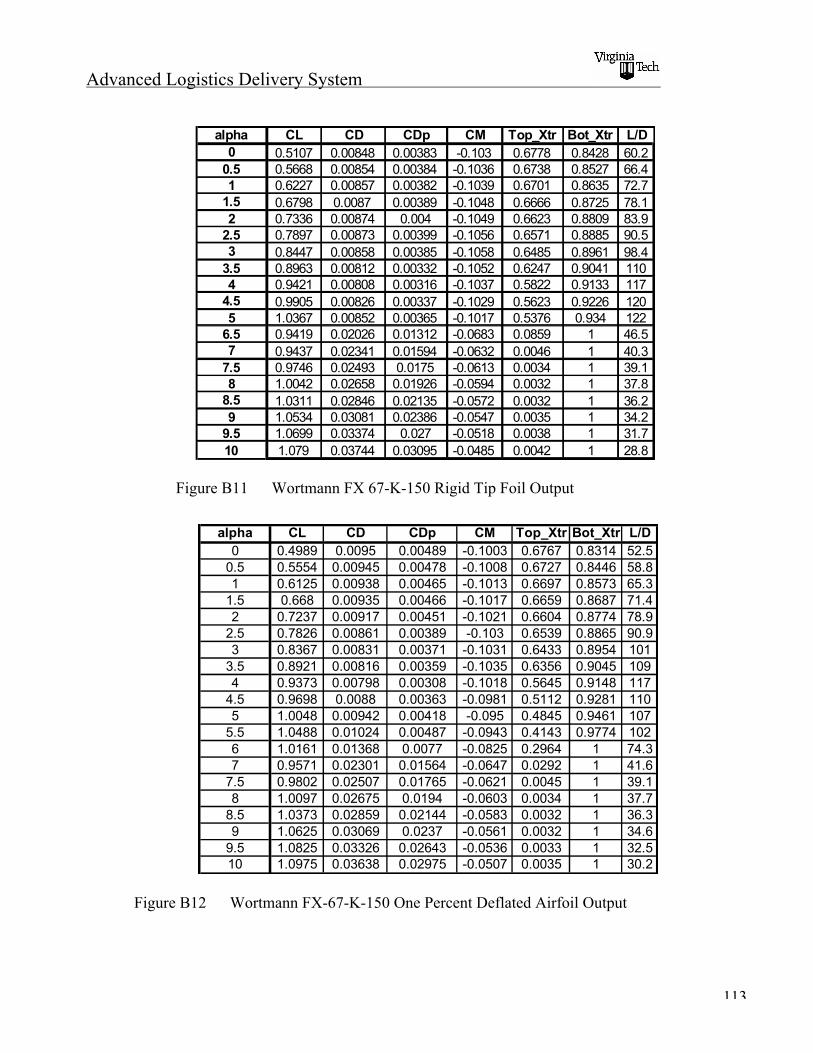
Advanced Logistics Delivery System
113
alpha CL CD CDp CM Top_Xtr Bot_Xtr L/D0 0.5107 0.00848 0.00383 -0.103 0.6778 0.8428 60.20.5 0.5668 0.00854 0.00384 -0.1036 0.6738 0.8527 66.41 0.6227 0.00857 0.00382 -0.1039 0.6701 0.8635 72.71.5 0.6798 0.0087 0.00389 -0.1048 0.6666 0.8725 78.12 0.7336 0.00874 0.004 -0.1049 0.6623 0.8809 83.92.5 0.7897 0.00873 0.00399 -0.1056 0.6571 0.8885 90.53 0.8447 0.00858 0.00385 -0.1058 0.6485 0.8961 98.43.5 0.8963 0.00812 0.00332 -0.1052 0.6247 0.9041 1104 0.9421 0.00808 0.00316 -0.1037 0.5822 0.9133 1174.5 0.9905 0.00826 0.00337 -0.1029 0.5623 0.9226 1205 1.0367 0.00852 0.00365 -0.1017 0.5376 0.934 1226.5 0.9419 0.02026 0.01312 -0.0683 0.0859 1 46.57 0.9437 0.02341 0.01594 -0.0632 0.0046 1 40.37.5 0.9746 0.02493 0.0175 -0.0613 0.0034 1 39.18 1.0042 0.02658 0.01926 -0.0594 0.0032 1 37.88.5 1.0311 0.02846 0.02135 -0.0572 0.0032 1 36.29 1.0534 0.03081 0.02386 -0.0547 0.0035 1 34.29.5 1.0699 0.03374 0.027 -0.0518 0.0038 1 31.710 1.079 0.03744 0.03095 -0.0485 0.0042 1 28.8
Figure B11 Wortmann FX 67-K-150 Rigid Tip Foil Output
alpha CL CD CDp CM Top_Xtr Bot_Xtr L/D0 0.4989 0.0095 0.00489 -0.1003 0.6767 0.8314 52.50.5 0.5554 0.00945 0.00478 -0.1008 0.6727 0.8446 58.81 0.6125 0.00938 0.00465 -0.1013 0.6697 0.8573 65.31.5 0.668 0.00935 0.00466 -0.1017 0.6659 0.8687 71.42 0.7237 0.00917 0.00451 -0.1021 0.6604 0.8774 78.92.5 0.7826 0.00861 0.00389 -0.103 0.6539 0.8865 90.93 0.8367 0.00831 0.00371 -0.1031 0.6433 0.8954 1013.5 0.8921 0.00816 0.00359 -0.1035 0.6356 0.9045 1094 0.9373 0.00798 0.00308 -0.1018 0.5645 0.9148 1174.5 0.9698 0.0088 0.00363 -0.0981 0.5112 0.9281 1105 1.0048 0.00942 0.00418 -0.095 0.4845 0.9461 1075.5 1.0488 0.01024 0.00487 -0.0943 0.4143 0.9774 1026 1.0161 0.01368 0.0077 -0.0825 0.2964 1 74.37 0.9571 0.02301 0.01564 -0.0647 0.0292 1 41.67.5 0.9802 0.02507 0.01765 -0.0621 0.0045 1 39.18 1.0097 0.02675 0.0194 -0.0603 0.0034 1 37.78.5 1.0373 0.02859 0.02144 -0.0583 0.0032 1 36.39 1.0625 0.03069 0.0237 -0.0561 0.0032 1 34.69.5 1.0825 0.03326 0.02643 -0.0536 0.0033 1 32.510 1.0975 0.03638 0.02975 -0.0507 0.0035 1 30.2
Figure B12 Wortmann FX-67-K-150 One Percent Deflated Airfoil Output
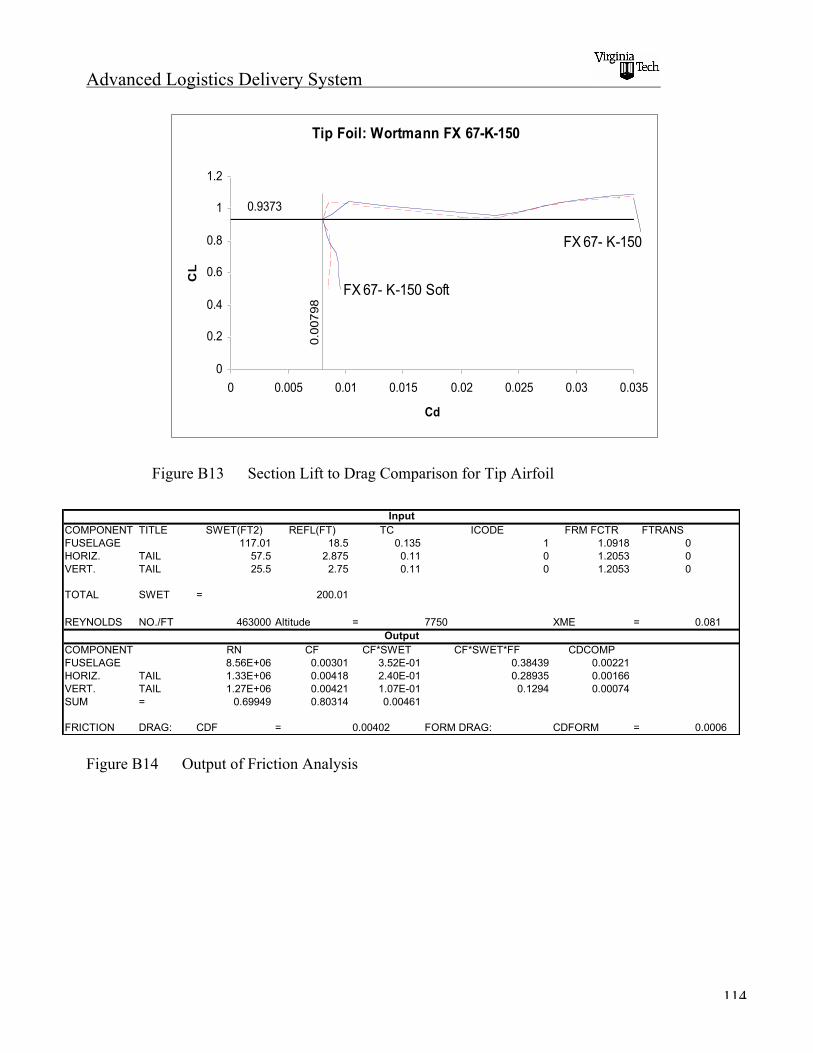
Advanced Logistics Delivery System
114
Tip Foil: Wortmann FX 67-K-150
0
0.2
0.4
0.6
0.8
1
1.2
0 0.005 0.01 0.015 0.02 0.025 0.03 0.035
Cd
CL
FX 67- K-150 Soft
0.0
0798
0.9373
FX 67- K-150
Figure B13 Section Lift to Drag Comparison for Tip Airfoil
COMPONENT TITLE SWET(FT2) REFL(FT) TC ICODE FRM FCTR FTRANSFUSELAGE 117.01 18.5 0.135 1 1.0918 0HORIZ. TAIL 57.5 2.875 0.11 0 1.2053 0VERT. TAIL 25.5 2.75 0.11 0 1.2053 0
TOTAL SWET = 200.01
REYNOLDS NO./FT 463000 Altitude = 7750 XME = 0.081
COMPONENT RN CF CF*SWET CF*SWET*FF CDCOMPFUSELAGE 8.56E+06 0.00301 3.52E-01 0.38439 0.00221HORIZ. TAIL 1.33E+06 0.00418 2.40E-01 0.28935 0.00166VERT. TAIL 1.27E+06 0.00421 1.07E-01 0.1294 0.00074SUM = 0.69949 0.80314 0.00461
FRICTION DRAG: CDF = 0.00402 FORM DRAG: CDFORM = 0.0006
Input
Output
Figure B14 Output of Friction Analysis