Embed Size (px)
Citation preview
134
1. Grundkenntnisse zur Simulation
2. Einführung in ProModel
3. Grundbausteine von ProModel
4. Path Networks
5. Variablen und Counter
6. User Distributions
7. Attribute
8. Uhrzeitabhängiges Routing und Schichtkalender
9. Statistische Auswertung der Simulationsdaten
10.Statistische Verteilungen
11.Aufbereitung empirischer Daten
12.Arbeiten mit ProActive X, Kosten
13.Fallstudie
Gliederung

135
9. ProModel – External Files
External Files may be used duringsimulation to
• read data into the simulation or• write data as output from the simulation.
External Files can also be used to specify
• operation times• arrival schedules• shift schedules• external subroutines
All External Files used in a modelmust be listed in the External Files Editor .
Access from the Build Menu:
136
9. ProModel – External Files
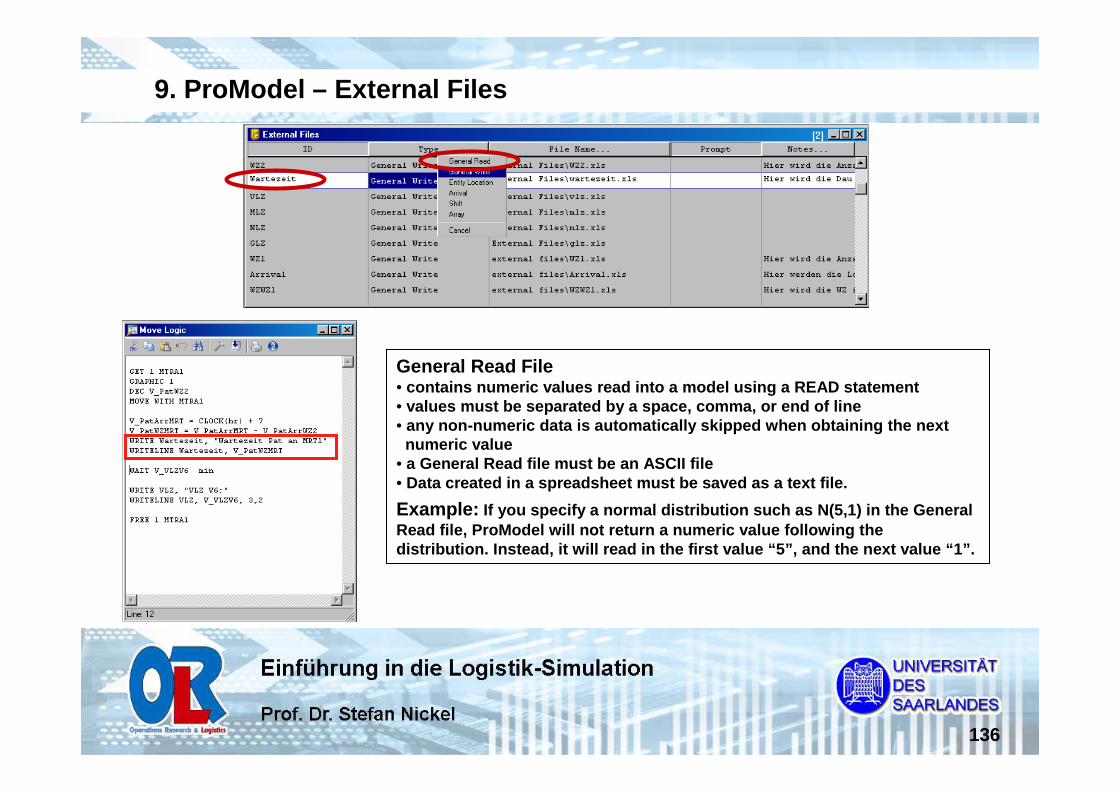
General Read File• contains numeric values read into a model using a R EAD statement • values must be separated by a space, comma, or end of line• any non-numeric data is automatically skipped when obtaining the next
numeric value• a General Read file must be an ASCII file• Data created in a spreadsheet must be saved as a te xt file.
Example: If you specify a normal distribution such as N(5,1) in the General Read file, ProModel will not return a numeric value following the distribution. Instead, it will read in the first va lue “5”, and the next value “1”.

137
9. ProModel – External Files
General Write File• used for writing text strings and numeric values us ing WRITE and
WRITELINE statements• Text strings are enclosed in quotes when written to the file, with commas
automatically appended to strings:
� files can be read into spreadsheet programs like Ex cel or Lotus 1-2-3� custom viewing, editing, and graphing
Wartezeit Pat an MRT1, 0.01,
138
9. ProModel – External Files
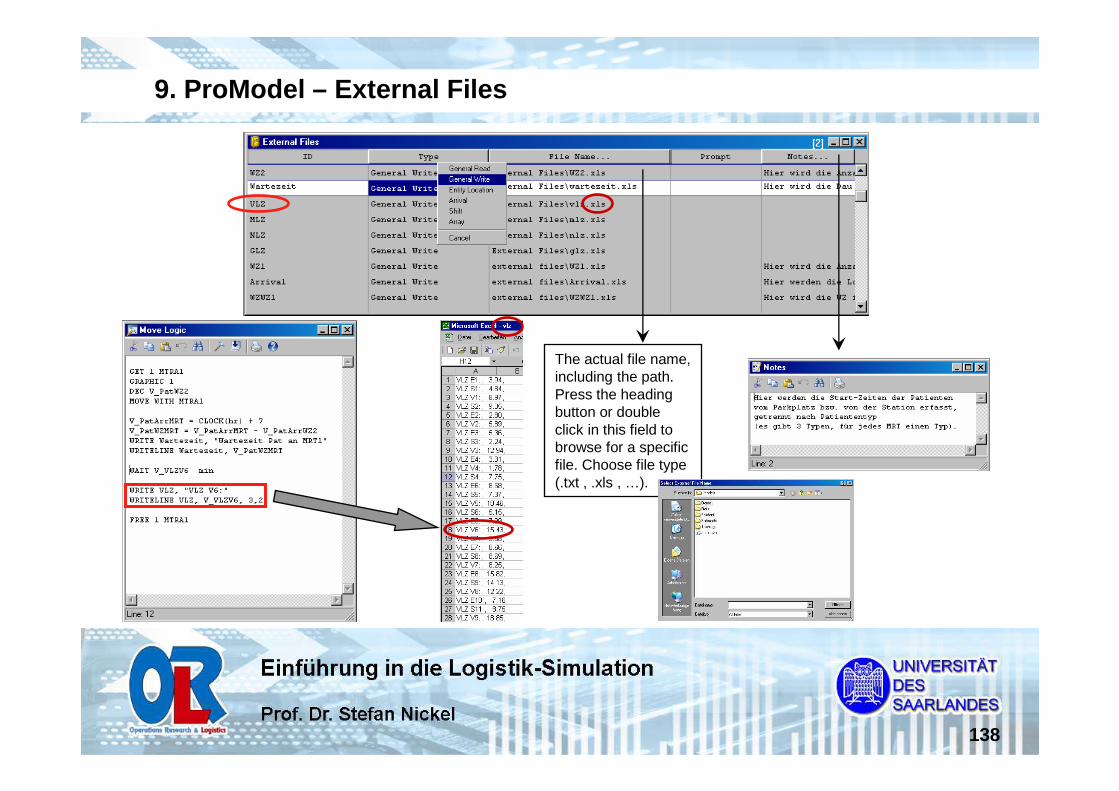
The actual file name, including the path. Press the headingbutton or double click in this field to browse for a specificfile. Choose file type(.txt , .xls , …).
139
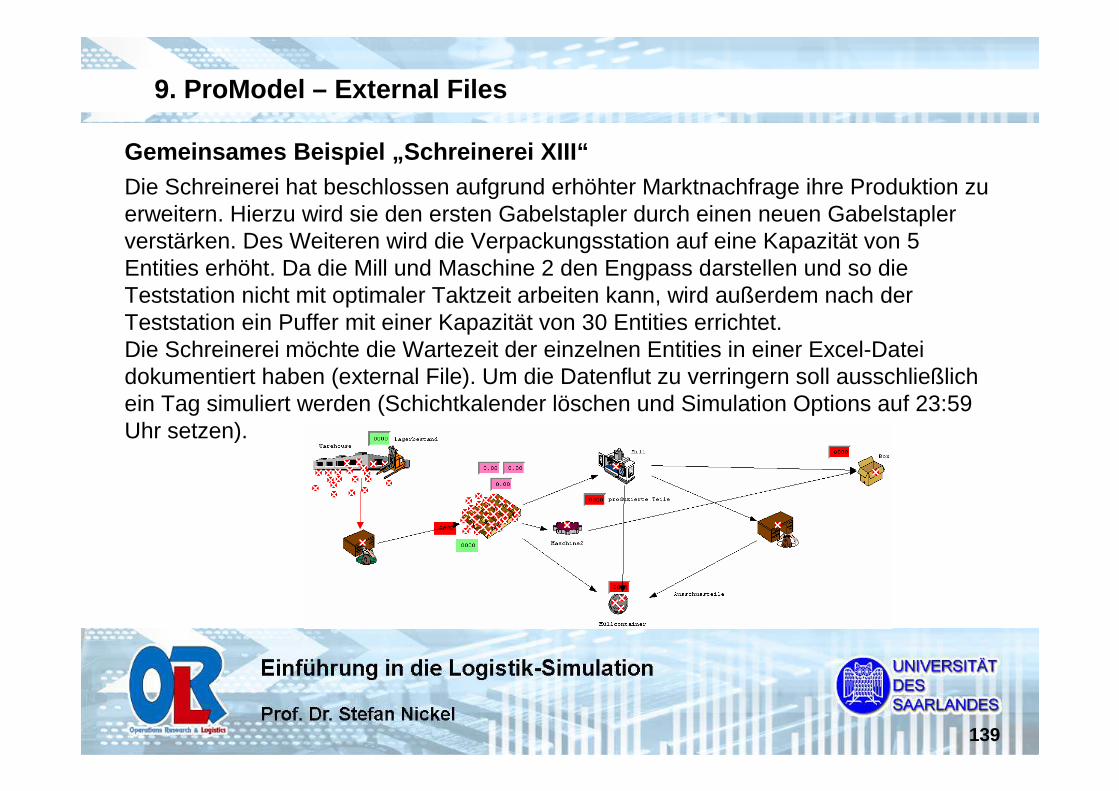
Gemeinsames Beispiel „Schreinerei XIII“
9. ProModel – External Files
Die Schreinerei hat beschlossen aufgrund erhöhter Marktnachfrage ihre Produktion zu erweitern. Hierzu wird sie den ersten Gabelstapler durch einen neuen Gabelstapler verstärken. Des Weiteren wird die Verpackungsstation auf eine Kapazität von 5 Entities erhöht. Da die Mill und Maschine 2 den Engpass darstellen und so dieTeststation nicht mit optimaler Taktzeit arbeiten kann, wird außerdem nach der Teststation ein Puffer mit einer Kapazität von 30 Entities errichtet.Die Schreinerei möchte die Wartezeit der einzelnen Entities in einer Excel-Datei dokumentiert haben (external File). Um die Datenflut zu verringern soll ausschließlich ein Tag simuliert werden (Schichtkalender löschen und Simulation Options auf 23:59 Uhr setzen).
140
9. ProModel – External Files
Übung „Röntgenpraxis XIII“
Die Röntgenpraxis erweitert ihre Räumlichkeiten durch einen Warteraum vor den beiden Rezeptionen um die Warteschlange zu verringern. Um die Kundenzufriedenheit zu erhöhen möchte die Praxis die Wartezeit der Patienten im Wartezimmer analysieren. Erstellen Sie hierzu ein Excel-File mit den Wartezeiten (Simulationsdauer 1 Tag).

141
9. ProModel – Auswertung des Simulationslaufs
142
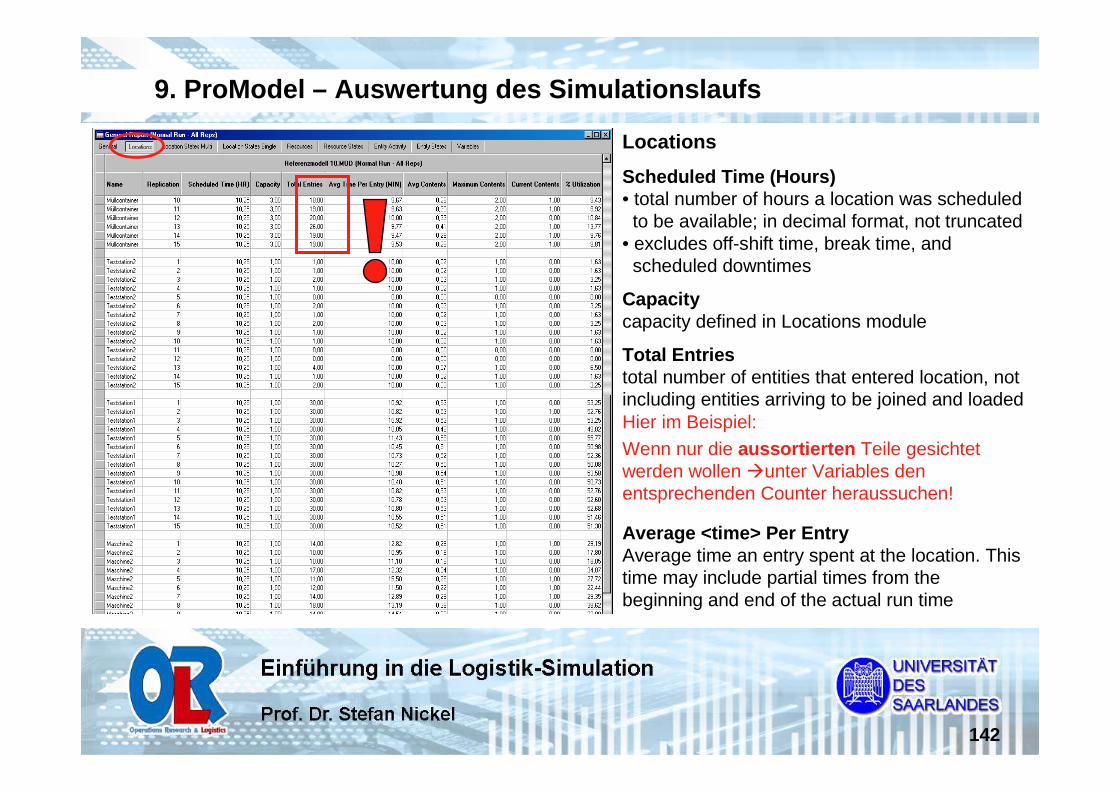
Locations
Scheduled Time (Hours)• total number of hours a location was scheduled to be available; in decimal format, not truncated
• excludes off-shift time, break time, and scheduled downtimes
Capacity capacity defined in Locations module
Total Entries total number of entities that entered location, not including entities arriving to be joined and loaded
Average <time> Per EntryAverage time an entry spent at the location. This time may include partial times from thebeginning and end of the actual run time
9. ProModel – Auswertung des Simulationslaufs
Hier im Beispiel:Wenn nur die aussortierten Teile gesichtet werden wollen �unter Variables den entsprechenden Counter heraussuchen!
143
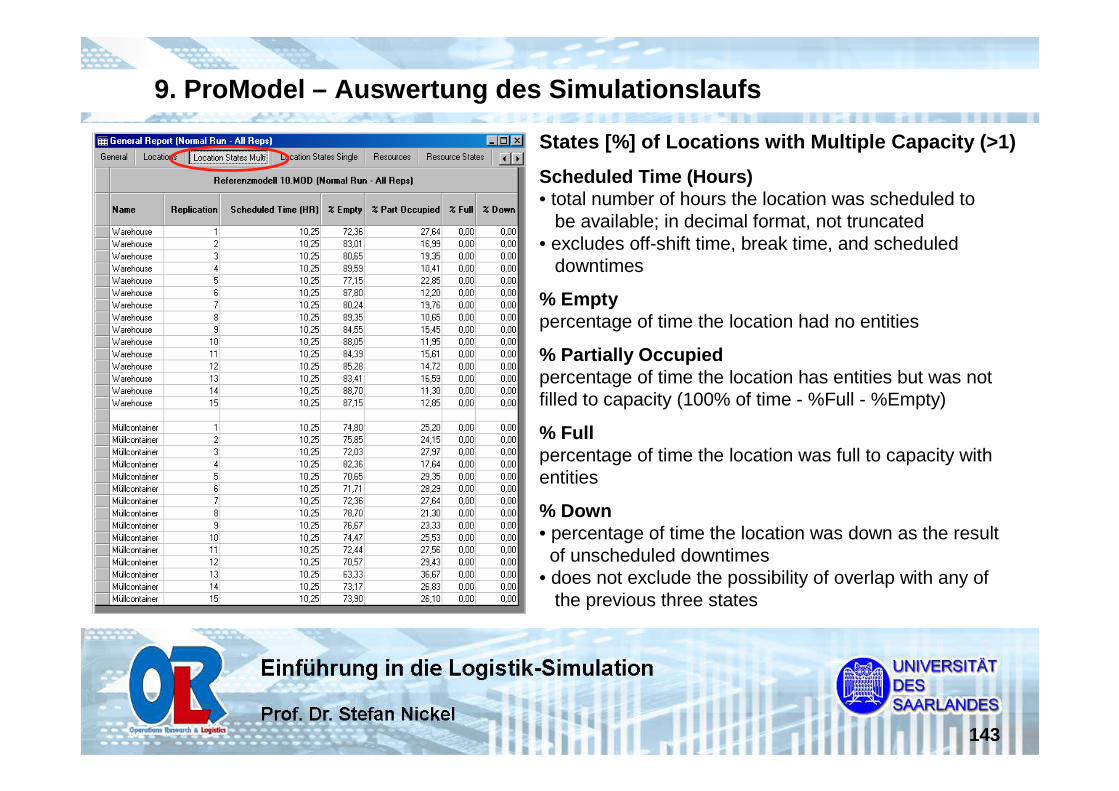
States [%] of Locations with Multiple Capacity (>1)
Scheduled Time (Hours) • total number of hours the location was scheduled to
be available; in decimal format, not truncated• excludes off-shift time, break time, and scheduled
downtimes
% Empty percentage of time the location had no entities
% Partially Occupied percentage of time the location has entities but was not filled to capacity (100% of time - %Full - %Empty)
% Full percentage of time the location was full to capacity with entities
% Down • percentage of time the location was down as the result of unscheduled downtimes
• does not exclude the possibility of overlap with any of the previous three states
9. ProModel – Auswertung des Simulationslaufs

144
9. ProModel – Auswertung des Simulationslaufs
States of Locations [%] with Single Capacity (=1)
Scheduled Time (Hours)• total number of hours the location was scheduled to be available; in decimal format, not truncated
• excludes off-shift time, break time, and scheduled downtimes
% Operation percentage of time the location was actually processing an entity
% Setuppercentage of time location spent in setup to process entities
% Idleperctg of time no entities were at location, but location was not down
% Waiting percentage of time a location was waiting for a resource, another entity, or a WAIT UNTIL condition to begin processing or move tonext location. Any delays in processing move logic (even WAIT statements) are counted as waiting time
% Blockedpercentage of time entities spent waiting for a freed destination
% Downperctg of time a location was down due to unscheduled downtimes

145
9. ProModel – Auswertung des Simulationslaufs
number of units defined in theResources module for thatresource
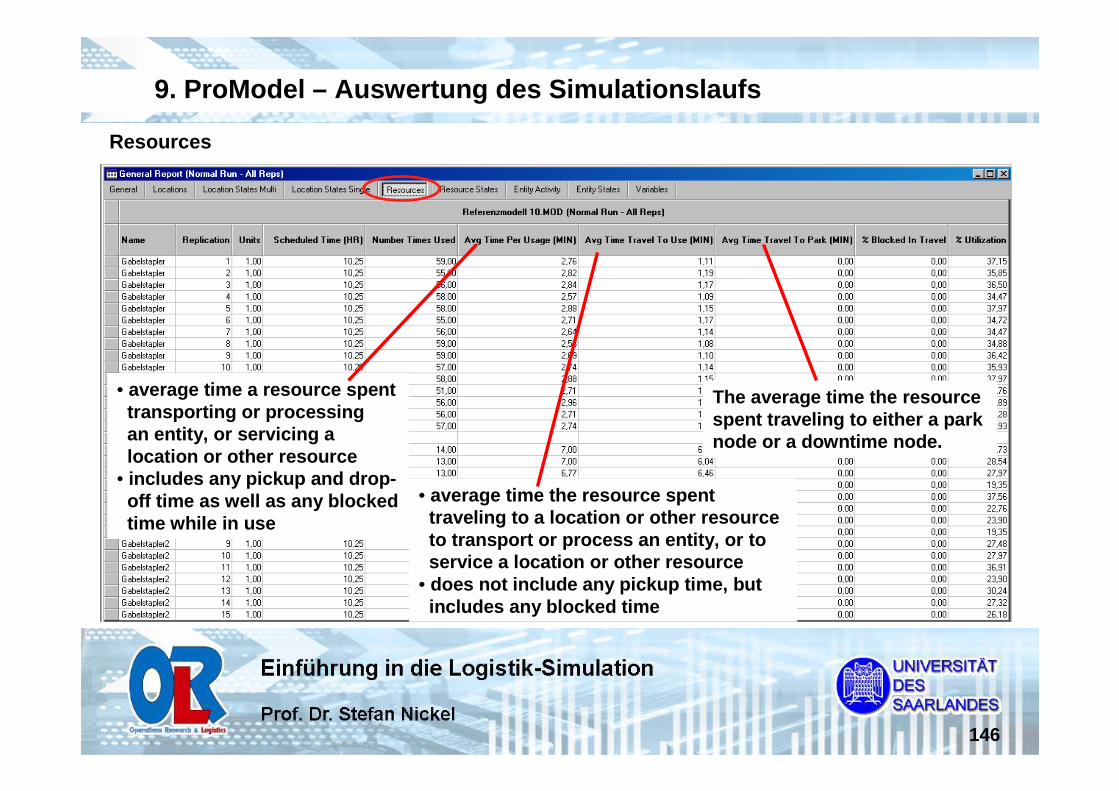
Resources
total number of hours a resource was scheduled to be available; excludes off-shift time, break time, and scheduleddowntimes.
total number of times a resource has beenacquired to transport or process an entityor to service locations or other resources
146
9. ProModel – Auswertung des Simulationslaufs
• average time a resource spenttransporting or processingan entity, or servicing a location or other resource
• includes any pickup and drop-off time as well as any blockedtime while in use
Resources
• average time the resource spenttraveling to a location or other resourceto transport or process an entity, or to service a location or other resource
• does not include any pickup time, butincludes any blocked time
The average time the resourcespent traveling to either a park node or a downtime node.
147
9. ProModel – Auswertung des Simulationslaufs
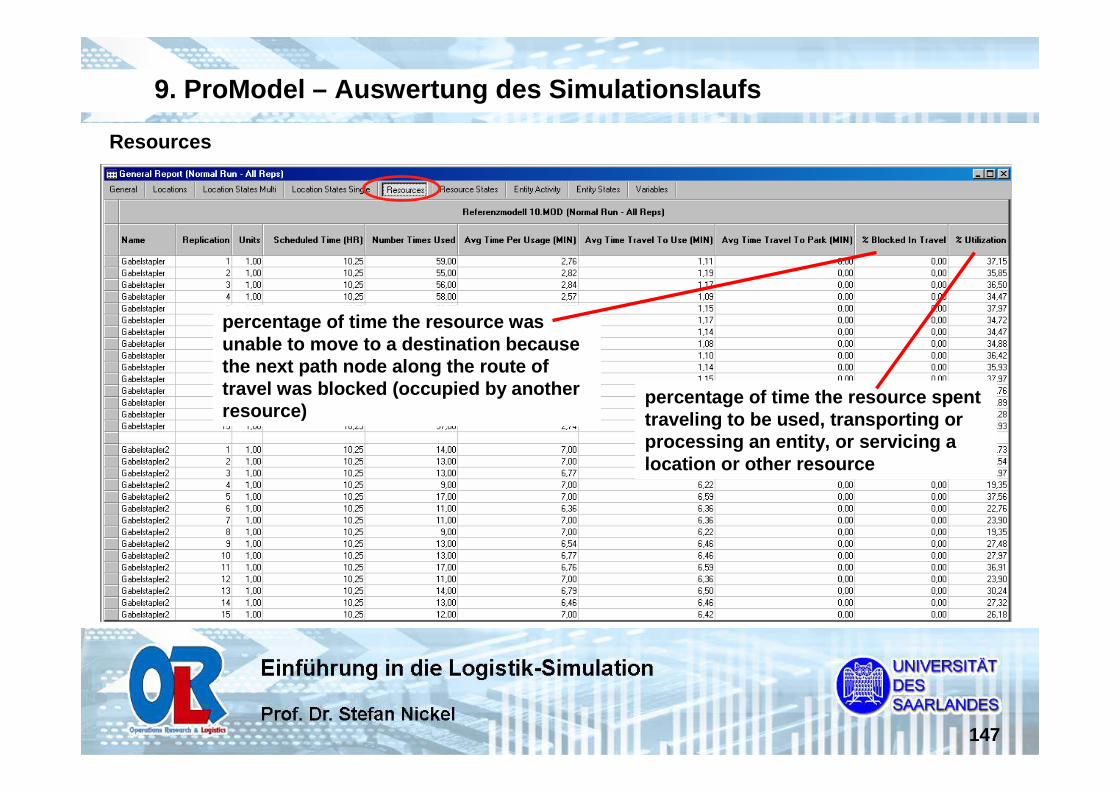
Resources
percentage of time the resource was unable to move to a destination because the next path node along the route of travel was blocked (occupied by another resource)
percentage of time the resource spent traveling to be used, transporting or processing an entity, or servicing a location or other resource
148
9. ProModel – Auswertung des Simulationslaufs
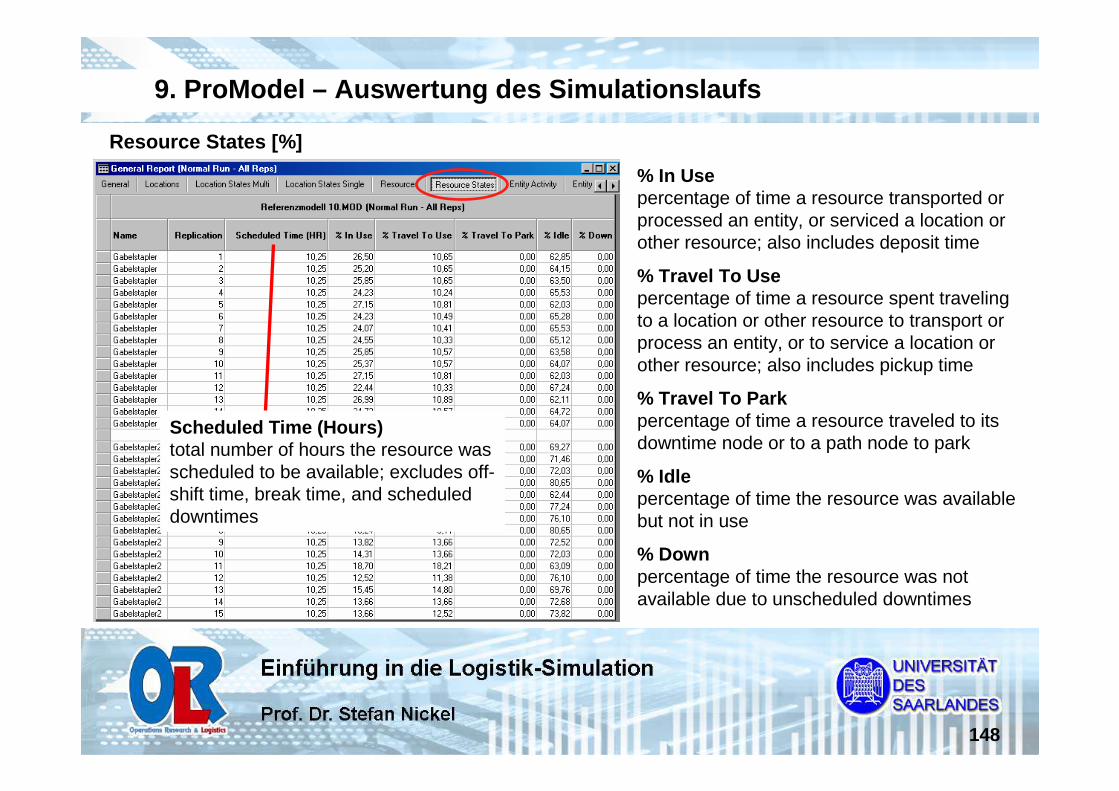
Resource States [%]
% In Usepercentage of time a resource transported or processed an entity, or serviced a location or other resource; also includes deposit time
% Travel To Usepercentage of time a resource spent traveling to a location or other resource to transport or process an entity, or to service a location or other resource; also includes pickup time
% Travel To Park percentage of time a resource traveled to its downtime node or to a path node to park
% Idlepercentage of time the resource was available but not in use
% Downpercentage of time the resource was not available due to unscheduled downtimes
Scheduled Time (Hours)total number of hours the resource was scheduled to be available; excludes off-shift time, break time, and scheduled downtimes
149
9. ProModel – Auswertung des Simulationslaufs
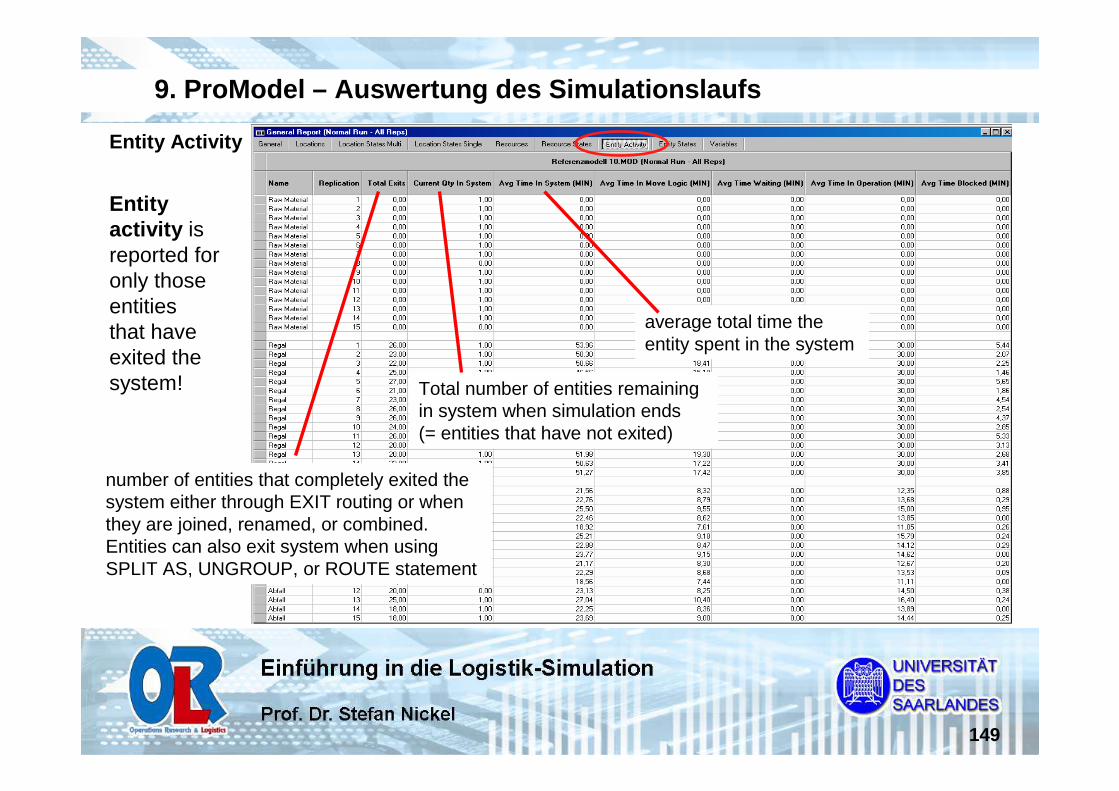
Entity Activity
Entity activity is reported for only those entitiesthat have exited the system!
number of entities that completely exited the system either through EXIT routing or when they are joined, renamed, or combined. Entities can also exit system when using SPLIT AS, UNGROUP, or ROUTE statement
Total number of entities remaining in system when simulation ends (= entities that have not exited)
average total time the entity spent in the system

150
9. ProModel – Auswertung des Simulationslaufs
Entity Activity
average time an entity spent traveling between locations, including any delays incurred in move logic
average time an entityspent waiting for a destination location to have available capacity
average time an entity spent waiting for a resource or another entity (to join or combine); also includes time waiting in queue behind a blocked entity
average time an entity spent processing (i.e., WAIT or USE statements) at a location or traveling on a conveyor/queue.
151
9. ProModel – Auswertung des Simulationslaufs
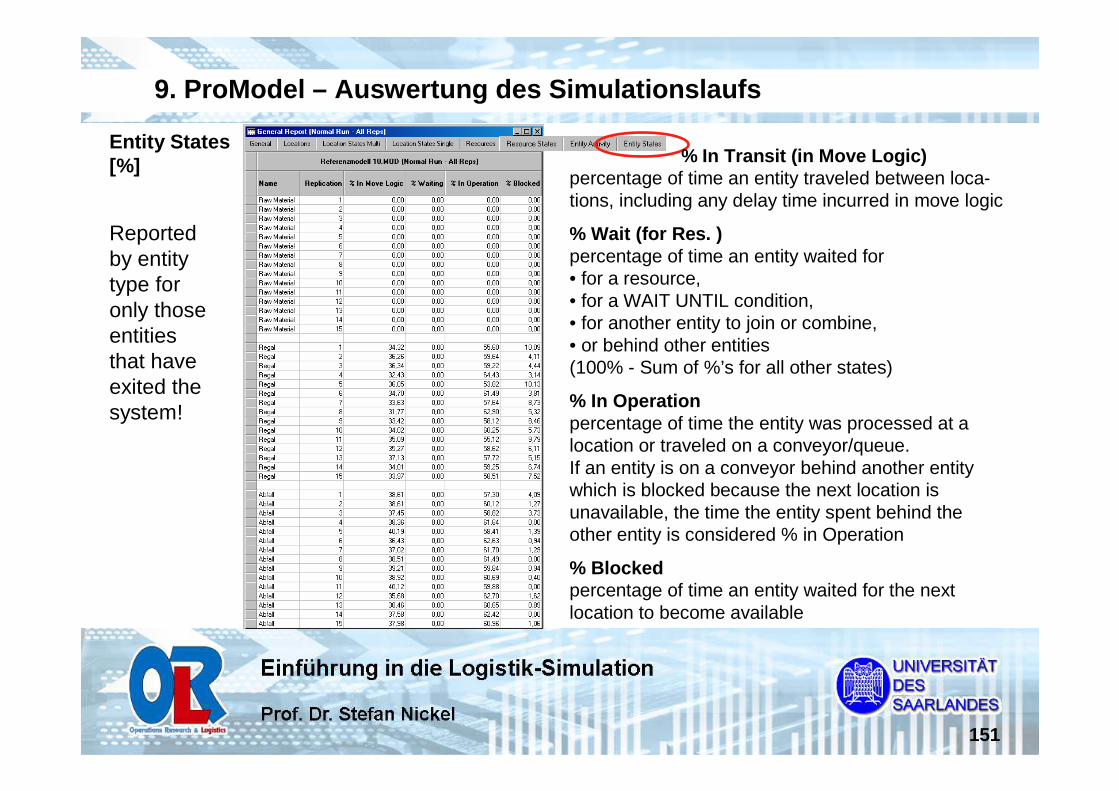
Entity States [%] % In Transit (in Move Logic)
percentage of time an entity traveled between loca-tions, including any delay time incurred in move logic
% Wait (for Res. )percentage of time an entity waited for • for a resource, • for a WAIT UNTIL condition, • for another entity to join or combine, • or behind other entities (100% - Sum of %’s for all other states)
% In Operation percentage of time the entity was processed at a location or traveled on a conveyor/queue. If an entity is on a conveyor behind another entity which is blocked because the next location is unavailable, the time the entity spent behind the other entity is considered % in Operation
% Blockedpercentage of time an entity waited for the next location to become available
Reportedby entitytype foronly thoseentitiesthat haveexited thesystem!
152
9. ProModel – Auswertung des Simulationslaufs
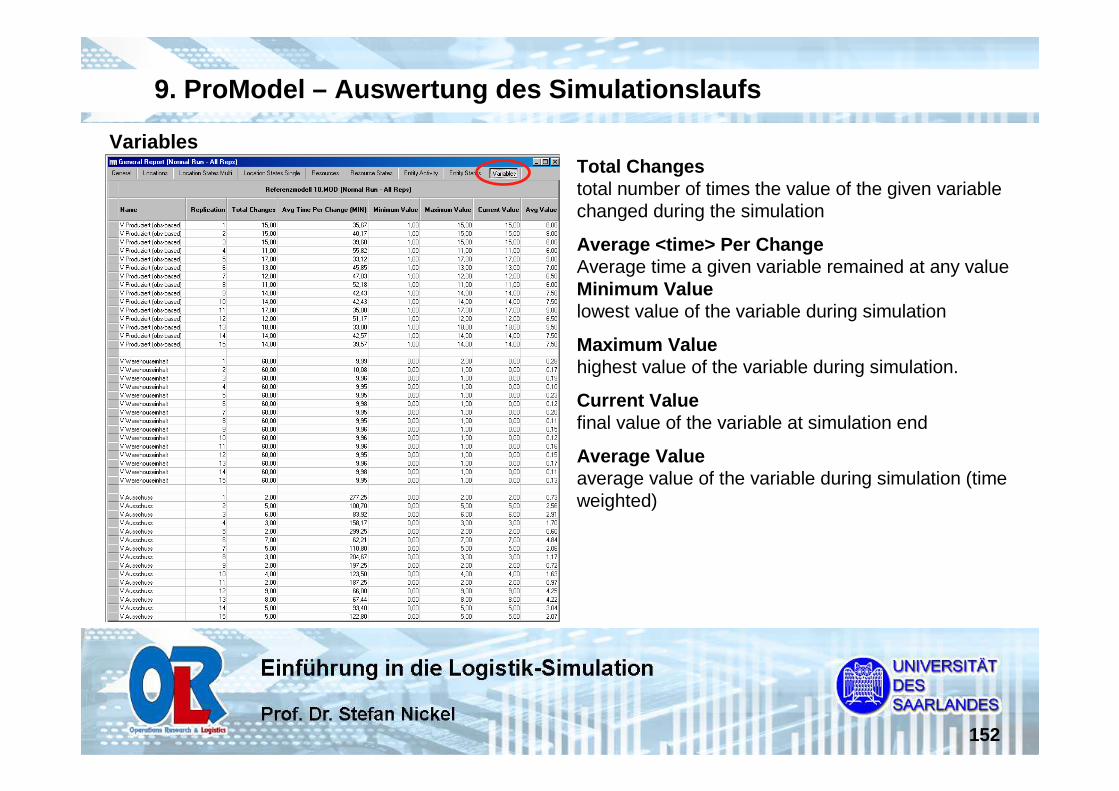
Total Changestotal number of times the value of the given variable changed during the simulation
Average <time> Per ChangeAverage time a given variable remained at any valueMinimum Valuelowest value of the variable during simulation
Maximum Valuehighest value of the variable during simulation.
Current Valuefinal value of the variable at simulation end
Average Valueaverage value of the variable during simulation (time weighted)
Variables

153
Auswertung des Simulationslaufs mittels General Report:
1.) Auslastung der Maschine 2, Mill und des Puffers
2.) Analyse der Auslastung des Puffers und somit die Beantwortung der Frage, ob der Puffer erforderlich ist
3.) Ressourcenauslastung der Gabelstapler
4.) Wie lange ist die Durchlaufzeit eines Regals von der Mill zur Verpackungsstation?
5.) Durchschnittliche Wartezeit der Entitites innerhalb des Puffers über alle Simulationsläufe (30)
Gemeinsames Beispiel „Schreinerei XIII“
9. ProModel – Auswertung des Simulationslaufs
![DBPIA-NURIMEDIAacml.gnu.ac.kr/download/Publications/28.pdf39 6 2011. 6 Navier-Stokes Eulerian Eulerian Bourgault [7] 01 FLUENT* FENSAP-ICE 3.1 Truncated Flapped Flapol Truncated Truncated](https://img.pdfslide.net/doc/110x75/6064d2c624aba96be8533943/dbpia-39-6-2011-6-navier-stokes-eulerian-eulerian-bourgault-7-01-fluent-fensap-ice.jpg)