Embed Size (px)
Citation preview

Global and regional decreases in tropospheric oxidants from
photochemical effects of aerosols
Randall V. Martin,1 Daniel J. Jacob, and Robert M. YantoscaDivision of Engineering and Applied Sciences, and Department of Earth and Planetary Sciences, Harvard University,Cambridge, Massachusetts, USA
Mian Chin2 and Paul Ginoux2
School of Earth and Atmospheric Sciences, Georgia Institute of Technology, Atlanta, Georgia, USA
Received 5 June 2002; revised 28 August 2002; accepted 28 August 2002; published 5 February 2003.
[1] We evaluate the sensitivity of tropospheric OH, O3, and O3 precursors tophotochemical effects of aerosols not usually included in global models: (1) aerosolscattering and absorption of ultraviolet radiation and (2) reactive uptake of HO2, NO2, andNO3. Our approach is to couple a global 3-D model of tropospheric chemistry (GEOS-CHEM) with aerosol fields from a global 3-D aerosol model (GOCART). Reactive uptakeby aerosols is computed using reaction probabilities from a recent review (gHO2 = 0.2,gNO2 = 10�4, gNO3 = 10�3). Aerosols decrease the O3 ! O(1D) photolysis frequency by5–20% at the surface throughout the Northern Hemisphere (largely due to mineral dust)and by a factor of 2 in biomass burning regions (largely due to black carbon). Aerosoluptake of HO2 accounts for 10–40% of total HOx radical (� OH + peroxy) loss in theboundary layer over polluted continental regions (largely due to sulfate and organiccarbon) and for more than 70% over tropical biomass burning regions (largely due toorganic carbon). Uptake of NO2 and NO3 accounts for 10–20% of total HNO3 productionover biomass burning regions and less elsewhere. Annual mean OH concentrationsdecrease by 9% globally and by 5–35% in the boundary layer over the NorthernHemisphere. Simulated CO increases by 5–15 ppbv in the remote Northern Hemisphere,improving agreement with observations. Simulated boundary layer O3 decreases by 15–45 ppbv over India during the biomass burning season in March and by 5–9 ppbv overnorthern Europe in August, again improving comparison with observations. We findthat particulate matter controls would increase surface O3 over Europe and other industrialregions. INDEX TERMS: 0305 Atmospheric Composition and Structure: Aerosols and particles (0345,
4801); 0345 Atmospheric Composition and Structure: Pollution—urban and regional (0305); 0360
Atmospheric Composition and Structure: Transmission and scattering of radiation; 0365 Atmospheric
Composition and Structure: Troposphere—composition and chemistry; KEYWORDS: aerosols, ozone,
heterogeneous chemistry, radiation, reactive uptake, OH
Citation: Martin, R. V., D. J. Jacob, R. M. Yantosca, M. Chin, and P. Ginoux, Global and regional decreases in tropospheric oxidants
from photochemical effects of aerosols, J. Geophys. Res., 108(D3), 4097, doi:10.1029/2002JD002622, 2003.
1. Introduction
[2] Understanding the radiative and heterogeneouschemical effects of aerosols on OH and O3, the maintropospheric oxidants, is a major issue for models of theoxidizing power of the atmosphere, radiative forcing, andsurface air quality. The importance of N2O5 hydrolysis inaerosols is well established [Heikes and Thompson, 1983;Dentener and Crutzen, 1993; Tie et al., 2001; Liao et al.,
2003] and is included in all current-generation globalmodels of tropospheric chemistry. Model calculations byDentener and Crutzen [1993] indicate that this reactionreduces global tropospheric O3 and OH by 9%. Otheraerosol effects have received far less study and are thefocus of this paper.[3] Scattering and absorption of ultraviolet (UV) radia-
tion by aerosols modifies photolysis rates [He and Carmi-chael, 1999; Liao et al., 1999]. Reactive heterogeneousuptake of HO2, NO2, and NO3 by aerosols may be impor-tant as well [Jacob, 2000]. Including these photochemicaleffects of aerosols in global models could help resolve somelong-standing discrepancies with measurements, such as theunderestimate of the CO background in the Northern Hemi-sphere [Hauglustaine et al., 1998; Lawrence et al., 1999;Bergamaschi et al., 2000, 2001; Bey et al., 2001a] and the
JOURNAL OF GEOPHYSICAL RESEARCH, VOL. 108, NO. D3, 4097, doi:10.1029/2002JD002622, 2003
1Now at Harvard-Smithsonian Center for Astrophysics, Cambridge,Massachusetts, USA.
2Also at NASA Goddard Space Flight Center, Greenbelt, Maryland,USA.
Copyright 2003 by the American Geophysical Union.0148-0227/03/2002JD002622$09.00
ACH 6 - 1

overestimate of O3 over India [Lal and Lawrence, 2001;Martin et al., 2002b].[4] Recent development of global simulations and obser-
vational databases for the major aerosol types (sulfate, blackcarbon, organic carbon, sea salt, and mineral dust) [Tegen etal., 1997; Takemura et al., 2000; Ghan et al., 2001; Chin etal., 2002; Chuang et al., 2002; Liao et al., 2003] facilitatesa more detailed investigation of the photochemical effects ofaerosols on tropospheric O3 and OH. We present here suchan investigation using a global 3-D model of troposphericchemistry (GEOS-CHEM). Section 2 describes the imple-mentation of aerosol photochemistry in GEOS-CHEM andsection 3 examines its implications. Section 4 compares theresults with observations for species and regions where theeffects are particularly large. Global budgets of O3 and OHare analyzed in section 5.
2. GEOS-CHEM Model
2.1. General Formulation
[5] The GEOS-CHEM model was initially described byBey et al. [2001a] and subsequent improvements aredescribed by Martin et al. [2002b]. We use here GEOS-CHEM version 4.26 (http://www-as.harvard.edu/chemistry/trop/geos/) with improved treatment of aerosol photochem-ical effects and a few other updates as described below. Themodel is driven by assimilated meteorological data from theGoddard Earth Observing System (GEOS) of the NASAData Assimilation Office (DAO) [Schubert et al., 1993].The meteorological data include 3-D fields updated every 3hours for surface fluxes and mixing depths and every 6hours for other relevant variables. We use for this study theGEOS data for 1996–1997, available with a resolution of 2�latitude by 2.5� longitude and 46 sigma levels in the verticalextending up to 0.1 hPa. For computational expedience wedegrade the horizontal resolution to 4� latitude by 5�longitude and merge the vertical levels above the lowerstratosphere, retaining a total of 26. There are five levelslocated below 2 km altitude (for a column based at sea level,these levels are centered at 50 m, 250 m, 600 m, 1100 m,and 1700 m).[6] The GEOS-CHEM model includes a detailed descrip-
tion of tropospheric O3-NOx-hydrocarbon chemistry. Itsolves the chemical evolution of about 120 species with aGear solver [Jacobson and Turco, 1994] and transports 24tracers. Photolysis frequencies are computed using the Fast-J radiative transfer algorithm [Wild et al., 2000] whichincludes Rayleigh scattering as well as Mie scattering byclouds and aerosols. Extensive evaluations of the GEOS-CHEM chemical fields with observations of troposphericO3 and its precursors in different regions of the world havebeen presented in a number of papers [e.g., Bey et al.,2001a, 2001b; Li et al., 2001, 2002a, 2002b; Palmer et al.,2001, 2003; Chandra et al., 2002; Fiore et al., 2002; Liu etal., 2003; Martin et al., 2002a, 2002b]. Observed monthlymean O3 concentrations in different regions of the tropo-sphere are usually reproduced to within 10 ppbv with noglobal bias, but there are some regional problems, mostprominently a 20–30 ppbv positive bias over India [Martinet al., 2002b]. The seasonal and interannual variability ofCO is well captured, but there is a general negative biasof 10–20 ppbv in the Northern Hemisphere. Consideration
of aerosol photochemical effects alleviates these discrep-ancies, as discussed in section 4.[7] The model version used here includes several updates
to the version presented by Martin et al. [2002b], inaddition to the aerosol effects described below. The mostimportant are updated reaction rates for organic peroxyradicals [Tyndall et al., 2001], updated CO emissions(B.N. Duncan et al., Model study of the variability andtrends of carbon monoxide (1988–1997), 1, Model formu-lation, evaluation, and sensitivity, manuscript in preparation,2002), and updated acetone emissions [Jacob et al., 2002].Also, surface emissions of trace gases are now distributedvertically in the unstable mixed layer (which can vary fromless than 100 m at night to over 2000 m during the day) tominimize numerical artifacts from operator splitting (1-hourtime steps between chemistry and transport).
2.2. Aerosol Radiative and Chemical Effects
[8] Previous versions of GEOS-CHEM have includedheterogeneous reactions of HO2, NO2, NO3, and N2O5 insulfate aerosols [Bey et al., 2001a], and more recently thesesame reactions as well as radiative effects have beenincluded for mineral dust aerosols [Martin et al., 2002b].We include here a more comprehensive treatment of thephotochemical effects of aerosols. To this end we use global3-D monthly mean fields for 1996–1997 of dry aerosolmass from the GOCART model [Chin et al., 2000a, 2000b,2002; Ginoux et al., 2001] which uses the same GEOSmeteorological fields and transport algorithms as GEOS-CHEM. The GOCART data include sulfate, size-resolvedmineral dust and sea salt, hydrophobic and hydrophilicblack carbon, as well as hydrophobic and hydrophilicorganic carbon. Nitrate aerosol is not included.[9] As described in detail elsewhere [Chin et al., 2000a,
2002; Ginoux et al., 2001], the GOCART model sulfatesimulation includes oxidation of SO2 emitted from indus-trial activity, biomass burning, biofuel, volcanic eruptions,and formed from dimethylsulfide (DMS) released from theocean, as well as a small direct sulfate source. Oxidationrates in the GOCART model are calculated with offlinefields of OH and aqueous H2O2. Organic and black carbonare emitted directly from biomass burning and industrialactivity, with 80% of black carbon and 50% of organiccarbon emitted as hydrophobic, the rest being hydrophilic.Organic carbon is also formed from volatile organic com-pounds. Hydrophobic carbonaceous aerosols age to becomehydrophilic with an e-folding time of 1.2 days. Mineral dustemission is calculated as a function of the local probabilityof bare sediments, surface wind speed, and surface wetness.Sea-salt emission is calculated as a function of surface windspeed. All aerosols are subject to dry deposition and hydro-philic aerosols to wet deposition.[10] Simulation of the radiative and chemical effects of
aerosols requires information on the relative humidity (RH)dependent aerosol size distribution. We obtain this informa-tion from Ginoux et al. [2001] for mineral dust, and fromthe Global Aerosol Data Set (GADS) [Kopke et al., 1997]and Chin et al. [2002] for other aerosols, and apply it tolocal RH from the GEOS fields. Table 1 shows the hygro-scopic growth factors and Table 2 shows the effective radiusre at 70% humidity. The effective radius is defined asRrpr
3f (r)dr/Rrpr
2f (r)dr, where f (r) is the fraction of par-
ACH 6 - 2 MARTIN ET AL.: PHOTOCHEMICAL EFFECTS OF AEROSOLS

ticles with radius between r and r + dr [Hansen and Travis,1974]. We cap aerosol growth above 90% RH; hygroscopicgrowth is very nonlinear at higher RH and cannot beadequately resolved in the GEOS fields because of sub-grid-scale variability, especially associated with clouds.[11] Calculation of the radiative effects of aerosols also
requires information on the wavelength-dependent complexrefractive index. We obtain this information from Pattersonet al. [1977] for mineral dust, and for other aerosols as afunction of RH from GADS. We assume an externalmixture of the different aerosol types. Posfai et al. [1999]found that soot and sulfate aerosols are often internallymixed; Liao et al. [1999] calculated that the absorbing effectof aerosols on photolysis frequencies is 5–15% larger forinternally versus externally mixed sulfate-soot aerosols. Amore physically realistic treatment of mixed sulfate-sootaerosols as a black carbon core surrounded by sulfate wouldhave an intermediate effect [Jacobson, 2000].[12] We use a Mie algorithm [de Rooij and van der Stap,
1984; Mishchenko et al., 1999] to calculate for each aerosoltype the single scattering albedo, the extinction efficiency,and the first eight terms in the Legendre expansion of thephase function, for input to the Fast-J radiative transfer codeof Wild et al. [2000]. We tabulate the optical properties atthe RH values in Table 1, and interpolate in the simulation.Table 2 shows the resulting optical properties at 0.4 mm and70% RH. Sulfate and sea salt are purely scattering, blackcarbon is strongly absorbing, and organic carbon is moder-ately absorbing at UV and visible wavelengths. Organiccarbon aerosols could be highly absorbing in the UV if theycontain chromophore functional groups [Jacobson, 1999],but this is not considered here. Mineral dust is stronglyabsorbing in the UV and moderately absorbing at visiblewavelengths. The extinction efficiencies of black carbon,organic carbon, and sulfate are about 20–60% larger at 300nm than at 400 nm. The extinction efficiencies of super-micron mineral dust and sea-salt particles exhibit littlewavelength sensitivity at UV and visible wavelengths.[13] We calculate the aerosol optical depth locally in the
model from the mass concentration, extinction efficiency,and particle mass density for each particle type and wave-length. Figure 1 shows the modeled aerosol optical depth at400 nm during March and August. Extensive evaluation ofthe GOCART fields with in situ, ground based, and satelliteobservations have been presented in a number of papers[Chin et al., 2000b, 2002; Ginoux et al., 2001; Penner et al.,
2001; S. Kinne et al., Monthly averages of aerosol proper-ties: A global comparison among models, satellite data andAERONET ground data, submitted to Journal of Geophys-ical Research, 2002]. The GOCART aerosol fields aregenerally consistent with observations to within a factorof 2. Mineral dust and sulfate dominate the backgroundoptical depth in the Northern Hemisphere. Mineral dustoptical depth reaches a seasonal maximum during borealsummer, associated with surface cyclones that erode par-ticles from topographic depressions in desert regions andwith intense solar heating that transports particles into thefree troposphere through dry convection [Ginoux et al.,2001]. The mineral dust optical depth of greater than 0.5over much of northern Africa during summer is consistentwith measurements from AERONET [Holben et al., 2001]and retrievals from TOMS [Torres et al., 2002], as shownby Ginoux et al. [2001] and Chin et al. [2002]. Mineral dustover the tropical Pacific is biased high by a factor of 2–5[Ginoux et al., 2001]. Sulfate optical depth is maximumduring summer due to higher SO2 oxidation rates, and ismost important over the eastern United States, eastern Asia,and Europe [Chin et al., 2000a, 2000b]. Modeled sulfateconcentrations over the eastern United States are a factor of1.5 lower than observations from the Eulerian ModelEvaluation Field Study (EMEFS) [Chin et al., 2000b].Black and organic carbon aerosols from biomass burningcontribute to seasonal enhancements in optical depth overSouth Asia during March and southern Africa duringAugust [Kuhlbusch et al., 1996; Chowdhury et al., 2001;Holben et al., 2001; Leon et al., 2001]. The GOCARTmodel optical depths are generally within 0.3 of AERONETmeasurements over African biomass burning regions, butare about 2–3 times lower than AERONET measurementsover the biomass burning region of South America [Chin etal., 2002]. Black carbon is also notable over northernEurope (diesel engines) and East Asia (biofuels). Sea-salt
Table 1. Hygroscopic Growth Factors for Aerosolsa
RH, %
0 50 70 80 90
Sulfate 1.0 1.4 1.5 1.6 1.9Black carbonb 1.0 1.0 1.0 1.2 1.4Organic carbonb 1.0 1.2 1.4 1.5 1.7Sea salt 1.0 1.6 1.8 2.0 2.4Mineral dustc 1.0 1.0 1.0 1.0 1.0
aThe hygroscopic growth factor is the ratio of the wet to the dry effectiveradius.
bThese are values for hydrophilic aerosols. There is no hygroscopicgrowth for hydrophobic carbon aerosols.
cDust particles are sufficiently large, and their hygroscopicity sufficientlylow, that hygroscopic growth is considered negligible [Li-Jones et al.,1998].
Table 2. Aerosol Optical Properties at 0.4 mm Wavelength (RH =
70%)a
Aerosol Type Density, g cm�3 re, mm Refractive Index vo Q
Sulfate 1.7 0.24 1.36–10�8i 1.00 1.95Black carbon 1.0 0.04 1.75–0.46i 0.27 0.76Organic carbon 1.8 0.10 1.42–0.002i 0.98 0.74Sea saltb
Accumulation 2.2 1.3 1.37–10�8i 1.00 2.43Coarse 2.2 10.1 1.37–10�8i 1.00 2.09
Mineral dustb
0.1–0.18 mm 2.5 0.15 1.58–0.014i 0.94 2.480.18–0.3 mm 2.5 0.25 1.58–0.014i 0.91 3.100.3–0.6 mm 2.5 0.4 1.58–0.014i 0.86 2.820.6–1 mm 2.5 0.8 1.58–0.014i 0.76 2.431–1.8 mm 2.65 1.5 1.58–0.014i 0.68 2.271.8–3 mm 2.65 2.5 1.58–0.014i 0.62 2.193–6 mm 2.65 4.0 1.58–0.014i 0.58 2.14aEffective radius re, single scattering albedovo, and extinction efficiency
Q are calculated using refractive index and lognormal size distribution dataavailable from the Global Aerosol Data Set (GADS) [Kopke et al., 1997]and Chin et al. [2002] with the following exceptions. We use a geometricstandard deviation of 2.0 for all aerosol types except mineral dust. Thecalculations for mineral dust use complex refractive indices from Pattersonet al. [1977], and assume a standard gamma particle size distribution witheffective variance of 0.2.
bSize ranges were resolved in the GOCART simulation and used as inputto GEOS-CHEM.
MARTIN ET AL.: PHOTOCHEMICAL EFFECTS OF AEROSOLS ACH 6 - 3

optical depths are highest near ±60� where strong surfacewinds increase emissions [Gong et al., 1997].[14] We implement heterogeneous chemistry on aerosol
surfaces in GEOS-CHEM following a standard reactionprobability formulation. We neglect heterogeneous chemis-try in clouds which would be difficult to constrain in ourcoarse resolution model; its effect on O3 and OH is limitedin any case by the small fraction of atmospheric volumeoccupied by clouds [Liang and Jacob, 1997]. As pointedout by Jacob [2000] it is the atmospheric volume fractionoccupied by clouds, rather than the frequency of cloudprocessing, that limits the effect of cloud chemistry on theglobal budgets of O3 and OH.
[15] In the reaction probability formulation, the rateconstant k for chemical loss of a gas with mean molecularspeed v and gas-phase molecular diffusion coefficient Dg onan aerosol of particle radius a is given by
k ¼ a
Dg
þ 4
ng
� ��1
A ð1Þ
where g is the reaction probability, i.e., the probability that amolecule impacting the aerosol surface undergoes reaction[Ravishankara, 1997], and A is the aerosol surface areaper unit volume of air. We calculate Dg as a function of
Figure 1. Modeled monthly mean optical depth at 400 nm of different aerosol types for March 1997(left column) and August 1997 (right column). Values are calculated from mass concentration fields fromGinoux et al. [2001] for mineral dust and from Chin et al. [2002] for the other aerosol types. See colorversion of this figure at back of this issue.
ACH 6 - 4 MARTIN ET AL.: PHOTOCHEMICAL EFFECTS OF AEROSOLS

molecular weight, temperature, and air density followingDentener [1993]. We include the four heterogeneousreactions HO2 ! 0.5 H2O2, NO2 ! 0.5 HONO + 0.5HNO3, NO3 ! HNO3, and N2O5 ! 2 HNO3 with reactionprobabilities of 0.2, 10�4, 10�3, and 0.1, respectively, asrecommended by Jacob [2000]. The products have longlifetimes relative to the timescales for gas-particle exchangeand are therefore released into the gas phase. Uptake of NO2
on dry dust surfaces may be less (10�6–10�4) [Grassian,2001], but the phase of mineral dust surfaces in theatmosphere is unclear [Martin, 2000]. For the range of reand g values used here, the chemical rate constant k may belimited either by free molecular collision (4/vg term inequation (1)) or by diffusion (a/Dg term). Figure 2 showsthe aerosol surface area in the lower troposphere (�600 m).The spatial distribution is similar to that of optical depth butfeatures stronger maxima in regions where submicronaerosols dominate.[16] We do not include reactive uptake of O3 by aerosols,
for which Jacob [2000] cites no conclusive laboratory orfield evidence. Dentener et al. [1996] postulated directuptake of O3 by dust with an assumed g03 of 10�4–10�5
based on analogy with measured O3 deposition to bare soil.However, O3 deposition to soil most likely involves reactionwith unsaturated organics. Laboratory measurements showthat O3 uptake by organic aerosol surfaces is rapidlyquenched as surface reaction sites are oxidized [Moiseand Rudich, 2000]. Recent laboratory measurements ondry mineral dust surfaces reveal g03 � 10�5 with noapparent surface saturation, but with a factor of 2–3decrease over several hours of exposure [Michel et al.,2002]. A model study of an African dust layer over theAtlantic by De Reus et al. [2000] indicates that reactiveuptake of O3 (g = 5 10�5) would reduce simulated O3
concentrations in the layer by 11 ppbv, improving agree-
ment with observations. Further work is evidently neededon this issue.[17] We also do not include reactive uptake of CH3O2,
HCHO, HNO3, or H2O2 by aerosols. Current evidence isthat uptake of CH3O2 and HCHO is too slow to be ofatmospheric significance [Jacob, 2000]. Uptake of HNO3
by alkaline dust particles is important for the partitioning ofHNO3 between the aerosol and gas phase, but should havelittle impact on oxidant concentrations since both HNO3(g)and nitrate aerosols are removed by wet deposition. De Reuset al. [2000] calculated that uptake of HNO3 had a large roleonly if the HNO3 in the aerosol phase was not permitted toregenerate NOx through photolysis. Uptake of H2O2, ifdetermined by reaction with SO2, is significant only inclouds and has little overall effect on HOx [Tie et al., 2001].[18] We use a March 1996 to August 1997 simulation
period. The first 6 months are used to achieve properinitialization and we present results for September 1996 toAugust 1997. Biomass burning emissions for that period arespecified from satellite observations [Duncan et al., 2003](the large fires in Oceania associated with El Nino have notyet begun). The standard simulation is as described above.A sensitivity simulation is conducted that excludes both theradiative effects of aerosols and the heterogeneous uptake ofHO2, NO2, and NO3 (but retains the uptake of N2O5).Additional simulations focused on the effects of mineraldust for the same time period were presented by Martin etal. [2002b]. We also perform 1-month sensitivity simula-tions (following a 1-month spin-up) for March and August1997 to compare the relative importance of radiative andchemical effects of aerosols.
3. Photochemical Effects of Aerosols
[19] Figure 3 shows that aerosols reduce UV photolysisfrequencies near the surface throughout a large part of theworld. The noontime O3 ! O(1D) photolysis frequency,J(O(1D)) (300–320 nm), decreases by more than 5% overmost of the Northern Hemisphere, largely due to mineral
Figure 2. Modeled monthly mean total aerosol surface areain the lower troposphere (�600 m above the surface) forMarch and August 1997. Values are calculated from massconcentration fields from Ginoux et al. [2001] for mineraldust and from Chin et al. [2002] for the other aerosol types.See color version of this figure at back of this issue.
Figure 3. Sensitivity to aerosols of the O3 ! O(1D)photolysis frequency (J(O(1D))) in surface air. Values aremonthly mean model results for March and August 1997.See color version of this figure at back of this issue.
MARTIN ET AL.: PHOTOCHEMICAL EFFECTS OF AEROSOLS ACH 6 - 5

dust. The effect on J(NO2) (340–400 nm) is similar to thaton J(O(1D)) and about 10% weaker. Removing sulfate fromthe aerosol mixture generally causes a slight increase (<2%)in J(O(1D)) relative to the standard simulation near thesurface; 1-D calculations by Liao et al. [1999] similarlyshowed that in the presence of absorbing aerosols, sulfateaerosols have a small effect on photolysis frequencies.Mineral dust reduces J(O(1D)) by 15–30% over and down-wind of northern Africa throughout the year [Martin et al.,2002b]. Black carbon causes most of the 15–25% decreasein J(O(1D)) over northern Europe during August. Aerosolsfrom biomass burning and other sources in the GangesValley reduce J(O(1D)) near the surface by a factor of 2,largely due to black carbon with smaller contributions fromorganic carbon and mineral dust. Similar features areobserved over southern Africa during August. The reduc-tion in photolysis frequencies may be 5–15% greater forinternally mixed aerosols than for the external mixtureassumed here [Liao et al., 1999]. Measurements ofJ(O(1D)) over the northern Indian Ocean during Marchshowed reductions of 40% due to absorbing aerosols (J.Burkert et al., Trace gas and radical diurnal behavior in themarine boundary layer during INDOEX 1999, submitted toJournal of Geophysical Research, 2002), consistent with theresults presented here.[20] Heterogeneous chemistry also contributes to the
photochemical effects of aerosols. Figure 4 shows thefraction of total HOx loss in the lower troposphere (�600m altitude) contributed by aerosol uptake of HO2. Here wedefine total HOx loss as the sum of the main loss pathways[Frost et al., 1998; Jaegle et al., 2001]: 2(OH + HO2) +2(HO2 + HO2) + 2(HO2 + CH3O2) + (NO2 + OH) +2(HNO4 + OH) + aerosol uptake of HO2. Aerosols areresponsible for more than 70% of HOx loss over biomassburning regions. The abundance of fine aerosol over bio-mass burning regions [Anderson et al., 1996] and industrialregions [ten Brink et al., 1997] leads to high aerosol surfacearea and rapid gas-particle mass transfer (this transfer is not
diffusion-limited, unlike with supermicron particles). Aero-sol uptake of HO2 is responsible for over 50% of HOx lossover Eastern Europe during August, due to high surfaceareas from organic carbon (anthropogenic and biogenic) andsulfate, both of which peak in the summer. Black carbonconstitutes less than 20% of total surface area over EasternEurope, despite playing a dominant role in the reduction ofphotolysis rates. Uptake of HO2 by aerosols accounts forover 20% of HOx loss over much of northern Africa, theAtlantic Ocean, and Asia, and over 50% of HOx loss in theArctic during March.[21] Figure 5 shows the fraction of total NOx loss to
HNO3 contributed by aerosol uptake of NO2 and NO3 in thelower troposphere for March and August. This fraction is15–30% in regions with high concentrations of biomassburning, mineral dust, and sea-salt aerosols. Over land,heterogeneous NOx loss is mainly NO2 uptake. Overoceans, uptake of NO2 and NO3 have comparable roles.We do not include reaction of NO3 with marine DMS in themodel, and as a result may exaggerate the importance ofNO3 heterogeneous uptake over the oceans.[22] We examine the vertical distribution of the photo-
chemical effects of aerosols over two regions where theeffects are large: during March over India where carbona-ceous aerosols are particularly important and during Augustover the Sahara where mineral dust dominates. The verticalprofile of the radiative effect is shown in the top panels ofFigure 6. The effect decreases rapidly with altitude follow-ing the distribution of aerosols. The small enhancement inJ(NO2) in the upper troposphere over India results fromscattering by aerosols below. The middle panels of Figure 6show the vertical profiles of the chemical effect of aerosols.Uptake of HO2 on aerosol surfaces is responsible for about80% of HOx loss through the depth of the boundary layerover India, and 20–40% of HOx loss throughout most of thetroposphere over the Sahara. Almost 20% of the HNO3
production in the boundary layer over India results fromuptake of NO2 by aerosols. The bottom panels in Figure 6show that over India the radiative and chemical properties
Figure 4. Fraction of total HOx loss in the lowertroposphere (�600 m above the surface) contributed byuptake of HO2 by aerosols. Values are monthly mean modelresults for March and August 1997. See color version of thisfigure at back of this issue.
Figure 5. Fraction of total HNO3 production in the lowertroposphere (�600 m above the surface) contributed byuptake of NO2 and NO3 by aerosols. Values are monthlymean model results for March and August 1997. See colorversion of this figure at back of this issue.
ACH 6 - 6 MARTIN ET AL.: PHOTOCHEMICAL EFFECTS OF AEROSOLS

of aerosols have comparable effects on OH near the surface,but chemical effects dominate at higher altitudes where theoverhead aerosol column is smaller. Over the Sahara theradiative effects of mineral dust are about twice as importantas the chemical effects, reflecting the absorbing nature ofmineral dust at UV wavelengths [Sokolik et al., 1993] andthe large size of the dust particles.[23] Figure 7 shows the combined photochemical effects
of aerosols on OH, CO, NOx, and O3 concentrations inMarch. Here we compare the standard simulation to asimulation excluding radiative effects of aerosols and theheterogeneous reactions of HO2, NO2, and NO3 (hydrolysisof N2O5 is included in both simulations). The top panelshows that OH is reduced by 25–50% over northern Africaand South Asia, largely due to mineral dust, organic carbon,and black carbon. Over northern India near Calcutta, OHdecreases by a factor of 4 reflecting comparable contribu-tions from radiative and chemical effects. Over much of theNorthern Hemisphere OH concentrations decrease by 5–
25%; about half of this decrease is from the radiative effectsof mineral dust. The depletion of OH increases the lifetimeof CO and other trace gases such as NOx and non-methanehydrocarbons, increasing their export from regions of emis-sions. As a result, CO increases by 5–15 ppbv (5–10%)throughout much of the Northern Hemisphere, with localincreases downwind of biomass burning regions of 20–75 ppbv (10–15%). Ship and aircraft measurements duringthe March winter monsoon found elevated CO concentra-tions in the marine boundary layer off the coast of India[Rhoads et al., 1997; Lelieveld et al., 2001]; our analysissuggests that depletion of OH by aerosols contributed to theobserved enhancement. Over the tropical Atlantic down-wind of the Sahara, CO increases by 10–20 ppbv (7–13%).[24] The photochemical effects of aerosols generally
result in a slight increase of NOx over continental regionsdue to OH depletion. Over the oceans the effect is moreoften a slight decrease (up to 20%) as NO2 and NO3 uptakeare relatively more important (Figure 5). The bottom panel
Figure 6. Photochemical effects of aerosols over India and the Sahara. Values are monthly mean modelresults. (top) Effects on J(O(1D)) and J(NO2). (middle) Fraction of total HOx loss contributed by aerosoluptake of HO2 and the fraction of total HNO3 production contributed by aerosol uptake of NO2 and NO3.(bottom) Effect of these radiative and heterogeneous processes on OH concentration as determined bydifference with simulations that did not include either or both of these processes.
MARTIN ET AL.: PHOTOCHEMICAL EFFECTS OF AEROSOLS ACH 6 - 7

shows that the effect on O3 is confined largely to regionswith intense emissions of both aerosols and O3 precursors.Ozone is reduced by 10–40% or 15–45 ppbv over anddownwind of the biomass burning region of northern Indiaduring March. Ozone also is reduced by 5–10 ppbv (10–15%) over northeastern China and the Yellow Sea, a regionwhere industrial activity is collocated with high aerosolloading from anthropogenic and mineral dust aerosols[Zhang et al., 1994; Zhang and Carmichael, 1999]. Phadnisand Carmichael [2000] previously used a regional 3-D
model to calculate a reduction in boundary layer O3 ofabout 5% over the region during May due to uptake ofHO2 (g = 0.1), H2O2 (g = 0.1), N2O5 (g = 0.1), and HNO3
(g = 0.1) on mineral dust.[25] Figure 8 shows the same results but for August. The
top panel shows that OH is reduced by 25–40% overEurope, largely from the radiative and chemical effects ofsulfate, black carbon, and organic carbon. Similar reduc-tions in OH over northern Africa and parts of Asia occurprimarily from the radiative effects of mineral dust. About
Figure 7. Changes in OH, CO, NOx, and O3 concentrations in the lower troposphere (�600 m abovethe surface) from scattering and absorption by aerosols, and from uptake of HO2, NO2, and NO3 byaerosols, as determined by difference with a simulation that did not include these effects. Values aremodel monthly means during March. White circles show the locations of observations compared to themodel in section 4. Also shown is the change in the CO flux due to the above aerosol effects. See colorversion of this figure at back of this issue.
ACH 6 - 8 MARTIN ET AL.: PHOTOCHEMICAL EFFECTS OF AEROSOLS

half of the reduction of 5–25% over most of the NorthernHemisphere is from the radiative effects of mineral dust.Concentrations of CO increase by 5–10 ppbv throughoutmuch of the Northern Hemisphere, with local increases ofmore than 10 ppbv over Europe and the Mediterranean.Concentrations of NOx generally increase by less than 10%,with local increases of up to 30% over Europe, and localdecreases of up to 20% over tropical oceans. As for Marchthe effect on O3 is localized to photochemically activeregions where aerosols are collocated with anthropogenicemissions of O3 precursors. Aerosols reduce O3 in the
boundary layer by 5–9 ppbv over northern Europe duringAugust 1997. We find a smaller reduction in July 1997 (3–5 ppbv) due to lower aerosol loadings, which in the modelare due to higher precipitation. The photochemical effects ofaerosols are smaller over the eastern United States whereconcentrations of absorbing aerosols are lower. The com-bined photochemical effects of aerosols decrease O3 in theboundary layer over the eastern United States by up to3 ppbv and over East Asia by up to 5 ppbv.[26] Comparison of our results with previous global
model studies of sensitivity to aerosol photochemistry is
Figure 8. As in Figure 7, but for August. See color version of this figure at back of this issue.
MARTIN ET AL.: PHOTOCHEMICAL EFFECTS OF AEROSOLS ACH 6 - 9
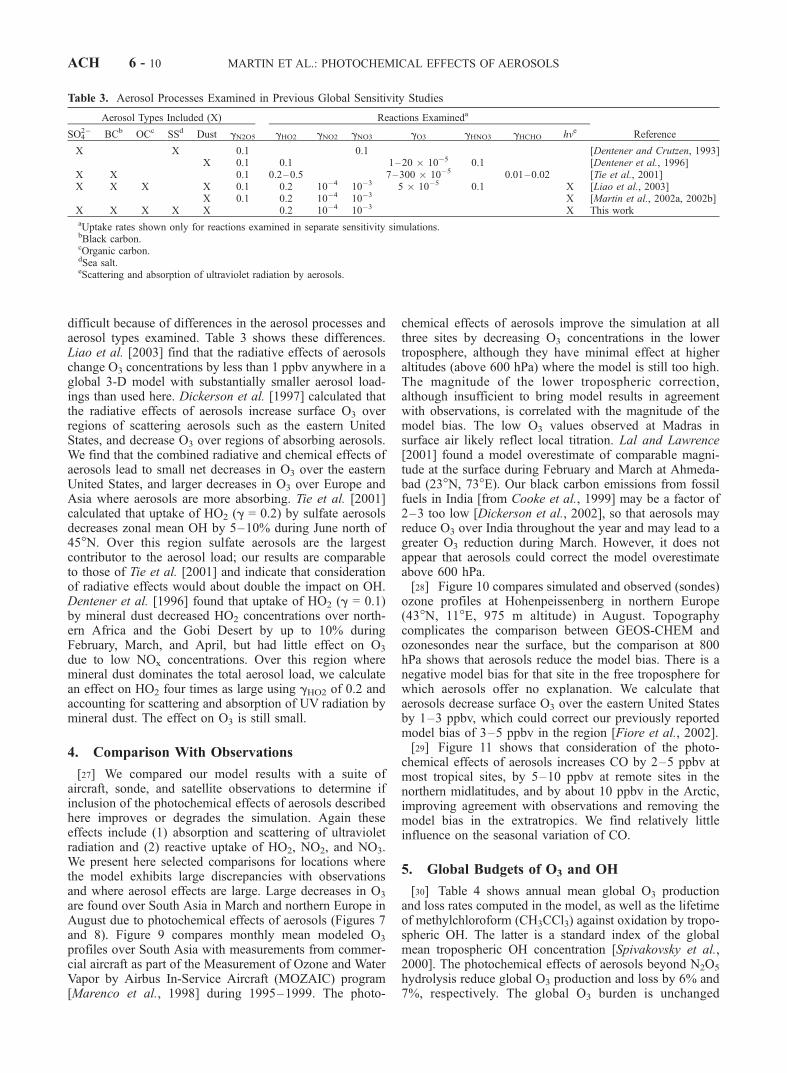
difficult because of differences in the aerosol processes andaerosol types examined. Table 3 shows these differences.Liao et al. [2003] find that the radiative effects of aerosolschange O3 concentrations by less than 1 ppbv anywhere in aglobal 3-D model with substantially smaller aerosol load-ings than used here. Dickerson et al. [1997] calculated thatthe radiative effects of aerosols increase surface O3 overregions of scattering aerosols such as the eastern UnitedStates, and decrease O3 over regions of absorbing aerosols.We find that the combined radiative and chemical effects ofaerosols lead to small net decreases in O3 over the easternUnited States, and larger decreases in O3 over Europe andAsia where aerosols are more absorbing. Tie et al. [2001]calculated that uptake of HO2 (g = 0.2) by sulfate aerosolsdecreases zonal mean OH by 5–10% during June north of45�N. Over this region sulfate aerosols are the largestcontributor to the aerosol load; our results are comparableto those of Tie et al. [2001] and indicate that considerationof radiative effects would about double the impact on OH.Dentener et al. [1996] found that uptake of HO2 (g = 0.1)by mineral dust decreased HO2 concentrations over north-ern Africa and the Gobi Desert by up to 10% duringFebruary, March, and April, but had little effect on O3
due to low NOx concentrations. Over this region wheremineral dust dominates the total aerosol load, we calculatean effect on HO2 four times as large using gHO2 of 0.2 andaccounting for scattering and absorption of UV radiation bymineral dust. The effect on O3 is still small.
4. Comparison With Observations
[27] We compared our model results with a suite ofaircraft, sonde, and satellite observations to determine ifinclusion of the photochemical effects of aerosols describedhere improves or degrades the simulation. Again theseeffects include (1) absorption and scattering of ultravioletradiation and (2) reactive uptake of HO2, NO2, and NO3.We present here selected comparisons for locations wherethe model exhibits large discrepancies with observationsand where aerosol effects are large. Large decreases in O3
are found over South Asia in March and northern Europe inAugust due to photochemical effects of aerosols (Figures 7and 8). Figure 9 compares monthly mean modeled O3
profiles over South Asia with measurements from commer-cial aircraft as part of the Measurement of Ozone and WaterVapor by Airbus In-Service Aircraft (MOZAIC) program[Marenco et al., 1998] during 1995–1999. The photo-
chemical effects of aerosols improve the simulation at allthree sites by decreasing O3 concentrations in the lowertroposphere, although they have minimal effect at higheraltitudes (above 600 hPa) where the model is still too high.The magnitude of the lower tropospheric correction,although insufficient to bring model results in agreementwith observations, is correlated with the magnitude of themodel bias. The low O3 values observed at Madras insurface air likely reflect local titration. Lal and Lawrence[2001] found a model overestimate of comparable magni-tude at the surface during February and March at Ahmeda-bad (23�N, 73�E). Our black carbon emissions from fossilfuels in India [from Cooke et al., 1999] may be a factor of2–3 too low [Dickerson et al., 2002], so that aerosols mayreduce O3 over India throughout the year and may lead to agreater O3 reduction during March. However, it does notappear that aerosols could correct the model overestimateabove 600 hPa.[28] Figure 10 compares simulated and observed (sondes)
ozone profiles at Hohenpeissenberg in northern Europe(43�N, 11�E, 975 m altitude) in August. Topographycomplicates the comparison between GEOS-CHEM andozonesondes near the surface, but the comparison at 800hPa shows that aerosols reduce the model bias. There is anegative model bias for that site in the free troposphere forwhich aerosols offer no explanation. We calculate thataerosols decrease surface O3 over the eastern United Statesby 1–3 ppbv, which could correct our previously reportedmodel bias of 3–5 ppbv in the region [Fiore et al., 2002].[29] Figure 11 shows that consideration of the photo-
chemical effects of aerosols increases CO by 2–5 ppbv atmost tropical sites, by 5–10 ppbv at remote sites in thenorthern midlatitudes, and by about 10 ppbv in the Arctic,improving agreement with observations and removing themodel bias in the extratropics. We find relatively littleinfluence on the seasonal variation of CO.
5. Global Budgets of O3 and OH
[30] Table 4 shows annual mean global O3 productionand loss rates computed in the model, as well as the lifetimeof methylchloroform (CH3CCl3) against oxidation by tropo-spheric OH. The latter is a standard index of the globalmean tropospheric OH concentration [Spivakovsky et al.,2000]. The photochemical effects of aerosols beyond N2O5
hydrolysis reduce global O3 production and loss by 6% and7%, respectively. The global O3 burden is unchanged
Table 3. Aerosol Processes Examined in Previous Global Sensitivity Studies
Aerosol Types Included (X) Reactions Examineda
ReferenceSO42� BCb OCc SSd Dust gN2O5 gHO2 gNO2 gNO3 gO3 gHNO3 gHCHO hve
X X 0.1 0.1 [Dentener and Crutzen, 1993]X 0.1 0.1 1–20 10�5 0.1 [Dentener et al., 1996]
X X 0.1 0.2–0.5 7–300 10�5 0.01–0.02 [Tie et al., 2001]X X X X 0.1 0.2 10�4 10�3 5 10�5 0.1 X [Liao et al., 2003]
X 0.1 0.2 10�4 10�3 X [Martin et al., 2002a, 2002b]X X X X X 0.2 10�4 10�3 X This workaUptake rates shown only for reactions examined in separate sensitivity simulations.bBlack carbon.cOrganic carbon.dSea salt.eScattering and absorption of ultraviolet radiation by aerosols.
ACH 6 - 10 MARTIN ET AL.: PHOTOCHEMICAL EFFECTS OF AEROSOLS

because the large regional decreases in boundary layer O3
are compensated by small increases throughout the tropicaltroposphere. The global O3 production and loss ratescalculated here are still at the high end of the currentgeneration of global 3-D models, an issue discussed byBey et al. [2001a]. Other models, including an earliergeneration of our model [Wang et al., 1998], indicate globalproduction rates in the range 3300–4550 Tg yr�1 andglobal chemical loss rates in the range 2500–4100 yr�1
[World Meteorological Organization, 1998; Lelieveld andDentener, 2000]. Our higher values relative to Wang et al.
[1998] reflect more accurate treatment of radiative transferthrough clouds [Wild et al., 2000], as discussed by Bey et al.[2001a].[31] Dentener and Crutzen [1993] previously found that
N2O5 hydrolysis decreases the global mean troposphericOH concentration (as measured by the lifetime of CH3CCl3)by 9%. We find here that the additional photochemicaleffects of aerosols globally decrease OH by an additional9%. The radiative effects of mineral dust explain 60% ofthis decrease. The OH decrease is much larger in theNorthern Hemisphere (13%) than the Southern Hemisphere(4%). The resulting global CH3CCl3 lifetime of 5.6 yearsagainst oxidation by tropospheric OH is consistent withestimates from observations of 5.7 ± 0.7 years [Spivakovskyet al., 2000] and 6.0 (+1.0, �0.7) years [Prinn et al., 2001].
6. Conclusions
[32] We have evaluated the sensitivity of troposphericOH, O3, and O3 precursors to aerosol effects not usuallyincluded in global models: (1) aerosol scattering andabsorption of ultraviolet radiation and (2) reactive uptakeof HO2, NO2, and NO3. We used for this purpose a global3-D model of tropospheric chemistry (GEOS-CHEM) withspecified global 3-D fields of sulfate, black carbon, organiccarbon, sea salt, and mineral dust aerosol concentrationsfrom a global model (GOCART) driven by the samemeteorological fields. We did not examine the role ofN2O5 hydrolysis in aerosols, whose importance is wellestablished [Dentener and Crutzen, 1993] and which isincluded in all current-generation tropospheric chemistrymodels.[33] We find important aerosol effects from reduction in
photolysis frequencies and reactive uptake of HO2 (g = 0.2).Perturbations to photolysis frequencies are largely fromabsorbing aerosols; sulfate has little effect. Aerosolsdecrease the O3 ! O(1D) photolysis frequency, J(O(1D)),at the surface by 5–15% throughout most of the NorthernHemisphere, largely due to mineral dust, and by a factor of2 in biomass burning regions, largely due to black carbon.[34] Uptake of HO2 by aerosols accounts for more than
10% of total HOx (� OH + peroxy) loss in the boundarylayer of most continental regions. The heterogeneous chem-ical effects of aerosols are largest where high concentrations
Figure 9. Comparison of observed and simulated O3
concentrations over South Asia during March. Lines witherror bars are aircraft measurements from MOZAIC, 1995–1999 [Marenco et al., 1998]. Error bars indicate standarddeviations. The number of observations is denoted by ‘‘n.’’The thick solid line is the monthly mean O3 concentrationfrom the standard simulation. The dashed line representsvalues from a simulation without the radiative effects oruptake of HO2, NO2, and NO3 by aerosols.
Figure 10. As in Figure 9, but for August at Hohenpeis-senberg (48�N, 11�E, 975 m altitude). Measurements arefrom a 1980–1993 ozonesonde climatology [Logan, 1999].
MARTIN ET AL.: PHOTOCHEMICAL EFFECTS OF AEROSOLS ACH 6 - 11

of fine aerosols enable efficient gas-particle mass transfer.Uptake of HO2 on aerosols accounts for up to 50–70% ofHOx loss over polluted regions of Eastern Europe (largelydue to sulfate and organic carbon), and more than 70% overbiomass burning areas of the tropics (largely due to organiccarbon). Aerosols decrease boundary layer OH concentra-tions by 5–35% in most of the Northern Hemisphere, by afactor of 2 over northern Europe during August, and up to afactor of 4 over India during March.[35] Reactive uptake of NO2 (g = 10�4) and NO3 (g =
10�3) have relatively small effects. These processes accountfor more than 10% of HNO3 production only over thetropical North Atlantic, the Sahara, and the southern oceans.Over continental regions, the net effect of the aerosolprocesses considered here is to slightly increase NOx dueto OH depletion.
[36] We examined the implications of the above aerosoleffects on the global model budgets of OH, O3, and CO.Annual mean OH concentrations decrease by 9% globally(comparable to the effect of N2O5 hydrolysis) and by 13%in the Northern Hemisphere. About 60% of the globaldecrease is due to the radiative effects of mineral dust.The resulting CH3CCl3 lifetime against oxidation by tropo-spheric OH (5.6 years) is in better agreement with estimatesconstrained by observations. Annual mean global O3 chem-ical production decreases by 6%, but the tropospheric O3
burden remains unchanged. Concentrations of CO increaseby 5–15 ppbv in most the Northern Hemisphere, improvingagreement with observations at remote sites. Boundary layerO3 decreases by 15–45 ppbv over South Asia during thebiomass burning season in March, improving the compar-ison to aircraft observations (MOZAIC) although the modelis still too high. Summertime boundary layer O3 is reducedby 5–9 ppbv over northern Europe, and by 1–3 ppbv overthe United States, again improving the model simulationwith respect to observations over both regions. We concludethat surface O3 concentrations over Europe and otherindustrial regions will increase if emissions of aerosols arereduced without corresponding reductions in O3 precursors.
[37] Acknowledgments. Discussions with Mathew Evans, BryanDuncan, Isabelle Bey, and Jennifer Logan were helpful. We thank BrendanField and Arlene Fiore for contributions to model development. This workwas supported by the NASA Atmospheric Chemistry Modeling andAnalysis Program (ACMAP) and by a National Defense and EngineeringGraduate Fellowship for Randall Martin.
ReferencesAnderson, B. E., W. B. Grant, G. L. Gregory, E. V. Browell, J. E. Collins,G. W. Sachse, D. R. Bagwell, C. H. Hudgins, B. R. Blake, and N. J.Blake, Aerosols from biomass burning over the tropical South Atlantic
Figure 11. Comparison of observed and simulated annual mean CO concentrations in surface air forremote sites (annual mean concentrations less than 140 ppbv) of the Northern Hemisphere. Solid circlesare observed values for 1988–1996 from Novelli et al. [1998]. Solid line is values from the simulationwith full aerosol photochemistry. Dashed line is values from a simulation without the radiative effect ofaerosols and without uptake of HO2, NO2, and NO3 by aerosols.
Table 4. Global Tropospheric O3 Budget and CH3CCl3 Lifetimea
Full AerosolPhotochemistry
N2O5 HydrolysisOnlyb
Chemical production, Tg O3 yr�1 4924 5263
Chemical loss, Tg O3 yr�1 4377 4693
Burden, Tg O3 322 323Global CH3CCl3 lifetime, yr 5.6 5.2NH CH3CCl3 lifetime, yr 5.4 4.8SH CH3CCl3 lifetime, yr 5.8 5.6
aThe production, loss, and burden of O3 are actually for the extended oddoxygen family defined as O3 + NO2 + 2 * NO3 + peroxyacylnitrates +HNO3 + 3 * N2O5. They are calculated for the column extending up to thelocal model tropopause. The CH3CCl3 lifetime is calculated as the ratio ofthe total burden of atmospheric CH3CCl3 to the tropospheric loss rateagainst oxidation by OH [Spivakovsky et al., 2000]. Values are annualmeans for September 1996 to August 1997 from the GEOS-CHEM model.
bThis is the same as full aerosol photochemistry simulation but withoutradiative effects or uptake of NO2, NO3, and HO2 by aerosols.
ACH 6 - 12 MARTIN ET AL.: PHOTOCHEMICAL EFFECTS OF AEROSOLS

region: Distributions and impacts, J. Geophys. Res., 101, 24,117–24,137,1996.
Bergamaschi, P., R. Hein, M. Heimann, and P. J. Crutzen, Inverse modelingof the global CO cycle, 1, Inversion of CO mixing ratios, J. Geophys.Res., 105, 1909–1927, 2000.
Bergamaschi, P., D. C. Lowe, M. R. Manning, R. Moss, T. Bromley, andT. S. Clarkson, Transects of atmospheric CO, CH4, and their isotopiccomposition across the Pacific: Shipboard measurements and validationof inverse models, J. Geophys. Res., 106, 7993–8011, 2001.
Bey, I., D. J. Jacob, R. M. Yantosca, J. A. Logan, B. D. Field, A. M. Fiore,Q. Li, H. Y. Liu, L. J. Mickley, and M. G. Schultz, Global modeling oftropospheric chemistry with assimilated meteorology: Model descriptionand evaluation, J. Geophys. Res., 106, 23,073–23,096, 2001a.
Bey, I., D. J. Jacob, J. A. Logan, and R. M. Yantosca, Asian chemicaloutflow to the Pacific: Origins, pathways and budgets, J. Geophys.Res., 106, 23,097–23,114, 2001b.
Chandra, S., J. R. Ziemke, P. K. Bhartia, and R. V. Martin, Tropical tropo-spheric ozone: Implications for dynamics and biomass burning, J. Geo-phys. Res., 107, 4188, doi:10.1029/2001JD000447, 2002.
Chin, M., R. B. Rood, S.-J. Lin, J. F. Muller, and A. M. Thompson, Atmo-spheric sulfur cycle simulated in the global model GOCART: Modeldescription and global properties, J. Geophys. Res., 105, 24,671 –24,687, 2000a.
Chin, M., D. Savoie, B. J. Huebert, A. R. Bandy, D. C. Thornton, T. S.Bates, P. K. Quinn, E. S. Saltsman, and W. J. De Bruyn, Atmosphericsulfur cycle in the global model GOCART: Comparison with field ob-servations and regional budgets, J. Geophys. Res., 105, 24,689–24,712,2000b.
Chin, M., P. Ginoux, S. Kinne, O. Torres, B. Holben, B. N. Duncan, R. V.Martin, J. A. Logan, A. Higurashi, and T. Nakajima, Tropospheric aero-sol optical thickness from the GOCART model and comparisons withsatellite and sunphotometer measurements, J. Atmos. Sci., 59, 461–483,2002.
Chowdhury, Z., L. S. Hughes, L. G. Salmon, and G. R. Cass, Atmosphericparticle size and composition measurements to support light extinctioncalculations over the Indian Ocean, J. Geophys. Res., 106, 28,597–28,606, 2001.
Chuang, C. C., J. E. Penner, K. E. Grant, J. M. Prospero, G. H. Rau, andK. Kawamoto, Cloud susceptibility and the first aerosol indirect forcing:Sensitivity to black carbon and aerosol concentrations, J. Geophys. Res.,107, 4564, doi:10.1029/2000JD000215, 2002.
Cooke, W. F., C. Liousse, H. Cachier, and J. Feichter, Construction of a1� 1� fossil fuel emission data set for carbonaceous aerosol andimplementation and radiative impact in the ECHAM4 model, J. Geo-phys. Res., 104, 22,137–22,162, 1999.
Dentener, F. J., Heterogeneous chemistry in the troposphere, Ph.D. thesis,Univ. of Utrecht, Utrecht, Netherlands, 1993.
Dentener, F. J., and P. J. Crutzen, Reaction of N2O5 on tropospheric aero-sols: Impact on the global distributions of NOx O3, and OH, J. Geophys.Res., 98, 7149–7163, 1993.
Dentener, F. J., G. R. Carmichael, Y. Zhang, J. Lelieveld, and P. J. Crutzen,Role of mineral aerosol as a reactive surface in the global troposphere,J. Geophys. Res., 101, 22,869–22,889, 1996.
de Reus, M., F. Dentener, A. Thomas, S. Borrmann, J. Strom, and J. Lelie-veld, Airborne observations of dust aerosol over the North Atlantic Oceanduring ACE 2: Indications for heterogeneous ozone destruction, J. Geo-phys. Res., 105, 15,263–15,275, 2000.
de Rooij, W. A., and C. C. A. H. van der Stap, Expansion of Mie scatteringmatrices in generalized spherical functions, Astron. Astrophys., 131,237–248, 1984.
Dickerson, R. R., S. Kondragunta, G. Stenchikov, K. L. Civerolo, B. G.Doddridge, and B. N. Holben, The impact of aerosols on solar ultravioletradiation and photochemical smog, Science, 278, 827–830, 1997.
Dickerson, R. R., M. O. Andreae, T. Campos, O. L. Mayol-Bracero,C. Neusuess, and D. G. Streets, Analysis of black carbon and carbonmonoxide observed over the Indian Ocean: Implications for emissionsand photochemistry, J. Geophys. Res., 107, 8017, doi:10.1029/2001JD000501, 2002.
Duncan, B. N., R. V. Martin, A. C. Staudt, R. M. Yevich, and J. A. Logan,Interannual and seasonal variability of biomass burning emissions con-strained by remote-sensed observations, J. Geophys. Res, doi:10.1029/2002JD002378, in press, 2003.
Fiore, A. M., D. J. Jacob, I. Bey, R. M. Yantosca, B. D. Field, and J. G.Wilkinson, Background ozone over the United States in summer: Originand contribution to pollution episodes, J. Geophys. Res., 107, 4275,doi:10.1029/2001JD000982, 2002.
Frost, G. L., et al., Photochemical ozone production in the rural southeast-ern United States during the 1990 Rural Oxidants in the Southern En-vironment (ROSE) program, J. Geophys. Res., 103, 22,491–22,508,1998.
Ghan, S., N. Laulainen, R. Easter, R. Wagener, S. Nemesure, E. Chapman,Y. Zhang, and R. Leung, Evaluation of aerosol direct radiative forcing inMIRAGE, J. Geophys. Res., 106, 5295–5316, 2001.
Ginoux, P., M. Chin, I. Tegen, J. M. Prospero, B. Holben, O. Dubovik, andS. Lin, Sources and distributions of dust aerosols simulated with theGOCART model, J. Geophys. Res., 106, 22,055–22,074, 2001.
Gong, S., L. A. Barrie, and J.-P. Blanchet, Modeling sea-salt aerosols in theatmosphere, 1 Model development, J. Geophys. Res., 102, 3805–3818,1997.
Grassian, V. H., Heterogeneous uptake and reaction of nitrogen oxides andvolatile organic compounds on the surface of atmospheric particles includ-ing oxides, carbonates, soot and mineral dust: Implications for the chemi-cal balance of the troposphere, Int. Rev. Phys. Chem., 20, 467–548, 2001.
Hansen, J. E., and L. D. Travis, Light scattering in planetary atmospheres,Space Sci. Rev., 16, 527–610, 1974.
Hauglustaine, D. A., G. P. Brasseur, P. J. Rasch, J.-F. Muller, L. K. Emmons,and M. A. Carroll, MOZART, a global chemical transport model for ozoneand related chemical tracers, 2 Model results and evaluation, J. Geophys.Res., 103, 28,291–28,335, 1998.
He, S., and G. R. Carmichael, Sensitivity of photolysis rates and ozoneproduction in the troposphere to aerosol properties, J. Geophys. Res.,104, 26,307–26,324, 1999.
Heikes, B. G., and A. M. Thompson, Effects of heterogeneous processes onNO3, HONO, and HNO3 chemistry in the troposphere, J. Geophys. Res.,88, 10,883–10,895, 1983.
Holben, B. N., et al., An emerging ground-based aerosol climatology:Aerosol optical depth from AERONET, J. Geophys. Res., 106,12,067–12,097, 2001.
Jacob, D. J., Heterogeneous chemistry and tropospheric ozone, Atmos. En-viron., 34, 2131–2159, 2000.
Jacob, D. J., B. D. Field, E. Jin, I. Bey, Q. Li, J. A. Logan, and R. M.Yantosca, Atmospheric budget of acetone, J. Geophys. Res., 107, 4100,doi:10.1029/2001JD000694, 2002.
Jacobson, M. Z., Isolating nitrated and aromatic aerosols and nitrated aro-matic gases as sources of ultraviolet light absorption, J. Geophys. Res.,104, 3527–3542, 1999.
Jacobson, M. Z., A physically-based treatment of elemental carbon optics:Implications for global direct forcing of aerosols, Geophys. Res. Lett., 27,217–220, 2000.
Jacobson, M. Z., and R. P. Turco, SMVGEAR: A sparse-matrix, vectorizedGear code for atmospheric models, Atmos. Environ., 28, 273–284, 1994.
Jaegle, L., D. J. Jacob, W. H. Brune, and P. O. Wennberg, Chemistry ofHOx radicals in the upper troposphere, Atmos. Environ., 35, 469–489,2001.
Kopke, P., M. Hess, I. Schult, and E. P. Shettle, Global aerosol data set,report, Max-Planck Inst. fur Meteorol., Hamburg, Germany, 1997.
Kuhlbusch, T. A. J., M. O. Andreae, H. Cachier, J. G. Goldammer, J.-P.Lacaux, R. Shea, and P. J. Crutzen, Black carbon formation by savannafires: Measurements and implications for the global carbon cycle, J. Geo-phys. Res., 101, 23,651–23,665, 1996.
Lal, S., and M. G. Lawrence, Elevated mixing ratios of surface ozone overthe Arabian Sea, Geophys. Res. Lett., 28, 1487–1490, 2001.
Lawrence, M. G., P. J. Crutzen, P. J. Rasch, B. E. Eaton, and N. M.Mahowald, A model for studies of tropospheric photochemistry: Descrip-tion, global distributions, and evaluation, J. Geophys. Res., 104, 26,245–26,277, 1999.
Lelieveld, J., and F. J. Dentener, What controls tropospheric ozone?,J. Geophys. Res., 105, 3531–3551, 2000.
Lelieveld, J., et al., The Indian Ocean Experiment: Widespread air pollutionfrom South and Southeast Asia, Science, 291, 1031–1035, 2001.
Leon, J. F., et al., Large-scale advection of continental aerosols duringINDOEX, J. Geophys. Res., 106, 28,427–28,439, 2001.
Li, Q., et al., A tropospheric ozone maximum over the Middle East, Geo-phys. Res. Lett., 28, 3235–3238, 2001.
Li, Q., et al., Transatlantic transport of pollution and its effect on surfaceozone in Europe and North America, J. Geophys. Res., 107, 4166,doi:10.1029/2001JD001422, 2002a.
Li, Q., D. J. Jacob, T. D. Fairlie, H. Liu, R. M. Yantosca, and R. V.Martin, Stratospheric versus pollution influences on ozone at Bermuda:Reconciling past analyses, J. Geophys. Res., 107, 4611, doi:10.1029/2002JD002138, 2002b.
Liang, J., and D. J. Jacob, Effect of aqueous-phase cloud chemistry ontropospheric ozone, J. Geophys. Res., 102, 5993–6001, 1997.
Liao, H., Y. L. Yung, and J. H. Seinfeld, Effects of aerosols on troposphericphotolysis rates in clear and cloudy atmospheres, J. Geophys. Res., 104,23,697–23,707, 1999.
Liao, H., P. J. Adams, J. H. Seinfeld, L. J. Mickley, and D. J. Jacob, Inter-actions between tropospheric chemistry and aerosols in a unified GCMsimulation, J. Geophys. Res., 108, 4001, doi:10.1029/2001JD001260,2003.
MARTIN ET AL.: PHOTOCHEMICAL EFFECTS OF AEROSOLS ACH 6 - 13

Li-Jones, X., H. B. Maring, and J. M. Prospero, Effect of relative humidityon light scattering by mineral dust aerosol as measured in the marineboundary layer over the tropical Atlantic Ocean, J. Geophys. Res., 103,31,113–31,121, 1998.
Liu, H., D. J. Jacob, L. Y. Chan, S. J. Oltmans, I. Bey, R. M. Yantosca, J. M.Harris, B. N. Duncan, and R. V. Martin, Sources of tropospheric ozonealong the Asian Pacific Rim: An analysis of ozonesonde observations,J. Geophys. Res., 108, 4573, doi:10.1029/2001JD002005, 2003.
Logan, J. A., An analysis of ozonesonde data for the troposphere: Recom-mendations for testing 3-D models and development of a gridded clima-tology for tropospheric ozone, J. Geophys. Res., 104, 16,115–16,149,1999.
Marenco, A., et al., Measurement of ozone and water vapor by Airbus in-service aircraft: The MOZAIC airborne program, An overview, J. Geo-phys. Res., 103, 25,631–25,642, 1998.
Martin, R. V., et al., An improved retrieval of tropospheric nitrogen dioxidefrom GOME, J. Geophys. Res., 107, 4437, doi:10.1029/2001JD001027,2002a.
Martin, R. V., D. J. Jacob, J. A. Logan, I. Bey, R. M. Yantosca, A. C. Staudt,Q. Li, A. M. Fiore, B. N. Duncan, H. Liu, P. Ginoux, and V. Thouret,Interpretation of TOMS observations of tropical tropospheric ozone with aglobal model and in situ observations, J. Geophys. Res., 107, 4351,doi:10.1029/2001JD001480, 2002b.
Martin, S. T., Phase transitions of aqueous atmospheric particles, Chem.Rev., 100, 3403–3453, 2000.
Michel, A. E., C. R. Usher, and V. H. Grassian, Heterogeneous and catalyticuptake of ozone on mineral oxides and dusts: A Knudsen cell investiga-tion, Geophys. Res. Lett., 29, 1665, doi:10.1029/2002GL014896, 2002.
Mishchenko, M. I., J. M. Dlugach, E. G. Yanovitskij, and N. T. Zakharova,Bidirectional reflectance of flat optically thick particulate layers: Anefficient radiative transfer solution and applications to snow and soilsurfaces, J. Quant. Spectrosc. Radiat. Transfer, 63, 409–432, 1999.
Moise, T., and Y. Rudich, Reactive uptake of ozone by proxies for organicaerosols: Surface versus bulk processes, J. Geophys. Res., 105, 14,667–14,676, 2000.
Novelli, P. C., K. A. Masarie, and P. M. Lang, Distributions and recentchanges in carbon monoxide in the lower troposphere, J. Geophys. Res.,103, 19,015–19,033, 1998.
Palmer, P. I., D. J. Jacob, K. Chance, R. V. Martin, R. J. D. Spurr, T. P.Kurosu, I. Bey, R. Yantosca, A. Fiore, and Q. Li, Air mass factor for-mulation for spectroscopic measurements from satellites: Application toformaldehyde retrievals from the Global Ozone Monitoring Experiment,J. Geophys. Res., 106, 14,539–14,550, 2001.
Palmer, P. I., D. J. Jacob, A. M. Fiore, R. V. Martin, K. Chance, and T. P.Kurosu, Mapping isoprene emissions over North America using formal-dehyde column observations from space, J. Geophys. Res, doi:10.1029/2002JD002153, in press, 2003.
Patterson, E. M., D. A. Gillette, and B. H. Stockton, Complex index ofrefraction between 300 and 700 nm for Saharan aerosols, J. Geophys.Res., 82, 3153–3160, 1977.
Penner, J. E., et al., Aerosols, their direct and indirect effects, in IPCC ThirdAssessment Report, edited by J. T. Houghton et al., pp. 289–348, Cam-bridge Univ. Press, New York, 2001.
Phadnis, M. J., and G. R. Carmichael, Numerical investigation of theinfluence of mineral dust on the tropospheric chemistry of East Asia,J. Atmos. Chem., 36, 285–323, 2000.
Posfai, M., J. R. Anderson, P. R. Buseck, and P. R. Sievering, Soot andsulfate aerosol particles in the remote marine troposphere, J. Geophys.Res., 104, 2213–2222, 1999.
Prinn, R. G., et al., Evidence for substantial variations of atmospherichydroxyl radicals in the past two decades, Science, 292, 1882–1888,2001.
Ravishankara, A. R., Heterogeneous and multiphase chemistry in the tropo-sphere, Science, 276, 1058–1065, 1997.
Rhoads, K. P., P. Kelley, R. R. Dickerson, T. P. Carsey, M. Farmer, D. L.Savoie, and J. M. Prospero, Composition of the troposphere over theIndian Ocean during the monsoonal transition, J. Geophys. Res., 102,18,981–18,995, 1997.
Schubert, S. D., R. B. Rood, and J. Pfaendtner, An assimilated data set forEarth Science applications, Bull. Am. Meteorol. Soc., 74, 2331–2342,1993.
Sokolik, I., A. Andronova, and T. C. Johnson, Complex refractive index ofatmospheric dust aerosols, Atmos. Environ., Part A, 27, 2495–2502,1993.
Spivakovsky, C. M., et al., Three-dimensional climatological distribution oftropospheric OH: Update and evaluation, J. Geophys. Res., 105, 8931–8980, 2000.
Takemura, T., H. Okamoto, Y. Maruyama, A. Numaguti, A. Higurashi, andT. Nakajima, Global three-dimensional simulation of aerosol optical thick-ness distribution of various origins, J. Geophys. Res., 105, 17,853–17,873, 2000.
Tegen, I., P. Hollrig, M. Chin, I. Fung, D. J. Jacob, and J. Penner, Con-tribution of different aerosol species to the global aerosol extinctionoptical thickness: Estimates from model results, J. Geophys. Res., 102,23,895–23,915, 1997.
ten Brink, H. M., C. Kruisz, G. P. A. Kos, and A. Berner, Composition/sizeof the light-scattering aerosol in the Netherlands, Atmos. Environ., 31,3955–3962, 1997.
Tie, X., G. Brasseur, L. Emmons, L. Horowitz, and D. Kinnison, Effects ofaerosols on tropospheric oxidants: A global model study, J. Geophys.Res., 106, 22,931–22,964, 2001.
Torres, O., P. K. Bhartia, J. R. Herman, A. Sinyuk, P. Ginoux, andB. Holben, A long-term record of aerosol optical depth from TOMSobservations and comparison to AERONET measurements, J. Atmos.Sci., 59, 398–413, 2002.
Tyndall, G. S., R. A. Cox, C. Granier, R. Lesclaux, G. K. Moortgat, M. J.Pilling, A. R. Ravishankara, and T. J. Wallington, Atmospheric chemistryof small organic peroxy radicals, J. Geophys. Res., 106, 12,157–12,182,2001.
Wang, Y., D. J. Jacob, and J. A. Logan, Global simulation of troposphericO3-NOx - hydrocarbon chemistry, 2, Model evaluation and global ozonebudget, J. Geophys. Res., 103, 10,713–10,726, 1998.
Wild, O., X. Zhu, and M. J. Prather, Fast-J: Accurate simulation of in- andbelow-cloud photolysis in tropospheric chemistry models, J. Atmos.Chem., 37, 245–282, 2000.
World Meteorological Organization, Scientific assessment of ozone deple-tion, report, Global Ozone Obs. Syst., Geneva, 1998.
Zhang, Y., and G. R. Carmichael, The role of mineral aerosol in tropo-spheric chemistry in East Asia - A model study, J. Appl. Meteorol., 38,353–366, 1999.
Zhang, Y., Y. Sunwoo, V. Kotamarthi, and G. R. Carmichael, Photochemi-cal oxidant processes in the presence of dust: An evaluation of the impactof dust on particulate nitrate and ozone formation, J. Appl. Meteorol., 33,813–824, 1994.
�����������������������M. Chin and P. Ginoux, NASA Goddard Space Flight Center, Code 916,
Greenbelt, MD 20771, USA. ([email protected]; [email protected])D. J. Jacob and R. M. Yantosca, Division of Engineering and Applied
Sciences, Harvard University, G3D Pierce Hall, 20 Oxford Street,Cambridge, MA 02138, USA. ([email protected]; [email protected])R. V. Martin, Harvard-Smithsonian Center for Astrophysics, 60 Garden
Street, MS 50, Cambridge, MA 02138, USA. ([email protected])
ACH 6 - 14 MARTIN ET AL.: PHOTOCHEMICAL EFFECTS OF AEROSOLS

Figure 1. Modeled monthly mean optical depth at 400 nm of different aerosol types for March 1997(left column) and August 1997 (right column). Values are calculated from mass concentration fields fromGinoux et al. [2001] for mineral dust and from Chin et al. [2002] for the other aerosol types.
MARTIN ET AL.: PHOTOCHEMICAL EFFECTS OF AEROSOLS
ACH 6 - 4

Figure 2. Modeled monthly mean total aerosol surfacearea in the lower troposphere (�600 m above the surface)for March and August 1997. Values are calculated frommass concentration fields from Ginoux et al. [2001] formineral dust and from Chin et al. [2002] for the otheraerosol types.
Figure 3. Sensitivity to aerosols of the O3 ! O(1D)photolysis frequency (J(O(1D))) in surface air. Values aremonthly mean model results for March and August 1997.
MARTIN ET AL.: PHOTOCHEMICAL EFFECTS OF AEROSOLS
ACH 6 - 5

Figure 4. Fraction of total HOx loss in the lowertroposphere (�600 m above the surface) contributed byuptake of HO2 by aerosols. Values are monthly mean modelresults for March and August 1997.
Figure 5. Fraction of total HNO3 production in the lowertroposphere (�600 m above the surface) contributed byuptake of NO2 and NO3 by aerosols. Values are monthlymean model results for March and August 1997.
MARTIN ET AL.: PHOTOCHEMICAL EFFECTS OF AEROSOLS
ACH 6 - 6

Figure 7. Changes in OH, CO, NOx, and O3 concentrations in the lower troposphere (�600 m abovethe surface) from scattering and absorption by aerosols, and from uptake of HO2, NO2, and NO3 byaerosols, as determined by difference with a simulation that did not include these effects. Values aremodel monthly means during March. White circles show the locations of observations compared to themodel in section 4. Also shown is the change in the CO flux due to the above aerosol effects.
MARTIN ET AL.: PHOTOCHEMICAL EFFECTS OF AEROSOLS
ACH 6 - 8

Figure 8. As in Figure 7, but for August.
MARTIN ET AL.: PHOTOCHEMICAL EFFECTS OF AEROSOLS
ACH 6 - 9


![€¦ · Web view2009. 4. 23. · [Cr2O72-] Reverse Rate. A. increases increases. B. increases decreases. C. decreases decreases. D. decreases increases. 31. A small amount of H2SO4](https://img.pdfslide.net/doc/110x75/608f2c47b9e3f5096f2e5efc/web-view-2009-4-23-cr2o72-reverse-rate-a-increases-increases-b-increases.jpg)