Embed Size (px)
DESCRIPTION
Global Appraisal of Individual Needs (GAIN): A Standardized Biopsychosocial Assessment Tool. Michael Dennis, Ph.D. Chestnut Health Systems, Normal, IL - PowerPoint PPT Presentation
Citation preview
Global Appraisal of Individual Needs (GAIN):A Standardized Biopsychosocial
Assessment Tool
Michael Dennis, Ph.D.Chestnut Health Systems,
Normal, IL
Workshop at 16th Annual Drug Court Training Conference of the National Association of Drug Court Professionals, Boston, MA, June 3, 2010.. This presentation reports on
treatment & research funded by the Center for Substance Abuse Treatment (CSAT), Substance Abuse and Mental Health Services Administration (SAMHSA) under
contracts 270-2003-00006 and 270-07-0191, as well as several individual CSAT, NIAAA, NIDA and private foundation grants. The opinions are those of the author and do not reflect official positions of the consortium or government. Available on line at
www.chestnut.org/LI/Posters or by contacting Joan Unsicker at 448 Wylie Drive, Normal, IL 61761, phone: (309) 451-7801, Fax: (309) 451-7763, e-mail:

1. Provide an overview of the role of the GAIN as a piece of infrastructure in support the move toward both evidence based practice and practice based evidence
2. Describe each of the measures, the reports that they use to help the assessment guide clinical decision making and illustrate how they provide a successively more detailed picture of client needs
3. Highlight our current work to using actuarial estimates of outcomes to improve placement decisions
4. Summarize the status of efforts to make the data available for secondary analysis and translate the software, measures and reports from English into Spanish, French, Portuguese and other languages
Goals of this Presentation are to

Part 1. Provide an overview of the role of the GAIN as a piece of infrastructure in support the move toward both evidence based practice and practice based evidence

The Global Appraisal of Individual Needs (GAIN) is ..
A family of instruments ranging from screening, to quick assessment to a full Biopsychosocial and monitoring tools
Designed to integrate clinical and research assessment
Designed to support clinical decision making at the individual client level
Designed to support evaluation and planning at program level
Designed to support secondary analyses and comparisons across individuals and programs

More in BZ, CA, CN, JP, MX
ID
ILMO
ND
VI
ME
OK
PR
SD
AR
KS
MS
MT
NM
WVIN
AL
AK
IA
MN
NJNV
RI
SC
UT
HI
LA
DENE
TN
PA
VT
VADC
MI
COKY
GA
OH
OR
MD
AZ
TX
NY
NH
WI
CA
NC
CT
FL
MA
WA
WY
No of GAIN Sites
None (Yet)
1 to 14
15 to 30
31 to 164
GAIN Collaborators in the U.S (4/10)
State or Regional System
GAIN-Short Screener
GAIN-Quick
GAIN-Full
3/10 5
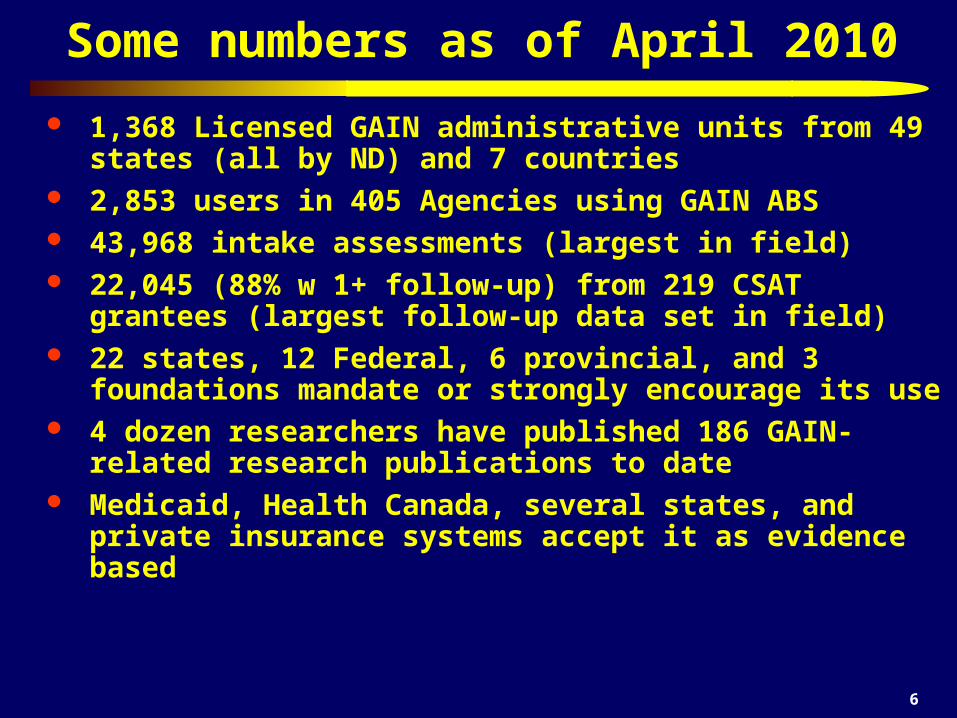
Some numbers as of April 2010
1,368 Licensed GAIN administrative units from 49 states (all by ND) and 7 countries
2,853 users in 405 Agencies using GAIN ABS 43,968 intake assessments (largest in field) 22,045 (88% w 1+ follow-up) from 219 CSAT grantees
(largest follow-up data set in field) 22 states, 12 Federal, 6 provincial, and 3 foundations
mandate or strongly encourage its use 4 dozen researchers have published 186 GAIN-related
research publications to date Medicaid, Health Canada, several states, and private
insurance systems accept it as evidence based
6

So what does it mean to move the field towards Evidence Based Practice (EBP)?
Introducing explicit intervention protocols that are– Targeted at specific problems/subgroups and outcomes– Having explicit quality assurance procedures to cause adherence
at the individual level and implementation at the program level
Introducing reliable and valid assessment that can be used – At the individual level to immediately guide clinical judgments
about diagnosis/severity, placement, treatment planning, and the response to treatment
– At the program level to drive program evaluation, needs assessment, performance monitoring and long term program planning
Having the ability to evaluate client and program outcomes – For the same person or program over time, – Relative to other people or interventions
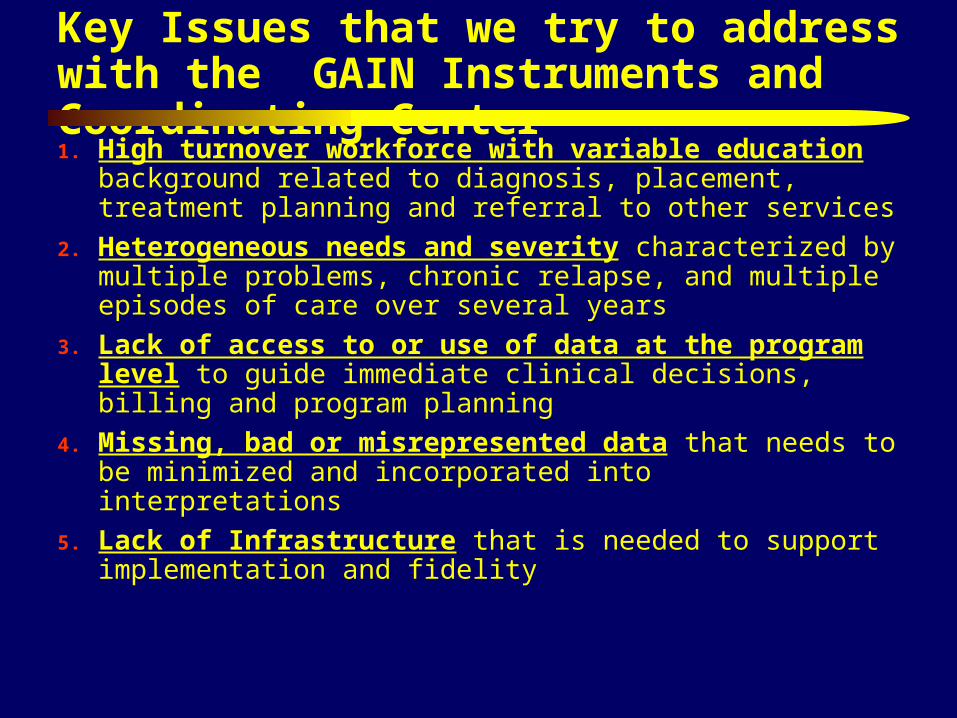
Key Issues that we try to address with the GAIN Instruments and Coordinating Center
1. High turnover workforce with variable education background related to diagnosis, placement, treatment planning and referral to other services
2. Heterogeneous needs and severity characterized by multiple problems, chronic relapse, and multiple episodes of care over several years
3. Lack of access to or use of data at the program level to guide immediate clinical decisions, billing and program planning
4. Missing, bad or misrepresented data that needs to be minimized and incorporated into interpretations
5. Lack of Infrastructure that is needed to support implementation and fidelity

1. High Turnover Workforce with Variable Education
Questions spelled out and simple question format
Lay wording mapped onto expert standards for given area
Built in definitions, transition statements, prompts, and checks for inconsistent and missing information.
Standardized approach to asking questions across domains
Range checks and skip logic built into electronic applications
Formal training and certification protocols on administration, clinical interpretation, data management, coordination, local, regional, and national “trainers”
Above focuses on consistency across populations, level of care, staff and time
On-going quality assurance and data monitoring for the reoccurrence or problems at the staff (site or item) level
Availability of training resources, responses to frequently asked questions, and technical assistance
Outcome: Improved Reliability and Efficiency
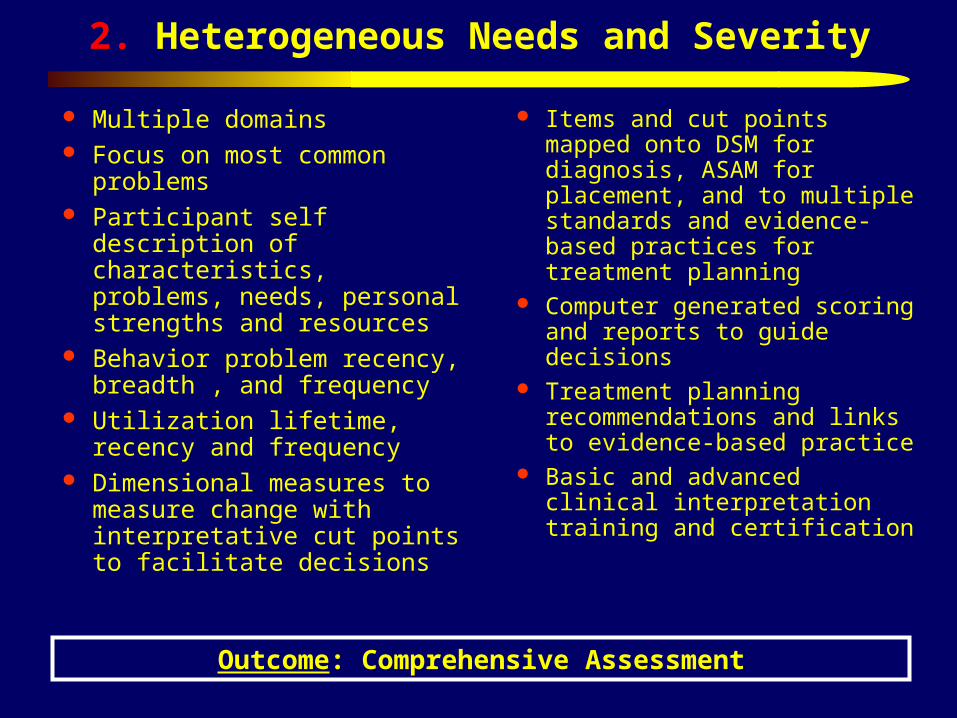
2. Heterogeneous Needs and Severity
Multiple domains Focus on most common
problems Participant self description of
characteristics, problems, needs, personal strengths and resources
Behavior problem recency, breadth , and frequency
Utilization lifetime, recency and frequency
Dimensional measures to measure change with interpretative cut points to facilitate decisions
Items and cut points mapped onto DSM for diagnosis, ASAM for placement, and to multiple standards and evidence- based practices for treatment planning
Computer generated scoring and reports to guide decisions
Treatment planning recommendations and links to evidence-based practice
Basic and advanced clinical interpretation training and certification
Outcome: Comprehensive Assessment

3. Lack of Access to or use of Data at the Program Level
Data immediately available to support clinical decision making for a case
Data can be transferred to other clinical information system to support billing, progress reports, treatment planning and on-going monitoring
Data can be exported and cleaned to support further analyses
Data can be pooled with other sites to facilitate comparison and evaluation
PC and web based software applications and support
Formal training and certification on using data at the individual level and data management at the program level
Data routinely pooled to support comparisons across programs and secondary analysis
Over three dozen scientists already working with data to link to evidence-based practice
Outcome: Improved Program Planning and Outcomes

4. Missing, Bad or Misrepresented Data
Assurances, time anchoring, definitions, transition, and question order to reduce confusion and increase valid responses
Cognitive impairment check Validity checks on missing,
bad, inconsistency and unlikely responses
Validity checks for atypical and overly random symptom presentations
Validity ratings by staff
Training on optimizing clinical rapport
Training on time anchoring Training answering questions,
resolving vague or inconsistent responses, following assessment protocol and accurate documentation.
Utilization and documentation of other sources of information
Post hoc checks for on-going site, staff or item problems
Outcome: Improved Validity

5. Lack of Infrastructure
Direct Services
Training and quality assurance on administration, clinical interpretation, data management, follow-up and project coordination
Data management
Evaluation and data available for secondary analysis
Software support
Technical assistance and back up to local trainer/expert
Development
Clinical Product Development
Software Development
Collaboration with IT vendors (e.g., WITS)
Over 36 internal & external scientists and students
Workgroups focused on specific subgroup, problem, or treatment approach
Labor supply (e.g., consultant pool, college courses)
Outcome: Implementation with Fidelity
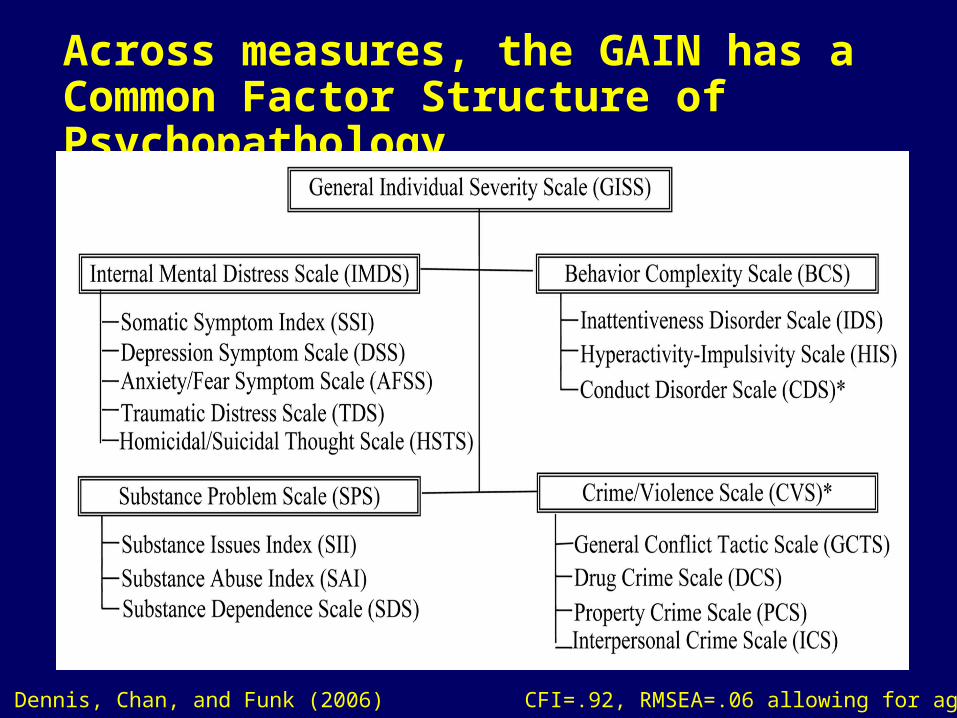
Across measures, the GAIN has a Common Factor Structure of Psychopathology
Source: Dennis, Chan, and Funk (2006) CFI=.92, RMSEA=.06 allowing for age
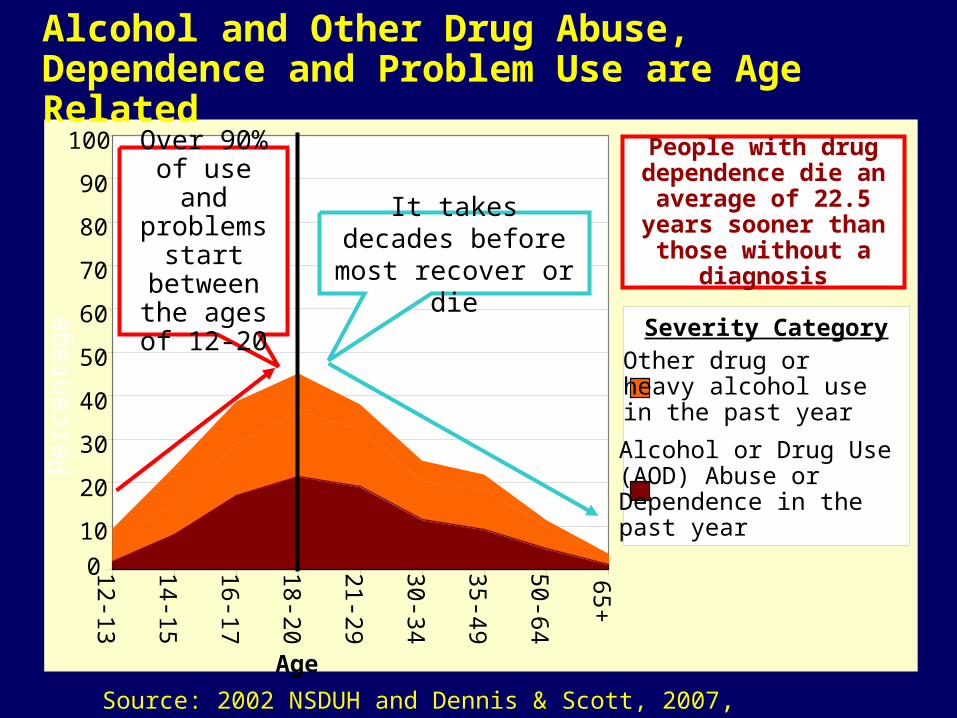
Alcohol and Other Drug Abuse, Dependence and Problem Use are Age Related
Source: 2002 NSDUH and Dennis & Scott, 2007, Neumark et al., 2000
0
10
20
30
40
50
60
70
80
90
100
12-13
14-15
16-17
18-20
21-29
30-34
35-49
50-64
65+Other drug or heavy alcohol use in the past year
Alcohol or Drug Use (AOD) Abuse or Dependence in the past year
Age
Severity Category
Over 90% of use and
problems start between the ages of
12-20
It takes decades before most recover or die
Per
cent
age
People with drug dependence die an
average of 22.5 years sooner than those
without a diagnosis
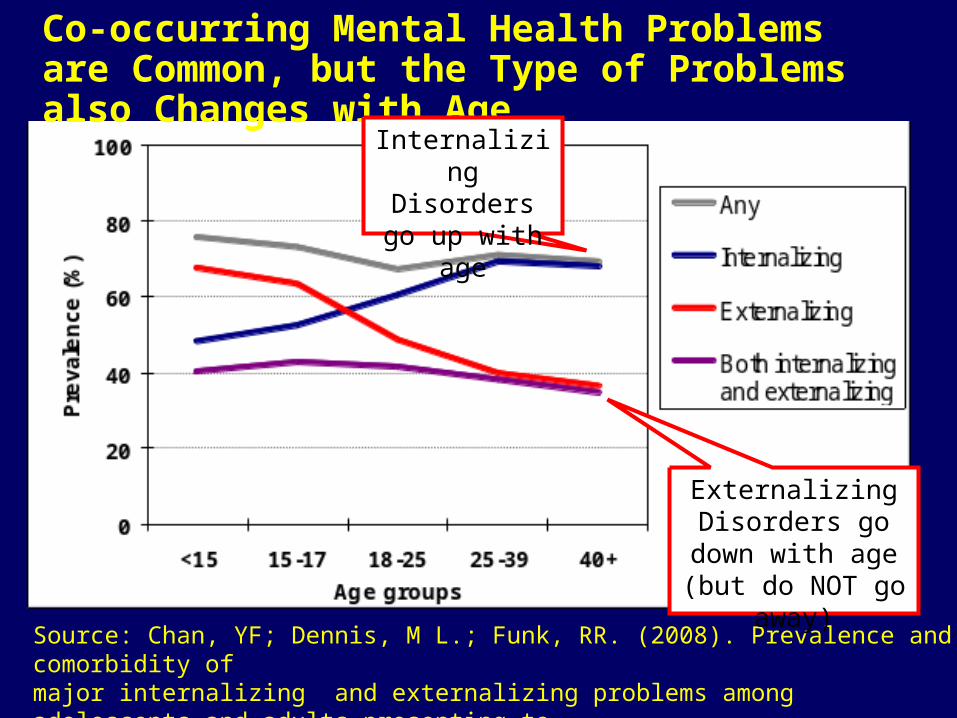
Co-occurring Mental Health Problems are Common, but the Type of Problems also Changes with Age
Source: Chan, YF; Dennis, M L.; Funk, RR. (2008). Prevalence and comorbidity of major internalizing and externalizing problems among adolescents and adults presenting to substance abuse treatment. Journal of Substance Abuse Treatment, 34(1) 14-24 .
Internalizing Disorders go up
with age
Externalizing Disorders go down
with age (but do NOT go away)

Progressive Continuum of Measurement (Common Measures)
Screening to Identify Who Needs to be “Assessed” (5-10 min)– Focus on brevity, simplicity for administration & scoring– Needs to be adequate for triage and referral– GAIN Short Screener for SUD, MH & Crime– ASSIST, AUDIT, CAGE, CRAFT, DAST, MAST for SUD– SCL, HSCL, BSI, CANS for Mental Health– LSI, MAYSI, YLS for Crime
Quick Assessment for Targeted Referral (20-30 min)– Assessment of who needs a feedback, brief intervention or referral for
more specialized assessment or treatment– Needs to be adequate for brief intervention– GAIN Quick – ADI, ASI, SASSI, T-ASI, MINI
Comprehensive Biopsychosocial (1-2 hours) – Used to identify common problems and how they are interrelated– Needs to be adequate for diagnosis, treatment planning and placement
of common problems– GAIN Initial (Clinical Core and Full)– CASI, A-CASI, MATE
Specialized Assessment (additional time per area)– Additional assessment by a specialist (e.g., psychiatrist, MD, nurse,
spec ed) may be needed to rule out a diagnosis or develop a treatment plan or individual education plan
– CIDI, DISC, KSADS, PDI, SCAN
Screener Quick C
omprehensive S
pecial
More E
xtensive / Longer/ E
xpensive
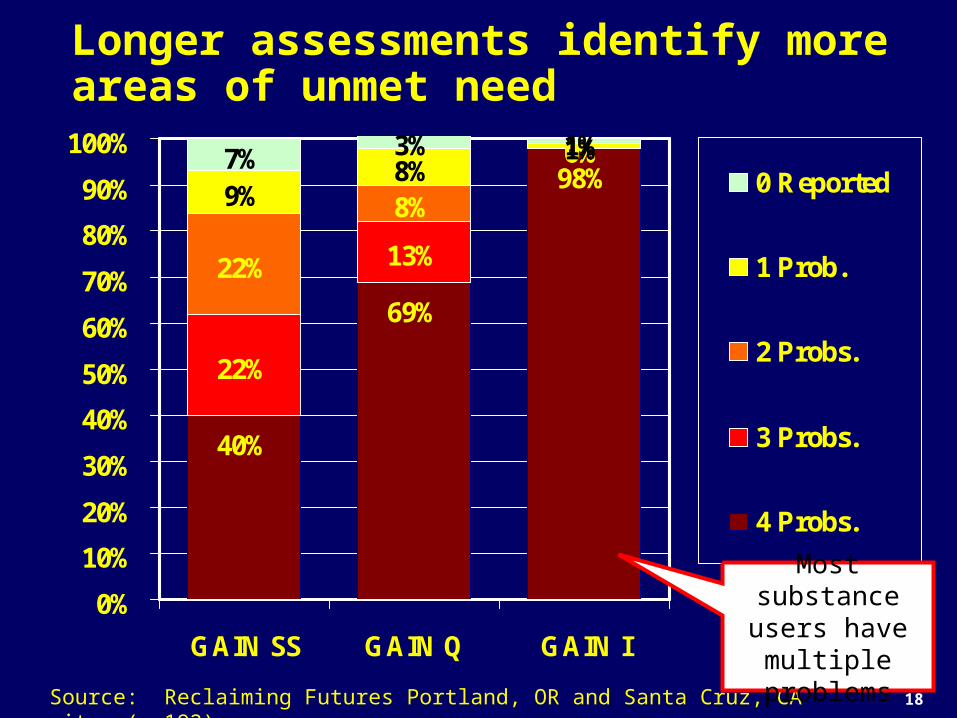
Longer assessments identify more areas of unmet need
40%
69%
98%
22%
13%
0%
22%
8%
0%
9%8%
1%3% 1%7%
0%
10%
20%
30%
40%
50%
60%
70%
80%
90%
100%
GAIN SS GAIN Q GAIN I
0 Reported
1 Prob.
2 Probs.
3 Probs.
4 Probs.
Source: Reclaiming Futures Portland, OR and Santa Cruz, CA sites (n=192)
Most substance users have multiple problems
18

19
Part 2. Describe each of the measures, the reports that they use to help the assessment guide clinical decision making and illustrate how they provide a successively more detailed picture of client needs

Next slides will
Describe the difference in the breadth of information you get with different levels of assessment
Summarize validation studies to date
Illustrate the difference using data from a single sample (Reclaiming futures project)
Demonstrate that multi-morbidity is the norm and varies by type of client and program
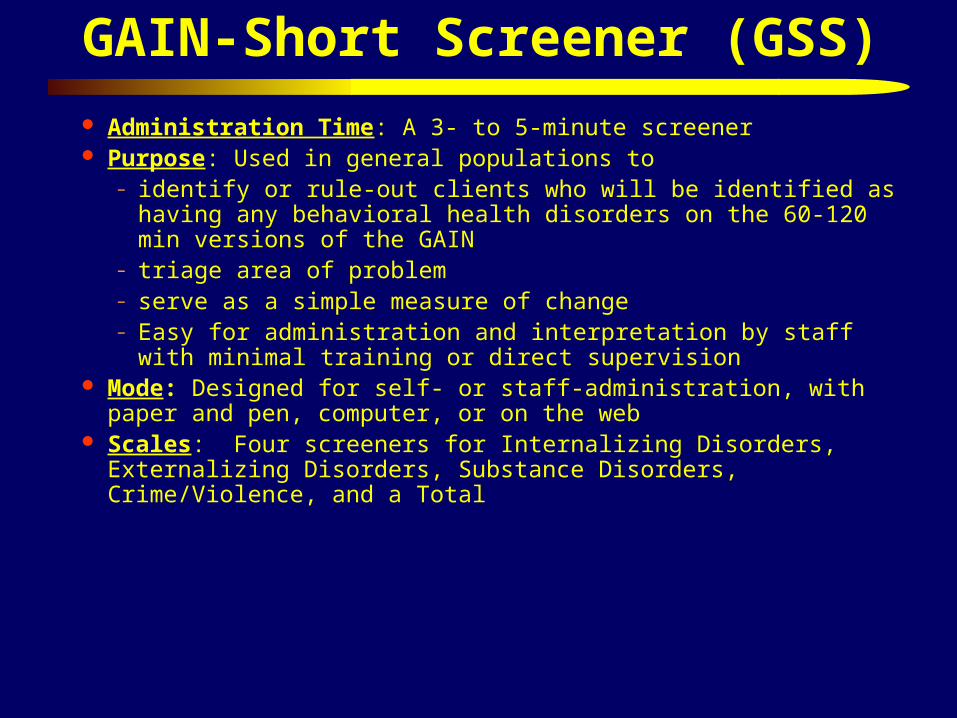
GAIN-Short Screener (GSS)
Administration Time: A 3- to 5-minute screener Purpose: Used in general populations to
– identify or rule-out clients who will be identified as having any behavioral health disorders on the 60-120 min versions of the GAIN
– triage area of problem– serve as a simple measure of change– Easy for administration and interpretation by staff with minimal
training or direct supervision Mode: Designed for self- or staff-administration, with paper and pen,
computer, or on the web Scales: Four screeners for Internalizing Disorders, Externalizing
Disorders, Substance Disorders, Crime/Violence, and a Total

Response Set: Recency of 20 problems rated past month (3), 2-12 months ago (2), more than a year ago (1), never (0)
Interpretation: Combined by cumulative time period as: – Past month count (3s) to measure of change– Past year count (2s or 3s) to predict diagnosis– Lifetime count (1s, 2s or 3s) as a measure of peak severity– Can be classified within time period low (0), moderate (1-2)
or high (3)– Can also be used to classify remission as – Early (lifetime but not past month)– Sustained (lifetime but not past year)
Reports: Narrative, tabular, and graphical reports built into web based GAIN ABS and/or ASP application for local hosting
GAIN-Short Screener (GSS) (continued)
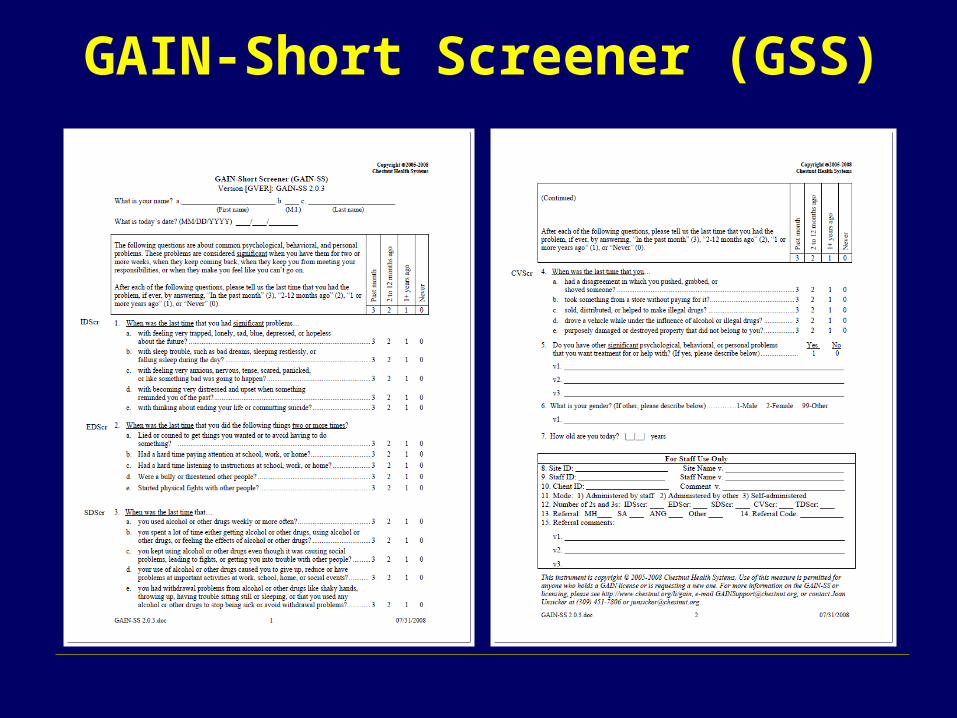
GAIN-Short Screener (GSS)

GAIN SS Psychometric Properties
Total Disorder Screener (TDScr)
0%
10%
20%
30%
40%
50%
60%
70%
80%
90%
100%
0 1 2 3 4 5 6 7 8 9 10 11 12 13 14 15 16 17 18 19 20
Prevalence (% 1+ disorder)
Sensitivity (% w disorder above)
Specificity (% w/o disorder below)
(n=6194 adolescents)
Low Mod. High
At 3 or more symptoms we get 99% prevalence, 91% sensitivity, & 89% specificity
Using a higher cut point increases prevalence and specificity, but
decreases sensitivity
Total score has alpha of .85 and is
correlated .94 with full GAIN version
Source: Dennis et al 2006

GSS Performance by Subscale and Disorders
Prevalence Sensitivity Specificity Screener/Disorder 1+ 3+ 1+ 3+ 1+ 3+ Internal Disorder Screener (0-5) Any Internal Disorder 81% 99% 94% 55% 71% 99% Major Depression 56% 87% 98% 72% 54% 94% Generalized Anxiety 32% 56% 100% 83% 44% 83% Suicide Ideation 24% 43% 100% 84% 41% 79% Mod/High Traumatic Stress 60% 82% 94% 60% 55% 90%
External Disorder Screener (0-5) Any External Disorder 88% 97% 98% 67% 75% 96% AD, HD or Both 65% 82% 99% 78% 51% 85% Conduct Disorder 78% 91% 98% 70% 62% 90%
Substance Use Disorder Screener (0-5) Any Substance Disorder 96% 100% 96% 68% 73% 100% Dependence 65% 87% 100% 91% 30% 82% Abuse 30% 13% 89% 25% 14% 28%
Crime Violence Screener (0-5) Any Crime/Violence 88% 99% 94% 49% 76% 99% High Physical Conflict 31% 46% 100% 70% 38% 77% Mod/High General Crime 85% 100% 94% 51% 71% 100%
Total Disorder Screener (0-5)Any Disorder 97% 99% 99% 91% 47% 89% Any Internal Disorder 58% 63% 100% 98% 8% 28% Any External Disorder 68% 75% 100% 99% 10% 37% Any Substance Disorder 89% 92% 99% 92% 20% 51% Any Crime/Violence 68% 73% 100% 96% 10% 32%
Recommend Triage as
0=Not likely1-2 Possible3+=Likely
Moderate (1+) gives best result
for sensitivity
High (3+) gives best result for
specificity
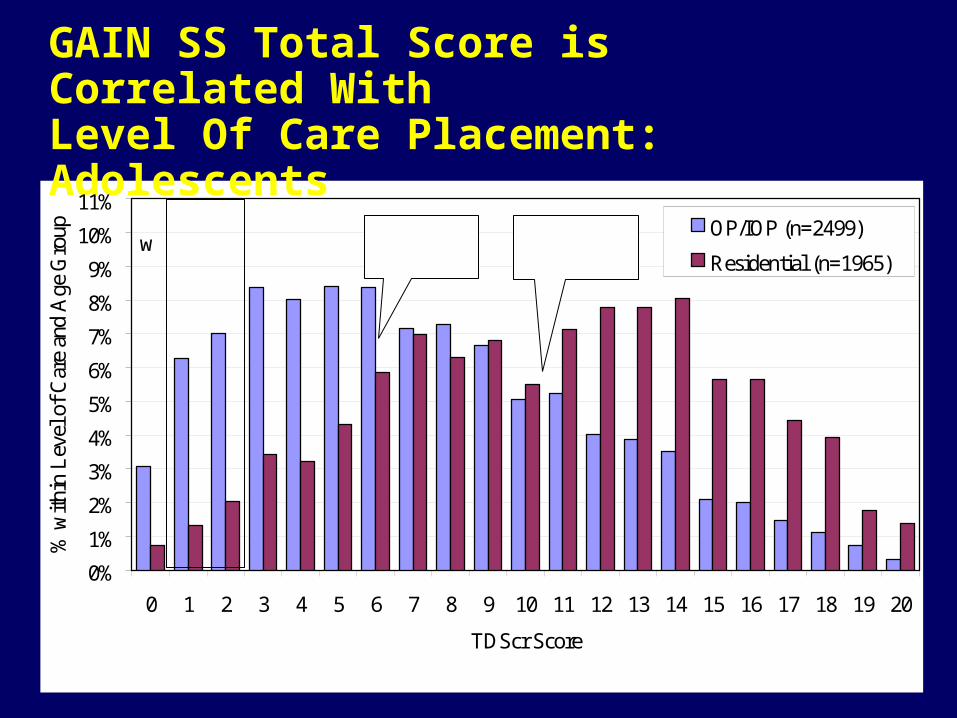
GAIN SS Total Score is Correlated With Level Of Care Placement: Adolescents
0%
1%
2%
3%
4%
5%
6%
7%
8%
9%
10%
11%
0 1 2 3 4 5 6 7 8 9 10 11 12 13 14 15 16 17 18 19 20
TDScr Score
% w
ithi
n L
evel
of
Car
e an
d A
ge G
roup OP/IOP (n=2499)
Residential (n=1965)
Low
Mod High ->OP/IOP
Median=6.0Residential
Median=10.5
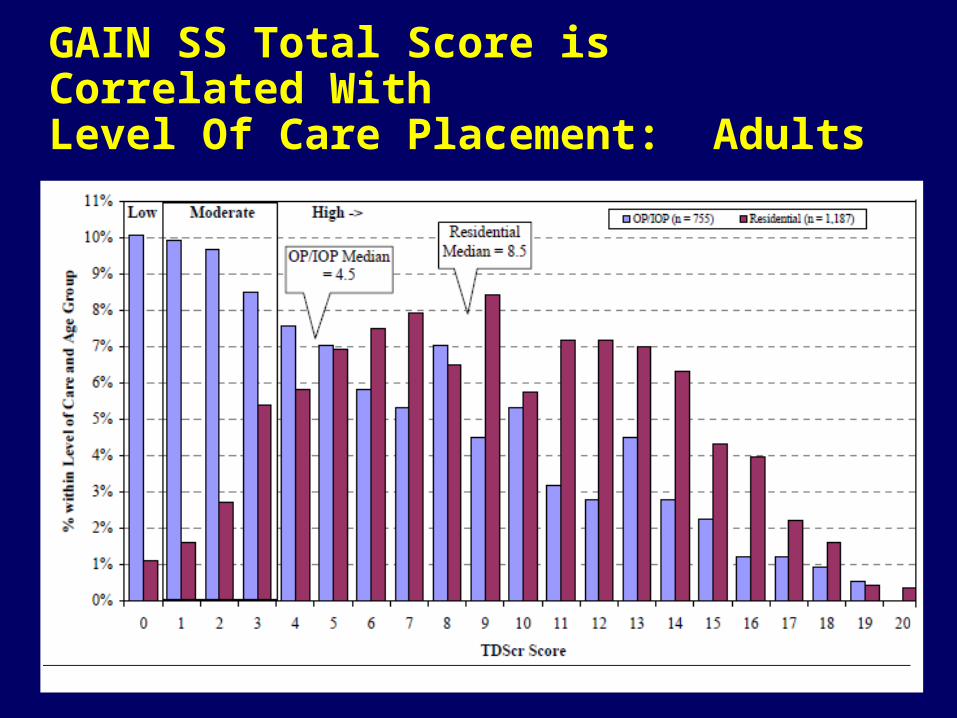
GAIN SS Total Score is Correlated With Level Of Care Placement: Adults

GAIN SS Can Also be Used for Monitoring
109
11
910
8
32 2
0
4
8
12
16
20
Intake 3Mon
6Mon
9Mon
12Mon
15Mon
18Mon
21Mon
24Mon
Total Disorder Screener (TDScr)
12+ Mon.s ago (#1s)
2-12 Mon.s ago (#2s)
Past Month (#3s)
Lifetime (#1,2,or 3)
Track Gap Between Prior and current
Lifetime Problems to identify “under
reporting”
Track progress in reducing current
(past month) symptoms)
Monitor for Relapse
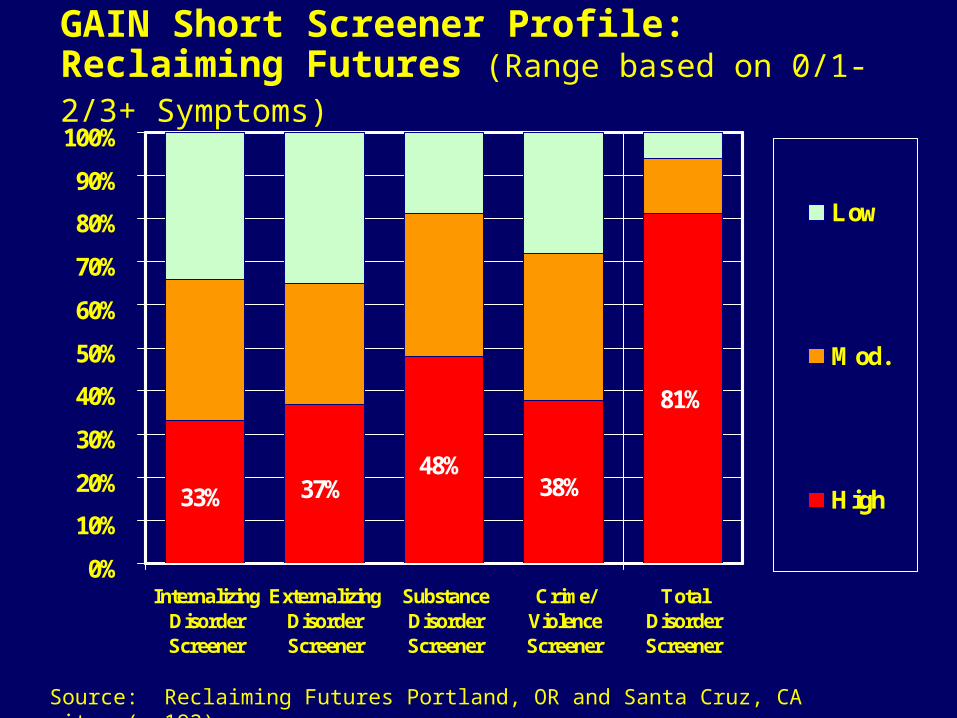
GAIN Short Screener Profile: Reclaiming Futures (Range based on 0/1-2/3+ Symptoms)
33% 37%48%
38%
81%
0%
10%
20%
30%
40%
50%
60%
70%
80%
90%
100%
InternalizingDisorderScreener
ExternalizingDisorderScreener
SubstanceDisorderScreener
Crime/ViolenceScreener
TotalDisorderScreener
Low
Mod.
High
Source: Reclaiming Futures Portland, OR and Santa Cruz, CA sites (n=192)
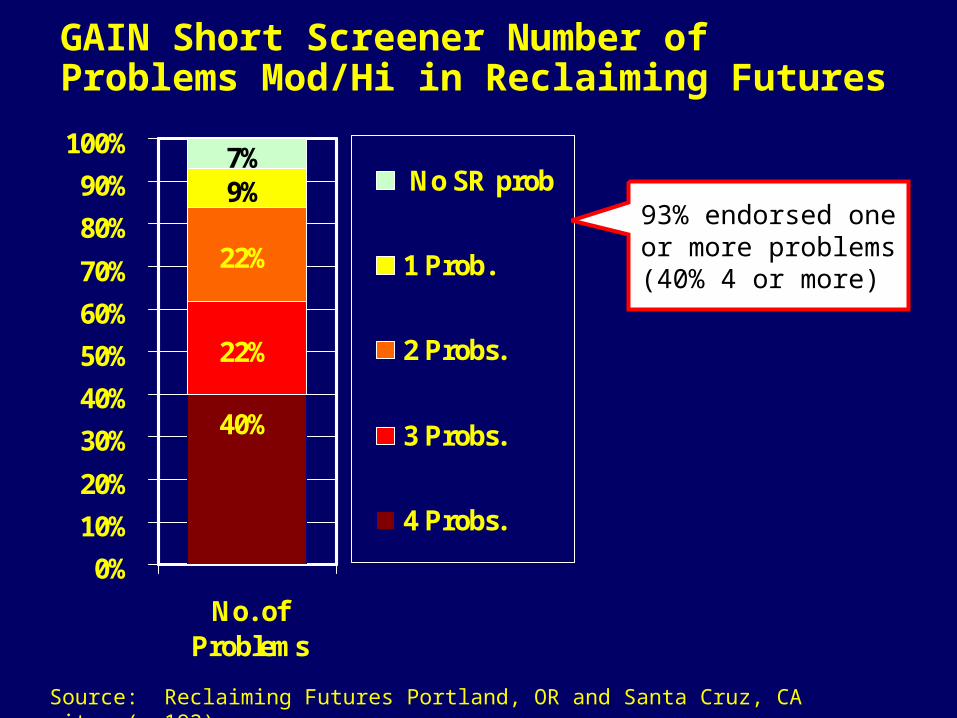
GAIN Short Screener Number of Problems Mod/Hi in Reclaiming Futures
40%
22%
22%
9%7%
0%
10%
20%
30%
40%
50%
60%
70%
80%
90%
100%
No. ofProblems
No SR prob
1 Prob.
2 Probs.
3 Probs.
4 Probs.
Source: Reclaiming Futures Portland, OR and Santa Cruz, CA sites (n=192)
93% endorsed one or more problems
(40% 4 or more)

Construct Validity of GSS Internalizing Disorder Screener
0%10%20%30%40%50%60%70%80%90%
100%
% Days with MHproblem
Mod/High onEmotional Problem
Scale (EPS)
Mod/High onInternal MentalDistress Scale
(IMDS)
Internalizing Disorder Screener (IDScr)
Fu
ll G
AIN
mea
sure
0 1 2 3 4 5
Source: Education Service District 113 (n=979) and King County (n=1002)
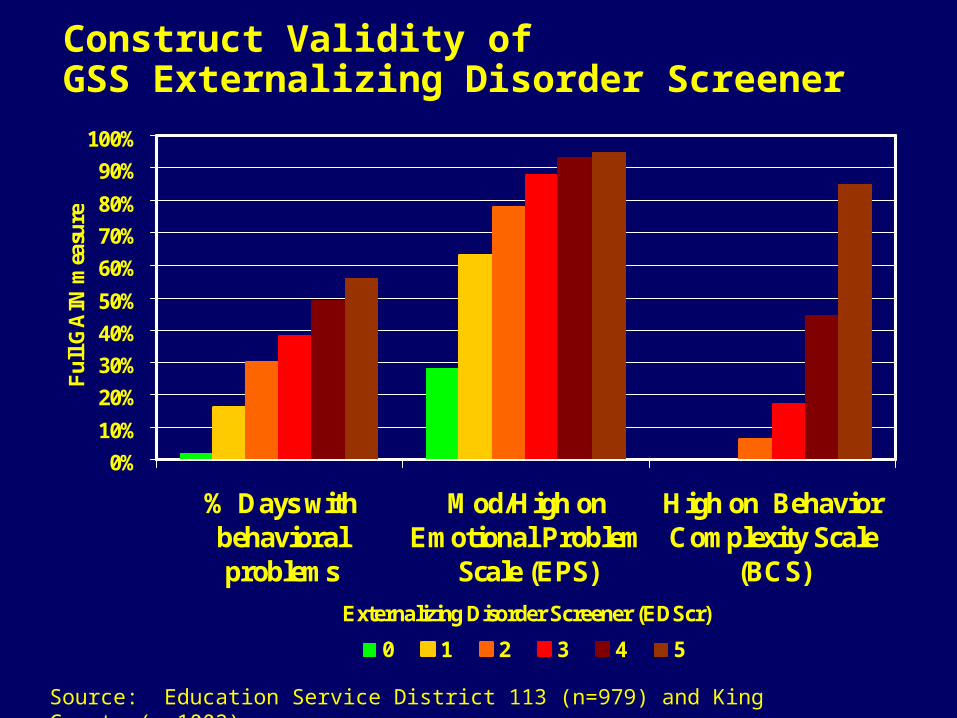
Construct Validity of GSS Externalizing Disorder Screener
0%
10%
20%
30%
40%
50%
60%
70%
80%
90%
100%
% Days withbehavioralproblems
Mod/High onEmotional Problem
Scale (EPS)
High on BehaviorComplexity Scale
(BCS)
Externalizing Disorder Screener (EDScr)
Fu
ll G
AIN
mea
sure
0 1 2 3 4 5
Source: Education Service District 113 (n=979) and King County (n=1002)
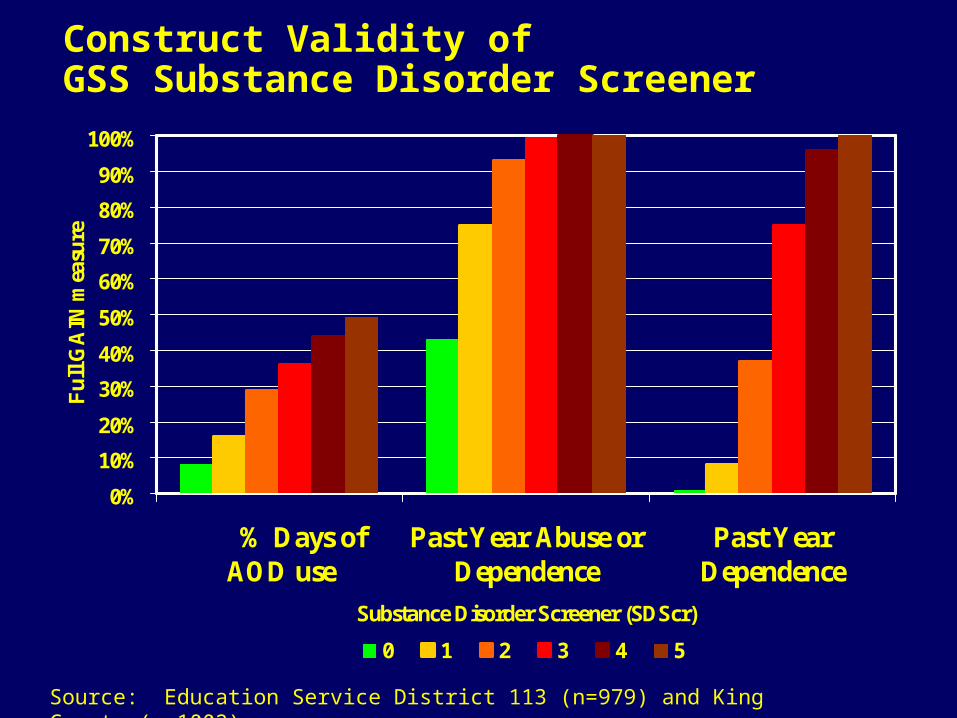
Construct Validity of GSS Substance Disorder Screener
0%
10%
20%
30%
40%
50%
60%
70%
80%
90%
100%
% Days of AOD use
Past Year Abuse orDependence
Past YearDependence
Substance Disorder Screener (SDScr)
Fu
ll G
AIN
mea
sure
0 1 2 3 4 5
Source: Education Service District 113 (n=979) and King County (n=1002)
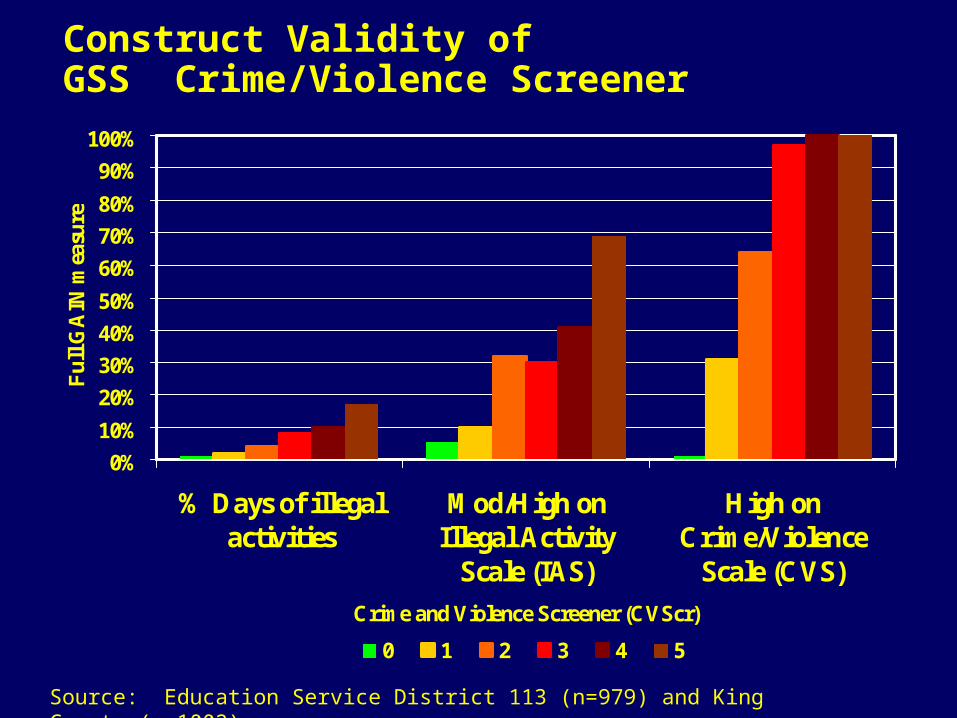
Construct Validity of GSS Crime/Violence Screener
0%
10%
20%
30%
40%
50%
60%
70%
80%
90%
100%
% Days of illegalactivities
Mod/High onIllegal Activity
Scale (IAS)
High onCrime/Violence
Scale (CVS)
Crime and Violence Screener (CVScr)
Fu
ll G
AIN
mea
sure
0 1 2 3 4 5
Source: Education Service District 113 (n=979) and King County (n=1002)
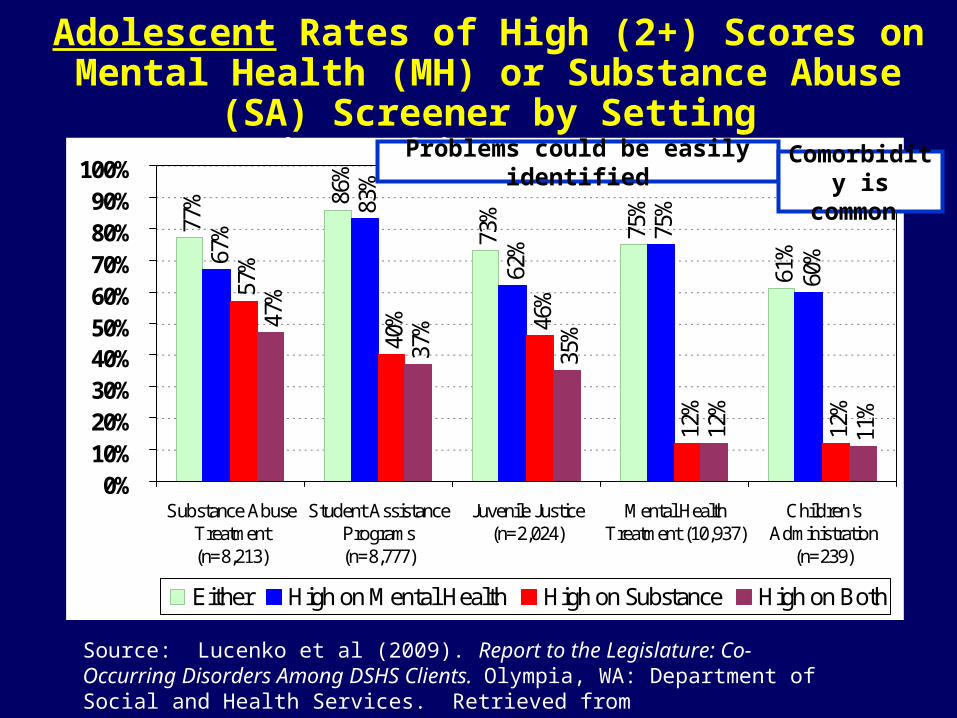
Adolescent Rates of High (2+) Scores on Mental Health (MH) or Substance Abuse (SA) Screener by Setting
in Washington State
77% 86
%
73%
75%
61%67
%
83%
62%
75%
60%
57%
40% 46
%
12%
12%
47%
37%
35%
12%
11%
0%10%20%30%40%50%60%70%80%90%
100%
Substance AbuseTreatment(n=8,213)
Student AssistancePrograms(n=8,777)
Juvenile Justice(n=2,024)
Mental HealthTreatment (10,937)
Children'sAdministration
(n=239)
Either High on Mental Health High on Substance High on Both
Source: Lucenko et al (2009). Report to the Legislature: Co-Occurring Disorders Among DSHS Clients. Olympia, WA: Department of Social and Health Services. Retrieved from http://publications.rda.dshs.wa.gov/1392/
Problems could be easily identified Comorbidity is common

Adult Rates of High (2+) Scores on Mental Health (MH) or Substance Abuse (SA) Screener
by Setting in Washington State
81%
78%
65%
64% 69
%
18%
68% 73
%
43%
44%
69%
17%
69%
51%
53%
51%
17%
4%
56%
46%
31%
31%
17%
3%
0%10%20%30%40%50%60%70%80%90%
100%
SubstanceAbuse
Treatment(n=75,208)
Eastern StateHospital(n=422)
Corrections:Community(n=2,723)
Corrections:Prison
(n=7,881)
Mental HealthTreatment(55,847)
ChildrensAdministration
(n=1,238)
Either High on Mental Health High on Substance High on Both
Source: Lucenko et al (2009). Report to the Legislature: Co-Occurring Disorders Among DSHS Clients. Olympia, WA: Department of Social and Health Services. Retrieved from http://publications.rda.dshs.wa.gov/1392/
Lower than expected rates of SA in Mental Health & Children’s
Admin
35%
12%
11%
56%
34%
15%
9%
47%
0%10%20%30%40%50%60%70%80%90%
100%
Substance AbuseTreatment (n=8,213)
Juvenile Justice(n=2,024)
Mental HealthTreatment (10,937)
Children'sAdministration
(n=239)
GAIN Short Screener Clinical Indicators
Source: Lucenko et al (2009). Report to the Legislature: Co-Occurring Disorders Among DSHS Clients. Olympia, WA: Department of Social and Health Services. Retrieved from http://publications.rda.dshs.wa.gov/1392/
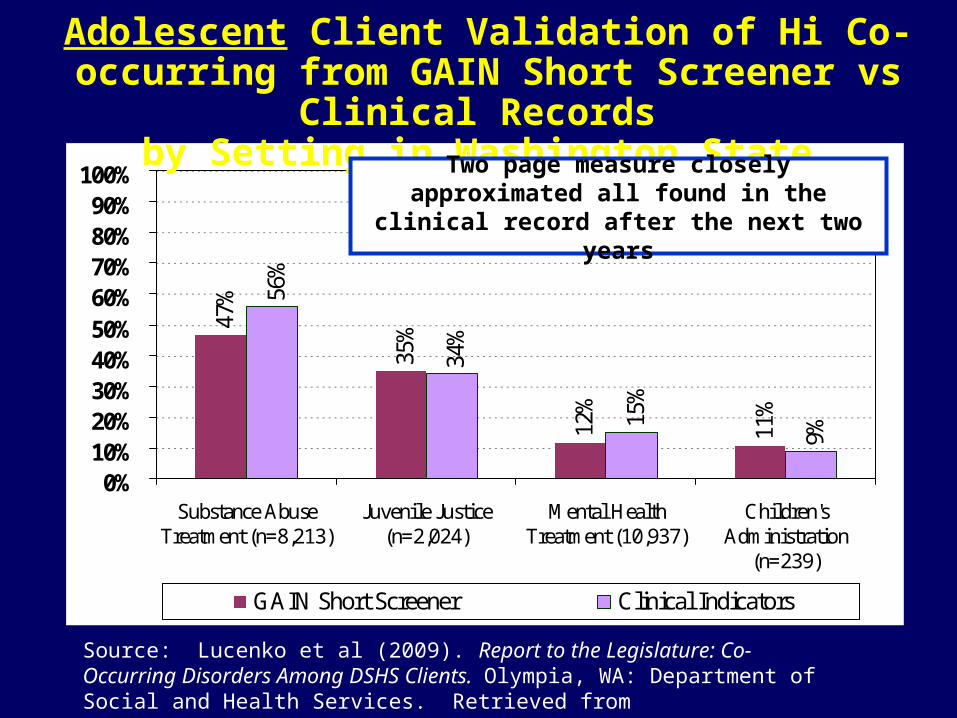
Adolescent Client Validation of Hi Co-occurring from GAIN Short Screener vs Clinical Records
by Setting in Washington State
Two page measure closely approximated all found in the clinical record after the next two years

Adult Client Validation of Hi Co-occurring from GAIN Short Screener vs Clinical Records
by Setting in Washington State
17%
3%
59%
39%
22%
56%
0%
10%20%
30%40%
50%
60%70%
80%90%
100%
Substance Abuse Treatment(n=75,208)
Mental Health Treatment(55,847)
Childrens Administration(n=1,238)
GAIN Short Screener Clinical Indicators
Source: Lucenko et al (2009). Report to the Legislature: Co-Occurring Disorders Among DSHS Clients. Olympia, WA: Department of Social and Health Services. Retrieved from http://publications.rda.dshs.wa.gov/1392/
Higher rate in clinical record in Mental Health and Children’s Administration
(But that was past on “any use” vs. “abuse/dependence” and 2 years vs. past year
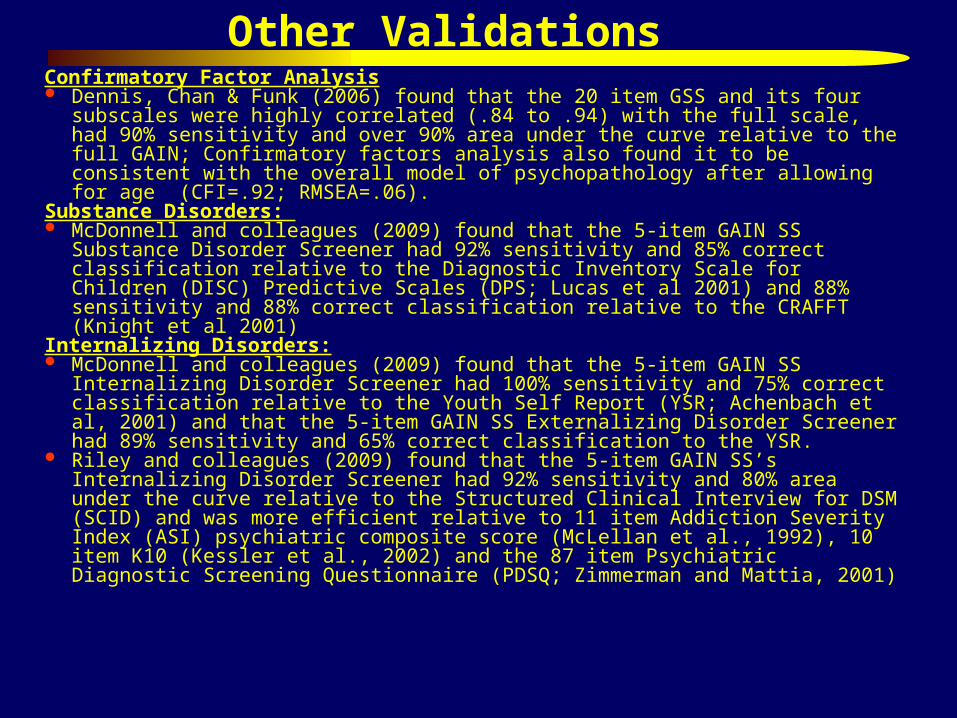
Other ValidationsConfirmatory Factor Analysis Dennis, Chan & Funk (2006) found that the 20 item GSS and its four subscales
were highly correlated (.84 to .94) with the full scale, had 90% sensitivity and over 90% area under the curve relative to the full GAIN; Confirmatory factors analysis also found it to be consistent with the overall model of psychopathology after allowing for age (CFI=.92; RMSEA=.06).
Substance Disorders: McDonnell and colleagues (2009) found that the 5-item GAIN SS Substance
Disorder Screener had 92% sensitivity and 85% correct classification relative to the Diagnostic Inventory Scale for Children (DISC) Predictive Scales (DPS; Lucas et al 2001) and 88% sensitivity and 88% correct classification relative to the CRAFFT (Knight et al 2001)
Internalizing Disorders: McDonnell and colleagues (2009) found that the 5-item GAIN SS Internalizing
Disorder Screener had 100% sensitivity and 75% correct classification relative to the Youth Self Report (YSR; Achenbach et al, 2001) and that the 5-item GAIN SS Externalizing Disorder Screener had 89% sensitivity and 65% correct classification to the YSR.
Riley and colleagues (2009) found that the 5-item GAIN SS’s Internalizing Disorder Screener had 92% sensitivity and 80% area under the curve relative to the Structured Clinical Interview for DSM (SCID) and was more efficient relative to 11 item Addiction Severity Index (ASI) psychiatric composite score (McLellan et al., 1992), 10 item K10 (Kessler et al., 2002) and the 87 item Psychiatric Diagnostic Screening Questionnaire (PDSQ; Zimmerman and Mattia, 2001)

GAIN Quick (GQ): Version 2
Strengths: Length (20-30min) in desired range, range of topics, efficiently categorizes, narrative reports to support screening, brief intervention, and referral to treatment
Problems: – Lacks scales or recency to support analyses or outcomes
related to “change over time”– Item response choices do not provide information about
lifetime problems important when someone has been incarcerated for more than a few weeks
– Current Personal Feedback Report focuses only on substance use and does not address the other content areas of the GAIN-Q
– Only about 60% of the items can be directly imported into the GAIN-I

GAIN Quick (GQ): Changes from Version 2 to 3:
Kept focus on screening, brief intervention and referral to treatment
Broke out sections for Crime/Violence, HIV risk, Work and School problems
Subsumed GSS and added similar screeners in other GAIN Q areas with recency response to address change and lifetime issues
Change measures for each symptom count and days items Created reasons for change items in each area to support
brief intervention, reducing number of items in substance use
Make all questions importable into full GAIN Expand narrative report to have more treatment planning
statements and to allow motivational interviewing within each area

GAIN-Quick (GQ) Version 3
Administration Time: about 25 minutes for core (varies depending on severity) and on average 25-45 minutes using full with motivational interview questions (depending on number of problem areas probed).
Training Requirements: 1 day (train the trainer) training plus certification within 1-2 months for administration certification, and 2 days of motivational intervention training plus 1-3 months for clinical certification.
Mode: Generally staff-administered on computer (can be done on paper or self-administered with proctor).
Purpose: Designed for use in targeted populations for more detailed screening, to support brief intervention or referral for further assessment or behavioral intervention.
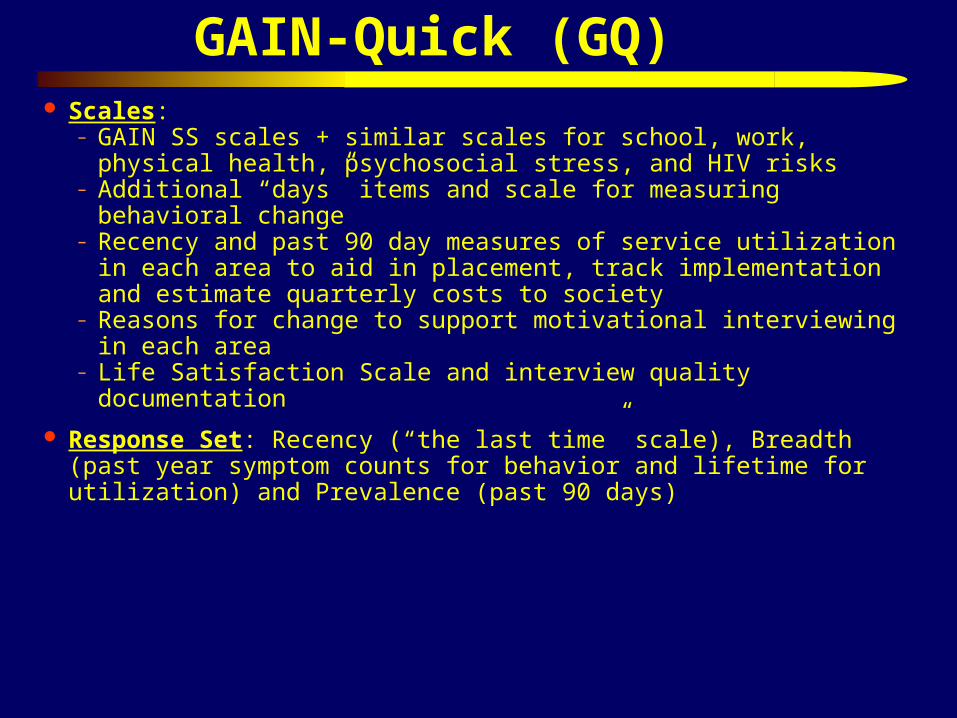
GAIN-Quick (GQ) Scales:
– GAIN SS scales + similar scales for school, work, physical health, psychosocial stress, and HIV risks
– Additional “days” items and scale for measuring behavioral change– Recency and past 90 day measures of service utilization in each
area to aid in placement, track implementation and estimate quarterly costs to society
– Reasons for change to support motivational interviewing in each area
– Life Satisfaction Scale and interview quality documentation
Response Set: Recency (“the last time” scale), Breadth (past year symptom counts for behavior and lifetime for utilization) and Prevalence (past 90 days)

GAIN-Quick (GQ) Problem Profile (Range based on 0/1-2/3+ Symptoms)
68%
26%
58%63%52%
6%
46% 47%
32%
0%10%20%30%40%50%60%70%80%90%
100%
Schoo
l Pro
blems
Wor
k Pro
blems
Physica
l Hea
lth P
roblem
s
Problem
s with
Str
ess
Risk B
ehav
ior P
roblem
s
Inte
rnali
zing D
isord
ers
Exter
nalizin
g Diso
rder
s
Substance
Use
Pro
blems
Crime &
Viol
ence
Pro
blems
Low
Mod
High
Source: GAIN-Q Pilot (n=138)

Number of Problems
94%3%1%1%1%
0%
10%
20%
30%
40%
50%
60%
70%
80%
90%
100%
No. ofProblems
No SR prob
1 Prob.
2 Probs.
3 Probs.
4 Probs.
99% endorsed one or more problems(94% 4 or more
problems)
Source: GAIN-Q Pilot (n=138)

Distribution of Summary Indices
15% 13%31%
49%
0%
10%
20%
30%
40%
50%
60%
70%
80%
90%
100%
ProblemPrevelance
Index
QuarterlyCost to Society
Qualityof Life
LifeSatisfaction
Index
High-good
Mod
Low
Low
Mod
High-bad
Source: GAIN Q Pilot . (n=138)
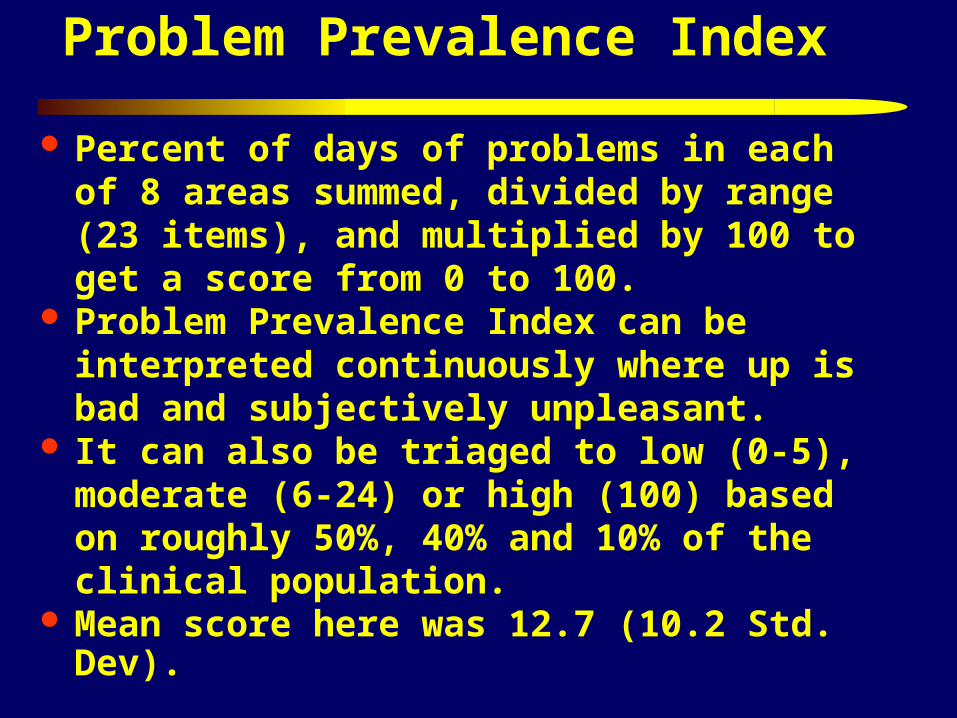
Problem Prevalence Index
Percent of days of problems in each of 8 areas summed, divided by range (23 items), and multiplied by 100 to get a score from 0 to 100.
Problem Prevalence Index can be interpreted continuously where up is bad and subjectively unpleasant.
It can also be triaged to low (0-5), moderate (6-24) or high (100) based on roughly 50%, 40% and 10% of the clinical population.
Mean score here was 12.7 (10.2 Std. Dev).

Quarterly Costs to Society
The frequency of using tangible services in the 90 days before intake (e.g., health care utilization, days in detention, probation, parole, days of missed school) in each of the 8 areas valued in 2009 dollars, and summed.
Quarterly costs to society can be used continuously with up as more expensive to society.
It can also be triaged as low ($0 to $1999), moderate ($2000 to $9999) and high ($10000 or more) based on average costs of outpatient and residential treatment respectively.
The 138 clients here cost society an average of $6,118 (SD=$12,382) per person in the quarter before intake and $24,471 (SD=$49,551) in the year before intake.
Source: GAIN-Q Pilot (n=138)
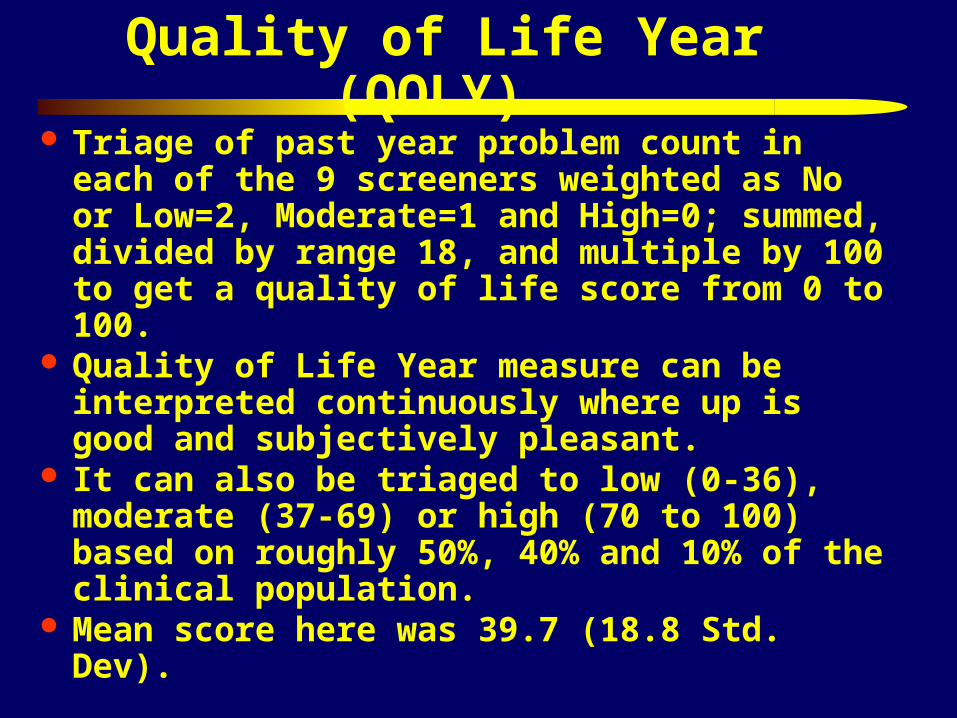
Quality of Life Year (QOLY)
Triage of past year problem count in each of the 9 screeners weighted as No or Low=2, Moderate=1 and High=0; summed, divided by range 18, and multiple by 100 to get a quality of life score from 0 to 100.
Quality of Life Year measure can be interpreted continuously where up is good and subjectively pleasant.
It can also be triaged to low (0-36), moderate (37-69) or high (70 to 100) based on roughly 50%, 40% and 10% of the clinical population.
Mean score here was 39.7 (18.8 Std. Dev).
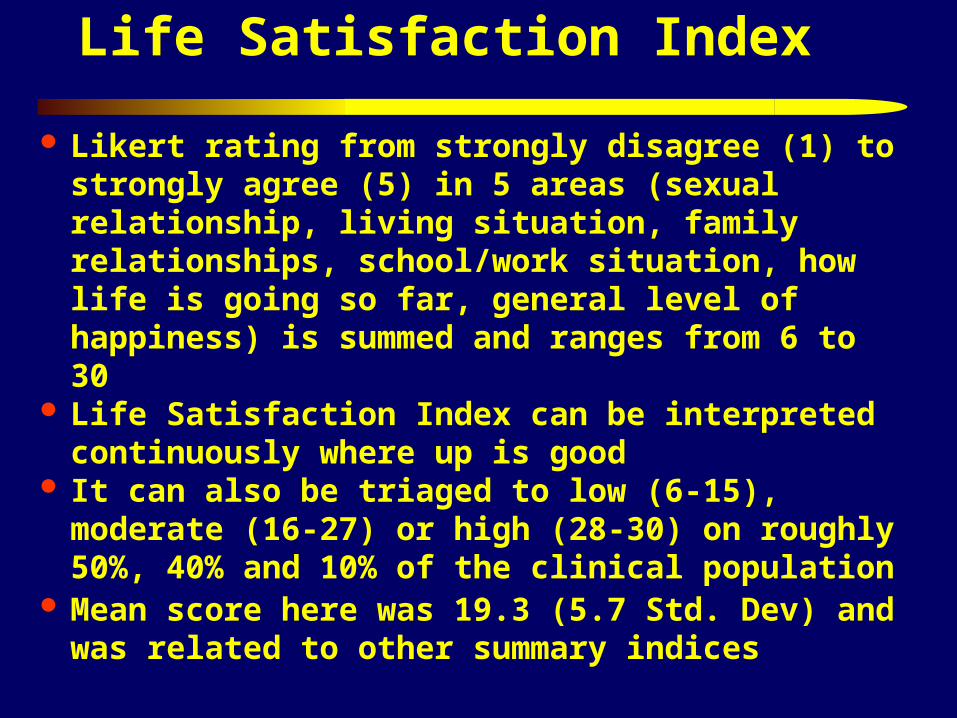
Life Satisfaction Index
Likert rating from strongly disagree (1) to strongly agree (5) in 5 areas (sexual relationship, living situation, family relationships, school/work situation, how life is going so far, general level of happiness) is summed and ranges from 6 to 30
Life Satisfaction Index can be interpreted continuously where up is good
It can also be triaged to low (6-15), moderate (16-27) or high (28-30) on roughly 50%, 40% and 10% of the clinical population
Mean score here was 19.3 (5.7 Std. Dev) and was related to other summary indices
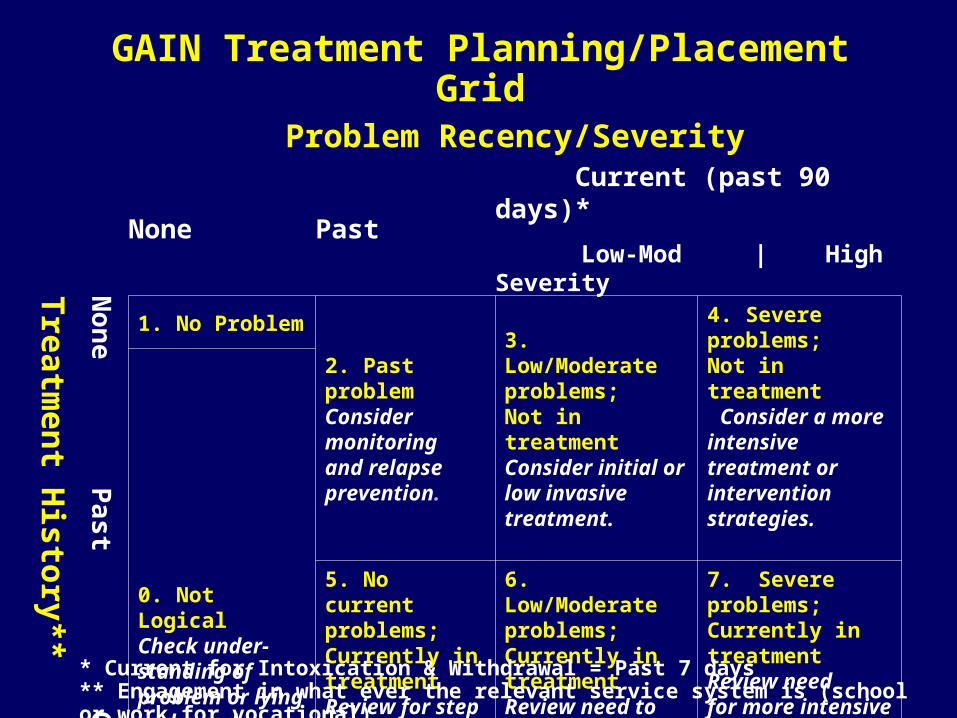
GAIN Treatment Planning/Placement Grid
Problem Recency/Severity
None Past Current (past 90 days)*
Low-Mod | High Severity Treatm
ent H
istory**
Non
e Past C
urren
t .
1. No Problem2. Past problem Consider monitoring and relapse prevention.
3. Low/Moderate problems; Not in treatmentConsider initial or low invasive treatment.
4. Severe problems;Not in treatment Consider a more intensive treatment or intervention strategies.
0. Not LogicalCheck under- standing of problem or lying and recode.
5. No current problems; Currently in treatmentReview for step down or discharge.
6. Low/Moderate problems; Currently in treatment Review need to continue or step up.
7. Severe problems; Currently in treatmentReview need for more intensive or assertive levels.
* Current for Intoxication & Withdrawal = Past 7 days** Engagement in what ever the relevant service system is (school or work for vocational)

Treatment Planning Needs by GQ Problem Area
0% 20% 40% 60% 80% 100%
School*
Work*
Health Problems
Stress
Risk Behaviors
Internal Disorders
External Disorders
Substance Disorders
Crime & Violence*
Inconsistent No problem Past Prob Low/Mod ProbHigh Prob No Prob in Tx L/M Prob in Tx H Prob in Tx
* For school and work, in TX is defined as engaged; for Crime & violence, it is involved with CJS. Source: GAIN-Q Pilot (n=138)
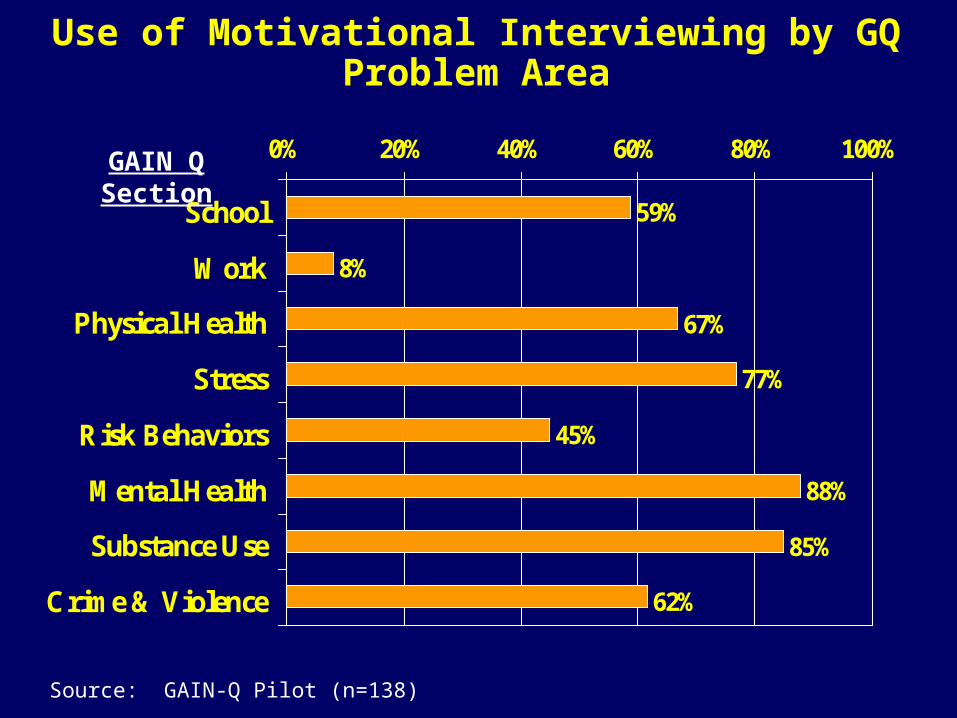
Use of Motivational Interviewing by GQ Problem Area
Source: GAIN-Q Pilot (n=138)
59%
8%
67%
77%
45%
88%
85%
62%
0% 20% 40% 60% 80% 100%
School
Work
Physical Health
Stress
Risk Behaviors
Mental Health
Substance Use
Crime & Violence
GAIN Q Section
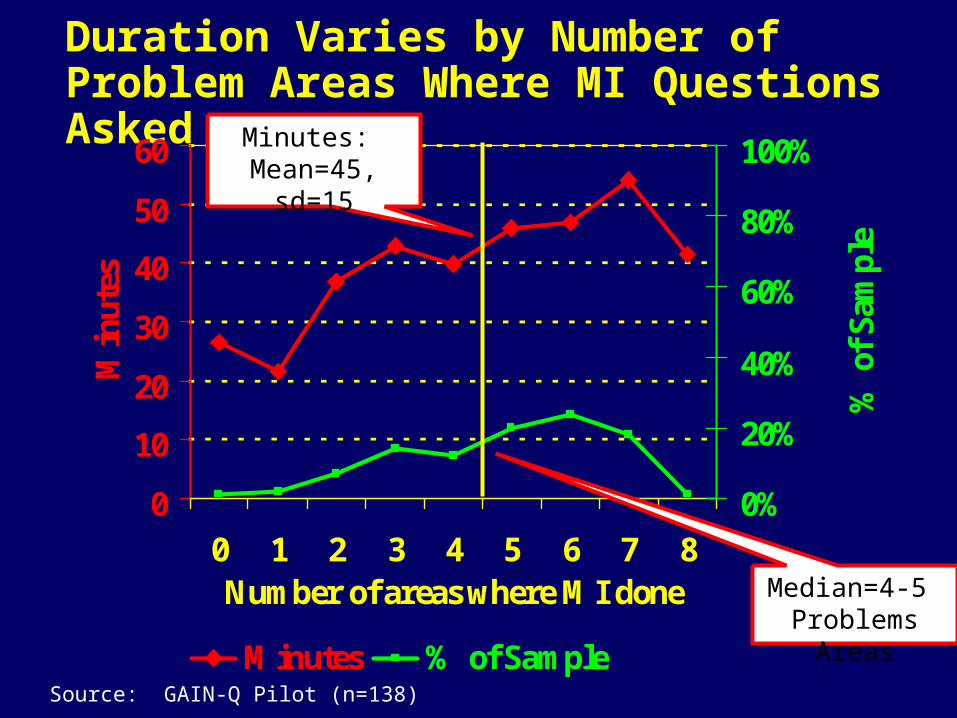
Duration Varies by Number of Problem Areas Where MI Questions Asked
0
10
20
30
40
50
60
0 1 2 3 4 5 6 7 8Number of areas where MI done
Min
utes
0%
20%
40%
60%
80%
100%
% o
f Sa
mpl
e
Minutes % of Sample
Minutes: Mean=45, sd=15
Median=4-5 Problems Areas
Source: GAIN-Q Pilot (n=138)
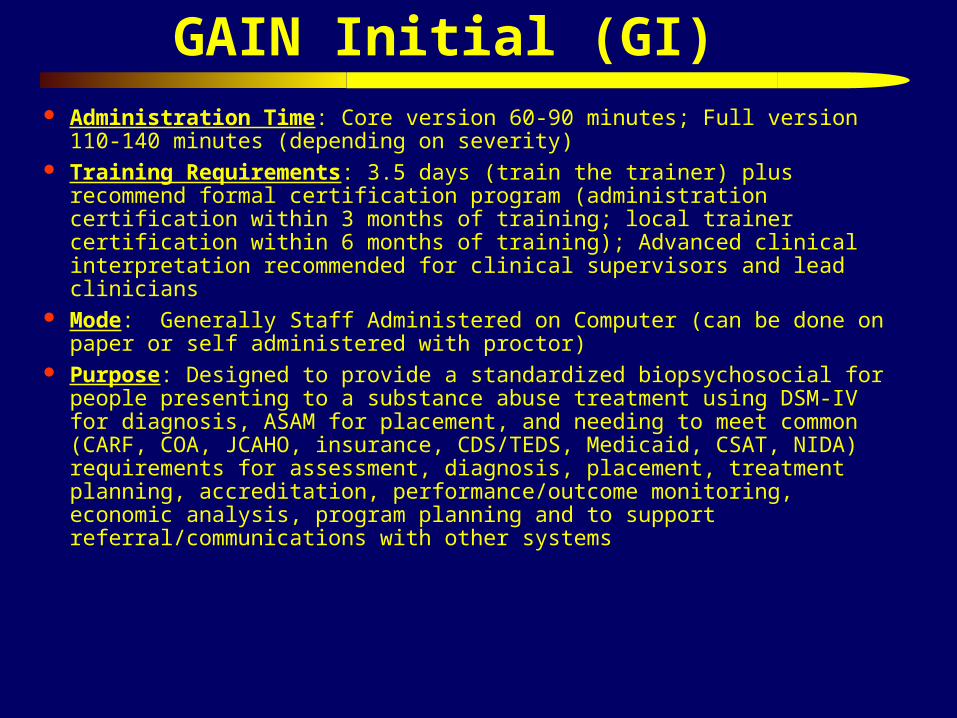
GAIN Initial (GI) Administration Time: Core version 60-90 minutes; Full version 110-140
minutes (depending on severity) Training Requirements: 3.5 days (train the trainer) plus recommend formal
certification program (administration certification within 3 months of training; local trainer certification within 6 months of training); Advanced clinical interpretation recommended for clinical supervisors and lead clinicians
Mode: Generally Staff Administered on Computer (can be done on paper or self administered with proctor)
Purpose: Designed to provide a standardized biopsychosocial for people presenting to a substance abuse treatment using DSM-IV for diagnosis, ASAM for placement, and needing to meet common (CARF, COA, JCAHO, insurance, CDS/TEDS, Medicaid, CSAT, NIDA) requirements for assessment, diagnosis, placement, treatment planning, accreditation, performance/outcome monitoring, economic analysis, program planning and to support referral/communications with other systems

Scales: The GI has 9 sections (access to care, substance use, physical health, risk and protective behaviors, mental health, recovery environment, legal, vocational, and staff ratings) that include 103 long (alpha over .9) and short (alpha over .7) scales, summative indices, and over 3000 created variables to support clinical decision making and evaluation. It is also modularized to support customization
Response Set: Breadth (past year symptom counts for behavior and lifetime for utilization), Recency (48 hours, 3-7 days, 1-4 weeks, 2-3 months, 4-12 months, 1+ years, never) and Prevalence (past 90 days), patient and staff ratings
Interpretation: – Items can be used individually or to create specific diagnostic or
treatment planning statements– Items can be summed into scales or indices for each behavior
problem or type of service utilization– All scales, indices and selected individual items have interpretative
cut-points to facilitate clinical interpretation and decision making
GAIN Initial (GI) (continued)
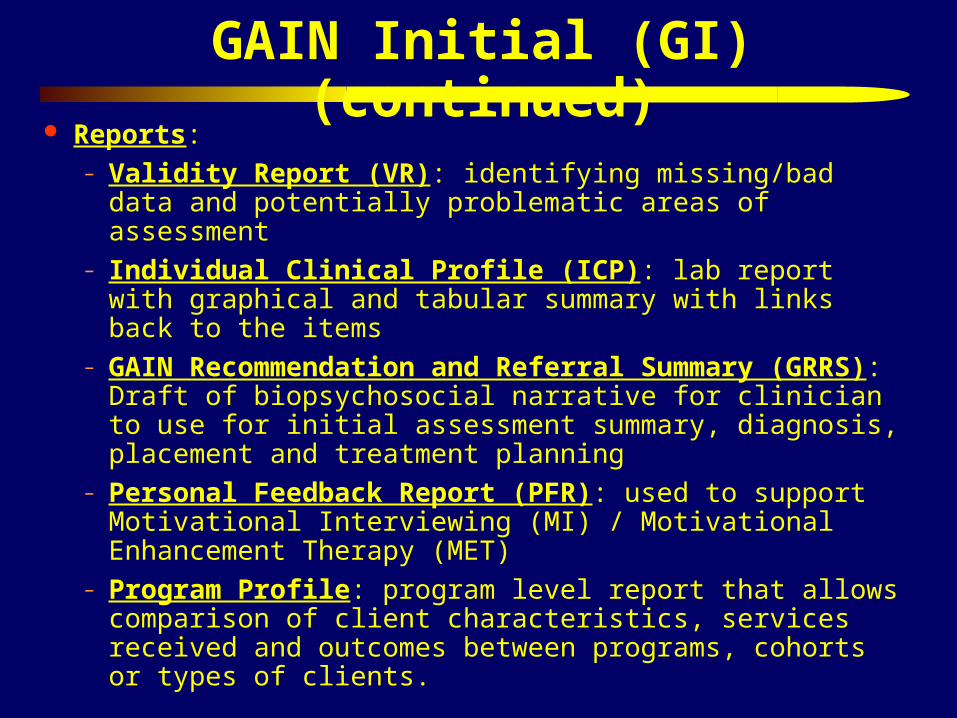
Reports: – Validity Report (VR): identifying missing/bad data and
potentially problematic areas of assessment– Individual Clinical Profile (ICP): lab report with graphical
and tabular summary with links back to the items– GAIN Recommendation and Referral Summary (GRRS):
Draft of biopsychosocial narrative for clinician to use for initial assessment summary, diagnosis, placement and treatment planning
– Personal Feedback Report (PFR): used to support Motivational Interviewing (MI) / Motivational Enhancement Therapy (MET)
– Program Profile: program level report that allows comparison of client characteristics, services received and outcomes between programs, cohorts or types of clients.
GAIN Initial (GI) (continued)

GAIN Initial Profile: Substance Problems Past Year(Range based range of clinical/logical/statistical rules)
31%19%15%
7%0%
10%
20%
30%
40%
50%
60%
70%
80%
90%
100%
Sub.
Use
/In
duce
dP
rob.
Abu
se
Dep
ende
nce
Sub.
Pro
b.P
ast
Yea
r
Low
Mod.
High
Source: Reclaiming Futures Portland, OR and Santa Cruz, CA sites (n=192)

GAIN Initial Profile: Substance Problems by Time(Range based range of clinical/logical/statistical rules)
39%31%
13%2%0%
10%
20%
30%
40%
50%
60%
70%
80%
90%
100%
Sub.
Pro
b.L
ifet
ime
Sub.
Pro
b.P
ast
Yea
r
Sub.
Pro
b.P
ast
Mon
th
Wit
hdra
wal
Sx P
ast
Wee
k
Low
Mod.
High
Source: Reclaiming Futures Portland, OR and Santa Cruz, CA sites (n=192)

GAIN Initial Profile: Motivation and Readiness(Range based range of clinical/logical/statistical rules)
0% 7%19%
32%
76%
0%
10%
20%
30%
40%
50%
60%
70%
80%
90%
100%
Self
-E
ffic
acy
Tre
atm
ent
Res
ista
nce
Tre
atm
ent
Pre
ssur
e
Tre
atm
ent
Mot
ivat
ion
Pro
blem
Ori
enta
tion
Low
Mod.
High
Source: Reclaiming Futures Portland, OR and Santa Cruz, CA sites (n=192)
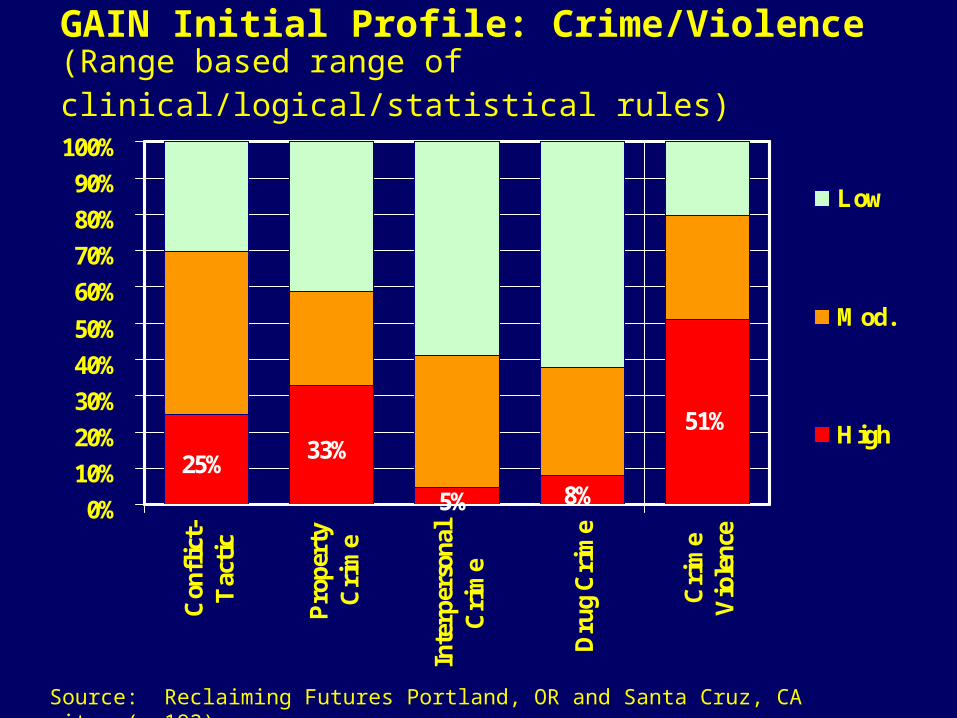
GAIN Initial Profile: Crime/Violence(Range based range of clinical/logical/statistical rules)
25%33%
5% 8%
51%
0%
10%
20%
30%
40%
50%
60%
70%
80%
90%
100%
Con
flic
t-T
acti
c
Pro
pert
yC
rim
e
Inte
rper
sona
lC
rim
e
Dru
g C
rim
e
Cri
me
Vio
lenc
e
Low
Mod.
High
Source: Reclaiming Futures Portland, OR and Santa Cruz, CA sites (n=192)

GAIN Initial Profile: Environmental Risk(Range based range of clinical/logical/statistical rules)
39%
64%54%
28%
0%
10%
20%30%
40%
50%
60%
70%80%
90%
100%
Liv
ing
Env
iron
men
tR
isk
Voc
atio
nal
Env
iron
men
tR
isk
Soci
alE
nvir
onm
ent
Ris
k
Env
iron
men
tal
Ris
k
Low
Mod.
High
Source: Reclaiming Futures Portland, OR and Santa Cruz, CA sites (n=192)
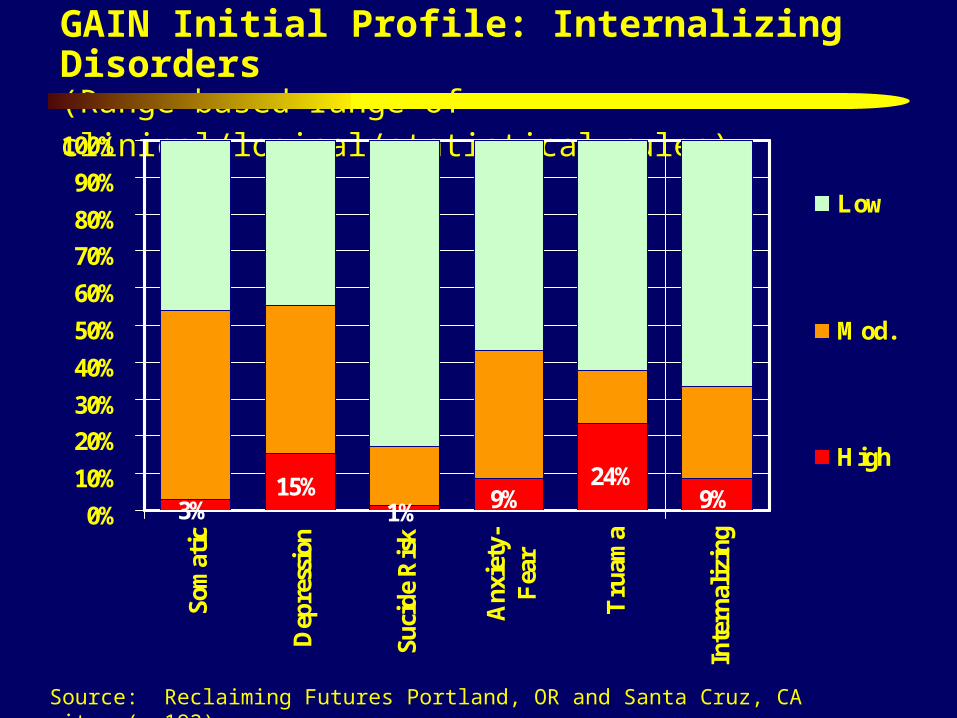
GAIN Initial Profile: Internalizing Disorders(Range based range of clinical/logical/statistical rules)
3%15%
1% 9% 9%24%
0%
10%
20%
30%
40%
50%
60%
70%
80%
90%
100%
Som
atic
Dep
ress
ion
Suci
de R
isk
Anx
iety
-F
ear
Tru
ama
Inte
rnal
izin
g
Low
Mod.
High
Source: Reclaiming Futures Portland, OR and Santa Cruz, CA sites (n=192)

GAIN Initial Profile: Externalizing Disorders(Range based range of clinical/logical/statistical rules)
20%12% 14% 20%
0%
10%20%
30%
40%50%
60%
70%
80%90%
100%
Inat
tent
iven
ess
Hyp
erac
tivi
ty-
impl
usiv
e
Con
duct
Dis
orde
r
Ext
erna
lizi
ng
Low
Mod.
High
Source: Reclaiming Futures Portland, OR and Santa Cruz, CA sites (n=192)

GAIN Initial Profile: Personality Disorders(Range based range of clinical/logical/statistical rules)
53%
0%
10%
20%
30%
40%
50%
60%
70%
80%
90%
100%
Cau
tiou
s(C
lust
er A
)
Impl
usiv
e(C
lust
er B
)
Wor
ryin
g(C
lust
er C
)
Tot
alP
erso
nali
ty
Low
Mod.
High
Source: Reclaiming Futures Portland, OR and Santa Cruz, CA sites (n=192)
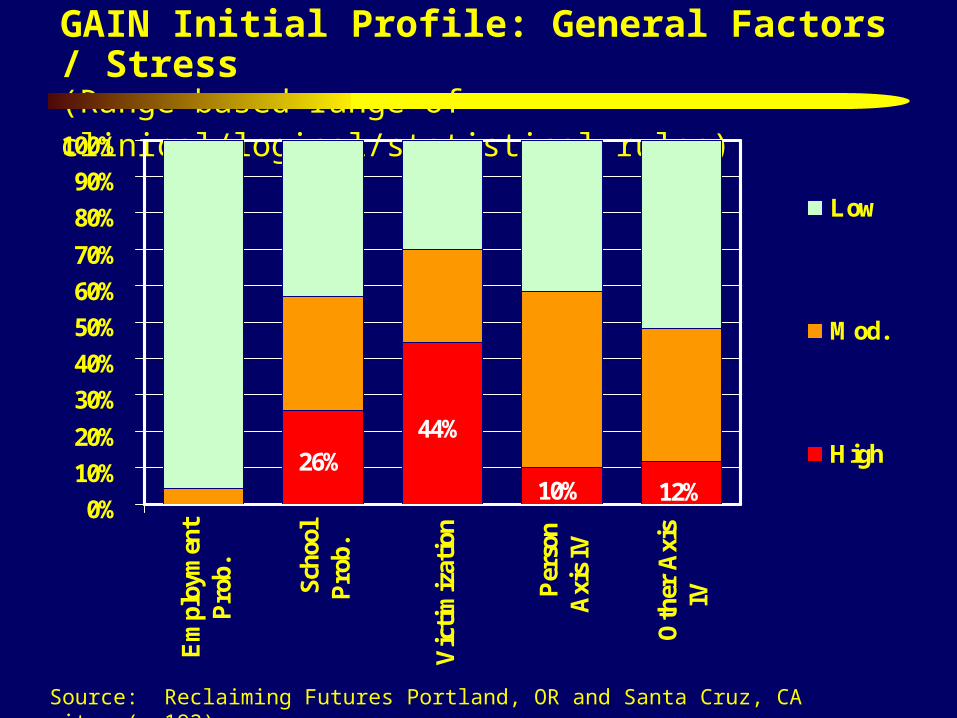
GAIN Initial Profile: General Factors / Stress(Range based range of clinical/logical/statistical rules)
26%44%
10% 12%0%
10%
20%
30%
40%
50%
60%
70%
80%
90%
100%
Em
ploy
men
tP
rob.
S
choo
lP
rob.
Vic
tim
izat
ion
P
erso
nA
xis
IV
O
ther
Axi
sIV
Low
Mod.
High
Source: Reclaiming Futures Portland, OR and Santa Cruz, CA sites (n=192)

GAIN Initial Profile: Other Problem Scales(Range based range of clinical/logical/statistical rules)
12%2% 4%
17%0%
10%
20%
30%
40%
50%
60%
70%
80%
90%
100%
Hea
lth
Gam
blin
g
Soci
alSu
ppor
t
Lif
eSa
tisf
acti
on
Low
Mod.
High
Source: Reclaiming Futures Portland, OR and Santa Cruz, CA sites (n=192)
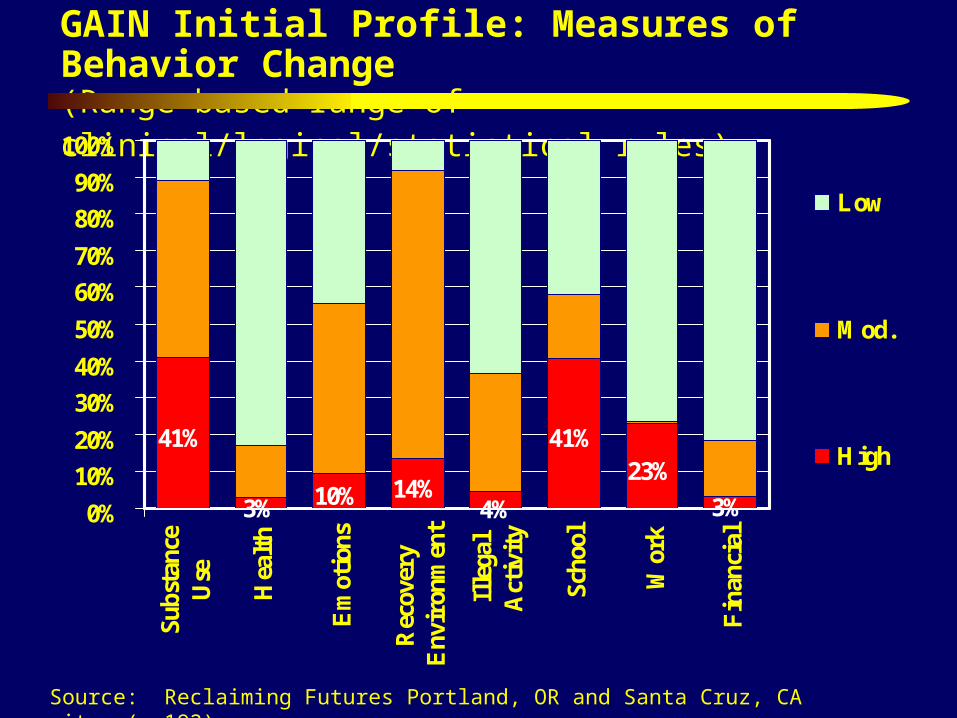
GAIN Initial Profile: Measures of Behavior Change (Range based range of clinical/logical/statistical rules)
41%
3% 10% 14%
41%23%
3%4%0%
10%
20%
30%
40%
50%
60%
70%
80%
90%
100%Su
bsta
nce
Use
Hea
lth
Em
otio
ns
Rec
over
yE
nvir
onm
ent
Ille
gal
Act
ivit
y
Scho
ol
Wor
k
Fin
anci
al
Low
Mod.
High
Source: Reclaiming Futures Portland, OR and Santa Cruz, CA sites (n=192)
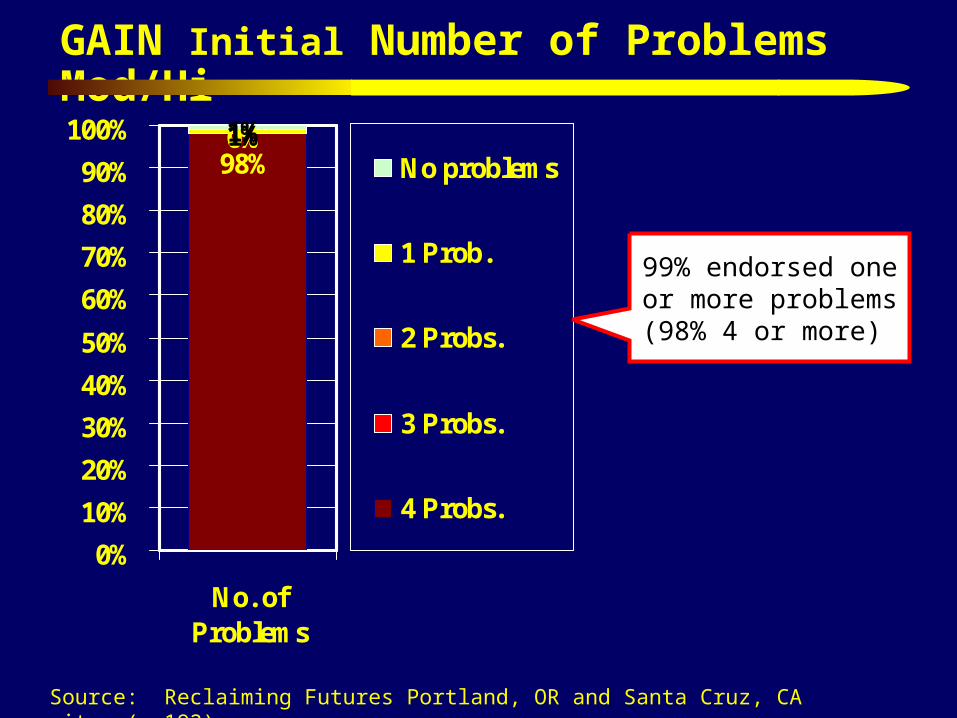
GAIN Initial Number of Problems Mod/Hi
98%0%0%1%1%
0%
10%
20%
30%
40%
50%
60%
70%
80%
90%
100%
No. ofProblems
No problems
1 Prob.
2 Probs.
3 Probs.
4 Probs.
99% endorsed one or more problems
(98% 4 or more)
Source: Reclaiming Futures Portland, OR and Santa Cruz, CA sites (n=192)
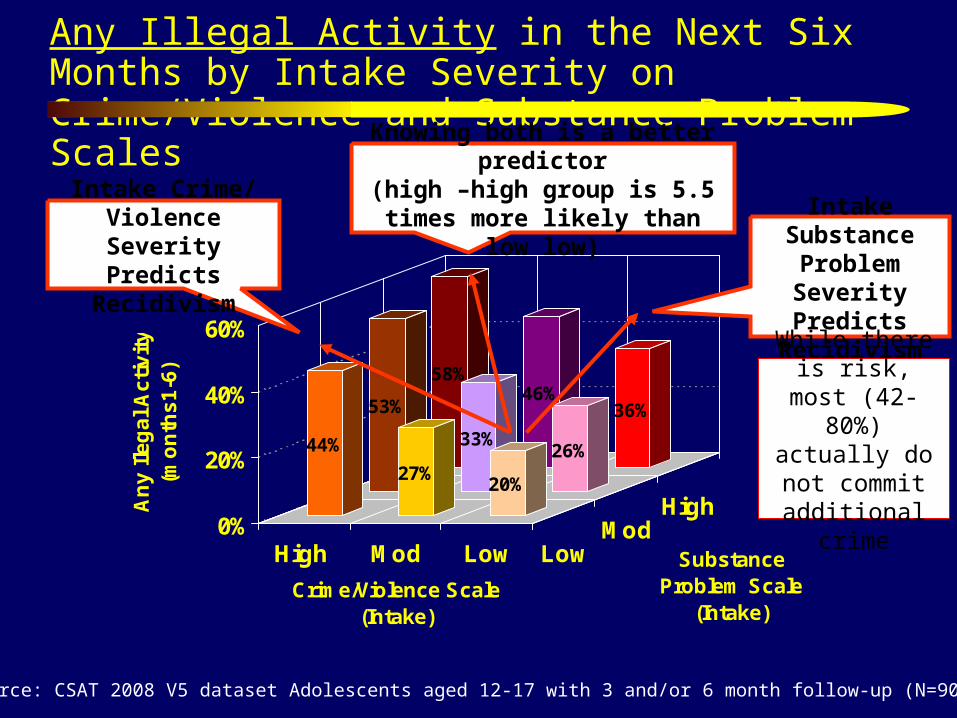
Any Illegal Activity in the Next Six Months by Intake Severity on Crime/Violence and Substance Problem Scales
58%46%
36%53%
33%26%44%
27%20%
0%
20%
40%
60%
An
y I
leg
al
Ac
tiv
ity
(mo
nth
s1
-6)
High Mod Low LowMod
High
Crime/Violence Scale (Intake)
Substance Problem Scale
(Intake)
Source: CSAT 2008 V5 dataset Adolescents aged 12-17 with 3 and/or 6 month follow-up (N=9006)
Intake Crime/ Violence Severity
Predicts Recidivism
Intake Substance Problem Severity
Predicts Recidivism
Knowing both is a better predictor(high –high group is 5.5 times more
likely than low low)
While there is risk, most (42-80%) actually do not commit
additional crime

GAIN Treatment Planning/Placement Grid
Problem Recency/Severity
None Past Current (past 90 days)*
Low-Mod | High Severity Treatm
ent H
istory
Non
e Past C
urren
t .
1. No Problem2. Past problem Consider monitoring and relapse prevention.
3. Low/Moderate problems; Not in treatmentConsider initial or low invasive treatment.
4. Severe problems;Not in treatment Consider a more intensive treatment or intervention strategies.
0. Not LogicalCheck under- standing of problem or lying and recode.
5. No current problems; Currently in treatmentReview for step down or discharge.
6. Low/Moderate problems; Currently in treatment Review need to continue or step up.
7. Severe problems; Currently in treatmentReview need for more intensive or assertive levels.
* Current for Intoxication & Withdrawal = Past 7 days

Reclaiming Futures ASAM Placement Cells
0% 20% 40% 60% 80% 100%
B1.Intox/Withd.
B2 Biomedical
B3.Psych/Beh
B4.Readiness
B5.Rel. Pot.
B6.Environ.
Inconsistent No problem Past Prob Low/Mod ProbHigh Prob No Prob in Tx L/M Prob in Tx H Prob in Tx
Source: Reclaiming Futures Portland, OR and Santa Cruz, CA sites (n=192)

Other Common Treatment Planning Needs: Reclaiming Futures
90%
89%
87%
80%
76%
74%
73%
70%
66%
62%
61%
59%
58%
57%
56%
0%
10
%
20
%
30
%
40
%
50
%
60
%
70
%
80
%
90
%
10
0%
Continuing care
Case management
Recovery Environment Risk
Coping w/ Psychosocial Stressors
Accessing Treatment
Child Maltreatment
Disatisfaction with Environment
Behavior Control
School Problems
Anger Management
Vocational Assistance
Detox or Withdrawal
Recovery Coach
HIV risk reduction (sex)
Tobacco CessationSource: Reclaiming Futures (n=192)

75
Part 3. Highlight our current work to using actuarial estimates of outcomes to improve placement decisions

CSAT Adolescent Treatment GAIN Data from 203 level of care x site combinations
Outpatient
General Group Home
Short-Term Residential
Outpatient Continuing CareIntensive Outpatient
Long-term ResidentialModerate-Term Residential
Early InterventionOtherCorrections
Levels of Care
Source: Dennis, Funk & Hanes-Stevens, 2008
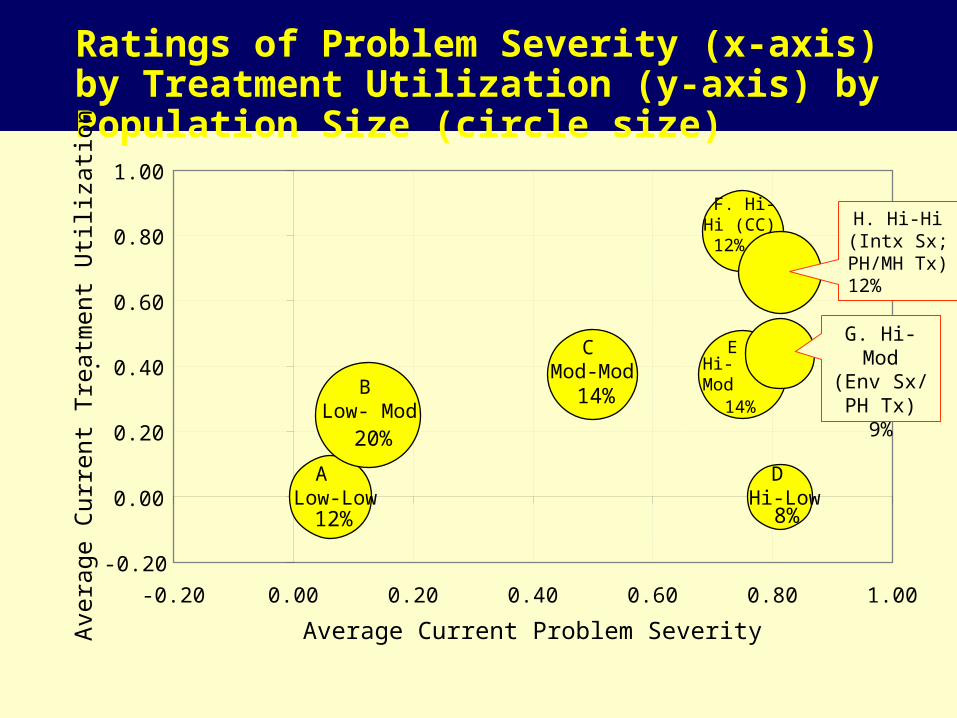
Ratings of Problem Severity (x-axis) by Treatment Utilization (y-axis) by Population Size (circle size)
12%
20%
14%
8%
14%
12%
-0.20
0.00
0.20
0.40
0.60
0.80
1.00
-0.20 0.00 0.20 0.40 0.60 0.80 1.00
Average Current Problem Severity
Ave
rage
Cur
rent
Tre
atm
ent U
tili
zati
on
.
A Low-Low
B Low- Mod
C Mod-Mod
DHi-Low
EHi-Mod
F. Hi-Hi (CC)
G. Hi-Mod(Env Sx/ PH Tx)
9%
H. Hi-Hi(Intx Sx; PH/MH Tx) 12%

Variance Explained in 10 NOMS Outcomes
\1 Past month \2 Past 90 days *All statistically Significant
26%
24%
11%
25%
15%
33%
26%
18%
14%
8%
24%
0% 5% 10% 15% 20% 25% 30% 35%
No AOD Use
No AOD related Prob.
No Health Problems
No Mental Health Prob.
No Illegal Activity
No JJ System Involve.
Living in Community
No Family Prob.
Vocationally Engaged
Social Support
Count of above
Percent of Variance Explained
Source: CSAT 2007 AT Outcome Data Set (n=11,013)
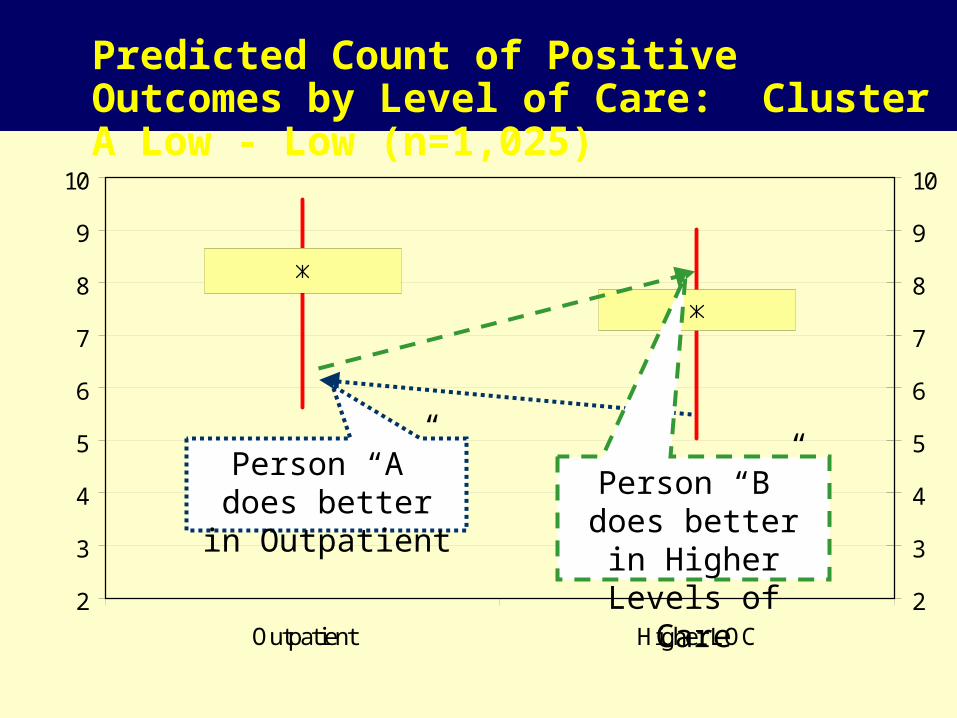
Predicted Count of Positive Outcomes by Level of Care: Cluster A Low - Low (n=1,025)
2
3
4
5
6
7
8
9
10
Outpatient Higher LOC
2
3
4
5
6
7
8
9
10
Predicted Count of Positive Outcomes by Level of Care: Cluster A Low - Low (n=1,025)
Person “A” does better in Outpatient
Person “B” does better in Higher Levels of Care
Best Level of Care*: Cluster A Low - Low (n=1,025)
Source: CSAT 2007 AT Outcome Data Set (n=11,013)
Best Level of Care*: Cluster A Low - Low (n=1,025)
99.6%
0.4%0%
20%
40%
60%
80%
100%
120%
Outpatient Higher LOC
% B
est
Pre
dic
ted O
utc
om
es
* Based on Maximum Predicted Count of Positive Outcomes
Source: CSAT 2007 AT Outcome Data Set (n=11,013)
Best Level of Care*: Cluster B Low - Mod (n=1,654)
0.4%
14.1%
75.1%
10.5%
0%
10%
20%
30%
40%
50%
60%
70%
80%
90%
Outpatient IOP OPCC Residential
% B
est P
redi
cted
Out
com
es
* Based on Maximum Predicted Count of Positive Outcomes
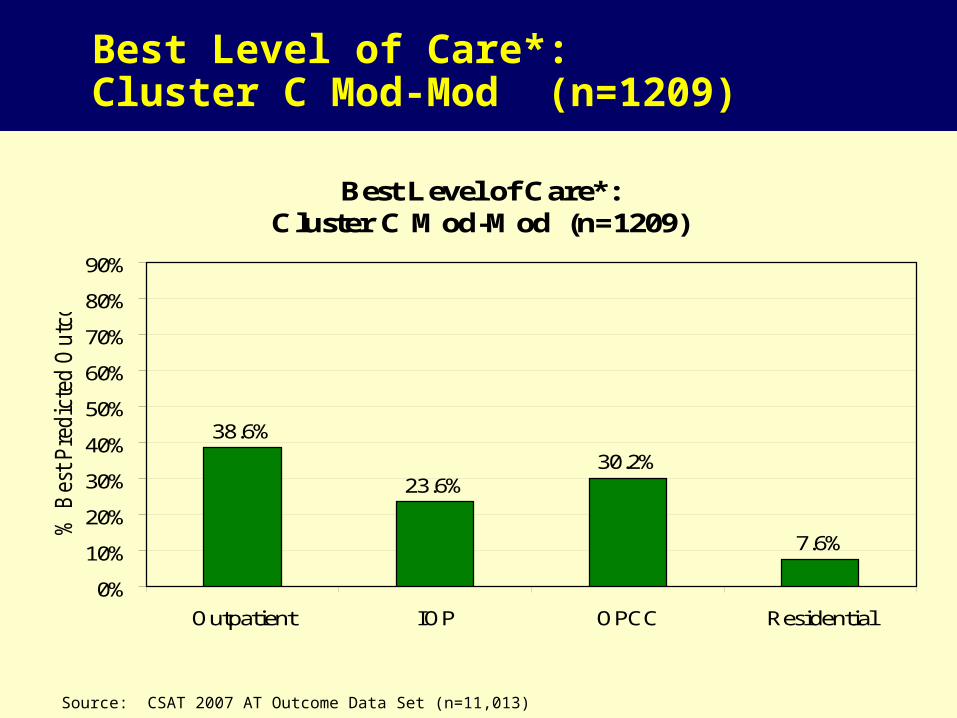
Best Level of Care*: Cluster C Mod-Mod (n=1209)
Source: CSAT 2007 AT Outcome Data Set (n=11,013)
Best Level of Care*: Cluster C Mod-Mod (n=1209)
30.2%
7.6%
23.6%
38.6%
0%
10%
20%
30%
40%
50%
60%
70%
80%
90%
Outpatient IOP OPCC Residential
% B
est
Pre
dic
ted O
utc
om
es
* Based on Maximum Predicted Count of Positive Outcomes

Source: CSAT 2007 AT Outcome Data Set (n=11,013)
Best Level of Care*: Cluster D Hi-Low (n=687)
38.3%33.8%
27.9%
0%
10%
20%
30%
40%
50%
60%
70%
80%
90%
Outpatient IOP/OPCC Residential * Based on Maximum Predicted Count of Positive Outcomes

Best Level of Care*: Cluster F Hi-Hi (CC) (n=968)
Source: CSAT 2007 AT Outcome Data Set (n=11,013)
Best Level of Care*: Cluster F Hi-Hi (CC) (n=968)
81.5%
8.6%
0.0%
9.9%
0%
10%
20%
30%
40%
50%
60%
70%
80%
90%
Outpatient IOP OPCC Residential
% B
est
Pre
dic
ted O
utc
om
es
* Based on Maximum Predicted Count of Positive Outcomes
Source: CSAT 2007 AT Outcome Data Set (n=11,013)
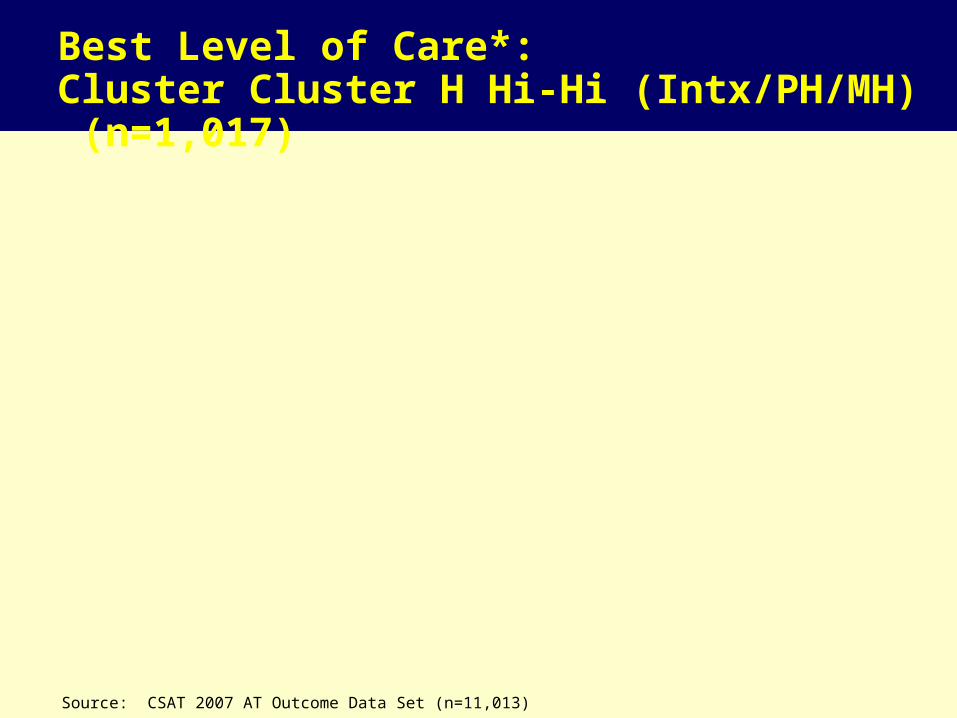
Best Level of Care*: Cluster Cluster H Hi-Hi (Intx/PH/MH) (n=1,017)
78.2%
17.2%
0.0%4.6%
0%
10%
20%
30%
40%
50%
60%
70%
80%
90%
Outpatient IOP OPCC Residential
% B
est P
redi
cted
Out
com
es
* Based on Maximum Predicted Count of Positive Outcomes
Source: CSAT 2007 AT Outcome Data Set (n=11,013)
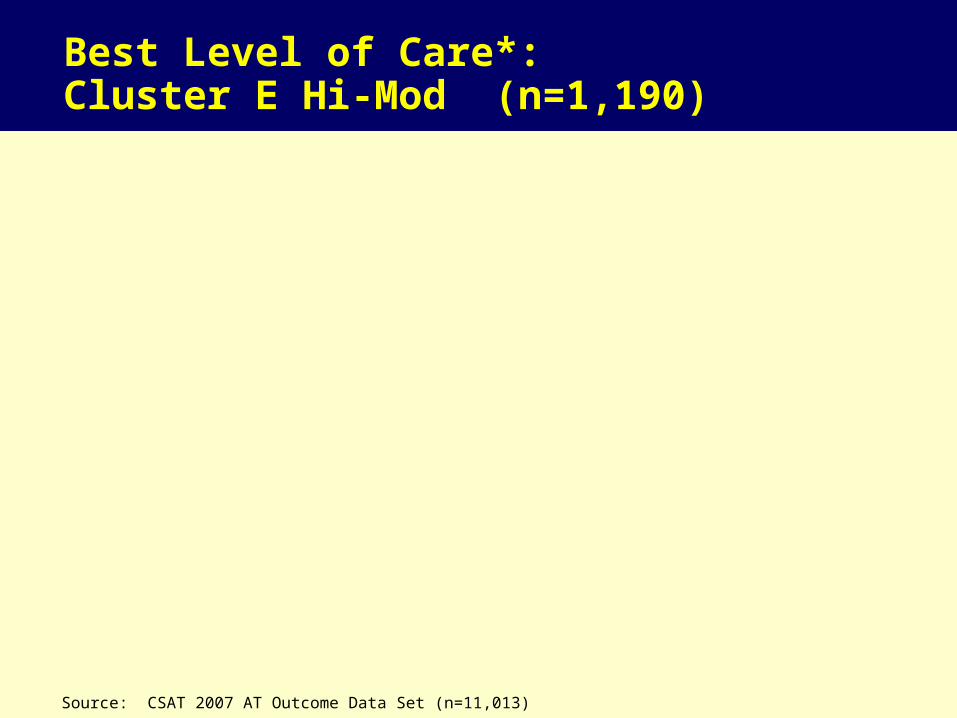
Best Level of Care*: Cluster E Hi-Mod (n=1,190)
1.1%
88.3%
10.6%
0.0%0%
10%
20%
30%
40%
50%
60%
70%
80%
90%
Outpatient IOP OPCC Residential
% B
est P
redi
cted
Out
com
es
* Based on Maximum Predicted Count of Positive Outcomes
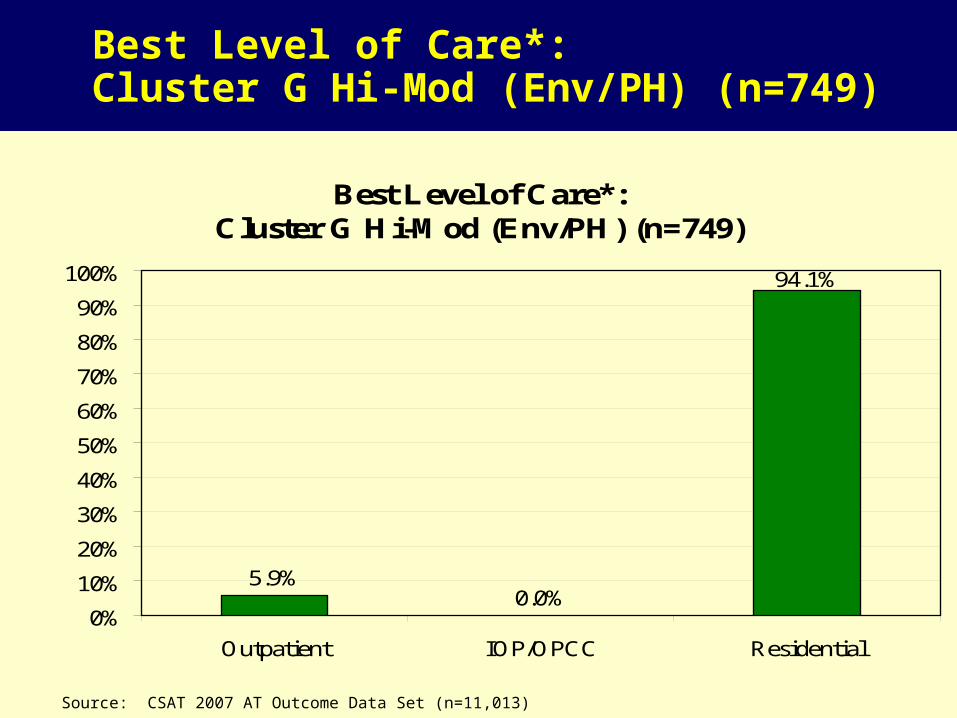
Best Level of Care*: Cluster G Hi-Mod (Env/PH) (n=749)
Source: CSAT 2007 AT Outcome Data Set (n=11,013)
Best Level of Care*: Cluster G Hi-Mod (Env/PH) (n=749)
94.1%
5.9%0.0%
0%
10%
20%
30%
40%
50%
60%
70%
80%
90%
100%
Outpatient IOP/OPCC Residential
* Based on Maximum Predicted Count of Positive Outcomes

Best (x) by Actual (y) Level of Care Placement
3132
797
1968
2339
0
500
1000
1500
2000
2500
3000
3500
Outpatient (n=3132)
Intensive Outpatient(n=797)
OP - ContinuingCare (n=1968)
Residential(n=2339)
Higher
Best
Lower

553/771=72%unmet need
218/224=97% to targeted
771/982=79% in need
Exploring Need, Unmet Need, & Targeting of Mental Health Services in AAFT
Size of the Problem
Extent to which services are currently being targeted
Extent to which services are not reaching those in most need
At Intake .
After 3 mon
No/Low
Need
Mod/High
Need
Total
Any Treatment 6 218 224
No Treatment 205 553 758
Total 211 771 982

Mental Health Problem (at intake) vs. Any MH Treatment by 3 months
79%
97%
72%
0%
10%
20%
30%
40%
50%
60%
70%
80%
90%
100%
% of Clients WithMod/High Need
(n=771/982)*
% w Need but No ServiceAfter 3 months
(n=553/771)
% of Services Going toThose in Need
(n=218/224)
*3+ on ASAM dimension B3 criteriaSource: 2008 CSAT AAFT Summary Analytic Dataset

Why Do We Care About Unmet Need?
If we subset to those in need, getting mental health services predicts reduced mental health problems
Both psychosocial and medication interventions are associated with reduced problems
If we subset to those NOT in need, getting mental health services does NOT predict change in mental health problems
Conversely, we also care about services being poorly targeted to those in need.

Residential Treatment need (at intake) vs. 7+ Residential days at 3 months
36%
52%
90%
0%
10%
20%
30%
40%
50%
60%
70%
80%
90%
100%
% of Clients WithMod/High Need
(n=349/980)*
% w Need but NoService After 3 months
(n=315/349)
% of Services Going toThose in Need (n=34/66)
Opportunity to redirect
existing funds through better
targeting
Source: 2008 CSAT AAFT Summary Analytic Dataset

93
Part 4. Summarize the status of efforts to make the data available for secondary analysis and translate the software, measures and reports from English into Spanish, French, Portuguese and other languages
94
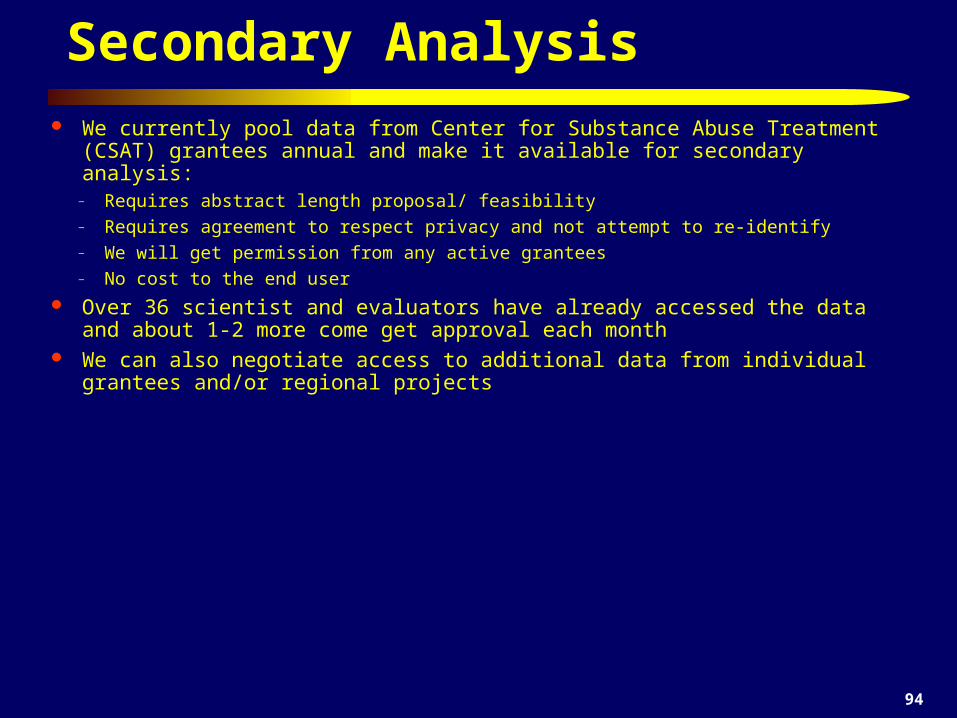
We currently pool data from Center for Substance Abuse Treatment (CSAT) grantees annual and make it available for secondary analysis:
– Requires abstract length proposal/ feasibility– Requires agreement to respect privacy and not attempt to re-identify– We will get permission from any active grantees– No cost to the end user
Over 36 scientist and evaluators have already accessed the data and about 1-2 more come get approval each month
We can also negotiate access to additional data from individual grantees and/or regional projects
Secondary Analysis

95
Status of Translations
LanguageShortScreener
Other Instruments Software Reports
English Done Done Done Done
Spanish Done Done In progress In progress
French In progress In progress In progress In progress
Portuguese Done Starting Not yet Not Yet
Japanese Done Not yet Not yet Not Yet
Hmong, Japanese, Russian, Pilipino, Punjabi, Vietnamese
Done Not yet Not yet Not Yet

96
Acknowledgments and Contact Information This presentation was supported by analytic runs provided by Chestnut Health Systems for the
Substance Abuse and Mental Health Services Administration's (SAMHSA's) Center for Substance Abuse Treatment (CSAT) under Contracts 207-98-7047, 277-00-6500, 270-2003-00006 and 270-2007-00004C using data provided by the following 152 grantees: TI11317 TI11321 TI11323 TI11324 TI11422 TI11423 TI11424 TI11432 TI11433 TI11871 TI11874 TI11888 TI11892 TI11894 TI13190TI13305 TI13308 TI13313 TI13322 TI13323 TI13344 TI13345 TI13354 TI13356 TI13601 TI14090 TI14188 TI14189 TI14196 TI14252 TI14261 TI14267 TI14271 TI14272 TI14283 TI14311 TI14315 TI14376 TI15413 TI15415 TI15421 TI15433 TI15438 TI15446 TI15447 TI15458 TI15461 TI15466 TI15467 TI15469 TI15475 TI15478 TI15479 TI15481 TI15483 TI15485 TI15486 TI15489 TI15511 TI15514 TI15524 TI15524 TI15527 TI15545 TI15562 TI15577 TI15584 TI15586 TI15670 TI15671 TI15672 TI15674 TI15677 TI15678 TI15682 TI15686 TI16386 TI16400 TI16414 TI16904 TI16928 TI16939 TI16961 TI16984 TI16992 TI17046 TI17070 TI17071 TI17334 TI17433 TI17434 TI17446 TI17475 TI17476 TI17484 TI17486 TI17490 TI17517 TI17523 TI17535 TI17547 TI17589 TI17604 TI17605 TI17638 TI17646 TI17648 TI17673 TI17702 TI17719 TI17724 TI17728 TI17742 TI17744 TI17751 TI17755 TI17761 TI17763 TI17765 TI17769 TI17775 TI17779 TI17786 TI17788 TI17812 TI17817 TI17825 TI17830 TI17831 TI17864 TI18406 TI18587 TI18671 TI18723 TI19313 TI19323 TI655374. Any opinions about this data are those of the authors and do not reflect official positions of the government or individual grantees. It is available at www.chestnut.org/li/posters. Comments or questions can be addressed to Michael Dennis, Chestnut Health Systems, 448 Wylie Drive, Normal, IL 61761. Phone 1-309-451-7801; E-mail: [email protected].
More information on the GAIN is available at www.chestnut.org/li/gain or by e-mailing [email protected] .