Embed Size (px)
Citation preview
Global Automotive
Presenter:
Industry----Frank GM----Raymond Toyota----Angela Volvo---Lillian
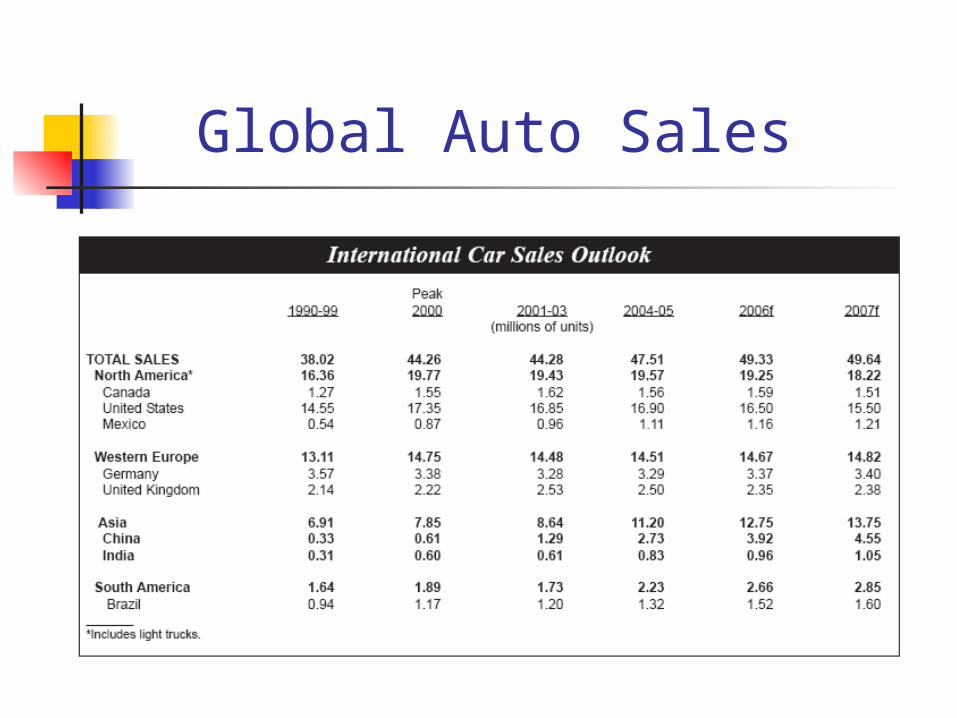
Global Auto Sales
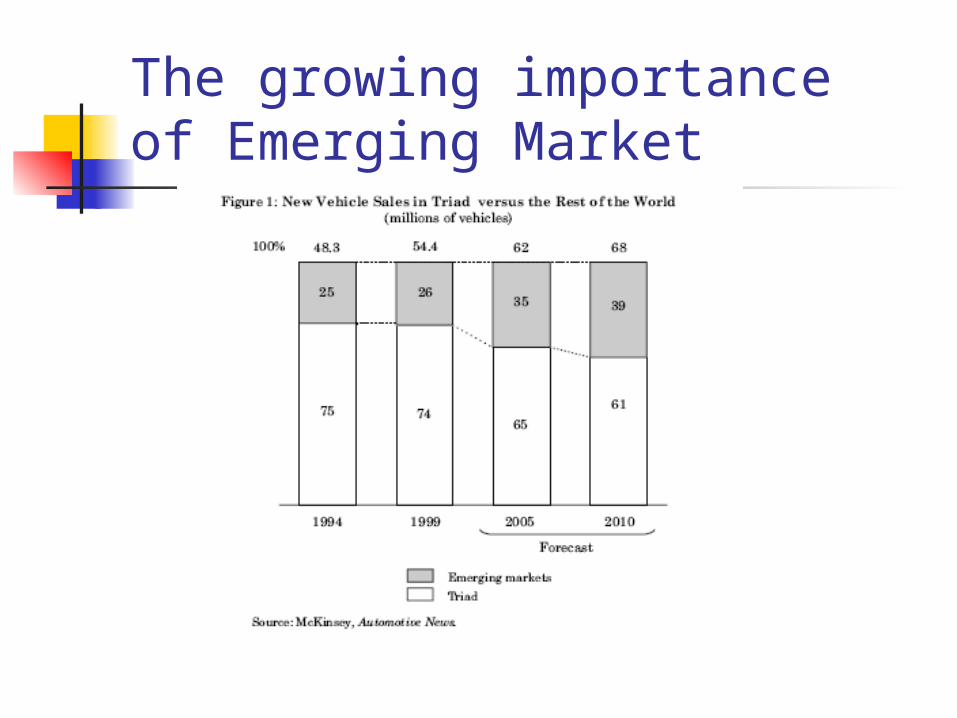
The growing importance of Emerging Market
Surprise! Surprise!
QUICK EXPANSION The production for the next 20 years will
be more than what’s been made for the entire 110 years of auto industry history
BRIC, especially China has been, and will be the major driving force of global Auto industry
Expected to replace Japan as the second largest market
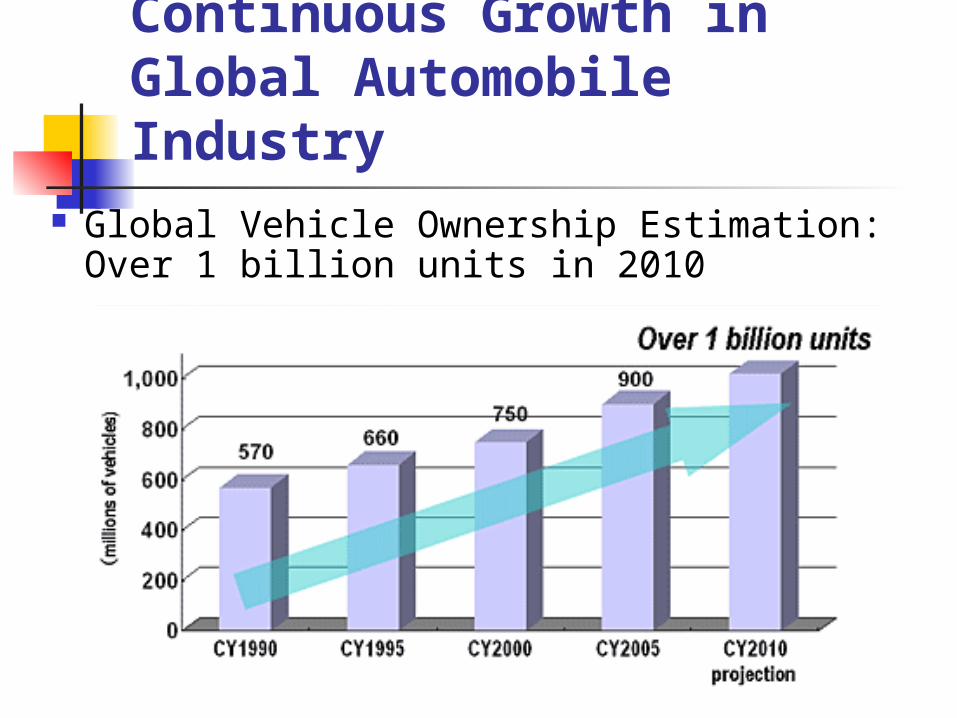
Continuous Growth in Global Automobile Industry
Global Vehicle Ownership Estimation: Over 1 billion units in 2010
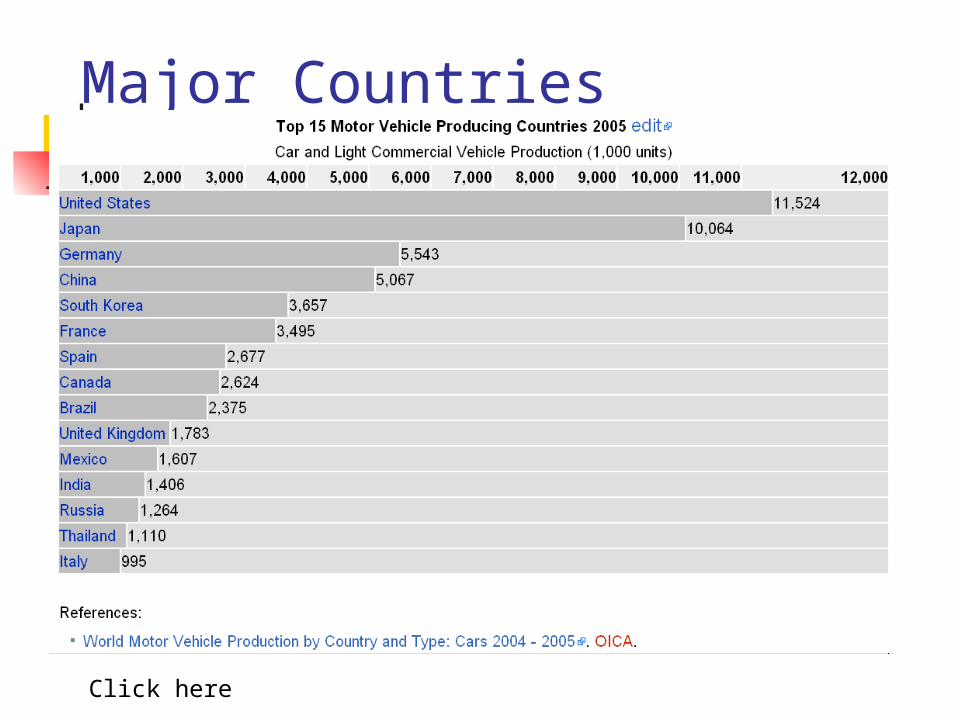
Major Countries
Click here
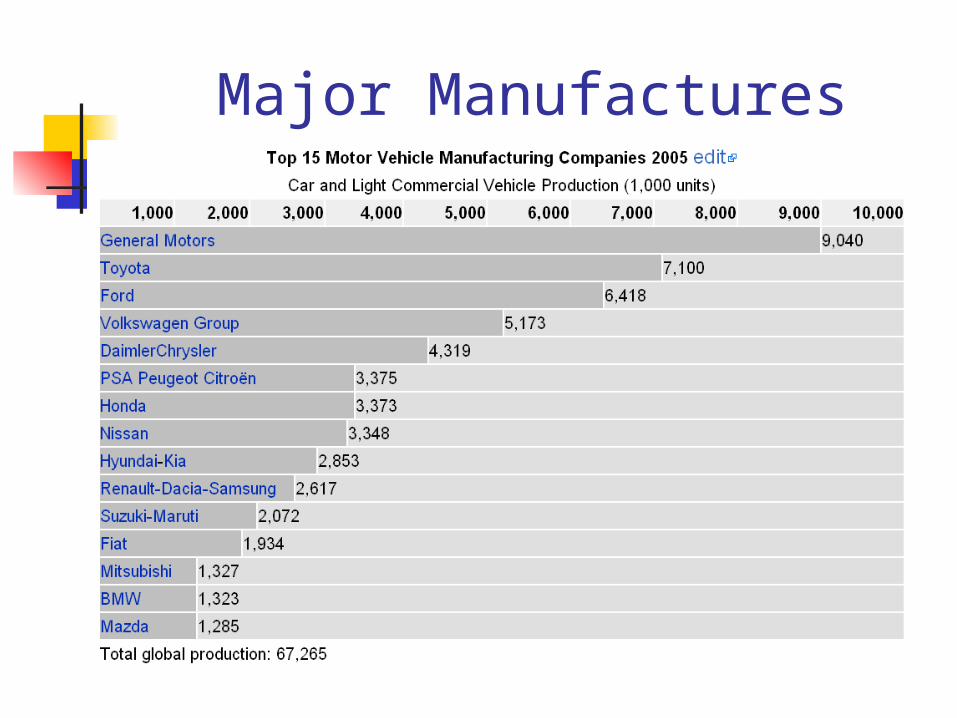
Major Manufactures
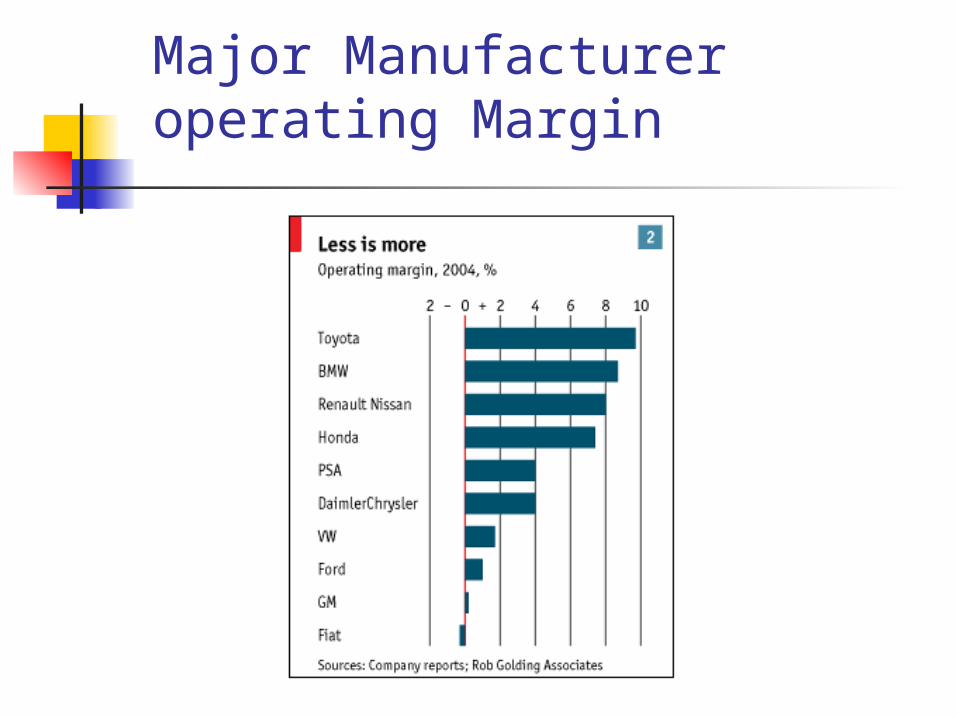
Major Manufacturer operating Margin
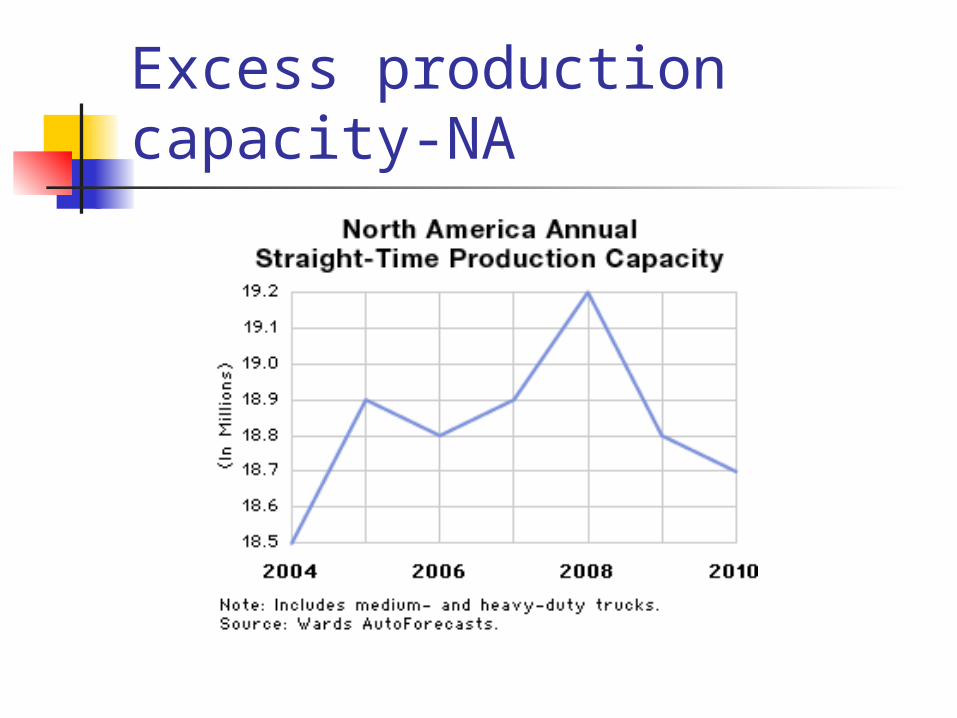
Excess production capacity-NA
Industry Characteristics---Major Cost
Labour & Pension plans**** N.A companies face a large amount of
pension cost----approx. $1500 per vehicle Jap companies have none pension cost
Material Hundreds of pieces purchased from
suppliers Automakers absorb only part of the increase
in material cost Advertising
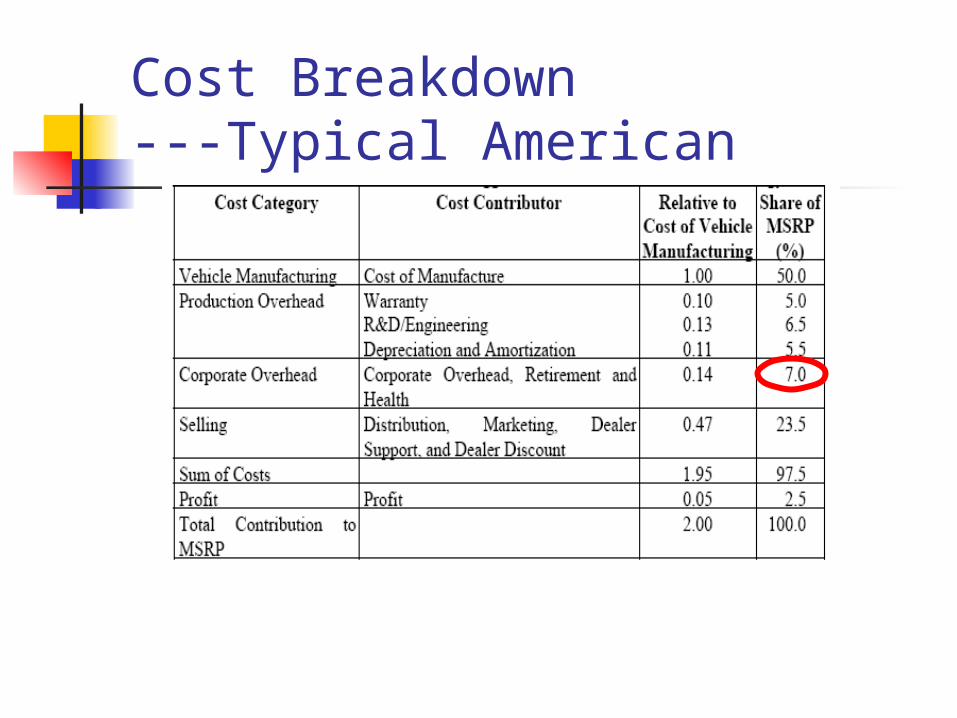
Cost Breakdown---Typical American
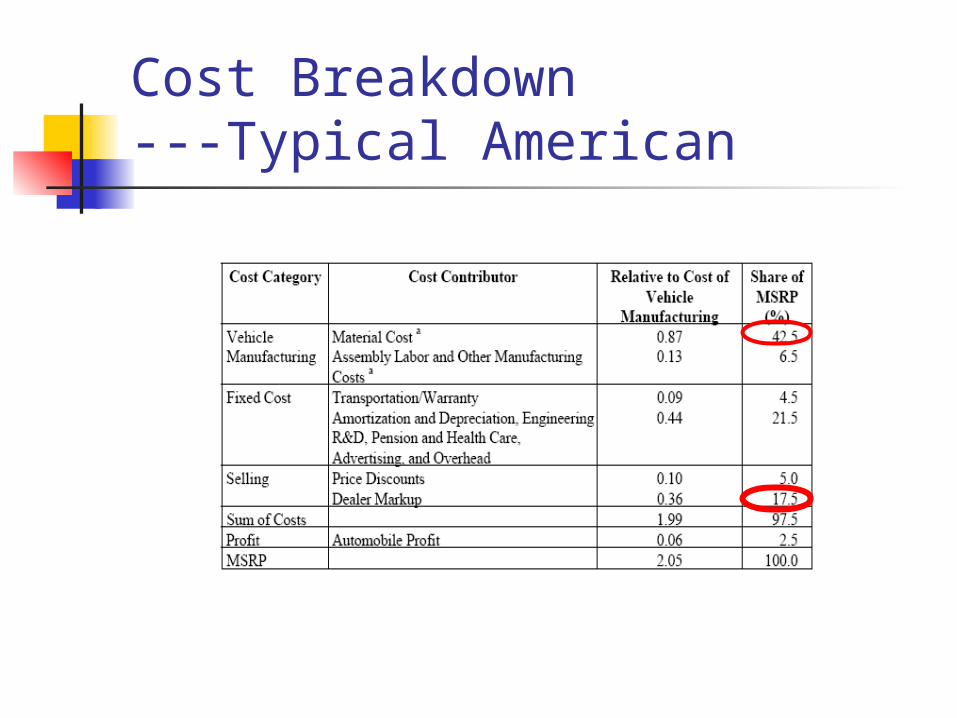
Cost Breakdown---Typical American
Highly sensitive to aggregate economic performance
U.S economy will slow down from 3.2% GDP growth to about 2%
The effect of democratic victory in congress??
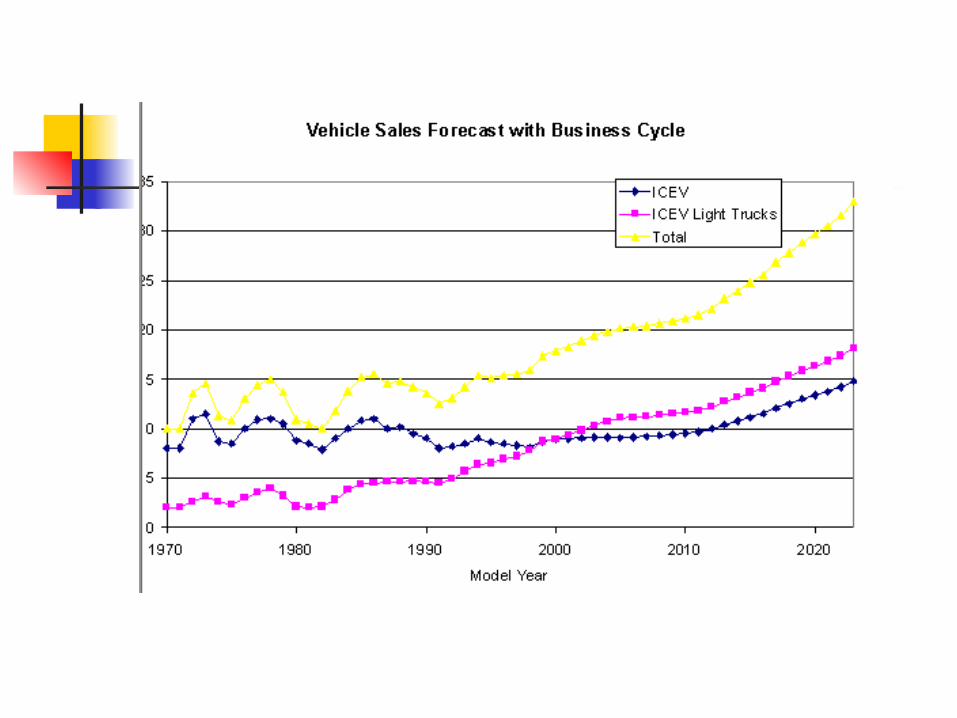
Industry Characteristics---Sales cycle
Industry characteristics---M/A, Alliance
Technology, R/D
Market penetration
Global cooperation
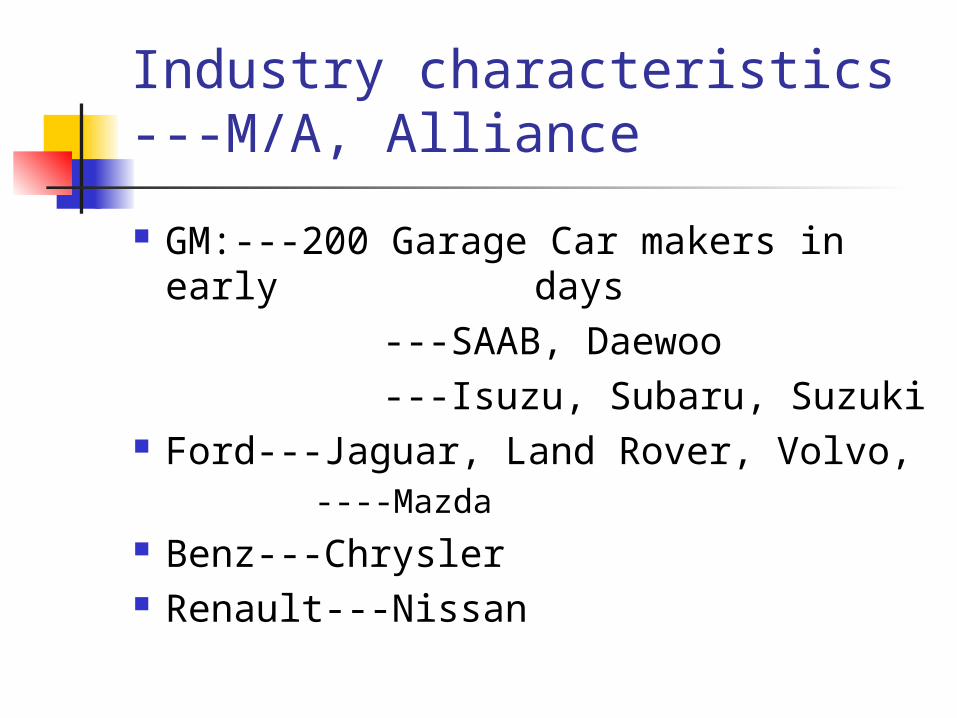
GM:---200 Garage Car makers in early days
---SAAB, Daewoo ---Isuzu, Subaru, Suzuki Ford---Jaguar, Land Rover, Volvo,
----Mazda Benz---Chrysler Renault---Nissan
Industry characteristics---M/A, Alliance
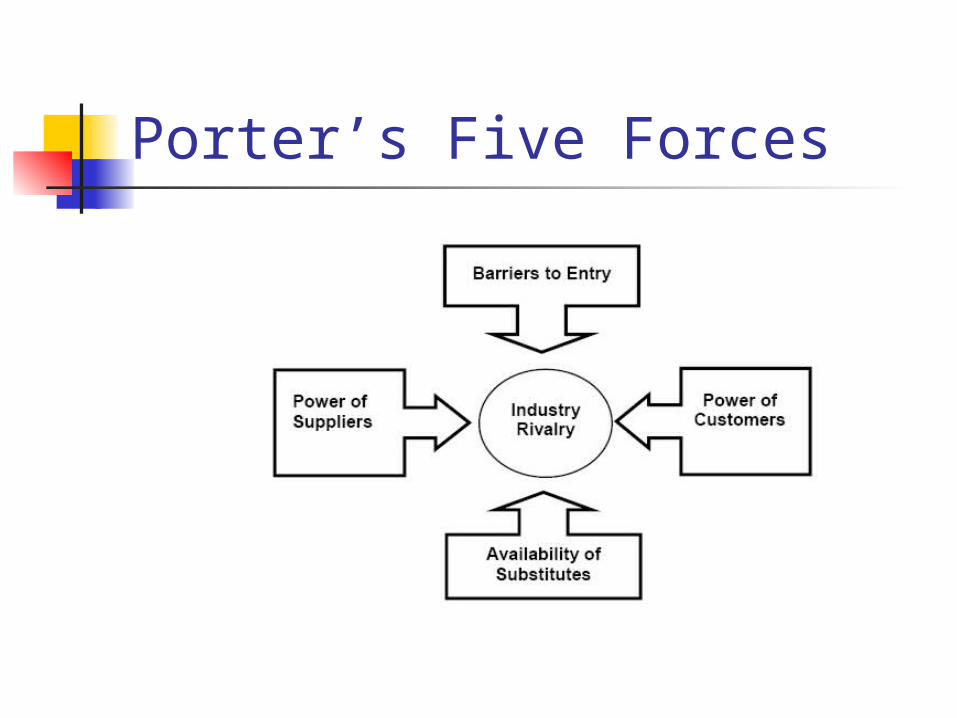
Porter’s Five Forces
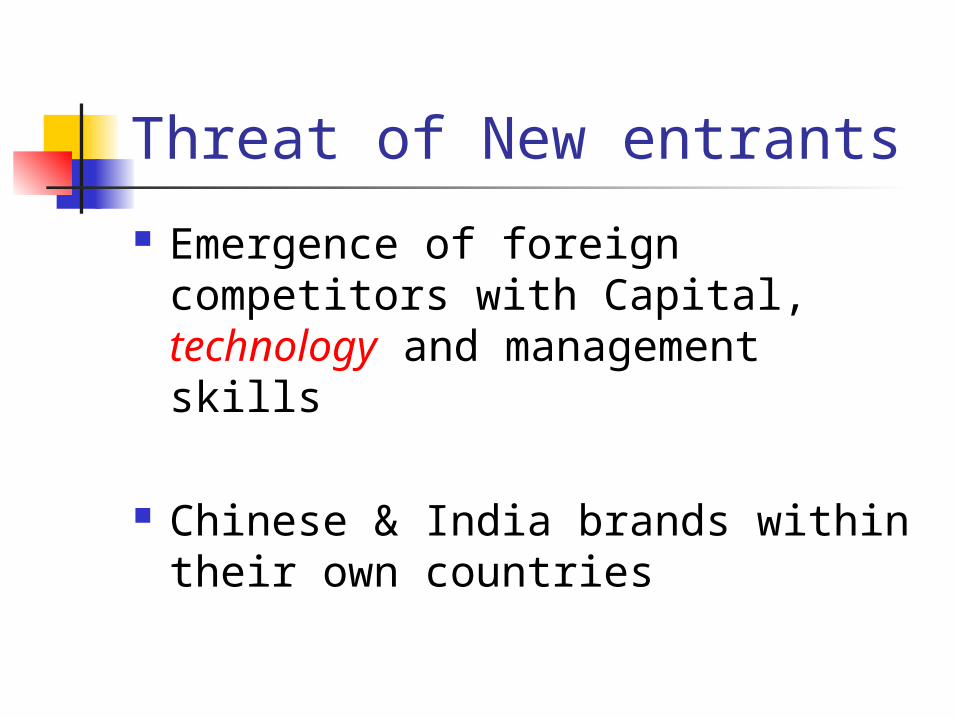
Threat of New entrants
Emergence of foreign competitors with Capital, technology and management skills
Chinese & India brands within their own countries
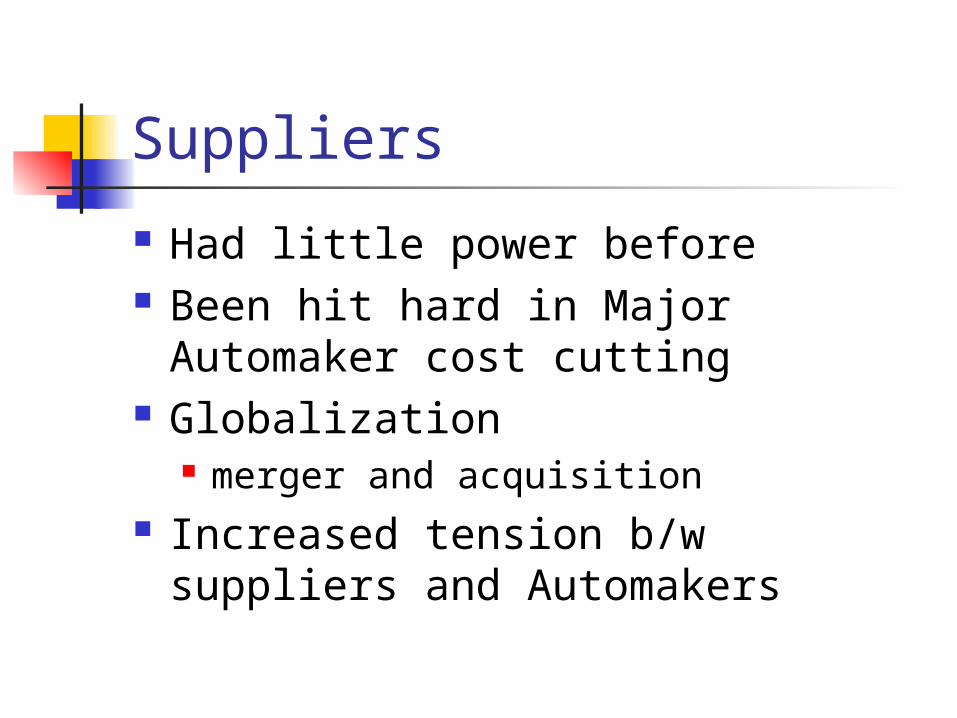
Suppliers
Had little power before Been hit hard in Major Automaker
cost cutting Globalization
merger and acquisition Increased tension b/w suppliers
and Automakers
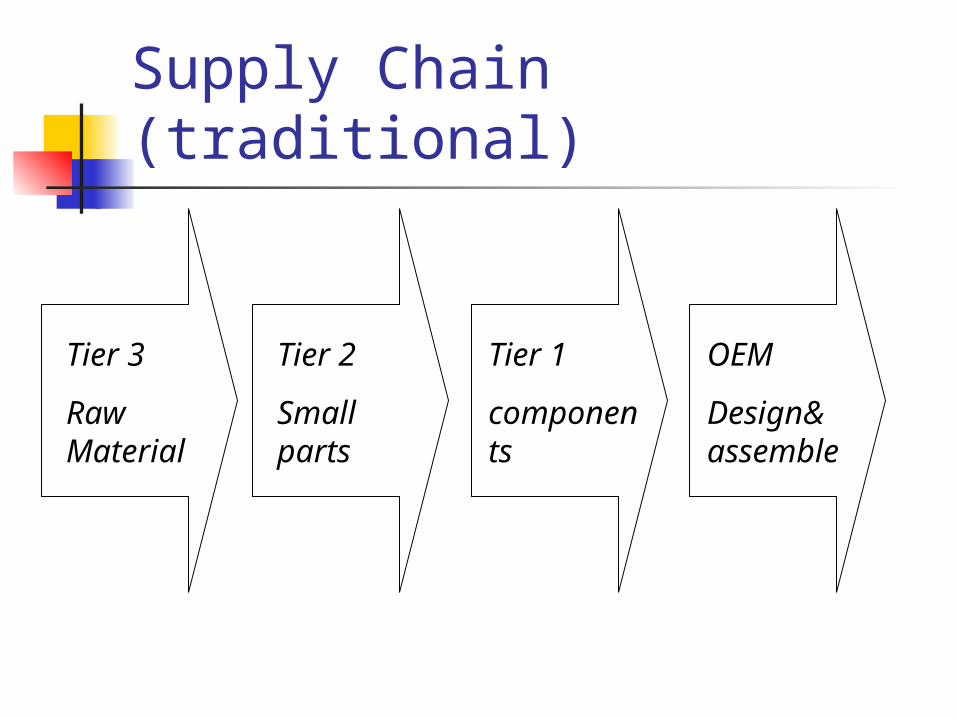
Supply Chain (traditional)
Tier 3
Raw Material
Tier 2
Small parts
Tier 1
components
OEM
Design& assemble
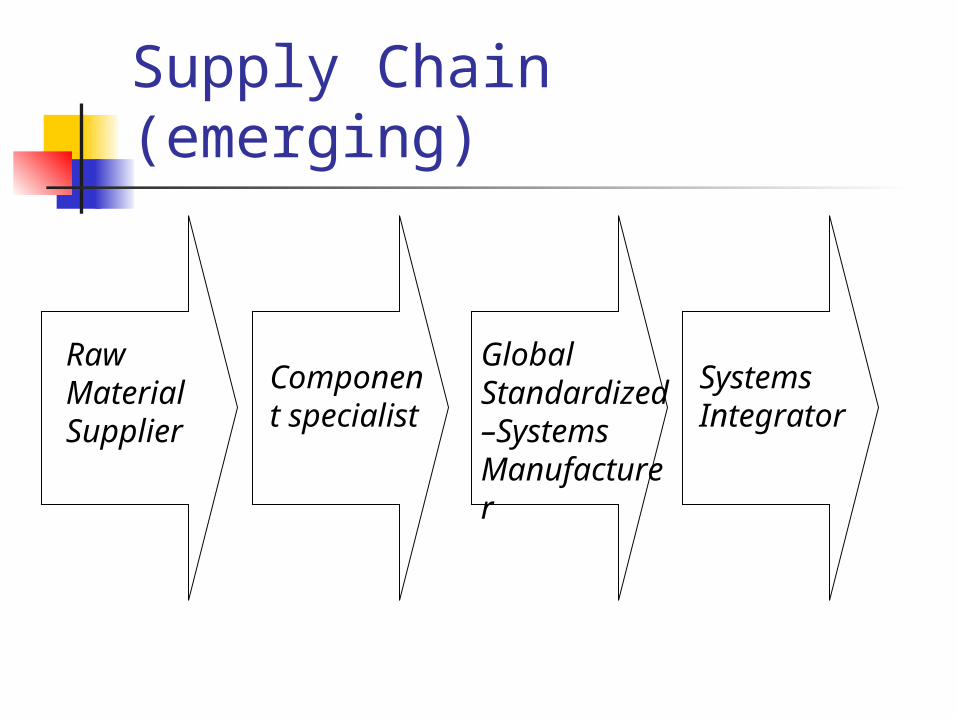
Supply Chain (emerging)
Raw Material Supplier
Component specialist
Global Standardized–Systems Manufacturer
Systems Integrator
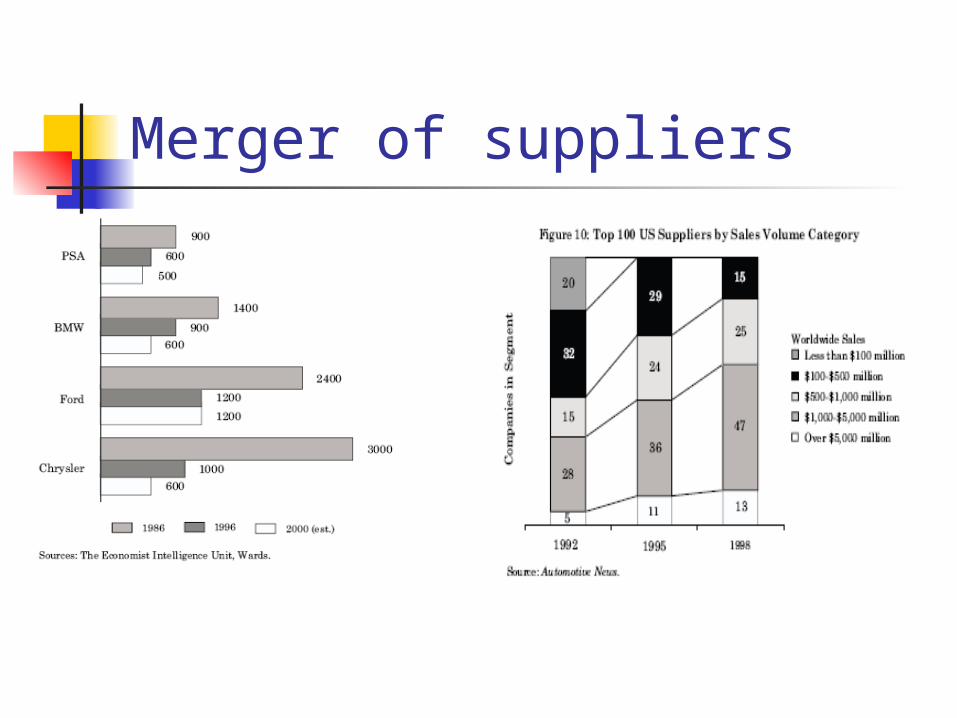
Merger of suppliers
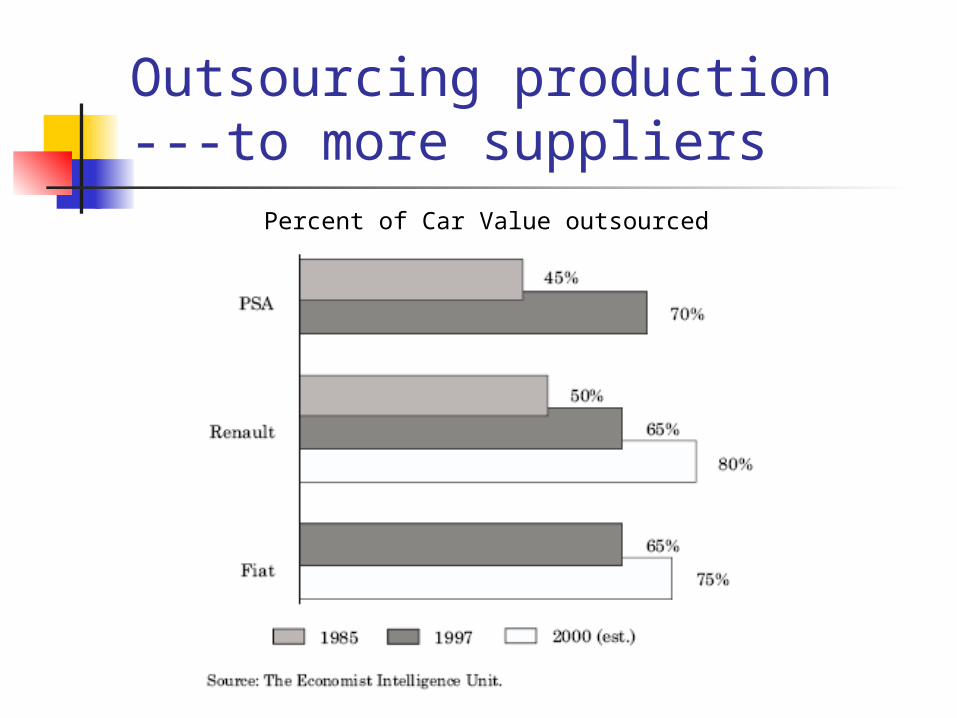
Outsourcing production---to more suppliers
Percent of Car Value outsourced
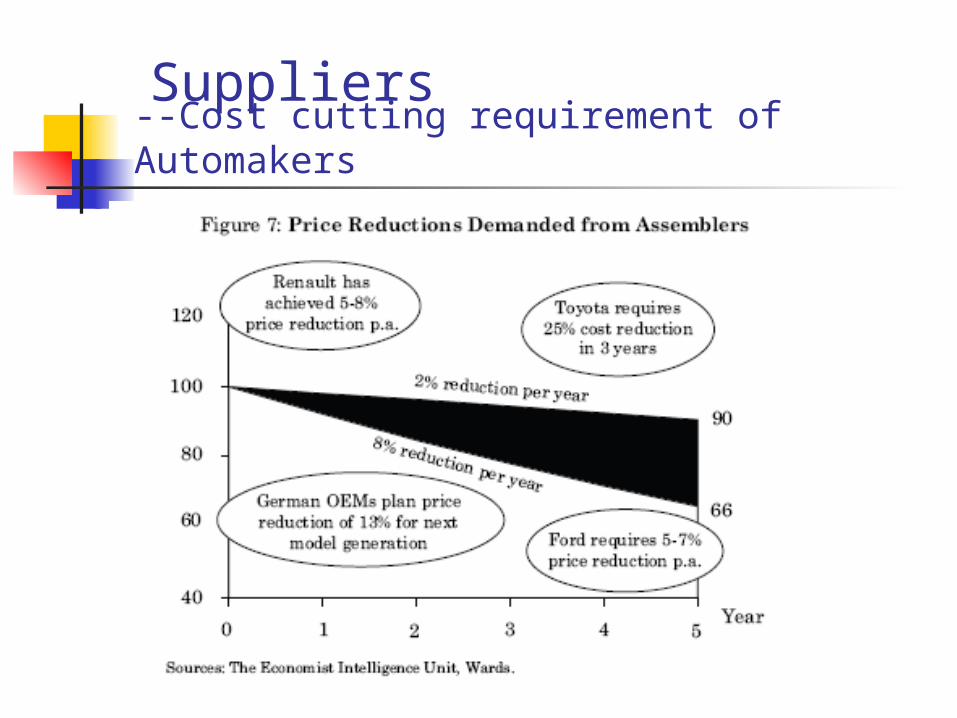
--Cost cutting requirement of Automakers
Suppliers
Suppler (cont)
A major suppler Collins & Aikman halted delivery to Ford on Oct 19th
Caused temporary shut down of one of the biggest assembly line of Ford
Foreseeable---
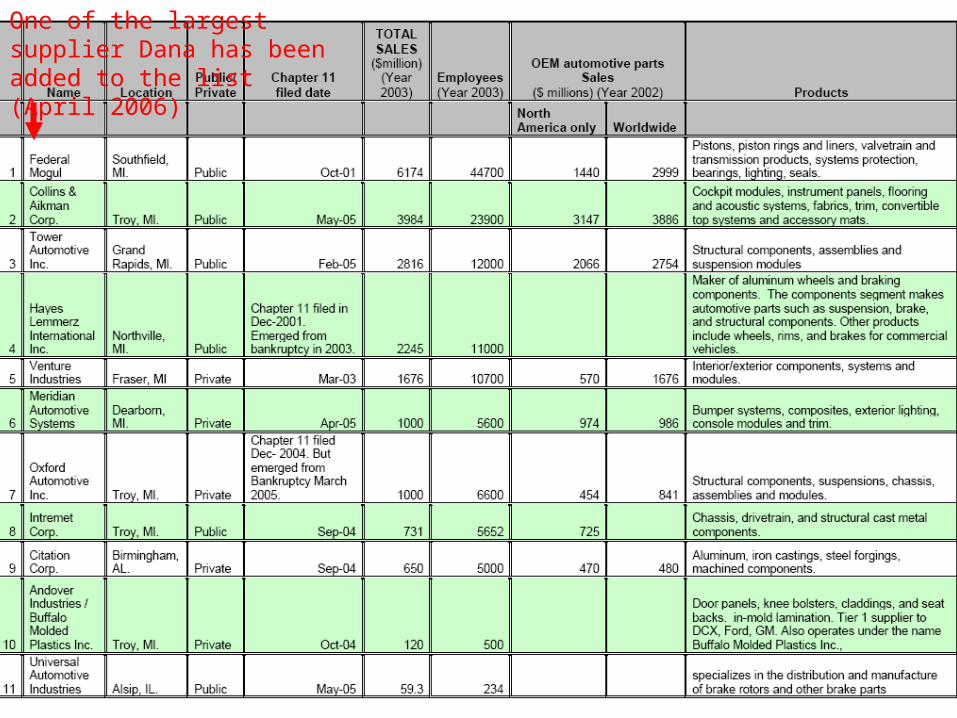
One of the largest supplier Dana has been added to the list (April 2006)
Substitutes
Public transportation on the rise
Rivalry
Fierce competition High competition cost Low return
Historically avoid price competition
More and More price competition
Buyers
Historically, the automaker power went unchallenged
As the market saturate, more options made available, buyers have significant amount of power
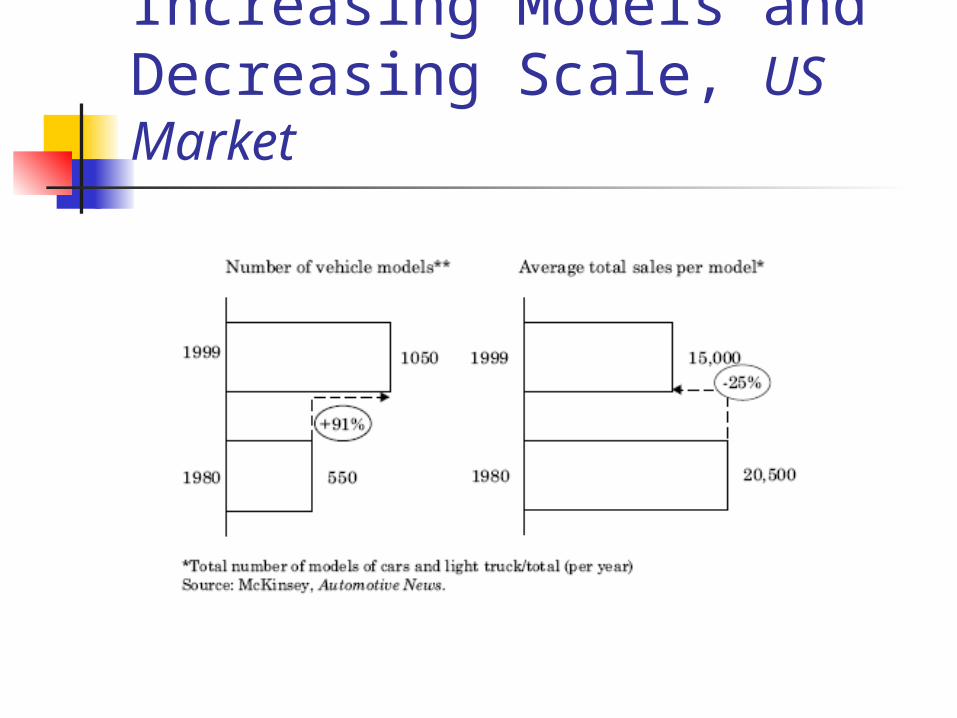
Increasing Models and Decreasing Scale, US Market
Regulation
Regulations Emission standard*** Safety standard
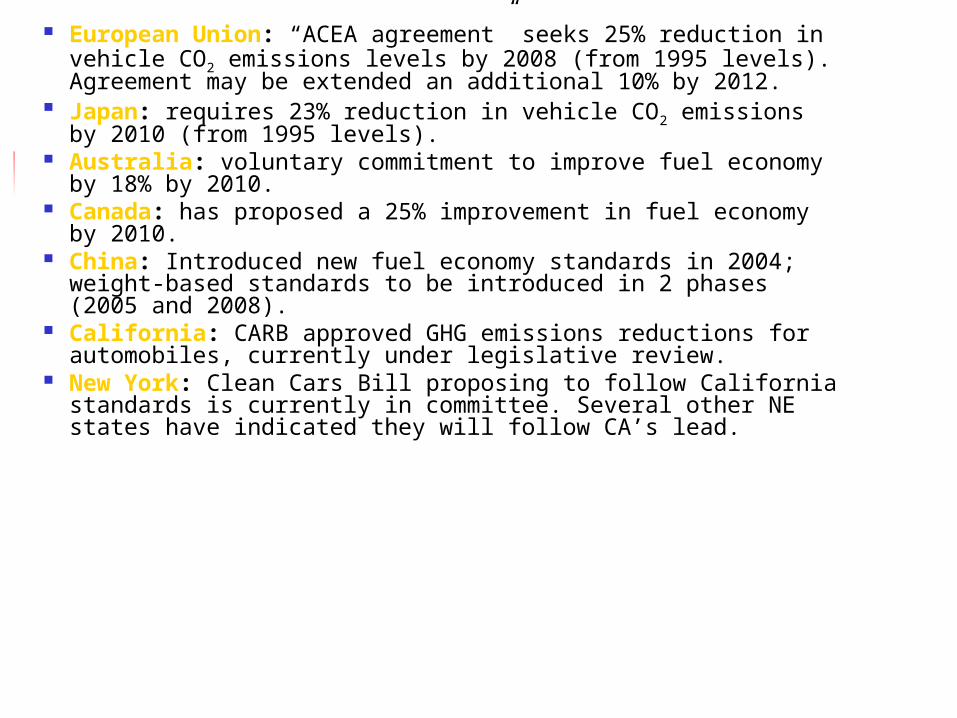
European Union: “ACEA agreement” seeks 25% reduction in vehicle CO2 emissions levels by 2008 (from 1995 levels). Agreement may be extended an additional 10% by 2012.
Japan: requires 23% reduction in vehicle CO2 emissions by 2010 (from 1995 levels).
Australia: voluntary commitment to improve fuel economy by 18% by 2010.
Canada: has proposed a 25% improvement in fuel economy by 2010.
China: Introduced new fuel economy standards in 2004; weight-based standards to be introduced in 2 phases (2005 and 2008).
California: CARB approved GHG emissions reductions for automobiles, currently under legislative review.
New York: Clean Cars Bill proposing to follow California standards is currently in committee. Several other NE states have indicated they will follow CA’s lead.
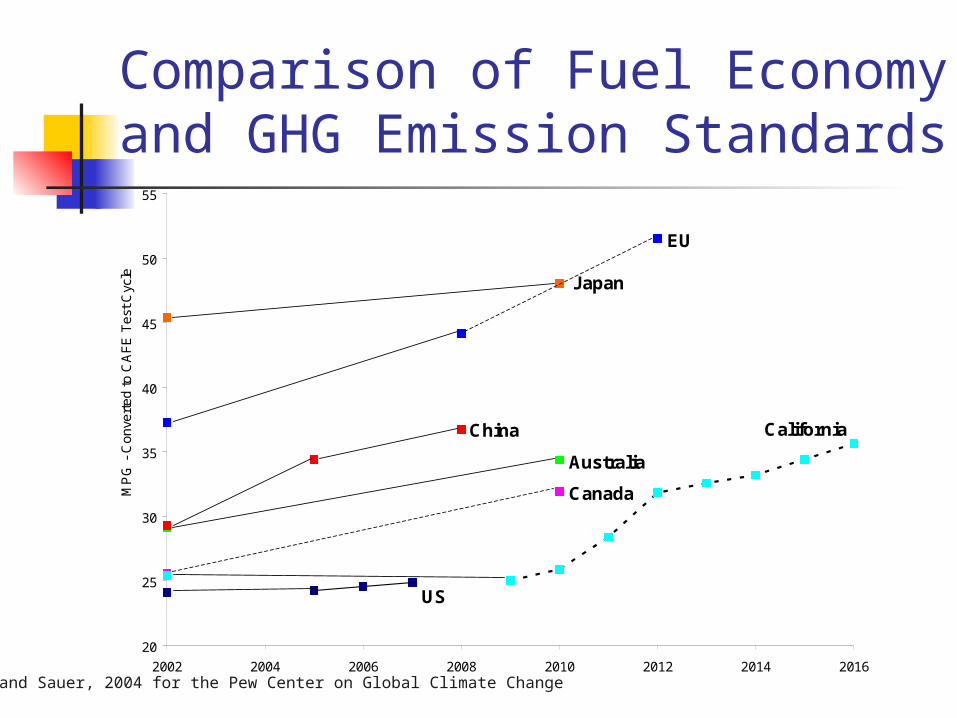
Comparison of Fuel Economy and GHG Emission Standards
EU
Canada
US
Japan
Australia
China California
20
25
30
35
40
45
50
55
2002 2004 2006 2008 2010 2012 2014 2016
MP
G -
Co
nve
rte
d t
o C
AF
E T
est
Cyc
le
An and Sauer, 2004 for the Pew Center on Global Climate Change
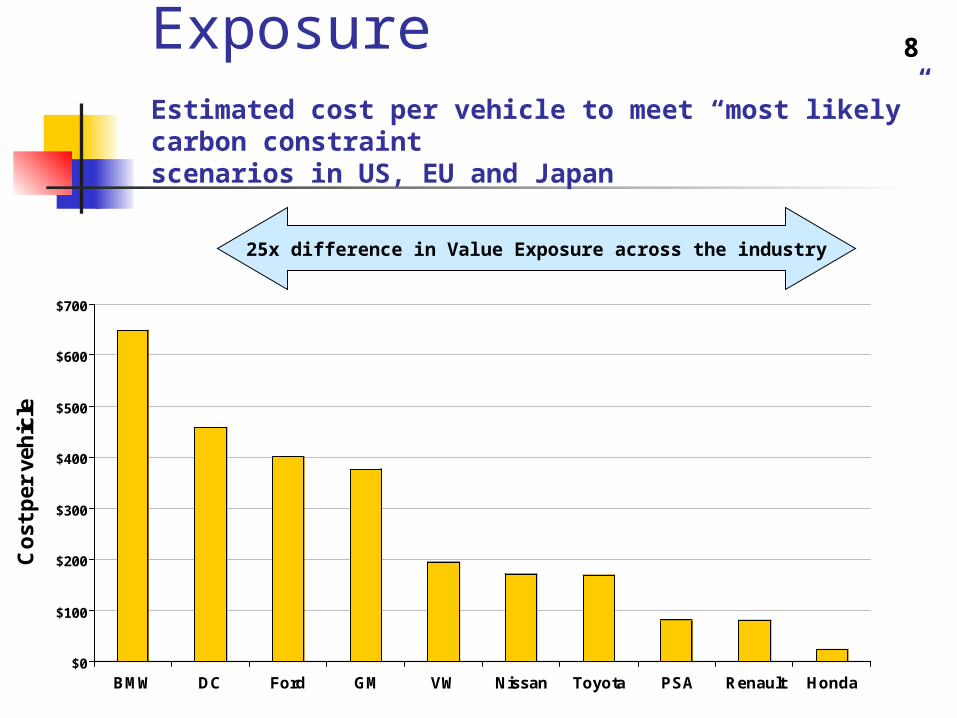
Aggregate Value ExposureEstimated cost per vehicle to meet “most likely” carbon constraint scenarios in US, EU and Japan
$0
$100
$200
$300
$400
$500
$600
$700
Co
st p
er v
ehic
le
BMW DC Ford GM VW Nissan Toyota PSA Renault Honda
25x difference in Value Exposure across the industry
8
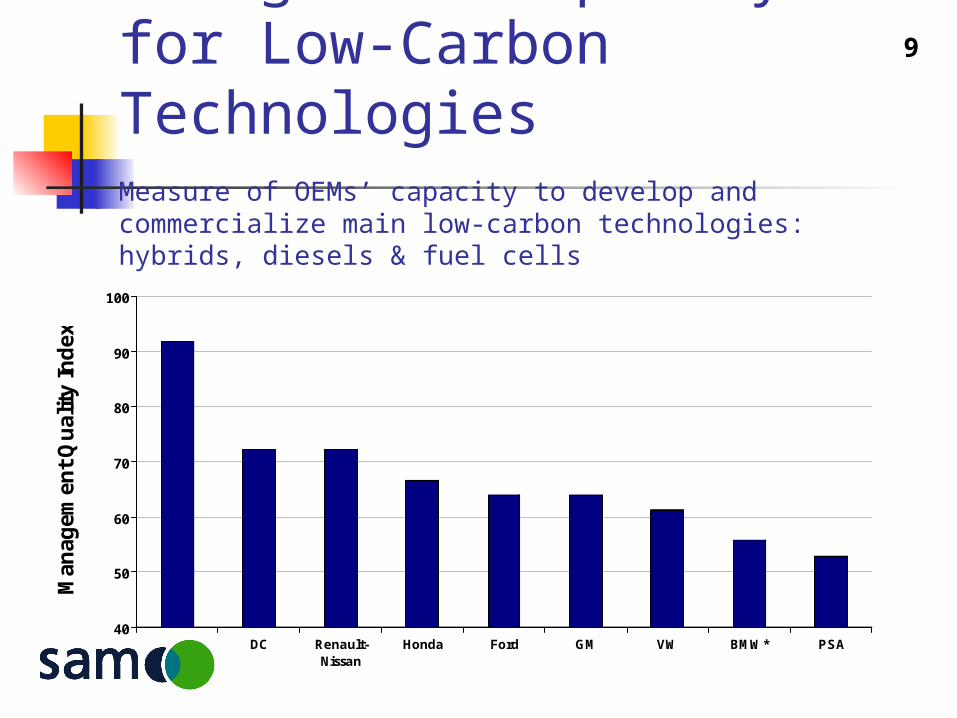
Management Capacity for Low-Carbon Technologies Measure of OEMs’ capacity to develop and commercialize main low-carbon technologies: hybrids, diesels & fuel cells
40
50
60
70
80
90
100
Man
agem
ent
Qu
alit
y In
dex
Toyota DC Renault-Nissan
Honda Ford GM VW BMW* PSA
9
In addition Political issues
Trade barrier tariff
Energy crisis OPEC Political & Natural reasons
Technology development Hybrid, Fuel cells, Hydrogen, Electronic, ethanol.
Etc System feature & design
Key success factors
Pension fund management How well the company digest what’s
been eaten Supplier relationship management Risk management (i.e. exchange
exposure risk, commodity price risk) design, marketing of new models New technology development
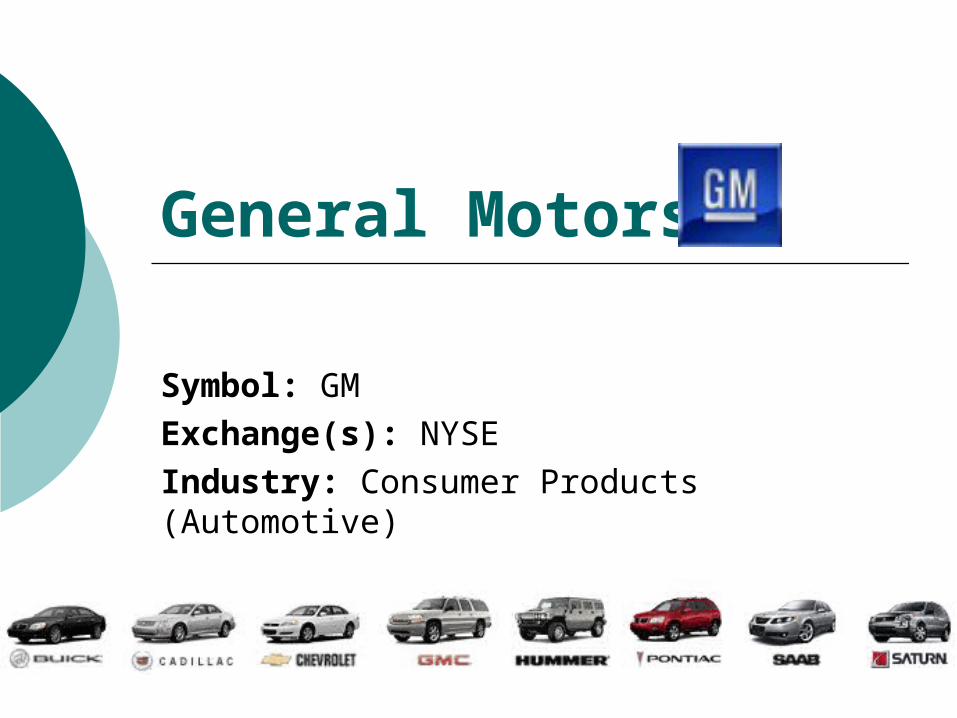
General Motors
Symbol: GMExchange(s): NYSE Industry: Consumer Products (Automotive)
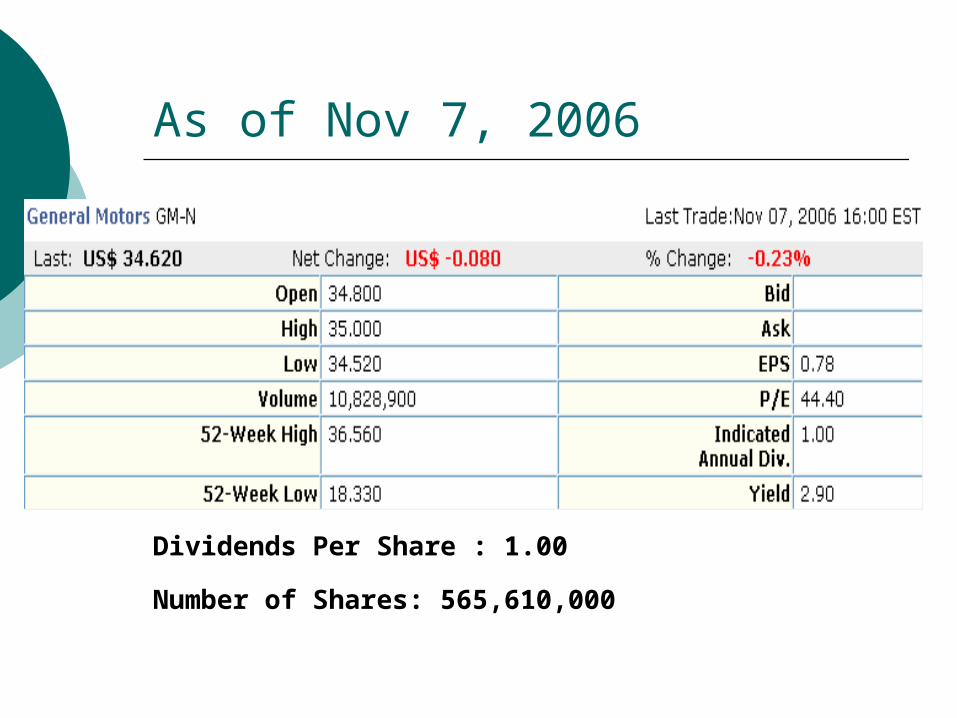
As of Nov 7, 2006
Dividends Per Share : 1.00
Number of Shares: 565,610,000
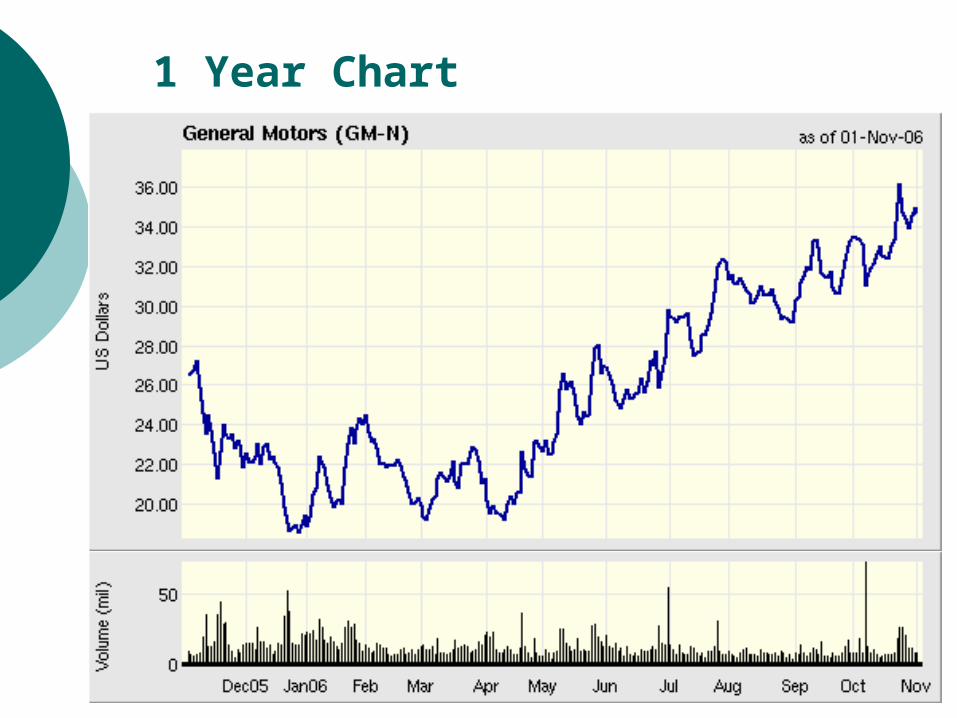
1 Year Chart
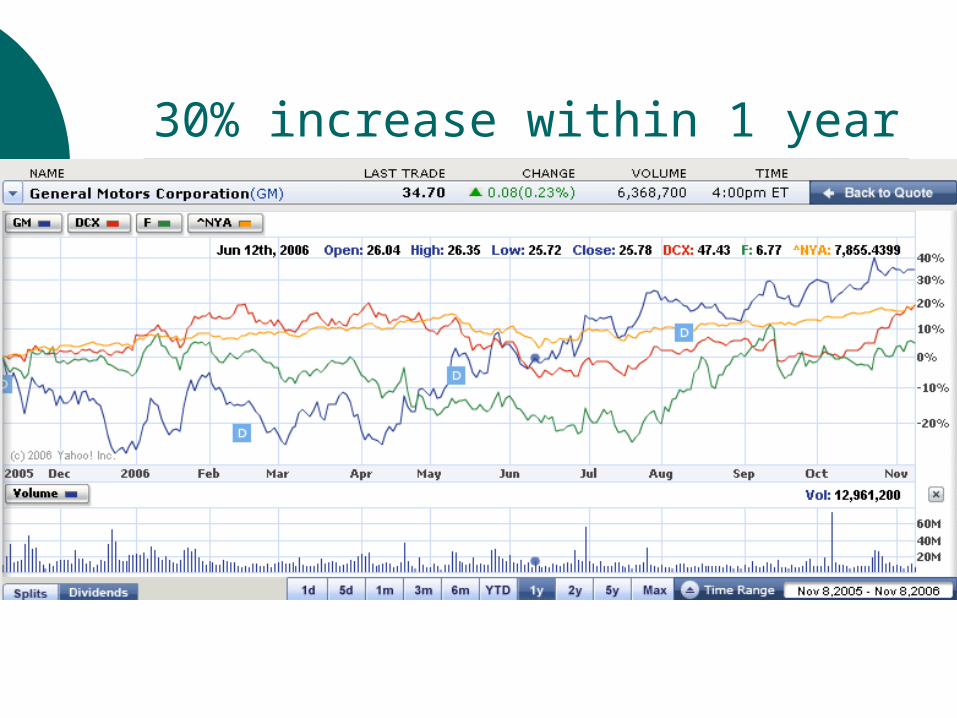
30% increase within 1 year
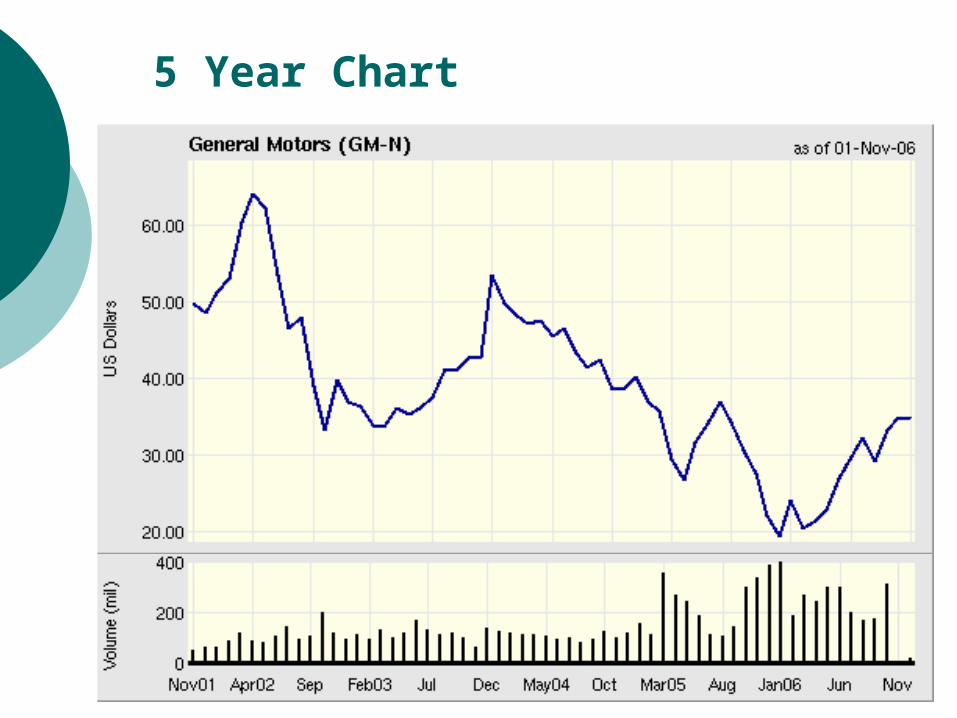
5 Year Chart
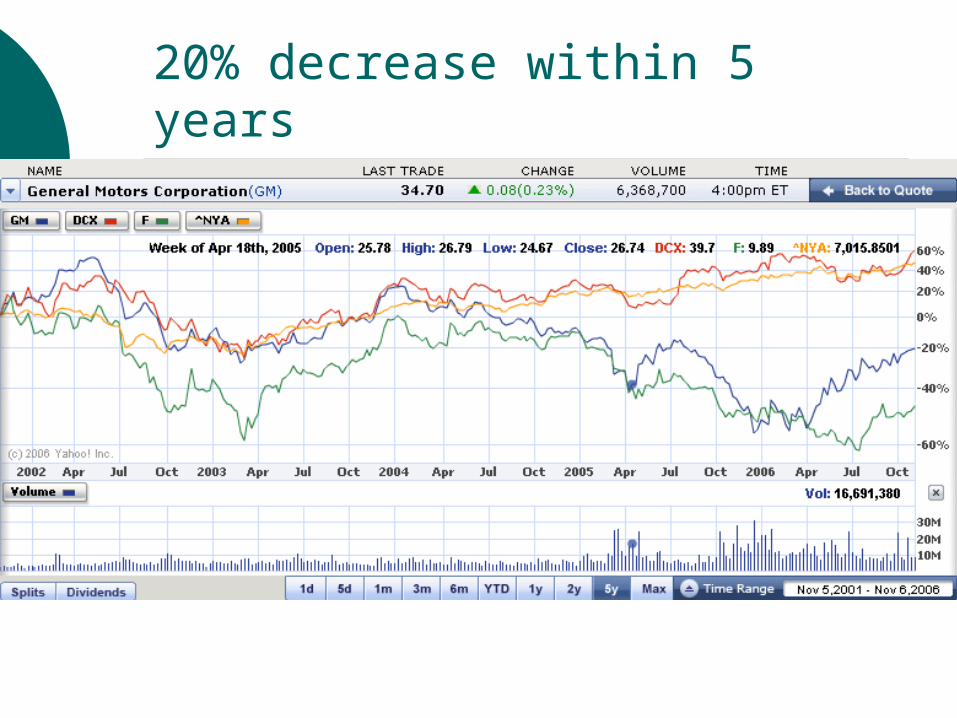
20% decrease within 5 years
Company Profile The world's largest automaker has been the global industry sales leader
for 75 years employs about 327,000 people around the
world manufactures its cars and trucks in 33
countries Engaged in automotive production and
marketing and financing and insurance operations
largest operating presence in North America
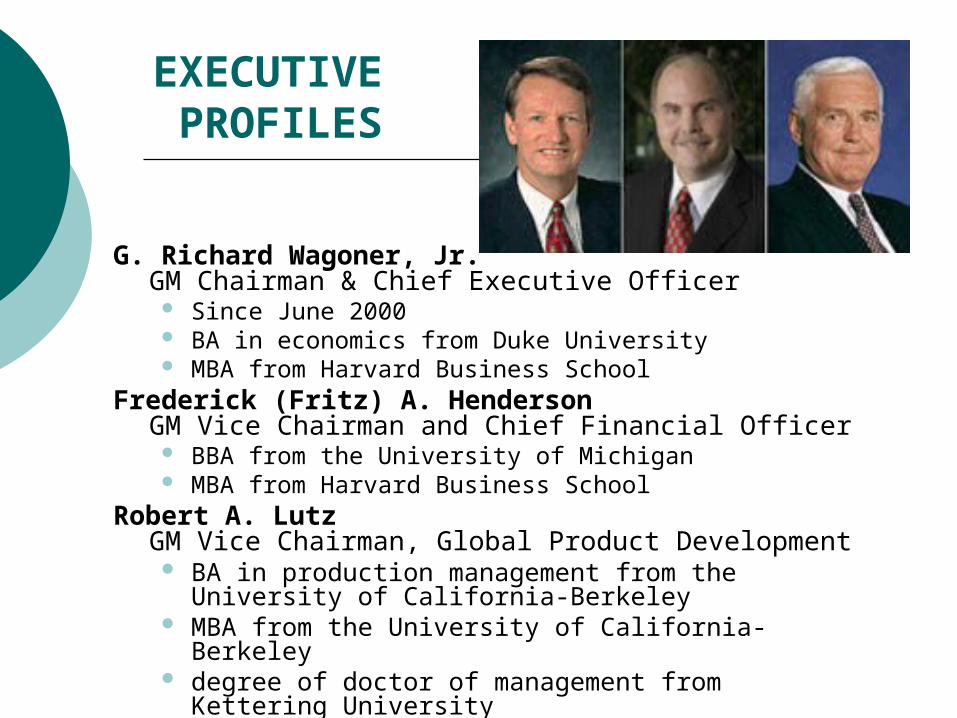
EXECUTIVE PROFILES
G. Richard Wagoner, Jr.GM Chairman & Chief Executive Officer Since June 2000 BA in economics from Duke University MBA from Harvard Business School
Frederick (Fritz) A. HendersonGM Vice Chairman and Chief Financial Officer BBA from the University of Michigan MBA from Harvard Business School
Robert A. LutzGM Vice Chairman, Global Product Development BA in production management from the University
of California-Berkeley MBA from the University of California-Berkeley degree of doctor of management from Kettering
University
Brands Buick Cadillac Chevrolet Fleet & Commercial
Operations Holden Vauxhall
GMC GM Daewoo HUMMER Pontiac Saturn Saab Opel
GMAC Financial Services
A finance company offers automotive, residential and
commercial financing and insurance
GM's OnStar subsidiary
a provider of vehicle safety, security and information services
use (GPS) satellite and cellular technology to link the vehicle and driver to the OnStar Center
advisors offer real-time, personalized help 24 hours a day, 365 days a year
Global Partnerships
majority shareholder in GM Daewoo Auto & Technology Co. of South Korea
Product, powertrain and purchasing collaborations with Suzuki Motor Corp. and Isuzu Motors Ltd. of Japan
Advanced technology collaborations with DaimlerChrysler AG BMW AG of Germany Toyota Motor Corp. of Japan
Vehicle manufacturing ventures with Toyota Suzuki Shanghai Automotive Industry Corp. of China AVTOVAZ of Russia Renault SA of France
Market
GM's largest national market is the United States, followed by China, Canada, the United Kingdom and Germany
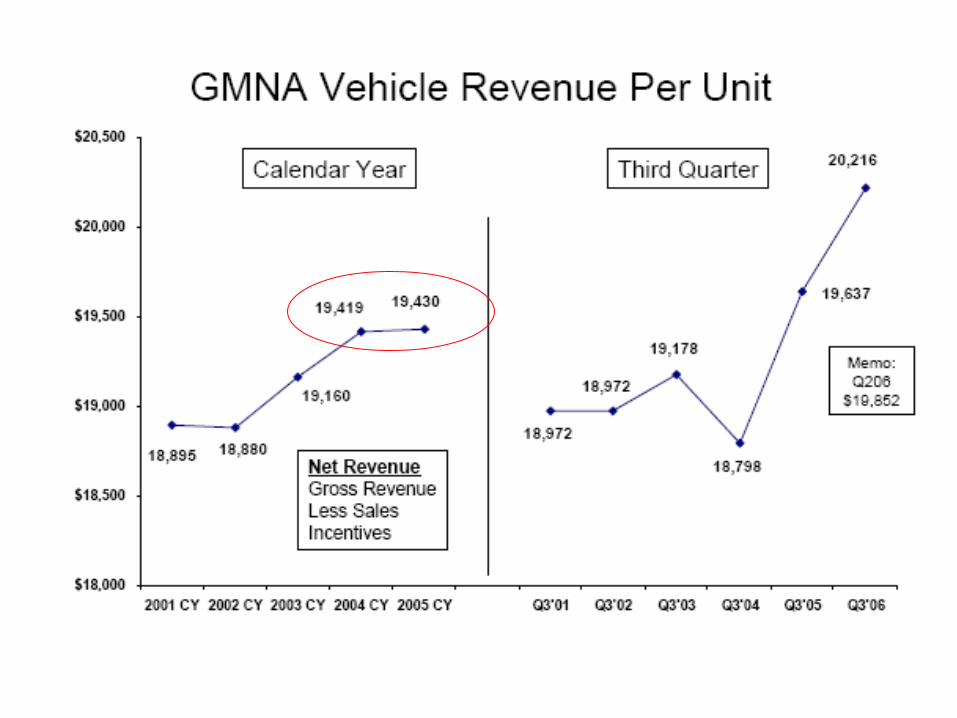
GM in 2005
One of the most difficult yearsReported loss of $10.6 B
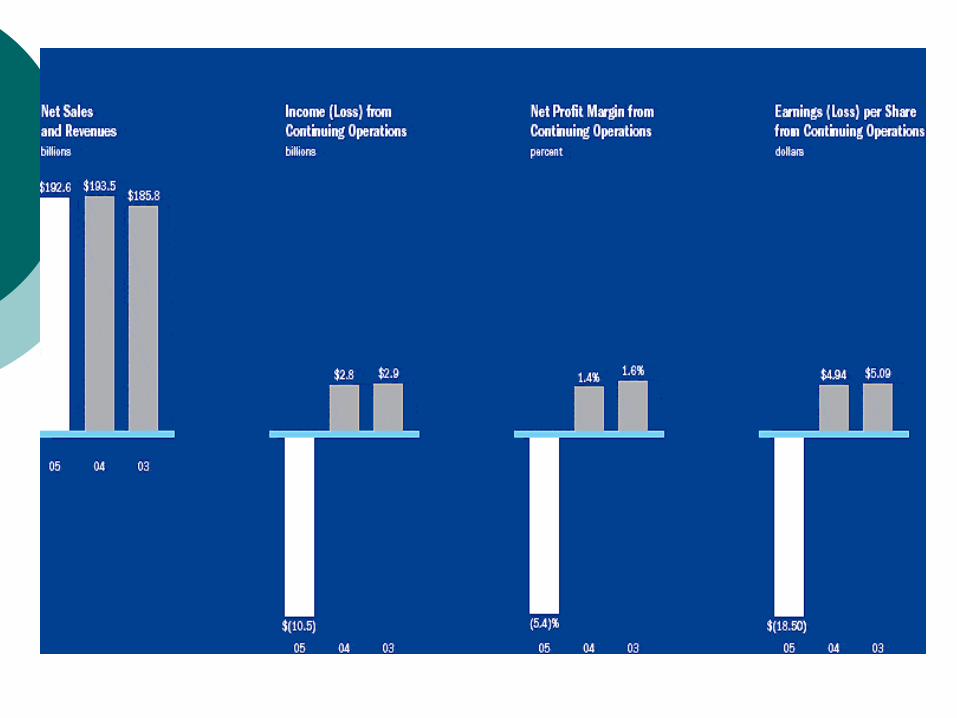
The size of GM’s 2005 loss, most of which related to its North American operations
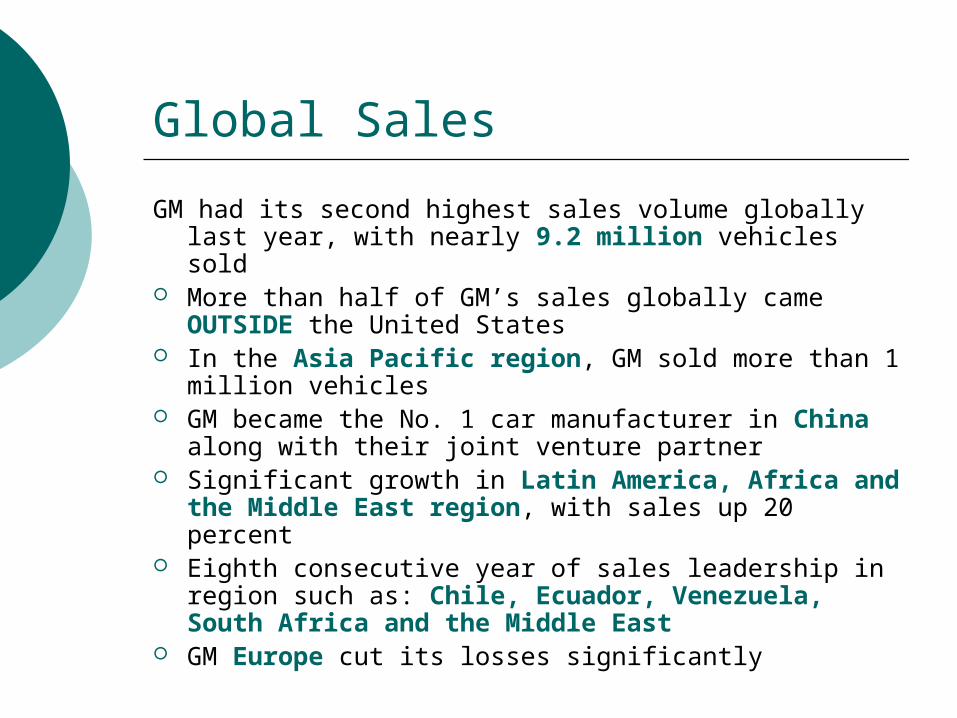
Global Sales
GM had its second highest sales volume globally last year, with nearly 9.2 million vehicles sold
More than half of GM’s sales globally came OUTSIDE the United States
In the Asia Pacific region, GM sold more than 1 million vehicles
GM became the No. 1 car manufacturer in China along with their joint venture partner
Significant growth in Latin America, Africa and the Middle East region, with sales up 20 percent
Eighth consecutive year of sales leadership in region such as: Chile, Ecuador, Venezuela, South Africa and the Middle East
GM Europe cut its losses significantly
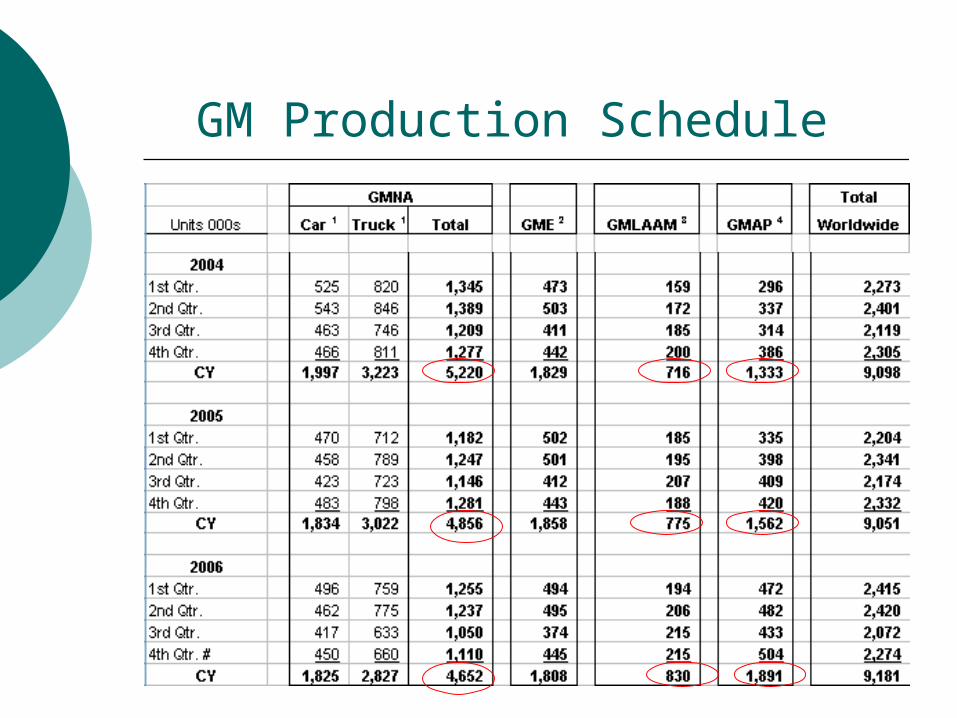
GM Production Schedule
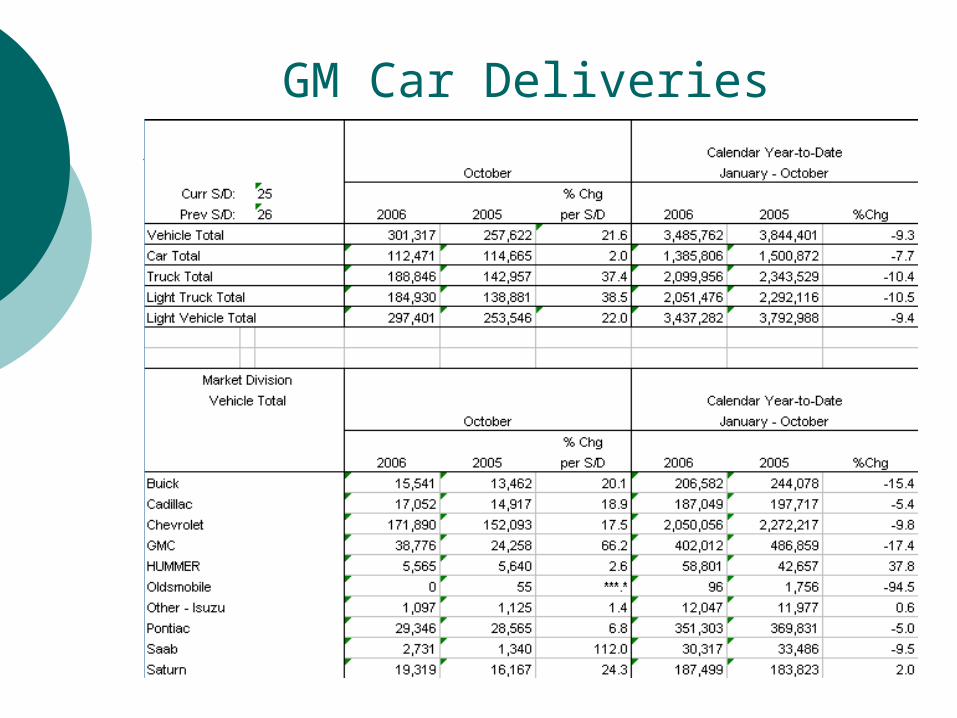
GM Car Deliveries
Challenges and Weakness
Due to:1. huge legacy cost burden 2. inability to adjust structural costs in line with
falling revenue3. global overcapacity 4. falling prices5. rising health-care costs 6. higher fuel prices
a) reducing demand for some of the highest-profit product
7. global competition8. international exchange rates tend to help
Japanese and Korean imports
Rising retiree health care costs and Other Post Employment Benefit (OPEB) fund deficit prompted the company to enact a broad restructuring plan
For every active GM employee in the United States last year, GM supported 3.2 retirees and surviving spouses
GM’s health-care bill in 2005 = 5.3B
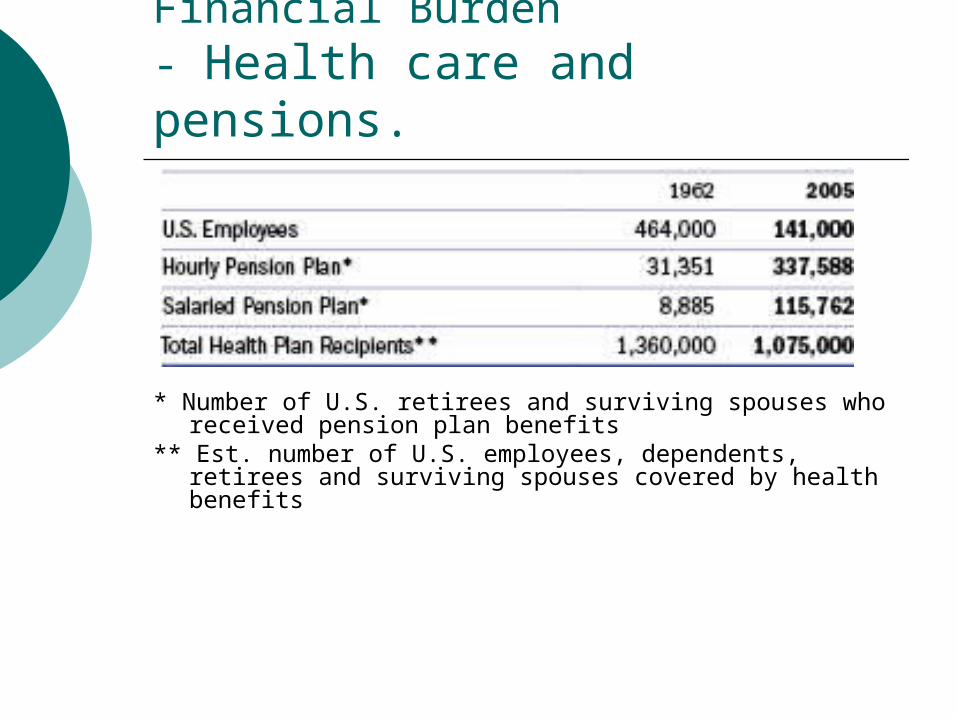
Financial Burden - Health care and pensions.
* Number of U.S. retirees and surviving spouses who received pension plan benefits
** Est. number of U.S. employees, dependents, retirees and surviving spouses covered by health benefits
Delphi Chapter 11 proceedings
Delphi is an automotive parts company spun-off from GM
GM recorded a charge of $5.5 billion ($3.6 billion after tax) as an estimate of contingent exposures relating to the Chapter 11 filing of Delphi Corporation
GM receiving only a portion of amounts owed by Delphi to GM
obligations in excess of amounts recognized by GM in 2005 in connection with benefit guarantees
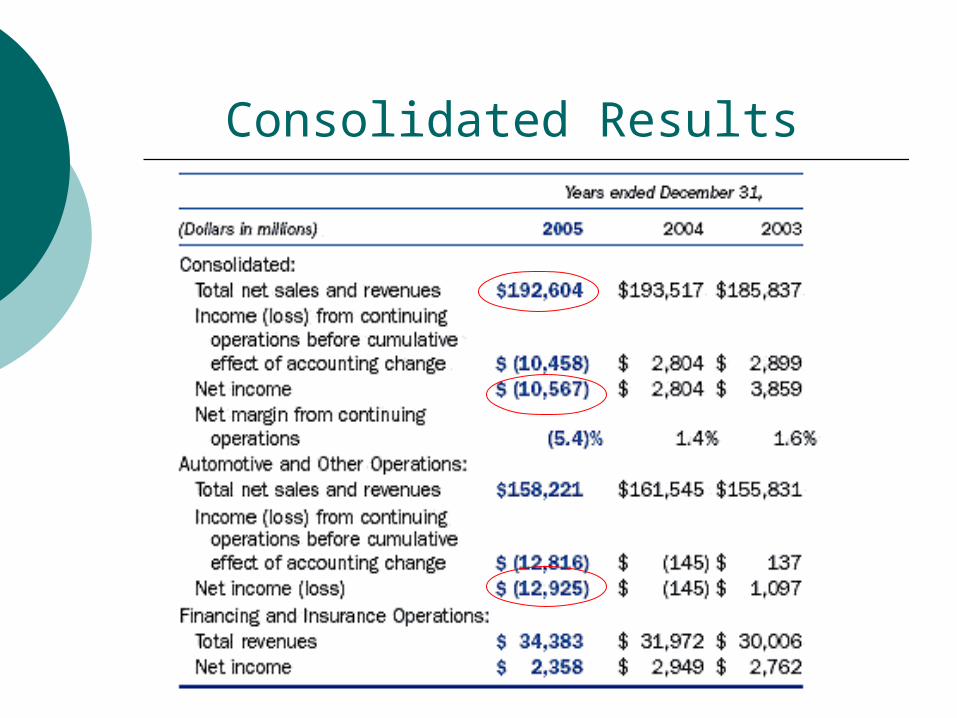
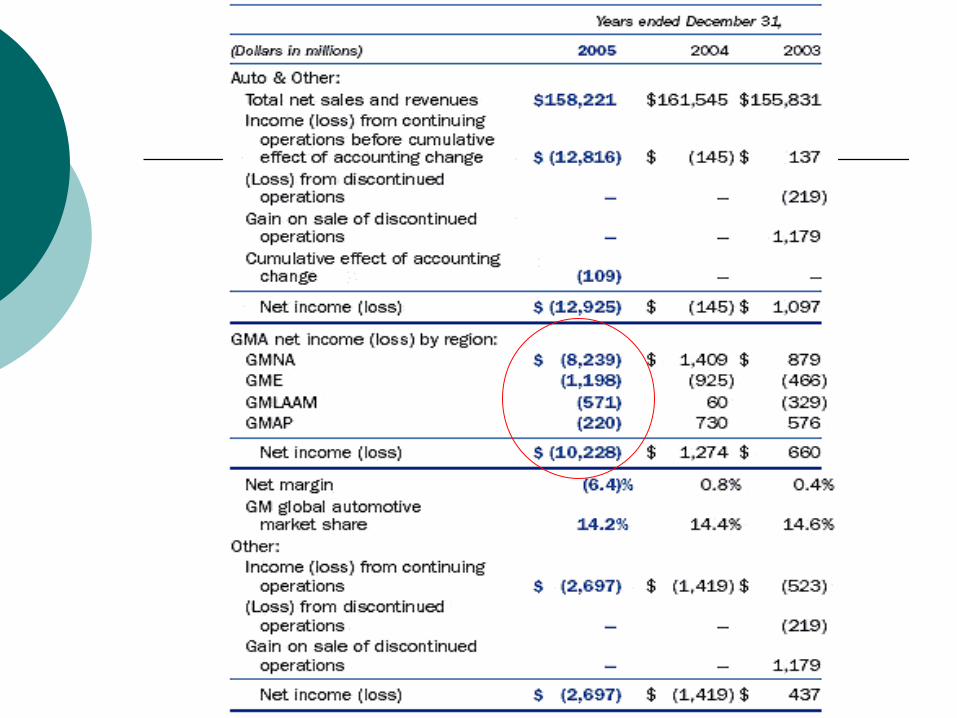
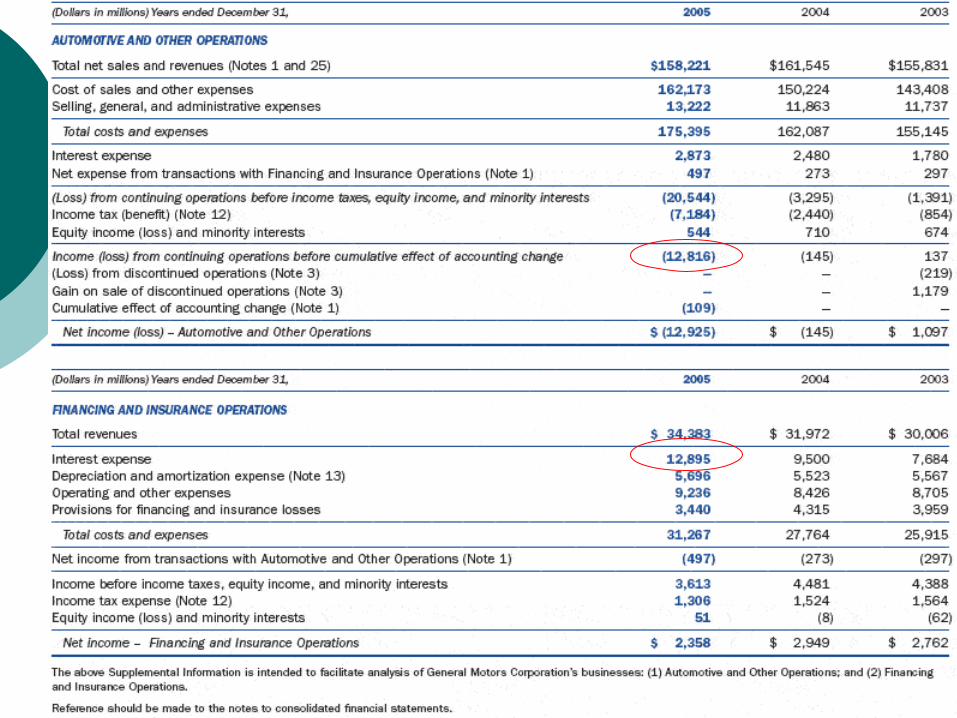
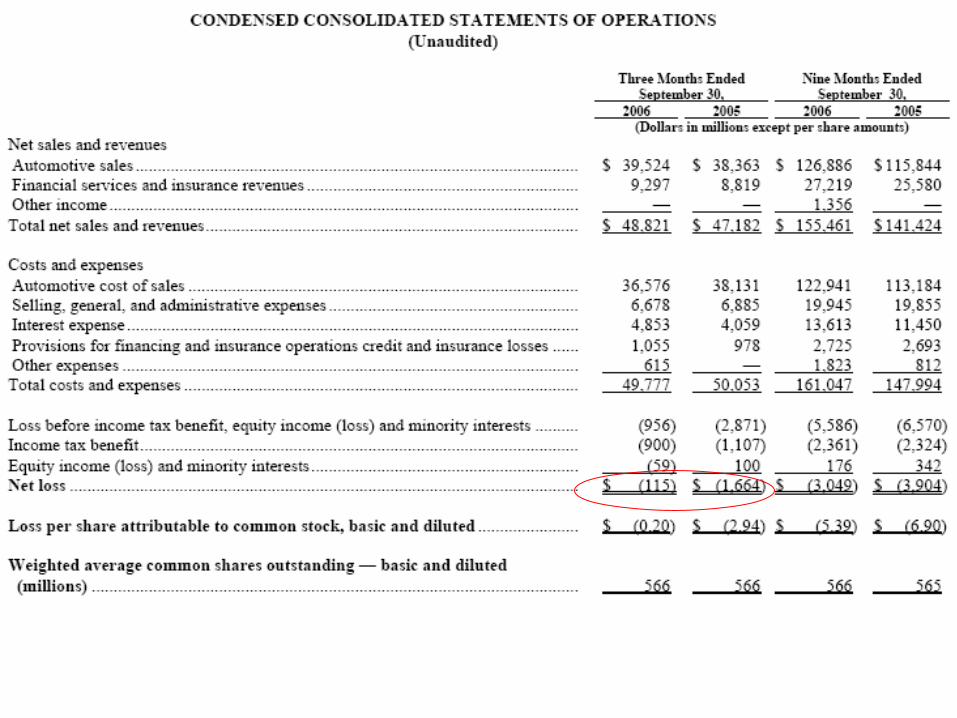
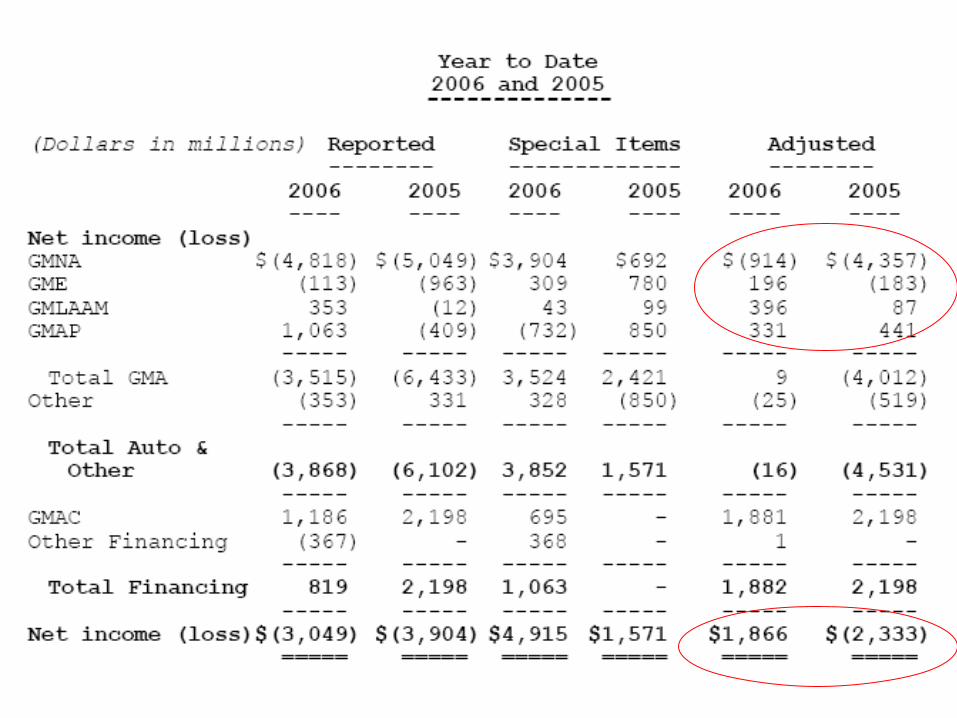
Consolidated Results
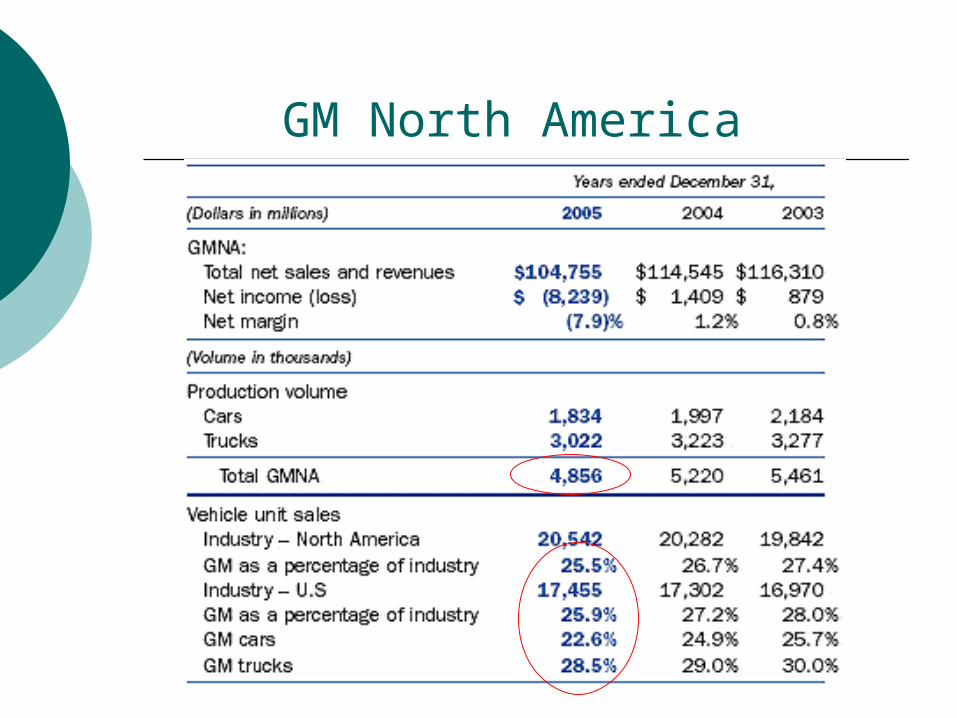
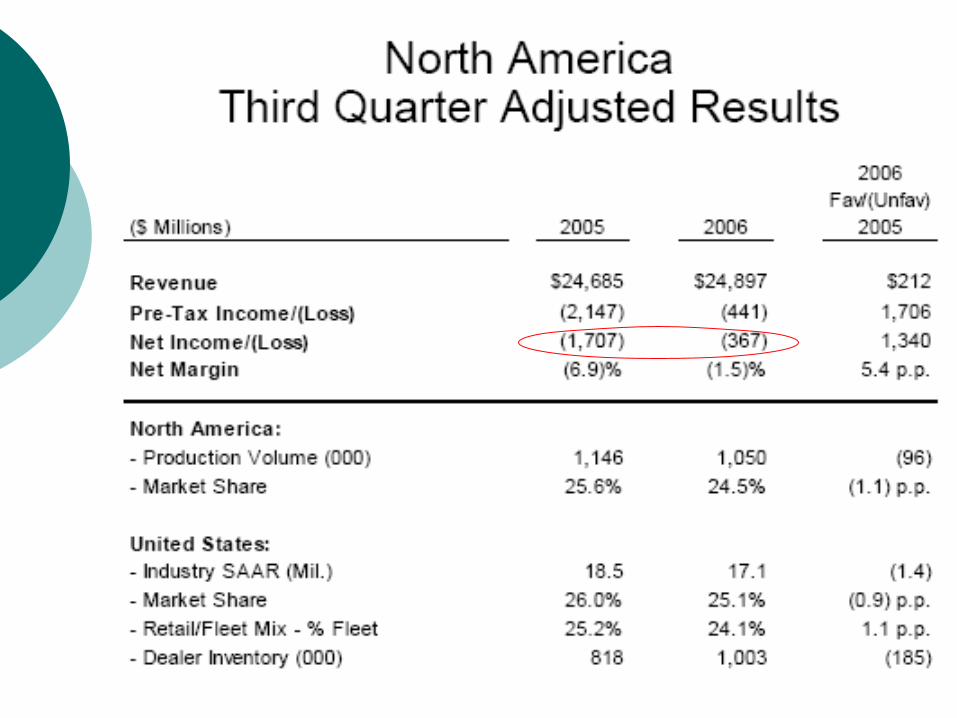
GM North America
GM North America
The loss due to: declines in sales of higher margin
large cars Unfavorable material costs Increased health-care expenses Advertising and sales promotion
cost increases restructuring charge
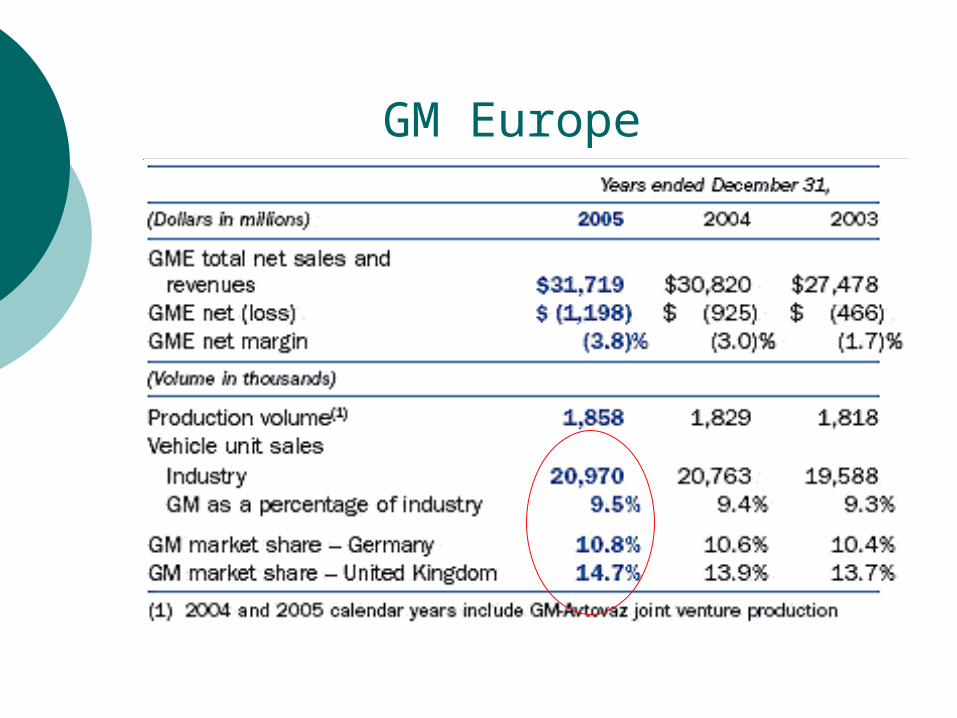
GM Europe
GM Europe
In February 2005, GM successfully bought itself out of a put option with Fiat for $2 billion USD
Restructuring charges negative pricing unfavorable exchange rates Pricing declines
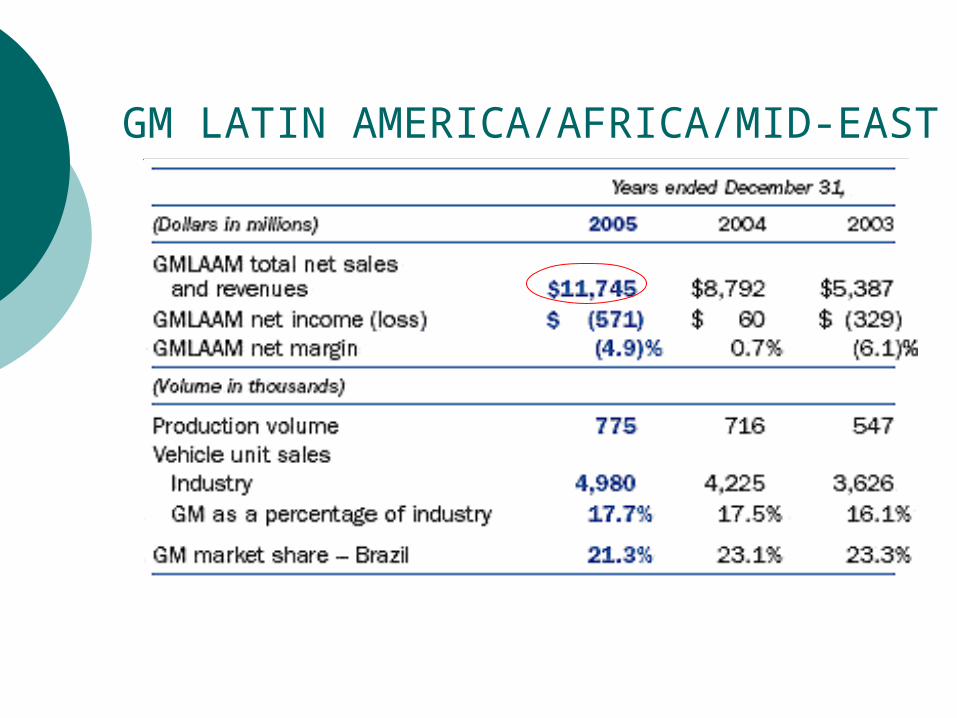
GM LATIN AMERICA/AFRICA/MID-EAST
GM LATIN AMERICA/AFRICA/MID-EAST
significant industry growth in 2005 19% increase in vehicle unit sales net sales and revenues improved by
approximately 34% Lost due to: quarter impairment charges of $99
million for assets A full valuation allowance charge
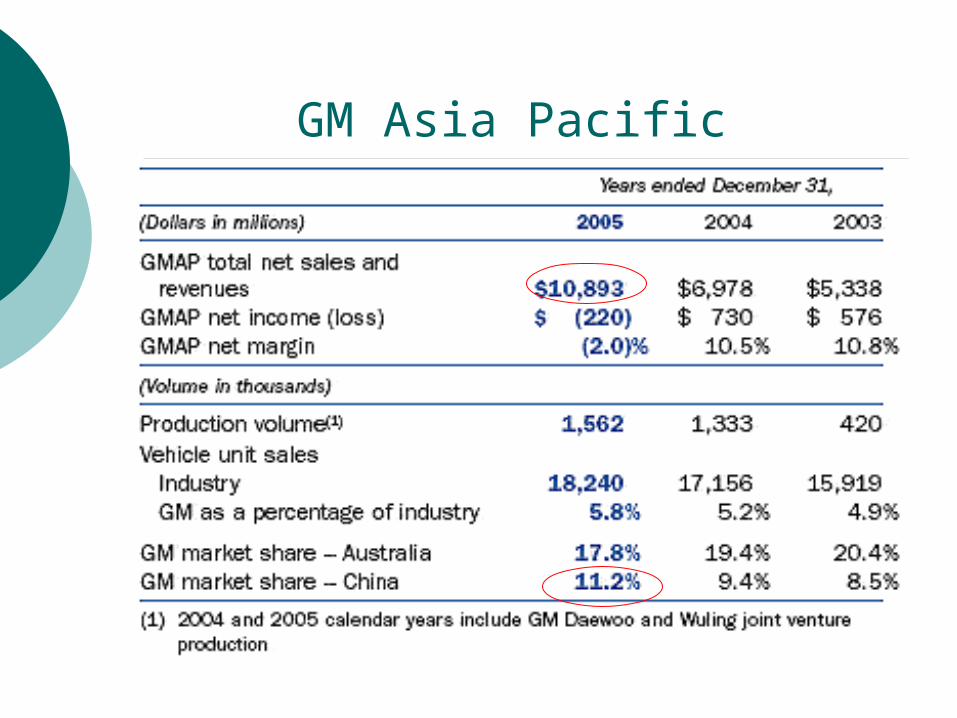
GM Asia Pacific
GM Asia Pacific
General Motors is the top-selling foreign auto maker in China
unit sales in the Asia Pacific region increased approximately 6.3%
the fastest growing automotive region Unit sales increase by 20% Lost due to:
Write-down of GM’s investment in FHI (Fuji Heavy Industries )
asset impairment charges restructuring activities
Continue to take advantage of the strong position and growth in China, leverage its capabilities at GM Daewoo, and execute the turnaround at GM’s Holden unit
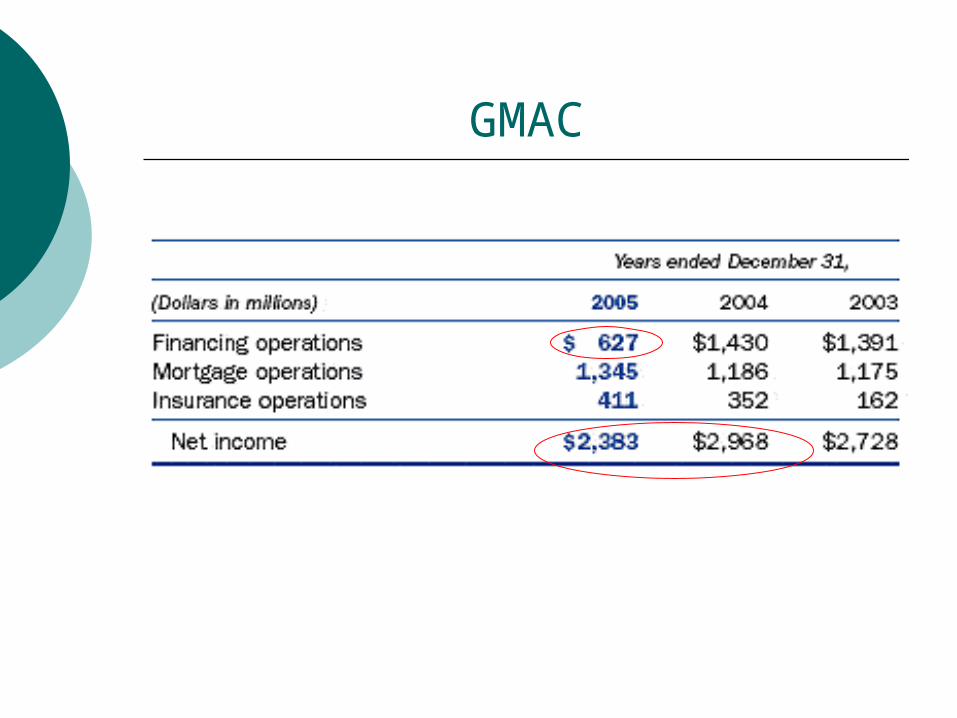
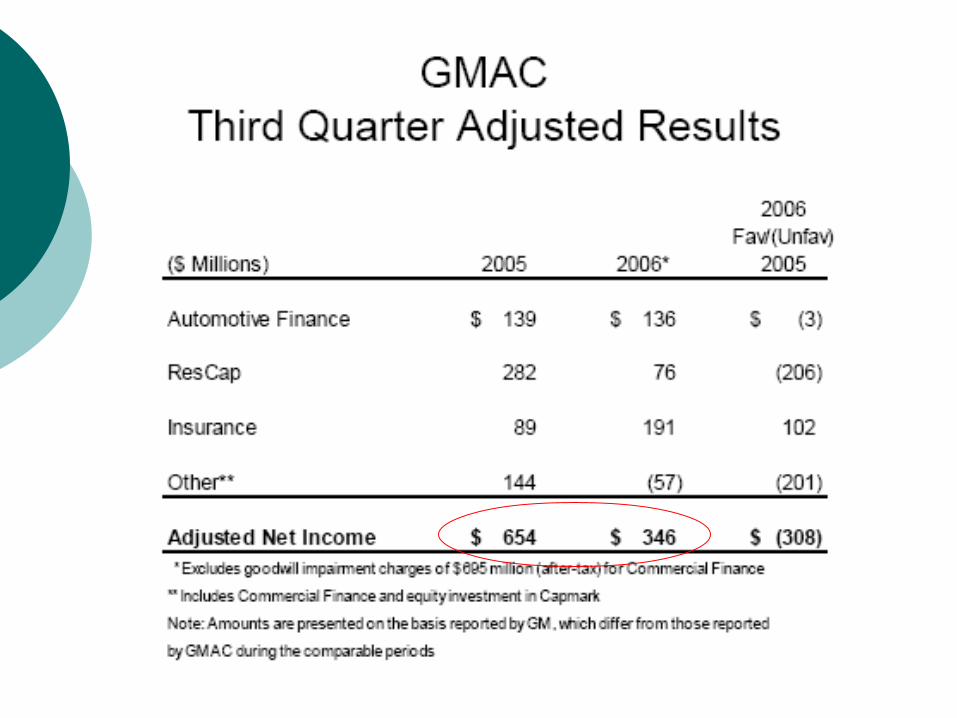
GMAC
GMAC
goodwill impairment charges lower net interest margins
North America Turnaround Plan
Four-point turnaround plan Keep raising the bar in the execution
of great cars and trucks Revitalize sales and marketing
strategy. Significantly improve cost
competitiveness Address health-care and pension
legacy cost burden.
Turnaround Plan – Plant and labor reduction
cease production at 12 U.S. plants by 2008 reduce manufacturing workforce by 30,000
positions (cumulative reduction to 38 percent ) reduce our retiree health-care obligations by
about $15 billion cap the company’s contribution to salaried retiree
health-care costs modify pension benefits for salaried and
executive employees reduced salaries of our top executives reduced our dividend by 50 percent
Expected to result in annual cost reductions totaling $7 billion
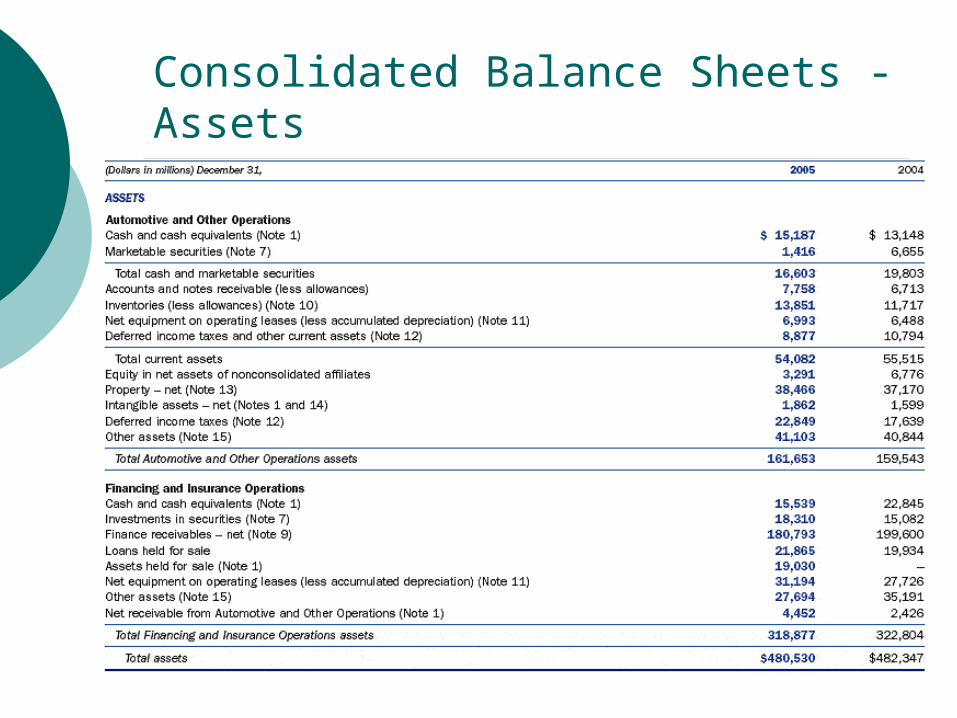
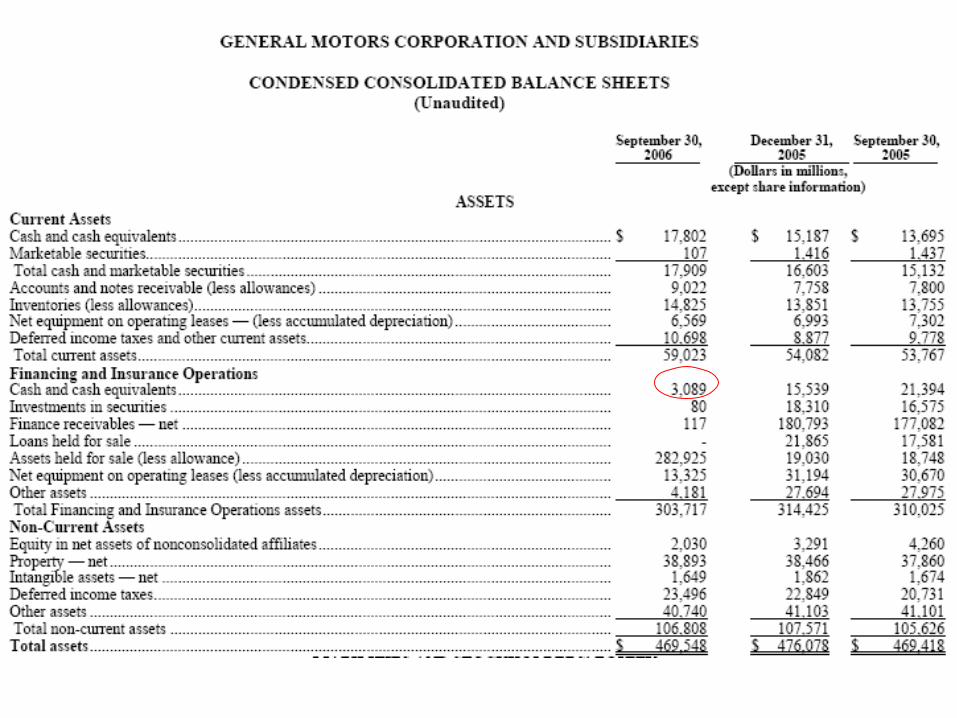
Consolidated Balance Sheets - Assets
• •< Previous Page •Next Page >
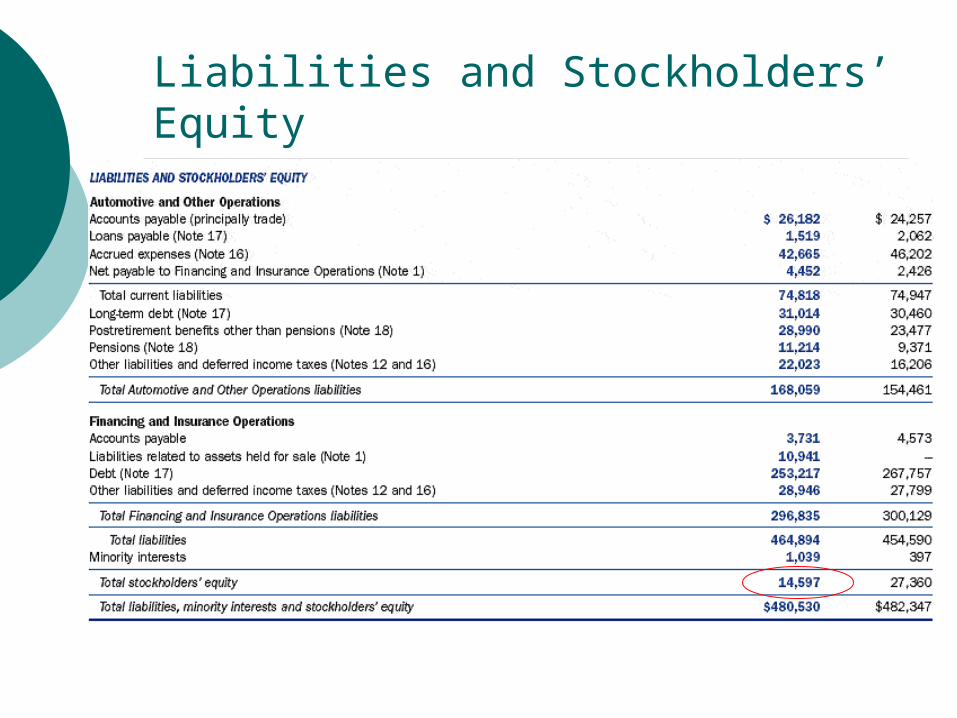
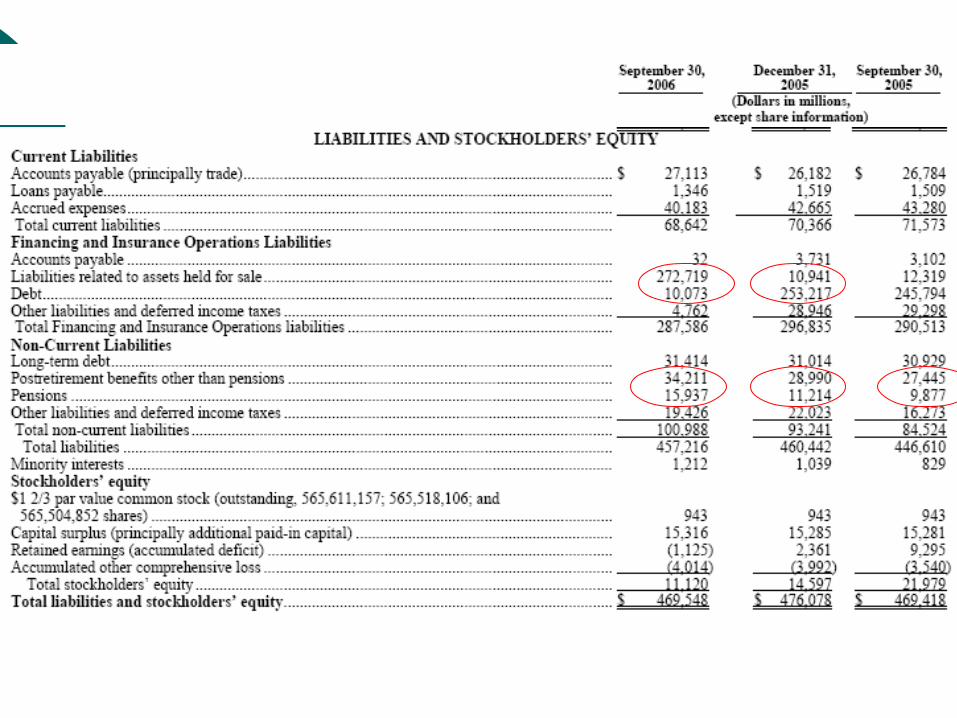
Consolidated Balance Sheets – Liabilities and Stockholders’ Equity
• •< Previous Page •Next Page >
• •< Previous Page •Next Page >
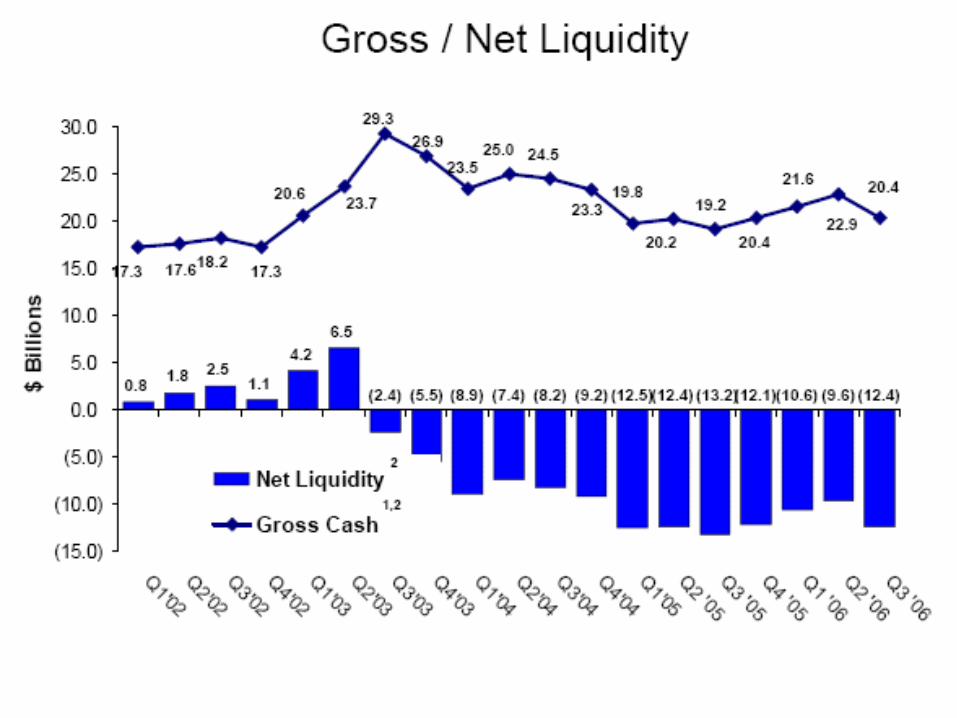
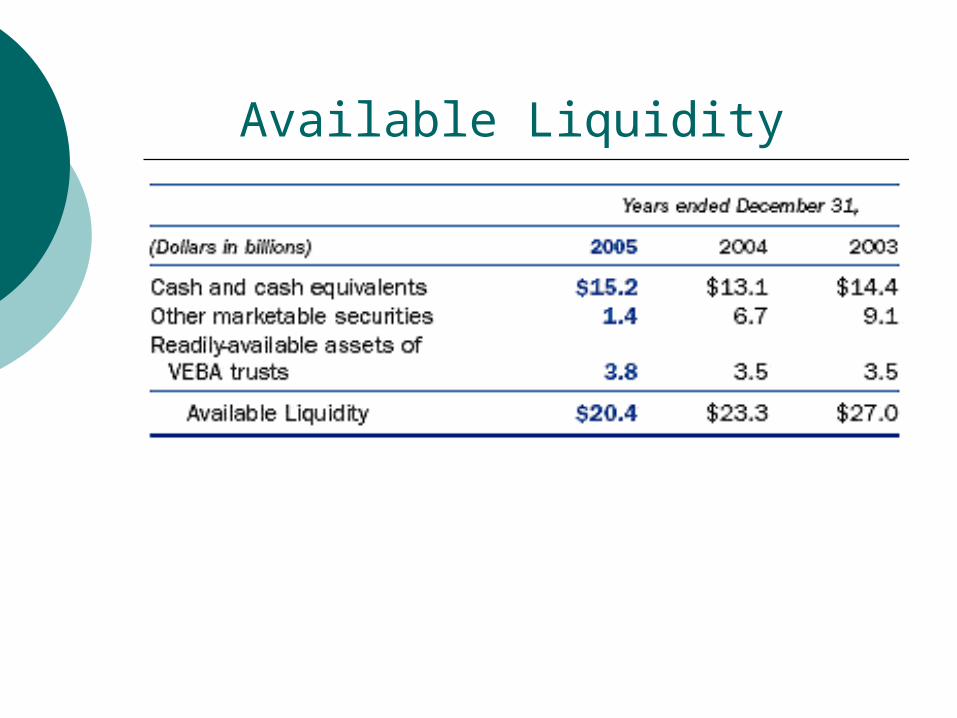
Available Liquidity
• •< Previous Page •Next Page >
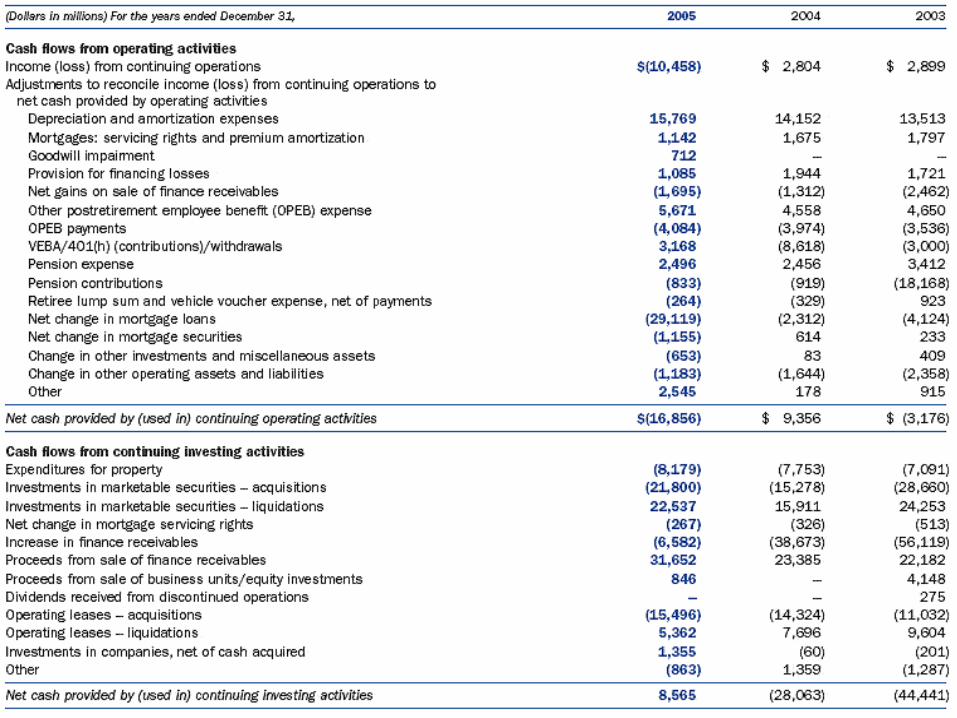
Cash flows from continuing operating activities
• •< Previous Page •Next Page >
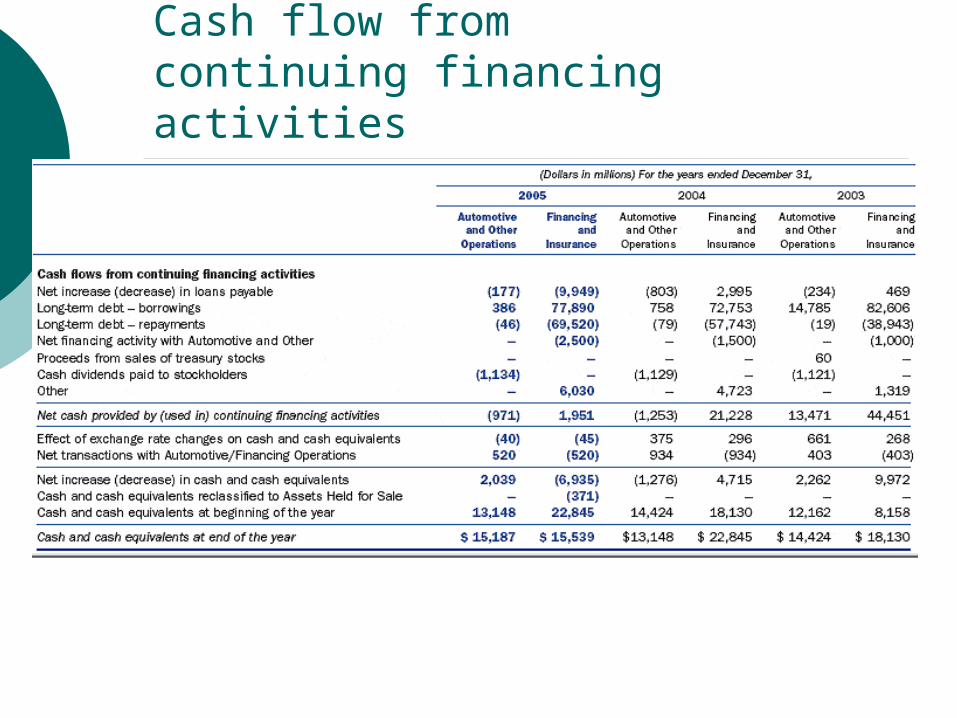
Cash flow from continuing financing activities
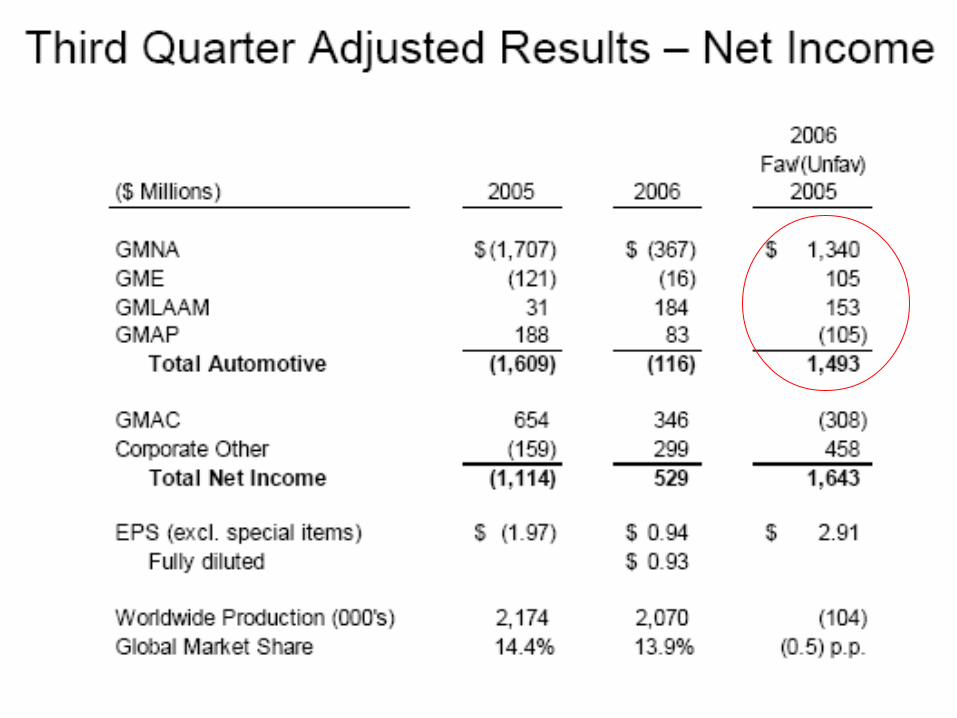
Q3 financial Highlights
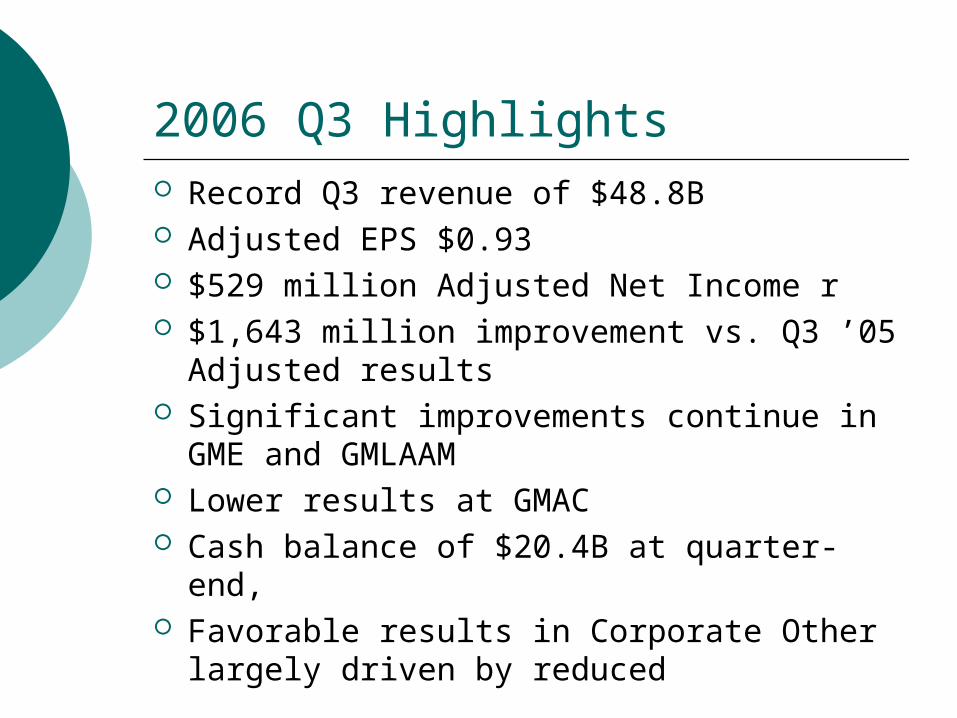
2006 Q3 Highlights Record Q3 revenue of $48.8B Adjusted EPS $0.93 $529 million Adjusted Net Income r $1,643 million improvement vs. Q3 ’05
Adjusted results Significant improvements continue in GME
and GMLAAM Lower results at GMAC Cash balance of $20.4B at quarter-end, Favorable results in Corporate Other
largely driven by reduced
Goals
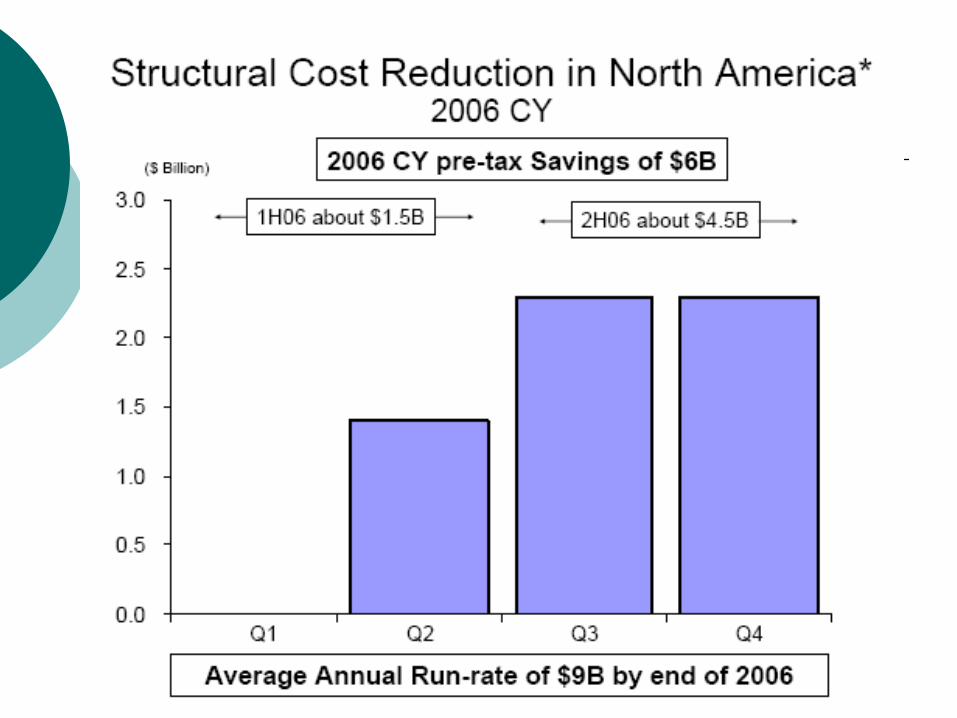
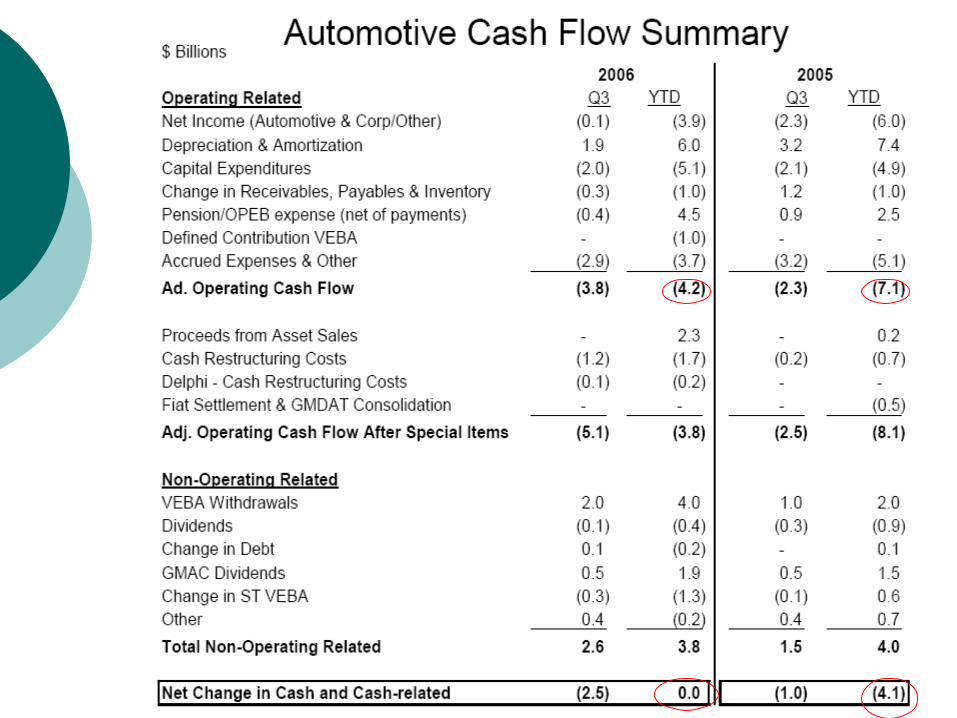
Automotive operations improved by $1.5B on an adjusted basis, on strength of cost actions in GMNA and continued momentum in other regions
On track to achieve $9B structural cost target on a running rate basis by the end of 2006 – and continuing to work on goal to reduce to 25% of revenues by 2010
Key priority is to finalize negotiations with Delphi Continue to be on track to close the GMAC
transaction in Q4 Automotive liquidity remains strong at $20.4B,
but continued focus on improving operating cash
flow
Key Success Factors
1) Continued demand for GM’s most profitable products and the maintenance of a strong product mix
2) The introduction of innovative new products on a timely cadence, through the integration of global architectures, engineering, and procurement efforts
3) The implementation of measures for reducing structural costs, offsetting legacy and health-care burdens
4) Maintenance of sufficient balance sheet strength and liquidity
5) Other factors affecting GM’s Financing and Insurance Operations (FIO) reportable operating segment results, including interest rates, credit ratings, and demand for mortgage financing.
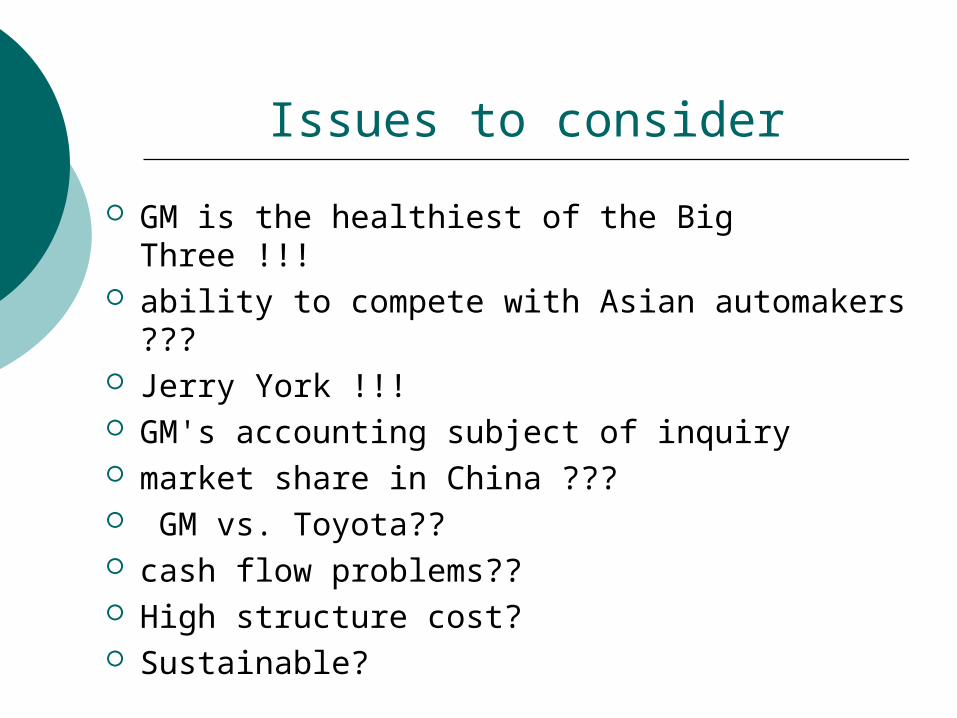
Issues to consider
GM is the healthiest of the Big Three !!! ability to compete with Asian automakers ??? Jerry York !!! GM's accounting subject of inquiry market share in China ??? GM vs. Toyota?? cash flow problems?? High structure cost? Sustainable?
Recommendation
HOLD
Toyota Motor Corporation
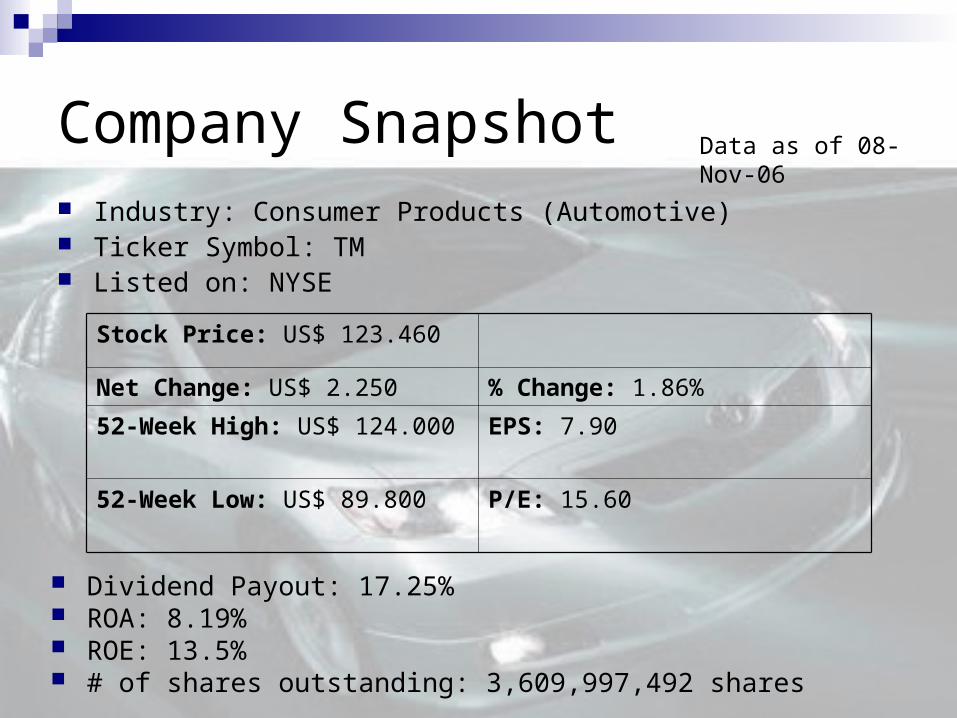
Company Snapshot Industry: Consumer Products (Automotive) Ticker Symbol: TM Listed on: NYSE
Data as of 08-Nov-06
Stock Price: US$ 123.460
Net Change: US$ 2.250 % Change: 1.86%
52-Week High: US$ 124.000 EPS: 7.90
52-Week Low: US$ 89.800 P/E: 15.60
Dividend Payout: 17.25% ROA: 8.19% ROE: 13.5% # of shares outstanding: 3,609,997,492 shares
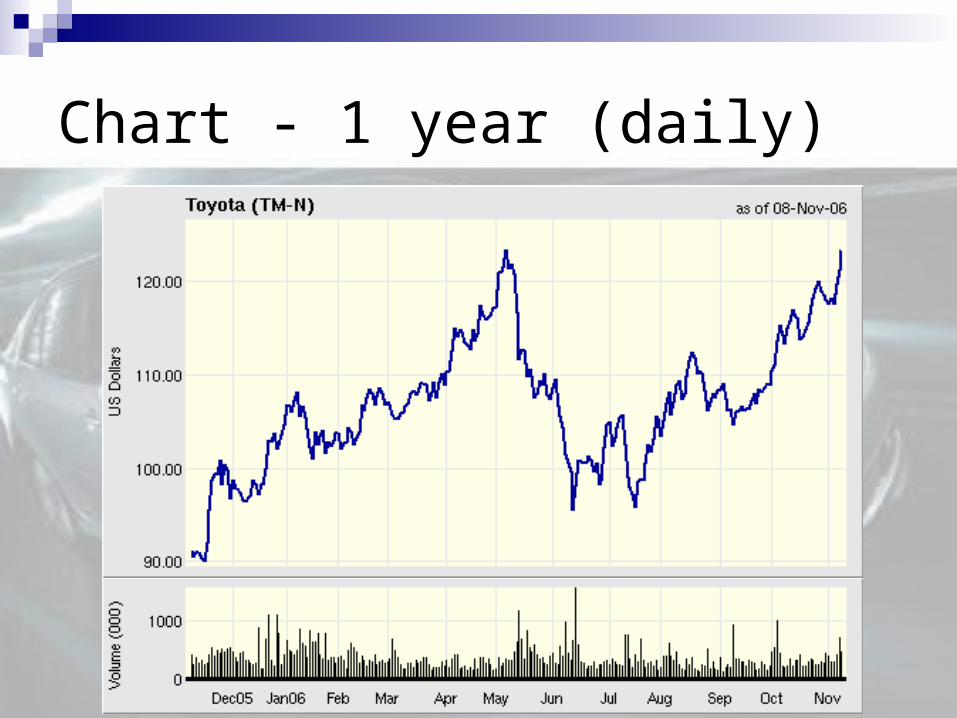
Chart - 1 year (daily)

Chart – 5 years (monthly)
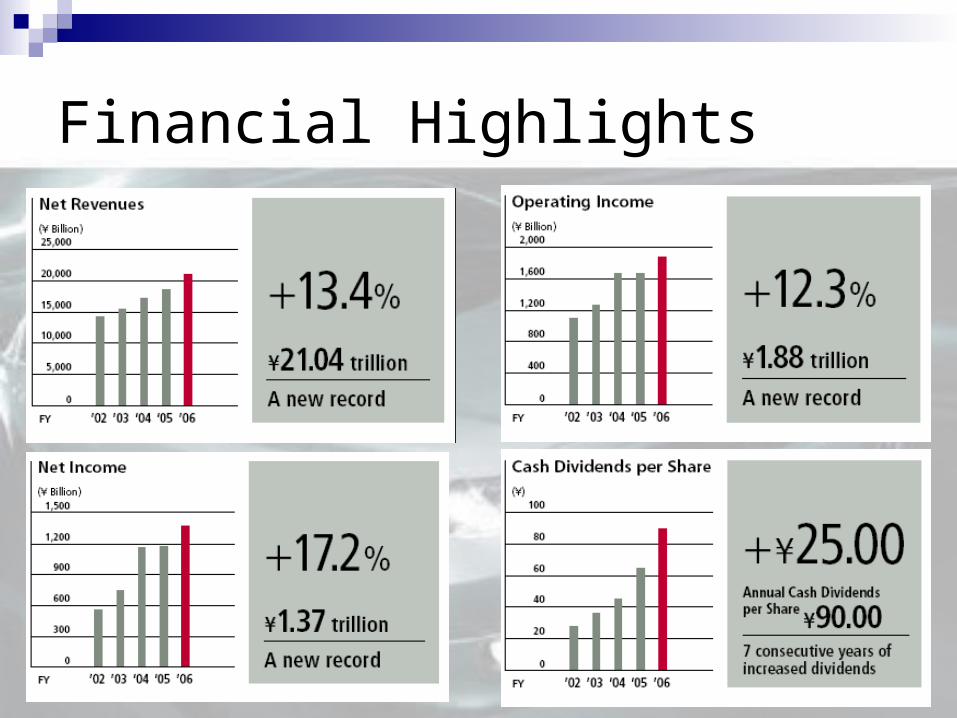
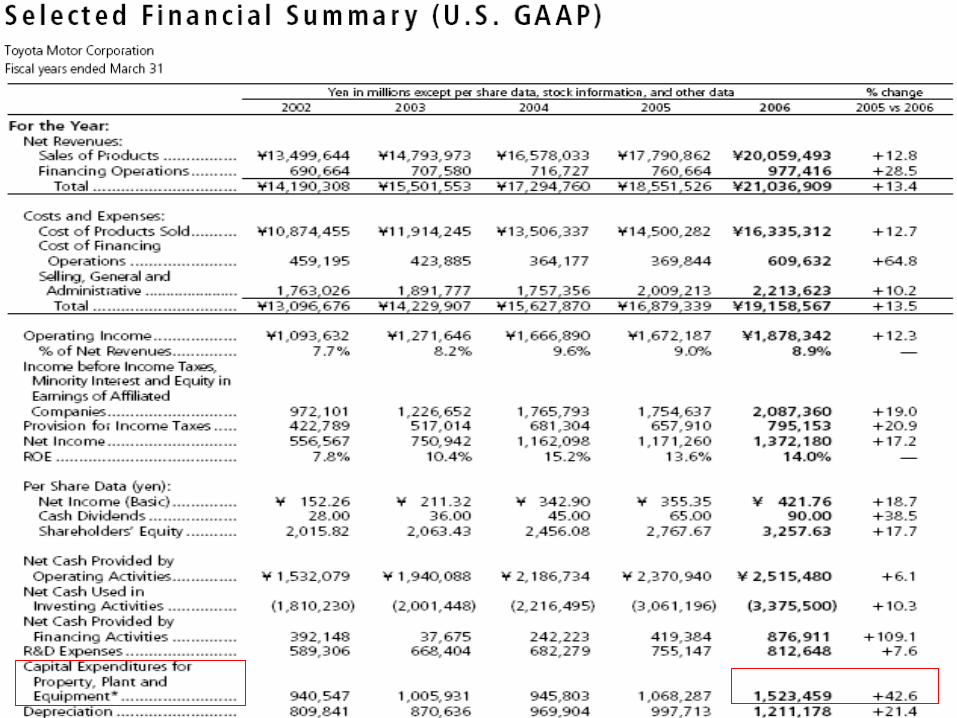
Financial Highlights
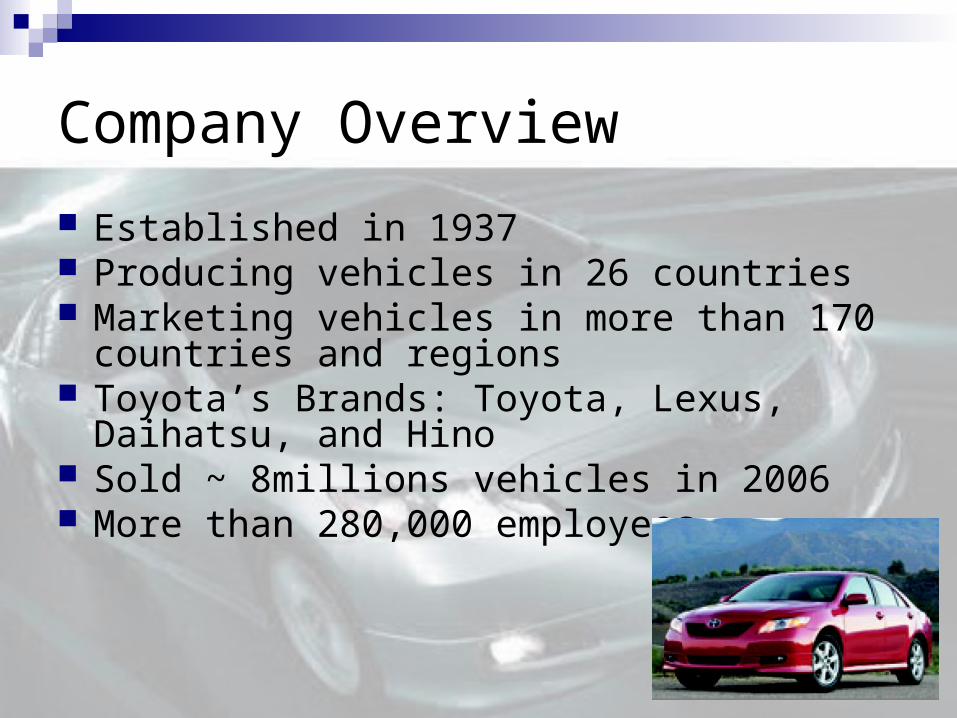
Company Overview
Established in 1937 Producing vehicles in 26 countries Marketing vehicles in more than 170 countries
and regions Toyota’s Brands: Toyota, Lexus, Daihatsu, and
Hino Sold ~ 8millions vehicles in 2006 More than 280,000 employees
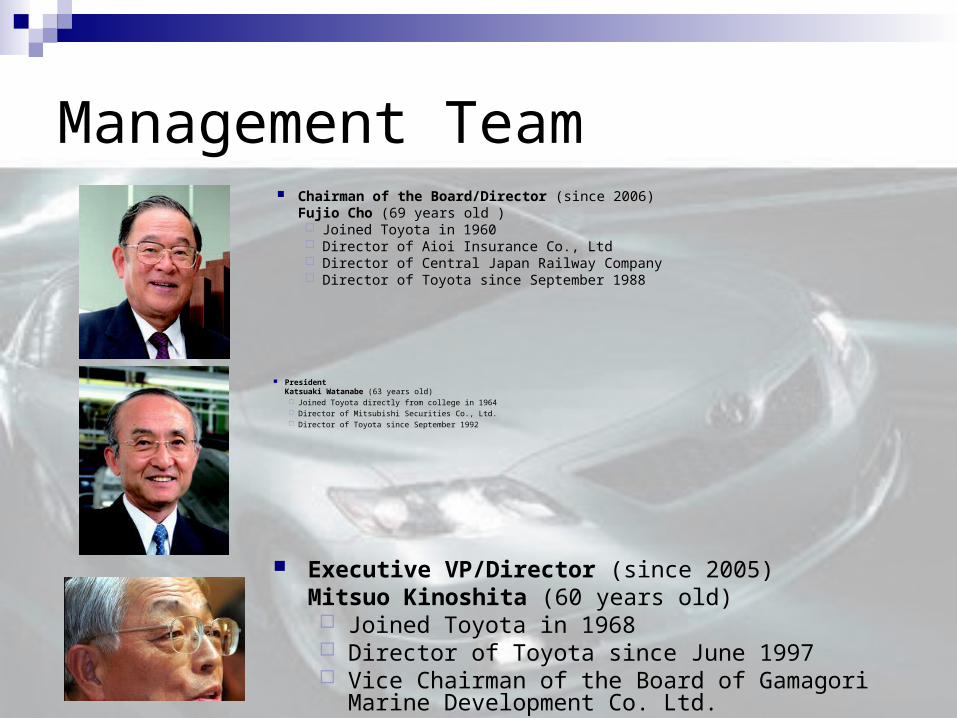
Management Team
Executive VP/Director (since 2005)Mitsuo Kinoshita (60 years old) Joined Toyota in 1968 Director of Toyota since June 1997 Vice Chairman of the Board of Gamagori Marine
Development Co. Ltd.
Chairman of the Board/Director (since 2006)Fujio Cho (69 years old ) Joined Toyota in 1960 Director of Aioi Insurance Co., Ltd Director of Central Japan Railway Company Director of Toyota since September 1988
PresidentKatsuaki Watanabe (63 years old) Joined Toyota directly from college in 1964 Director of Mitsubishi Securities Co., Ltd. Director of Toyota since September 1992
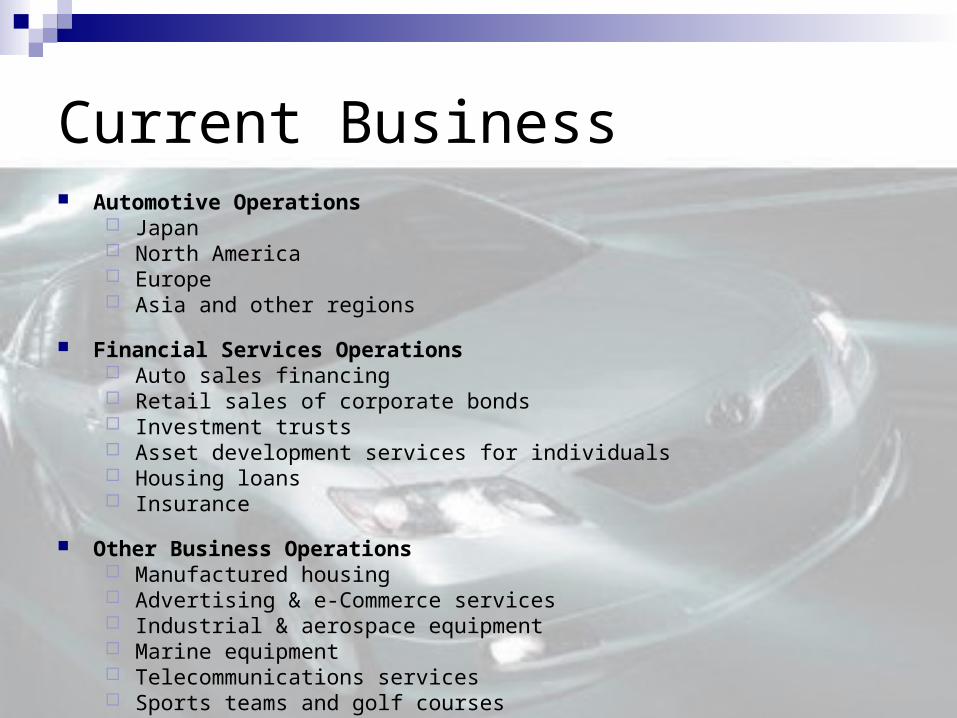
Current Business Automotive Operations
Japan North America Europe Asia and other regions
Financial Services Operations Auto sales financing Retail sales of corporate bonds Investment trusts Asset development services for individuals Housing loans Insurance
Other Business Operations Manufactured housing Advertising & e-Commerce services Industrial & aerospace equipment Marine equipment Telecommunications services Sports teams and golf courses
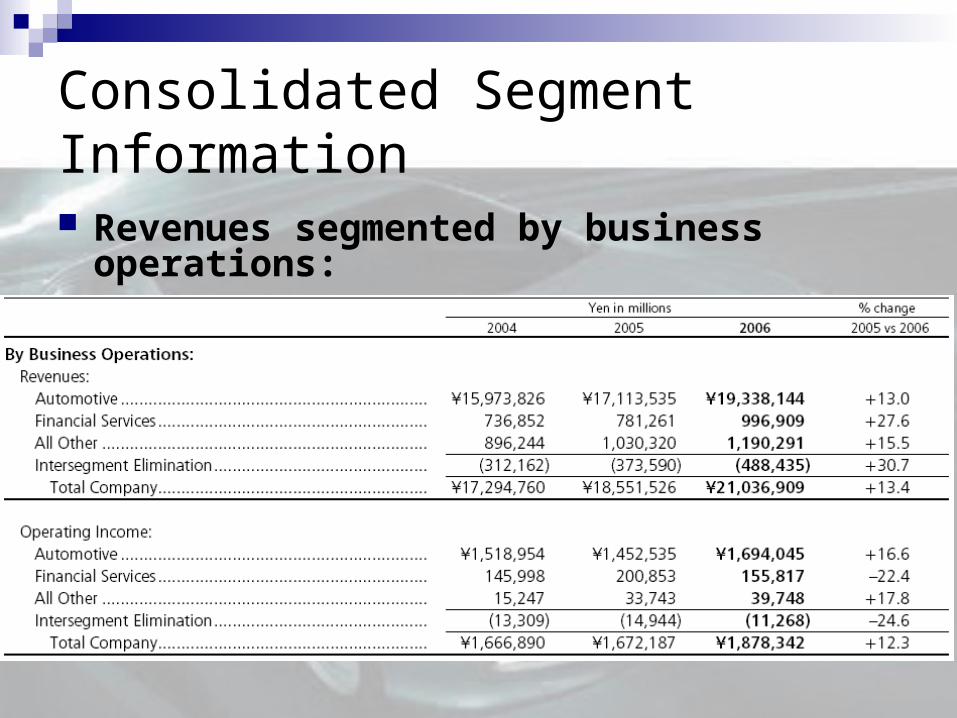
Consolidated Segment Information
Revenues segmented by business operations:
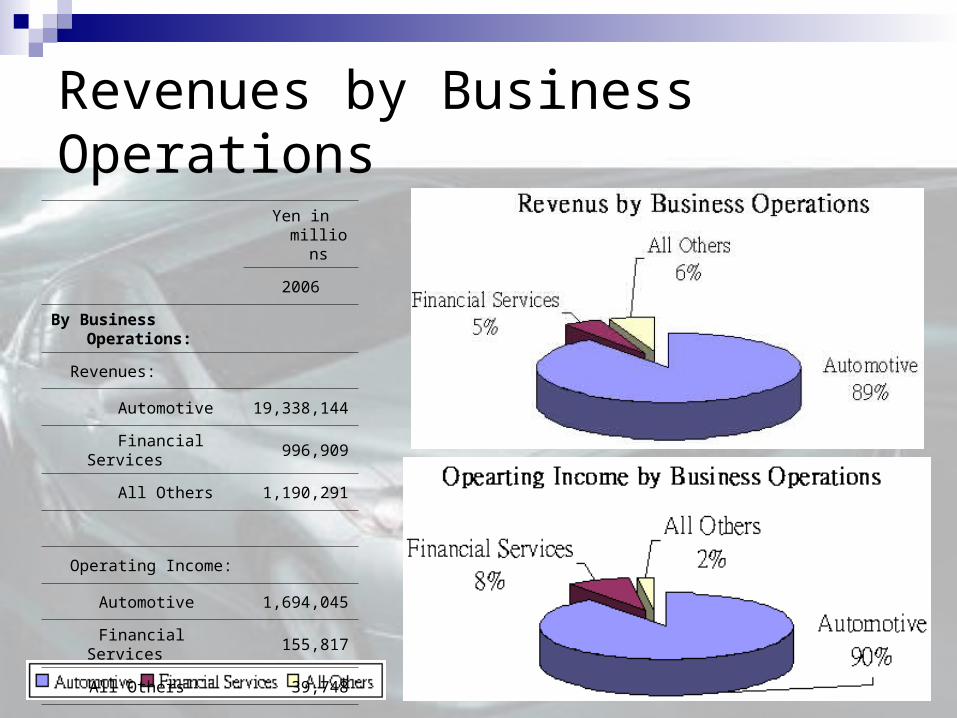
Revenues by Business Operations
Yen in
millions
2006
By Business Operations:
Revenues:
Automotive 19,338,144
Financial Services 996,909
All Others 1,190,291
Operating Income:
Automotive 1,694,045
Financial Services 155,817
All Others 39,748
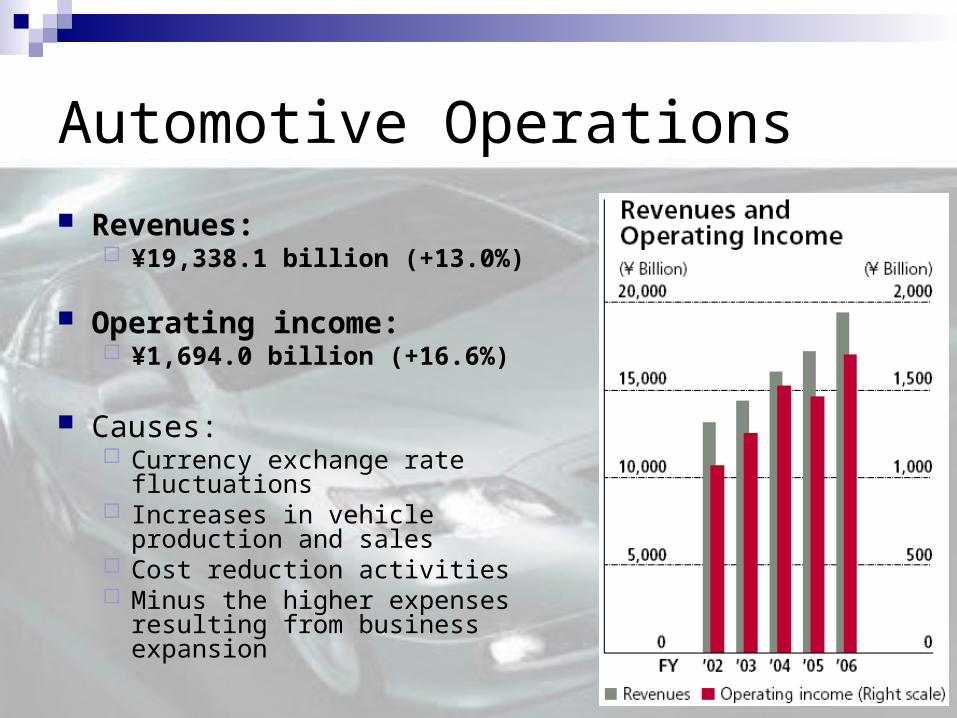
Automotive Operations
Revenues: ¥19,338.1 billion (+13.0%)
Operating income: ¥1,694.0 billion (+16.6%)
Causes: Currency exchange rate fluctuations Increases in vehicle production and
sales Cost reduction activities Minus the higher expenses resulting
from business expansion
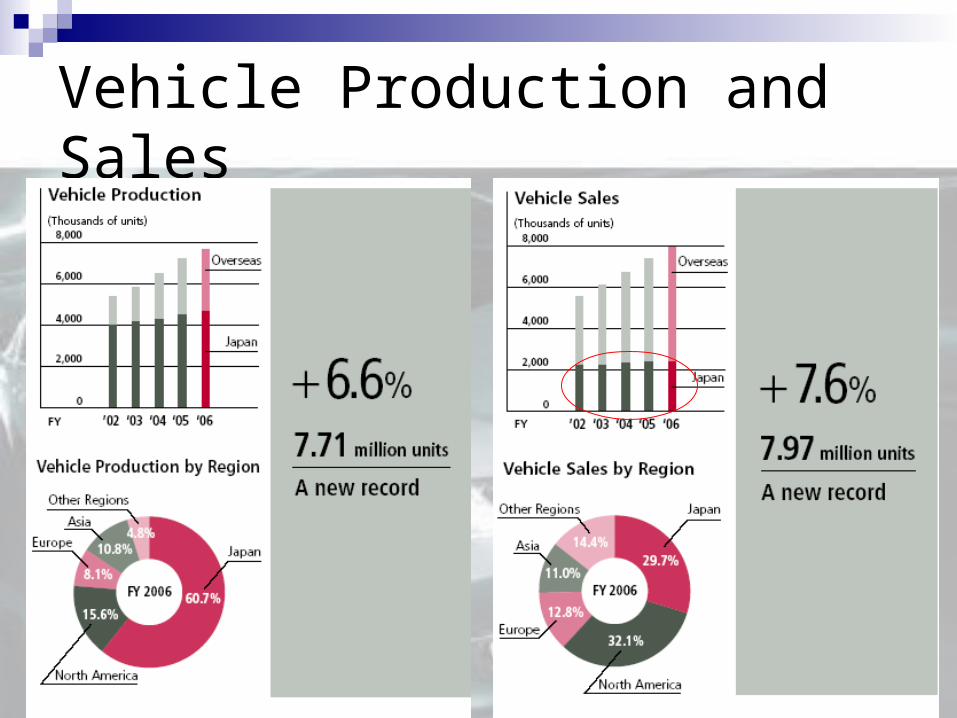
Vehicle Production and Sales
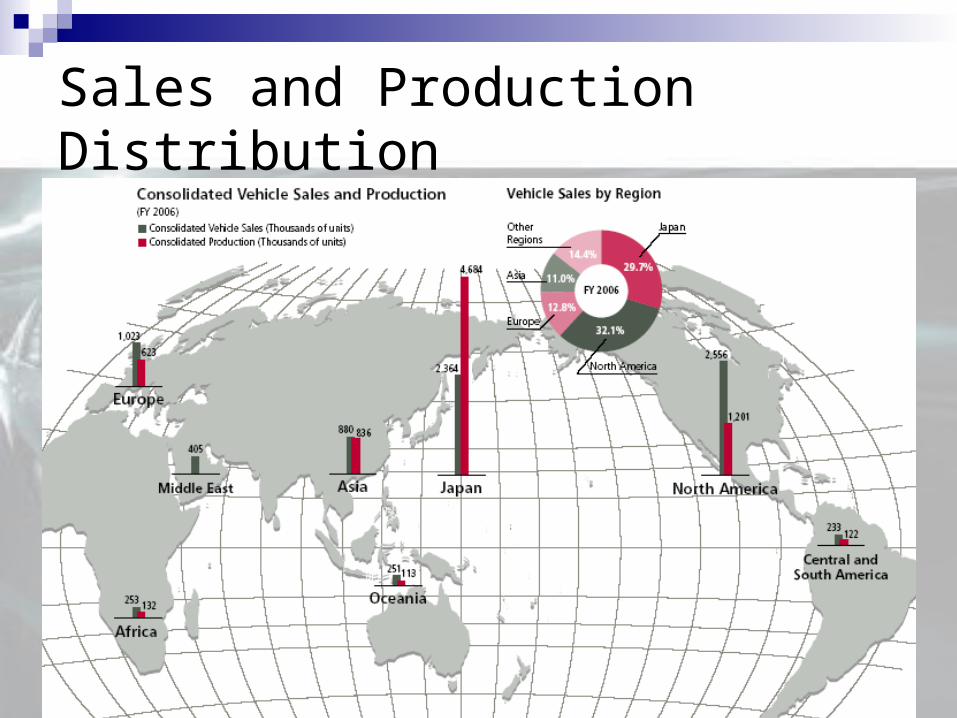
Sales and Production Distribution
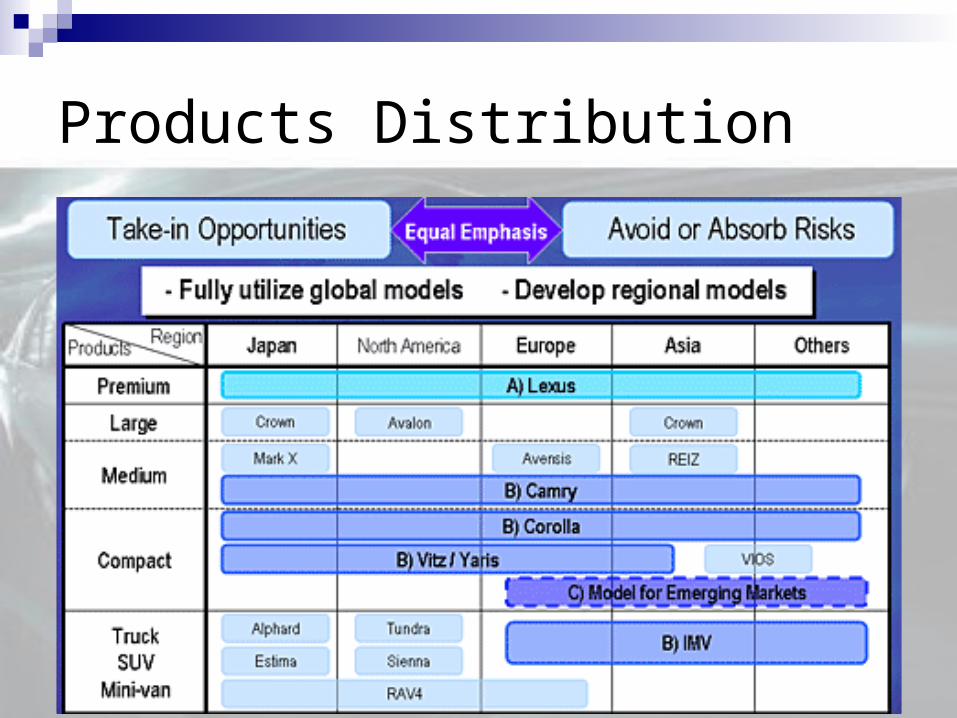
Products Distribution
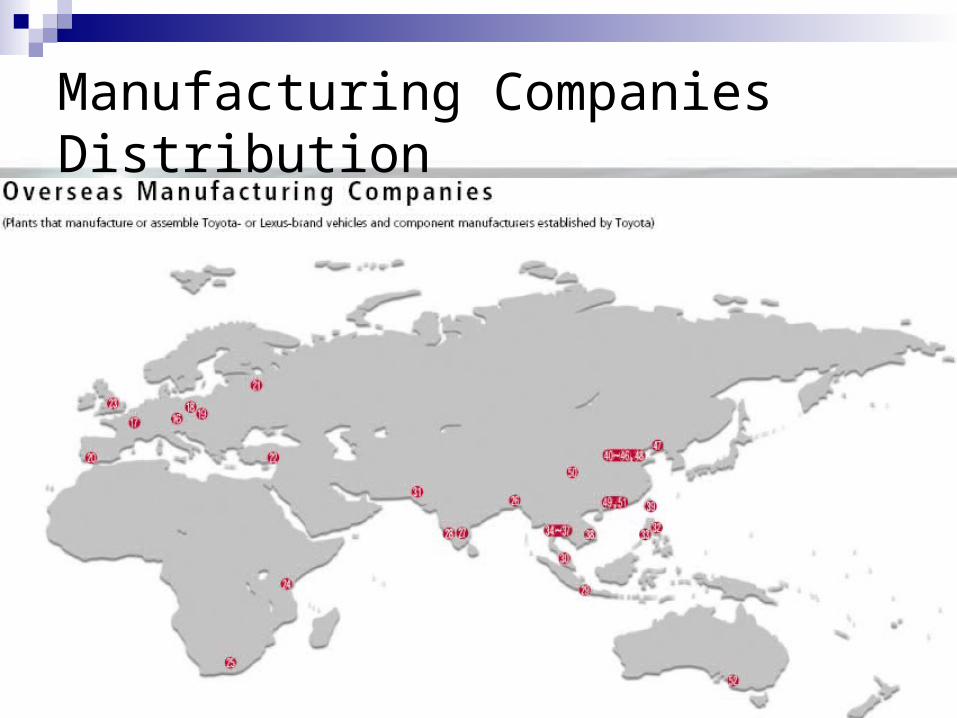
Manufacturing Companies Distribution
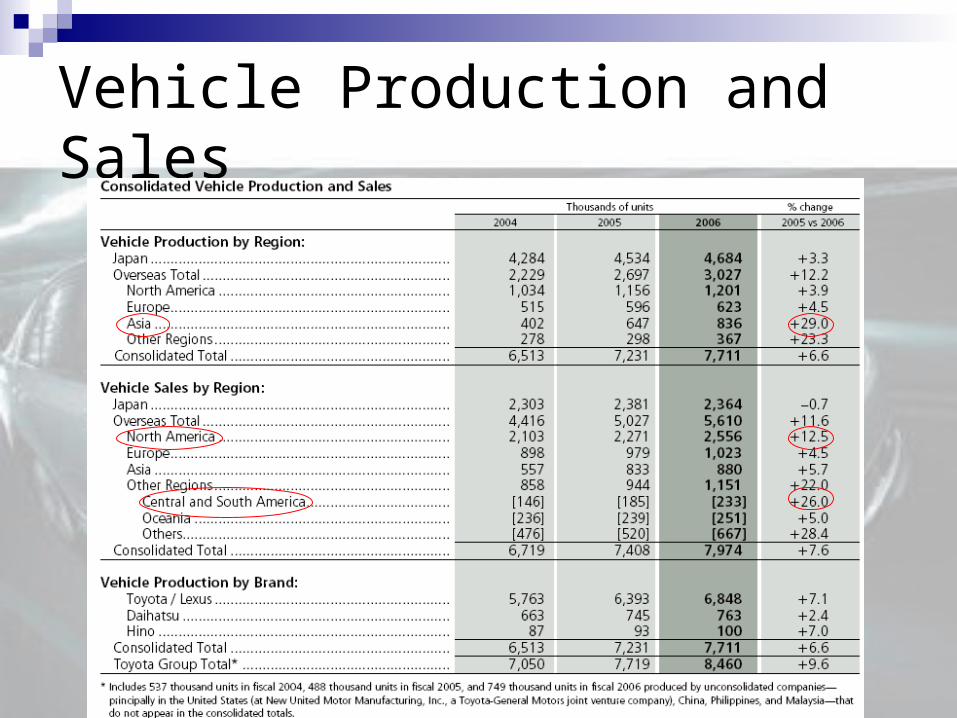
Vehicle Production and Sales
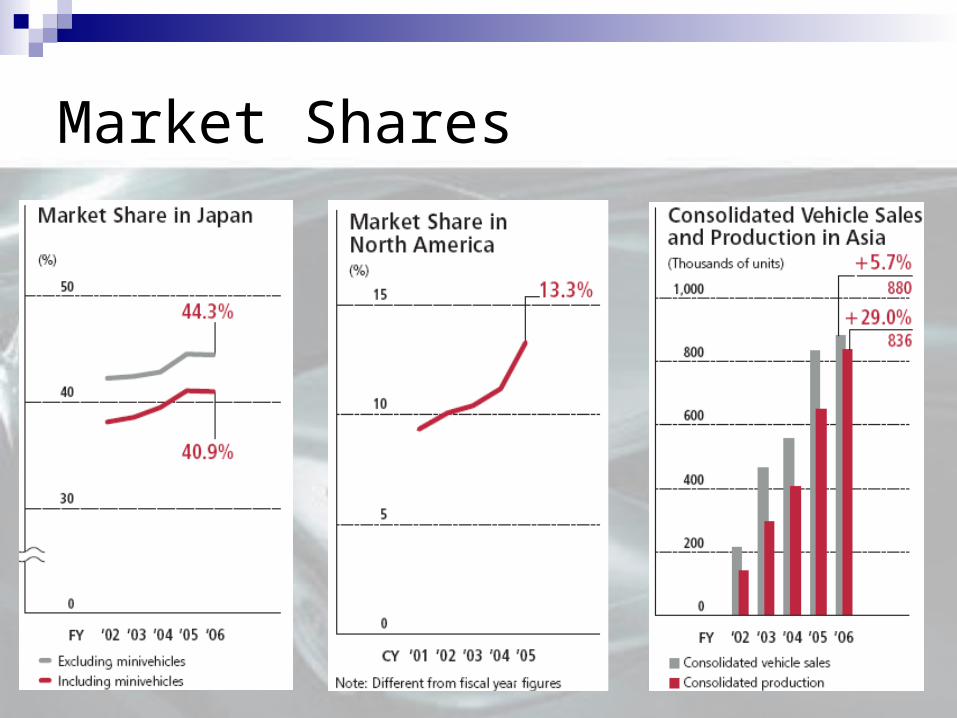
Market Shares
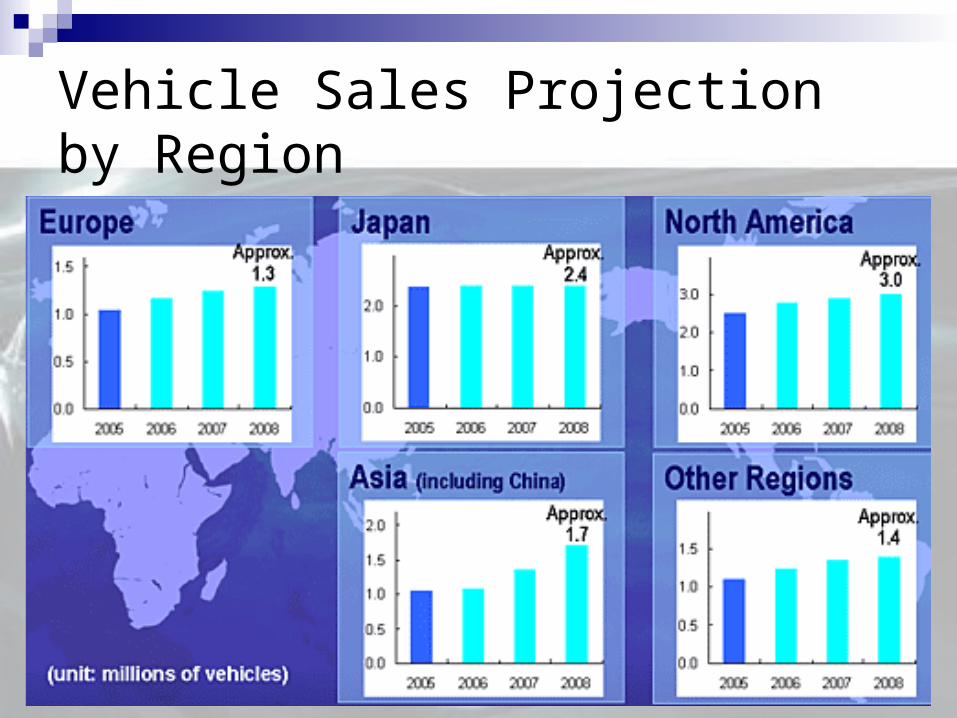
Vehicle Sales Projection by Region
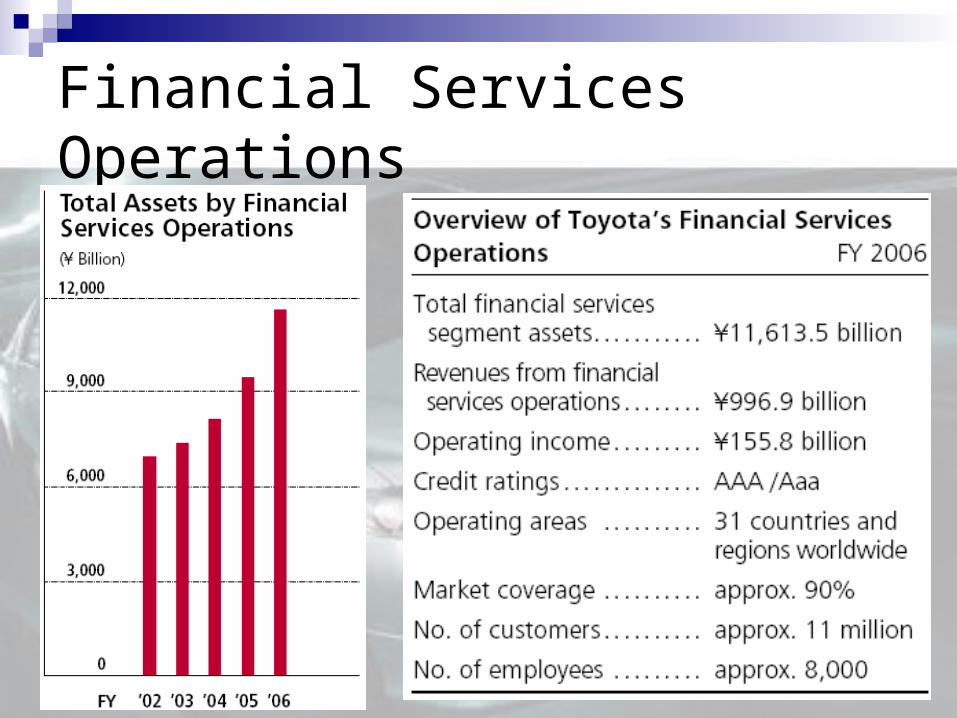
Financial Services Operations
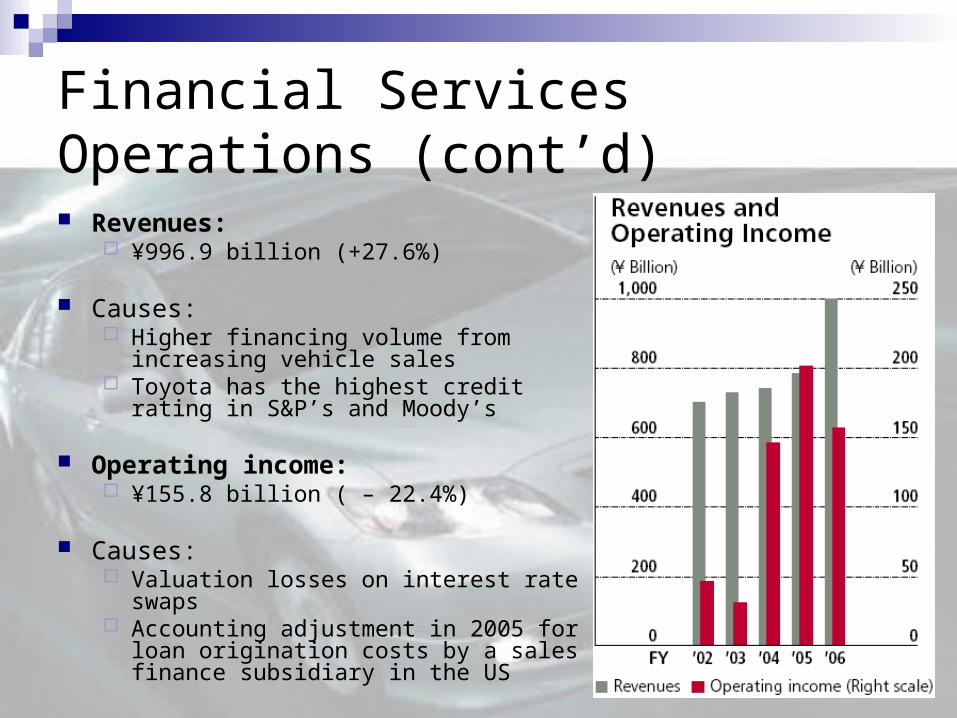
Financial Services Operations (cont’d) Revenues:
¥996.9 billion (+27.6%)
Causes: Higher financing volume from increasing
vehicle sales Toyota has the highest credit rating in
S&P’s and Moody’s
Operating income: ¥155.8 billion ( – 22.4%)
Causes: Valuation losses on interest rate swaps Accounting adjustment in 2005 for loan
origination costs by a sales finance subsidiary in the US
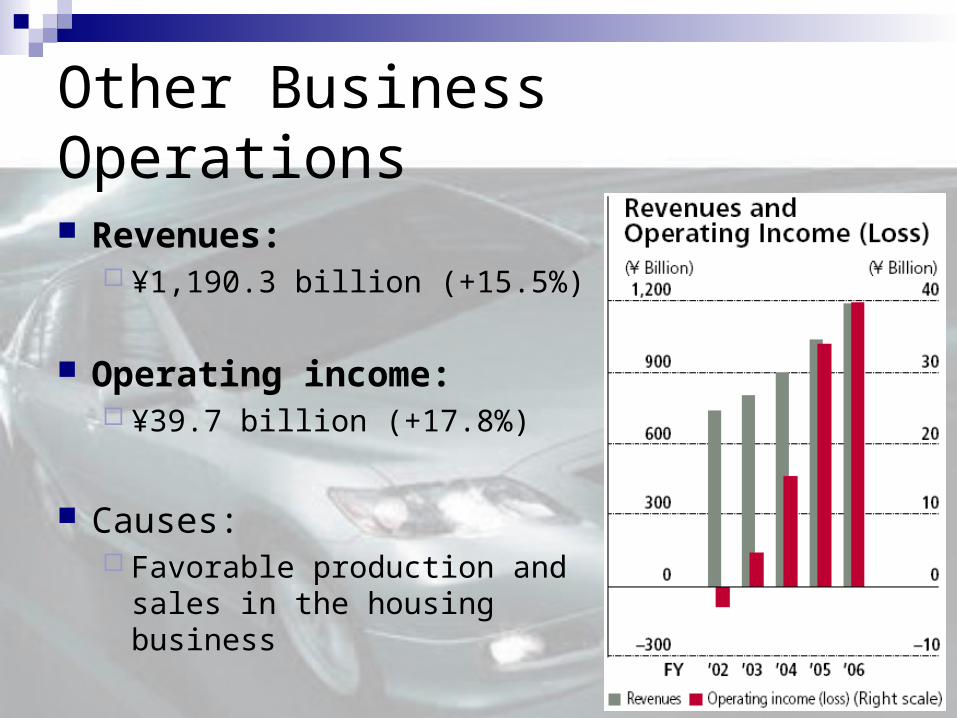
Other Business Operations
Revenues: ¥1,190.3 billion (+15.5%)
Operating income: ¥39.7 billion (+17.8%)
Causes: Favorable production and sales
in the housing business
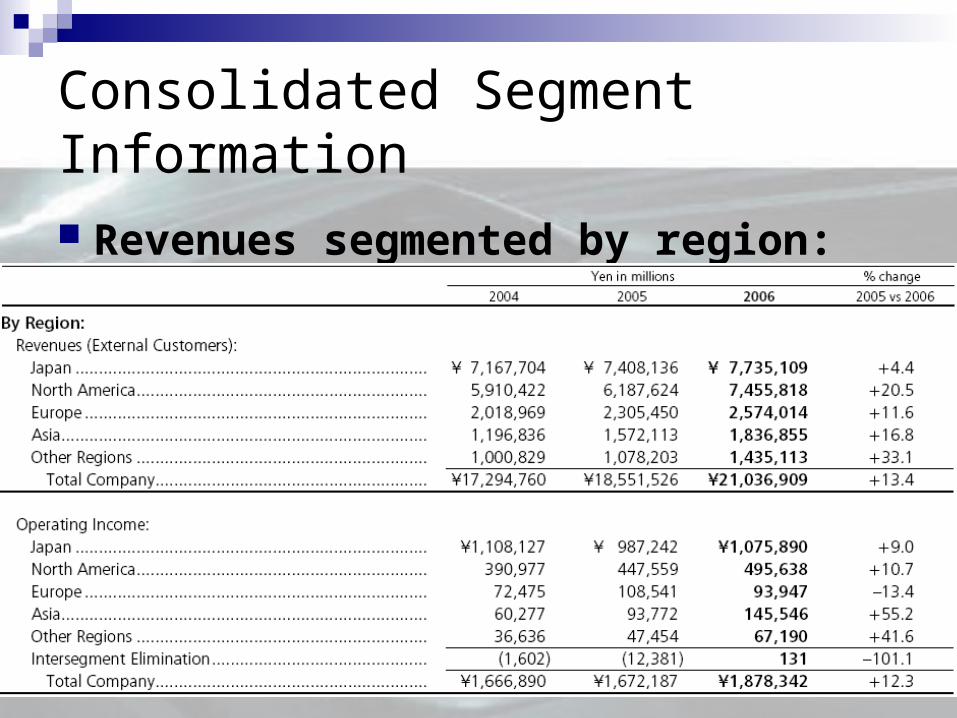
Consolidated Segment Information
Revenues segmented by region:
Revenues by Region Yen in millions
2006
By Region:
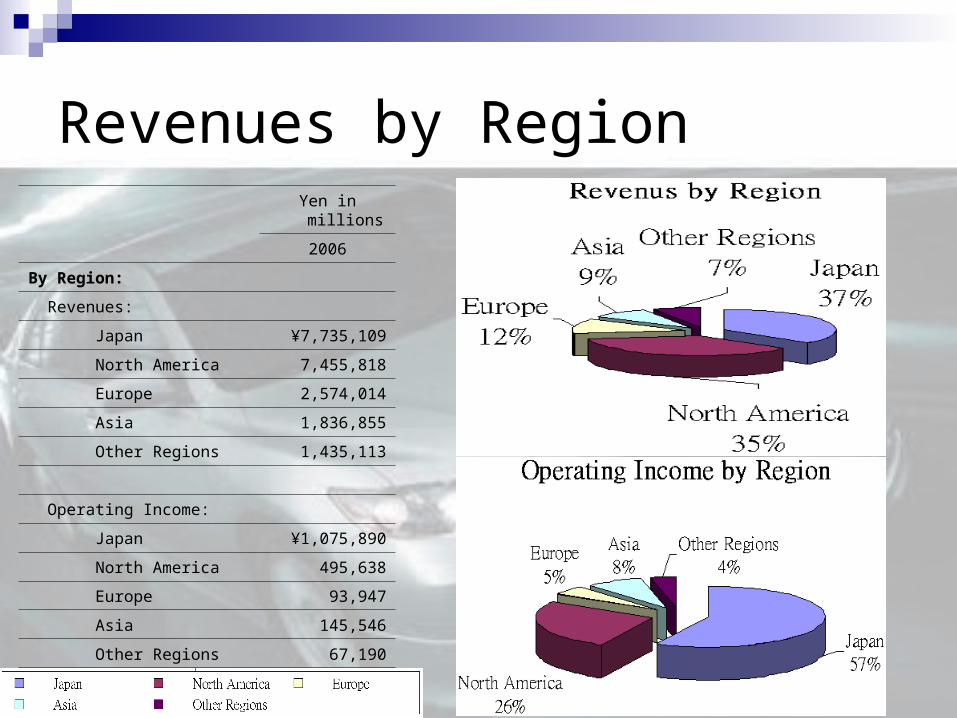
Revenues:
Japan ¥7,735,109
North America 7,455,818
Europe 2,574,014
Asia 1,836,855
Other Regions 1,435,113
Operating Income:
Japan ¥1,075,890
North America 495,638
Europe 93,947
Asia 145,546
Other Regions 67,190
Threats Hikes in crude oil price Hikes in raw materials price Fluctuations in currency exchange rates and interest
rates Structural changes in demand for automobiles Change governmental regulations in automotive industry Political instabilities Fuel shortages or interruptions in transportation systems Natural calamities, wars, terrorism Labor strikes
Competitive Strengths
Superior QualityBrand Image: safe, environmental friendly
Cost competitive R&D - Technology leader
Fuel-efficient vehicles Solid financial base Personnel development
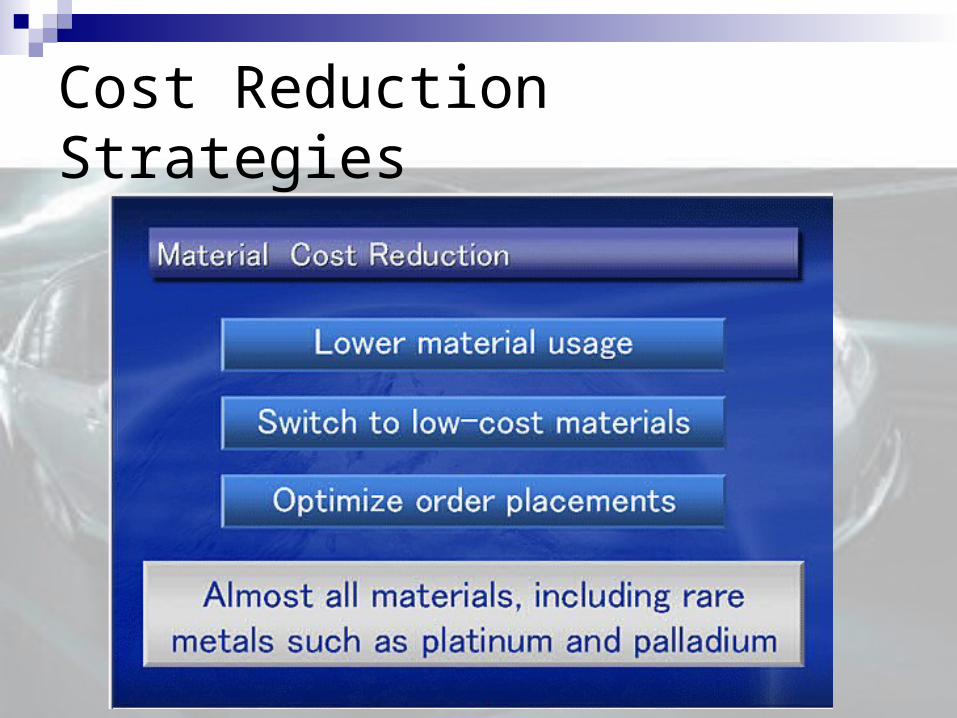
Cost Reduction Strategies
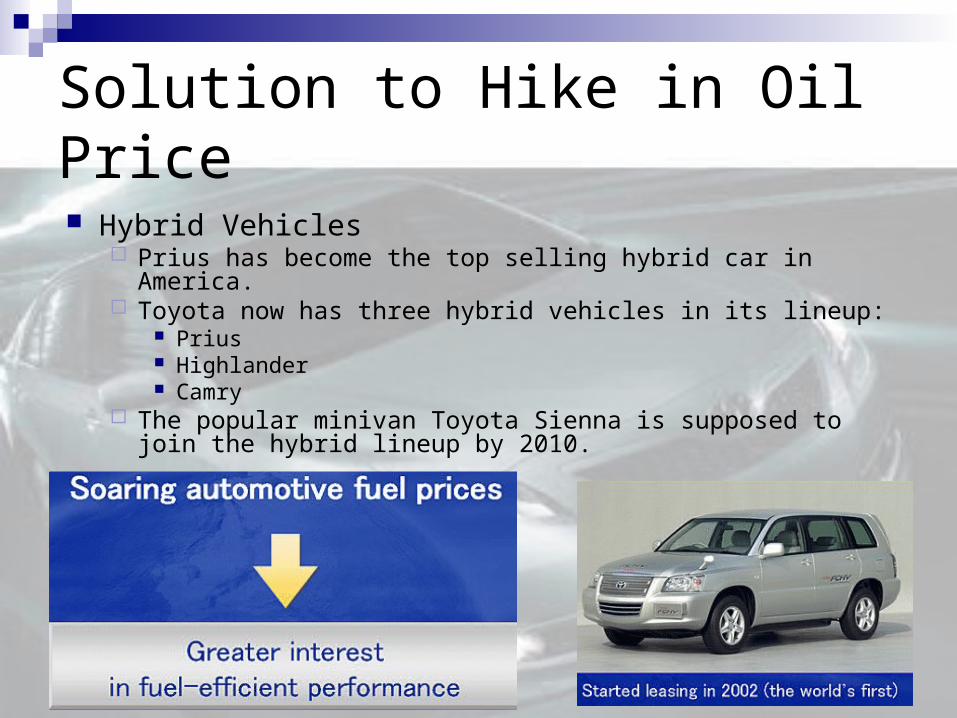
Solution to Hike in Oil Price
Hybrid Vehicles Prius has become the top selling hybrid car in America. Toyota now has three hybrid vehicles in its lineup:
Prius Highlander Camry
The popular minivan Toyota Sienna is supposed to join the hybrid lineup by 2010.
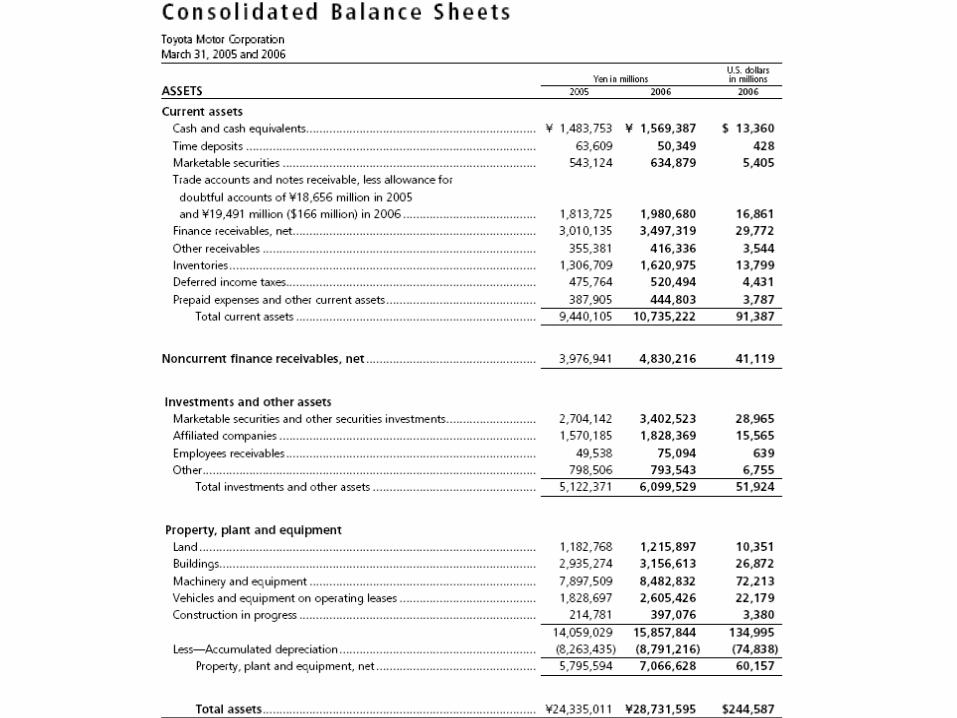
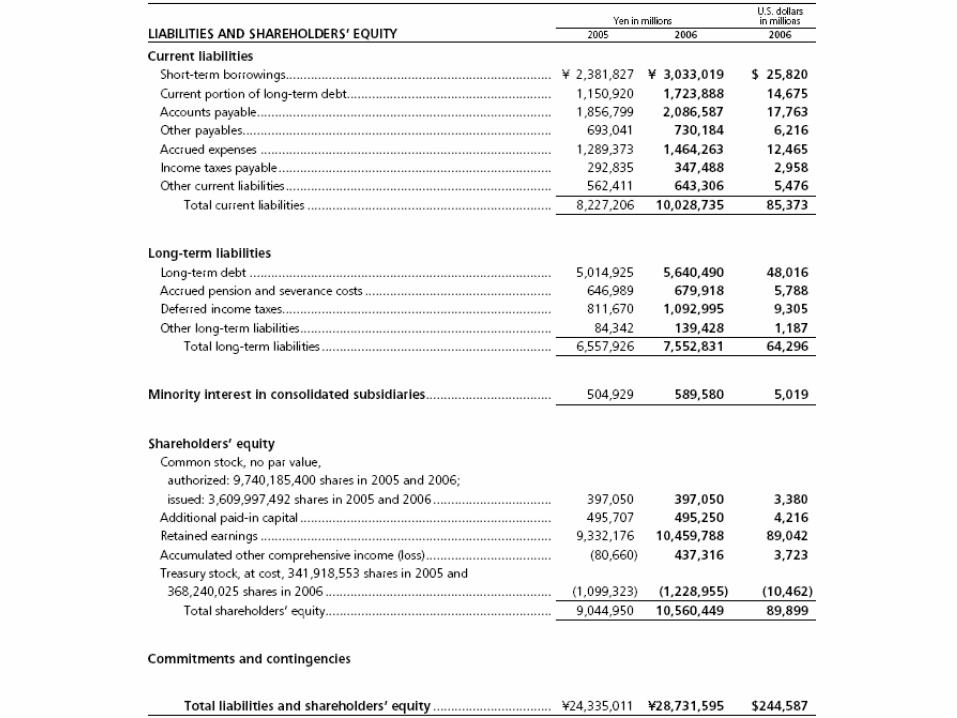
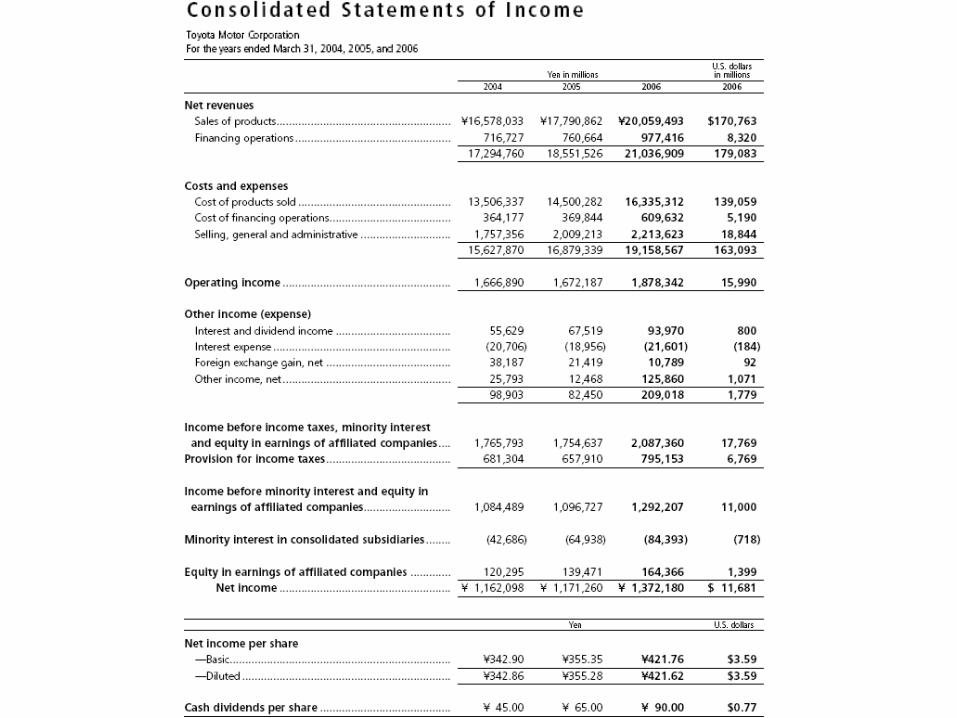
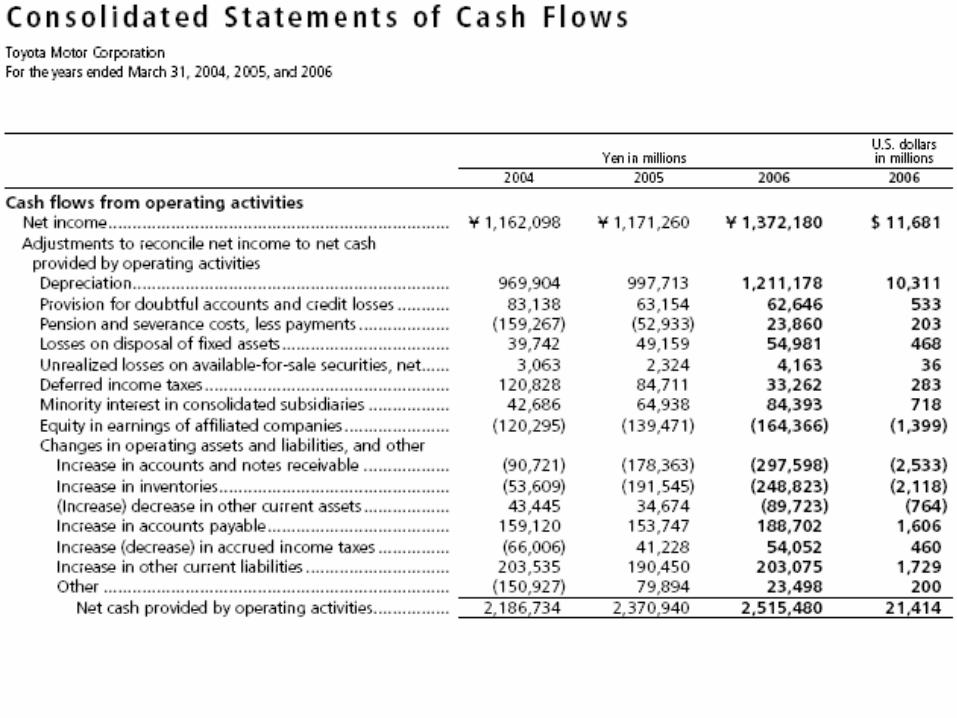
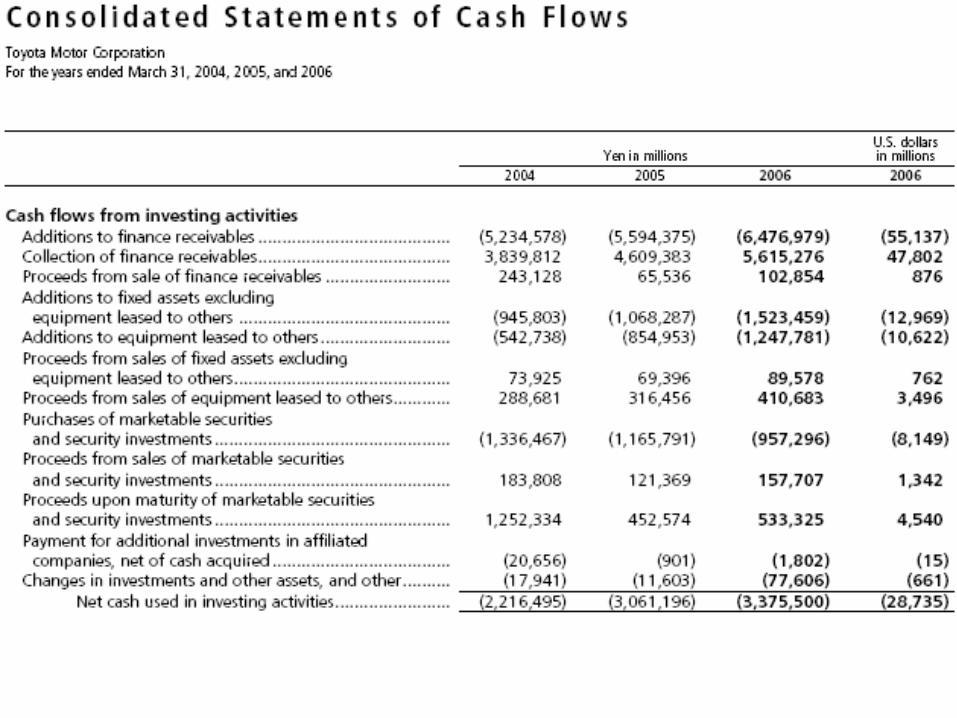
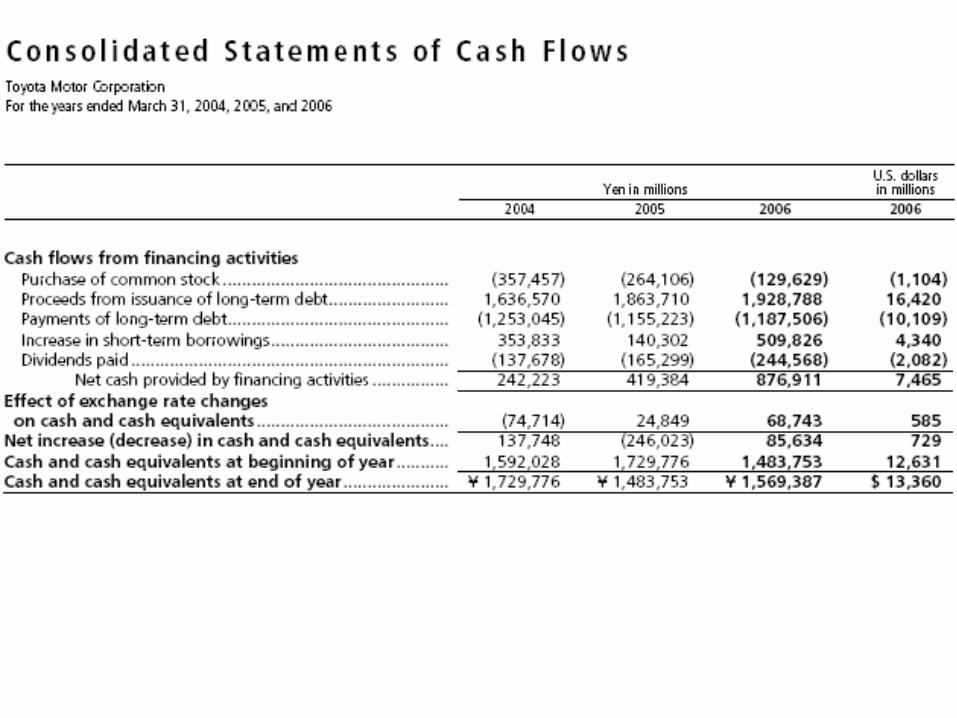
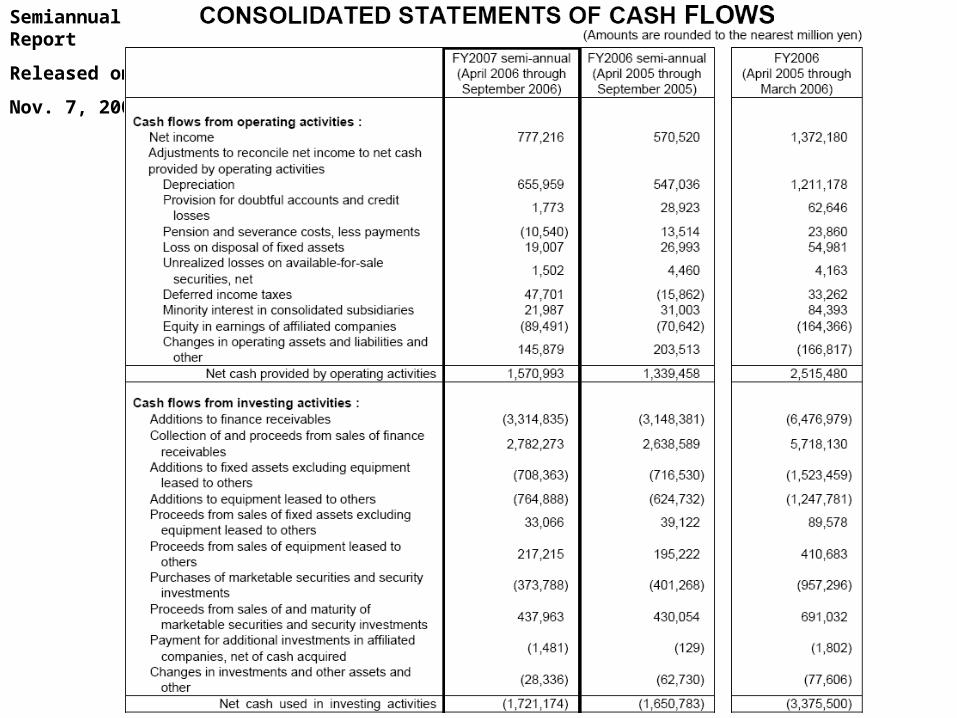
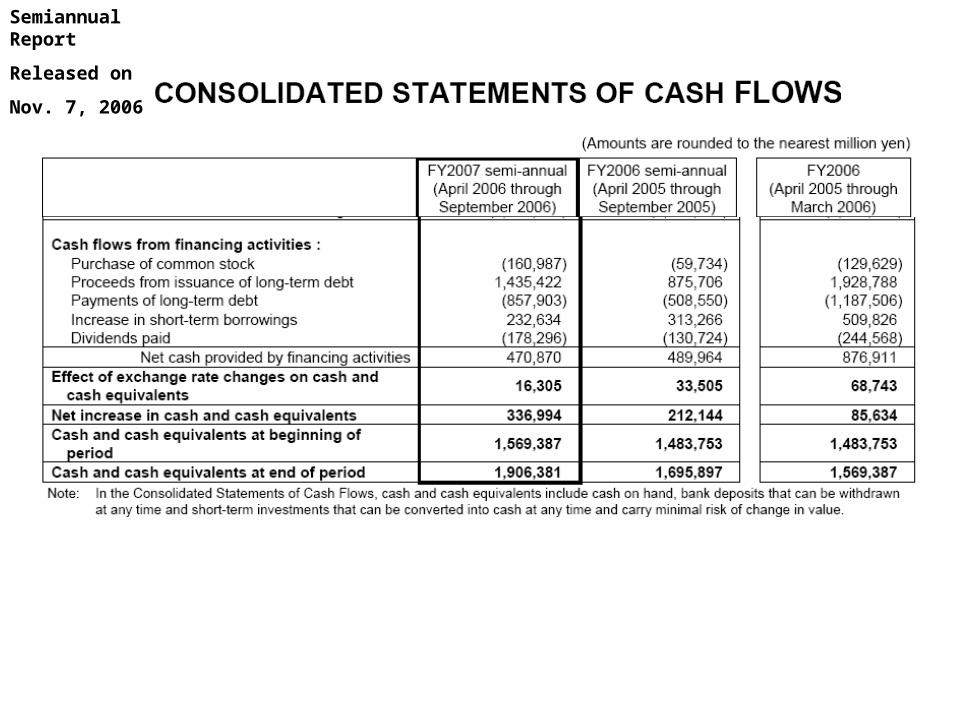
Financial Statements
Annual Balance Sheet Annual Income Statement Annual Cash Flows Statement
Semiannual Balance Sheet Semiannual Income Statement Semiannual Cash Flows Statement
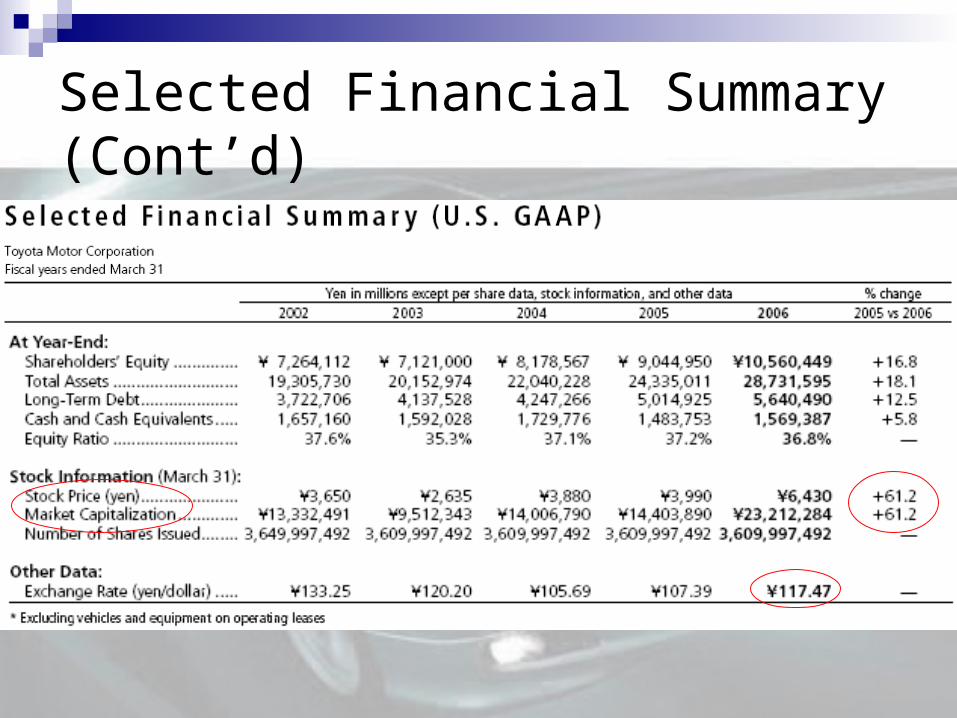
Selected Financial Summary (Cont’d)
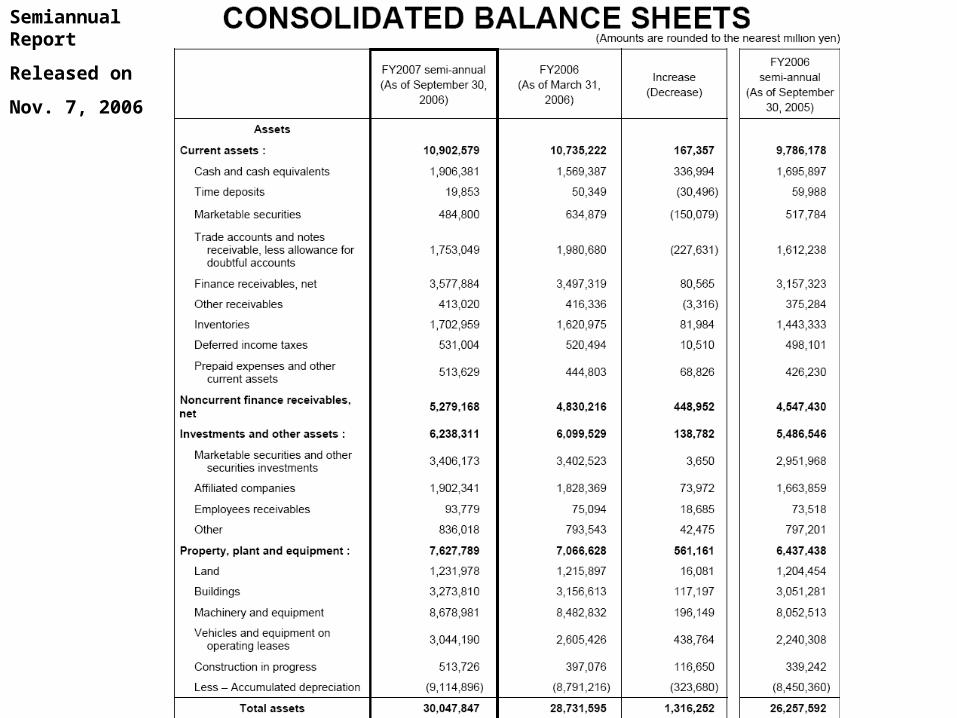
Semiannual Report
Released on
Nov. 7, 2006
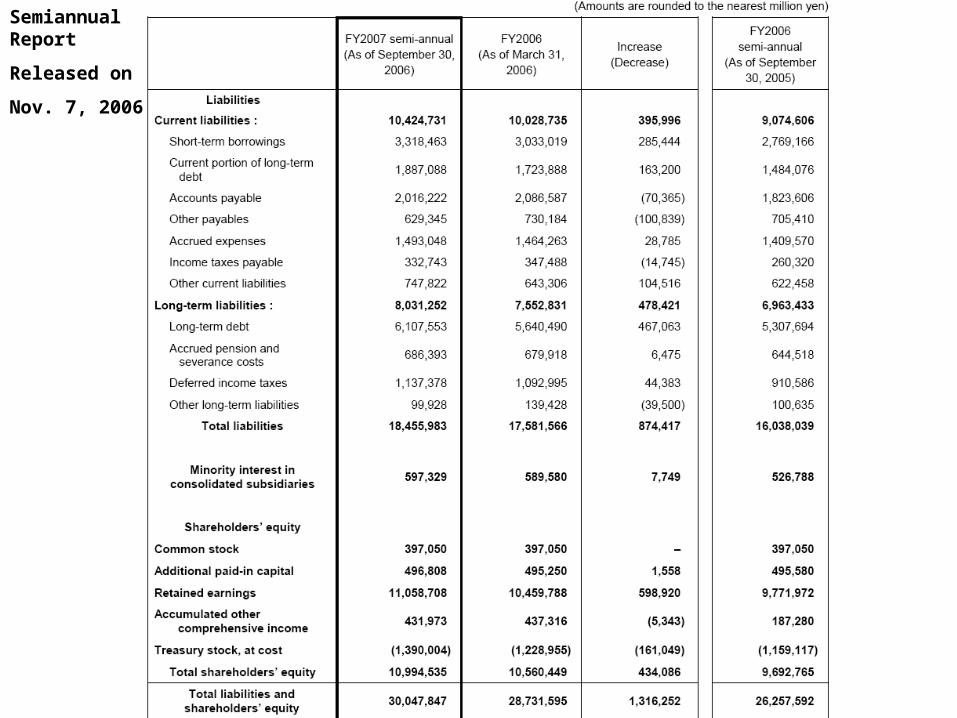
Semiannual Report
Released on
Nov. 7, 2006
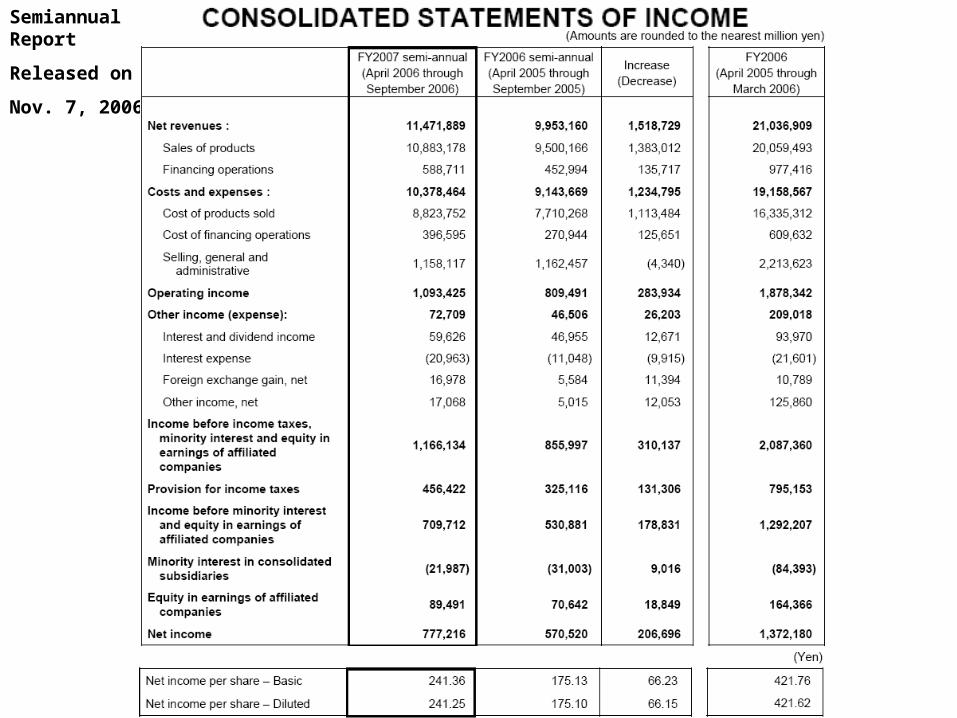
Semiannual Report
Released on
Nov. 7, 2006
Semiannual Report
Released on
Nov. 7, 2006
Semiannual Report
Released on
Nov. 7, 2006
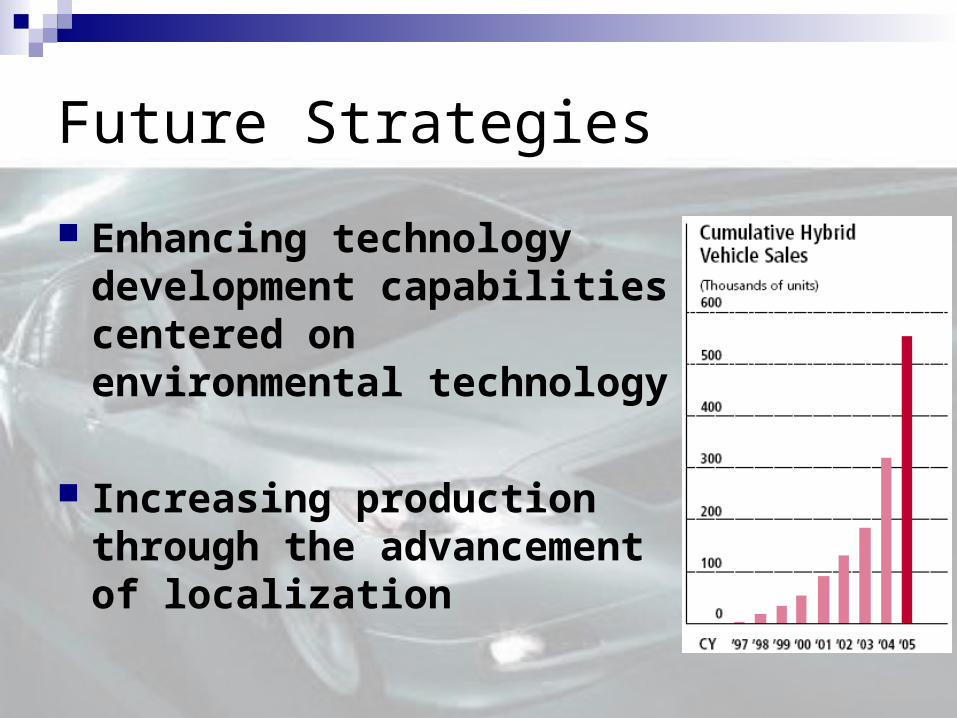
Future Strategies
Enhancing technology development capabilities centered on environmental technology
Increasing production through the advancement of localization
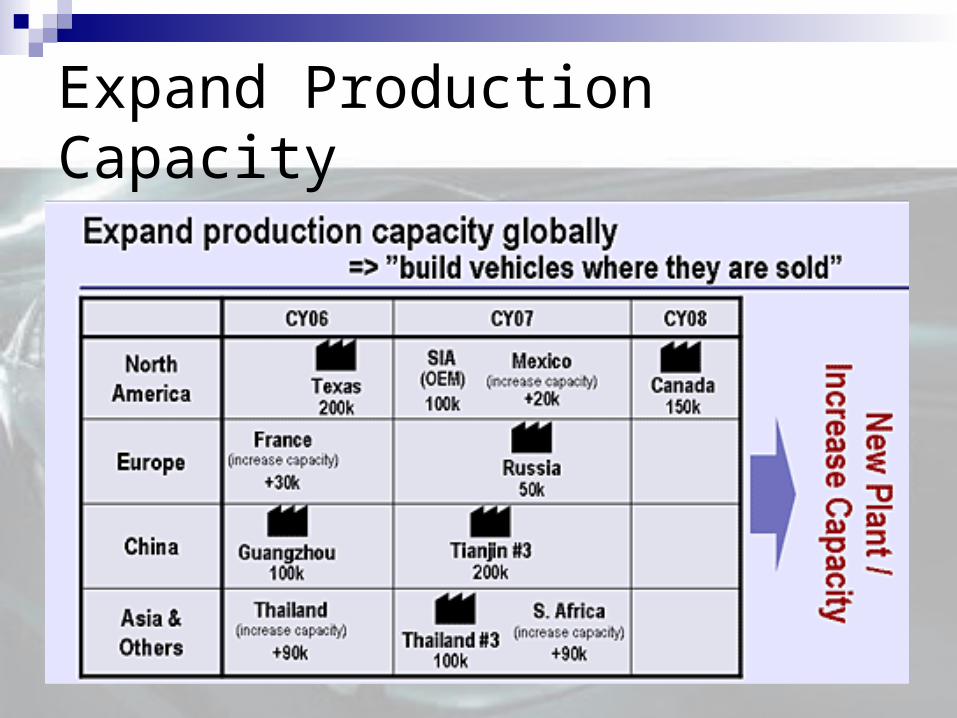
Expand Production Capacity
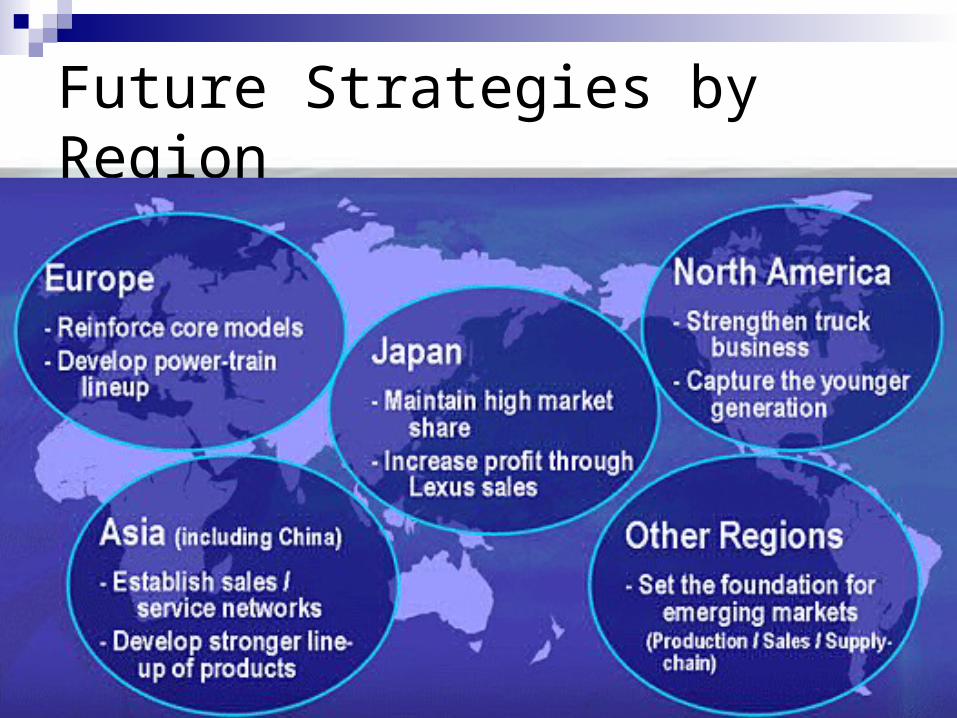
Future Strategies by Region

Recommendation
Volvo Group
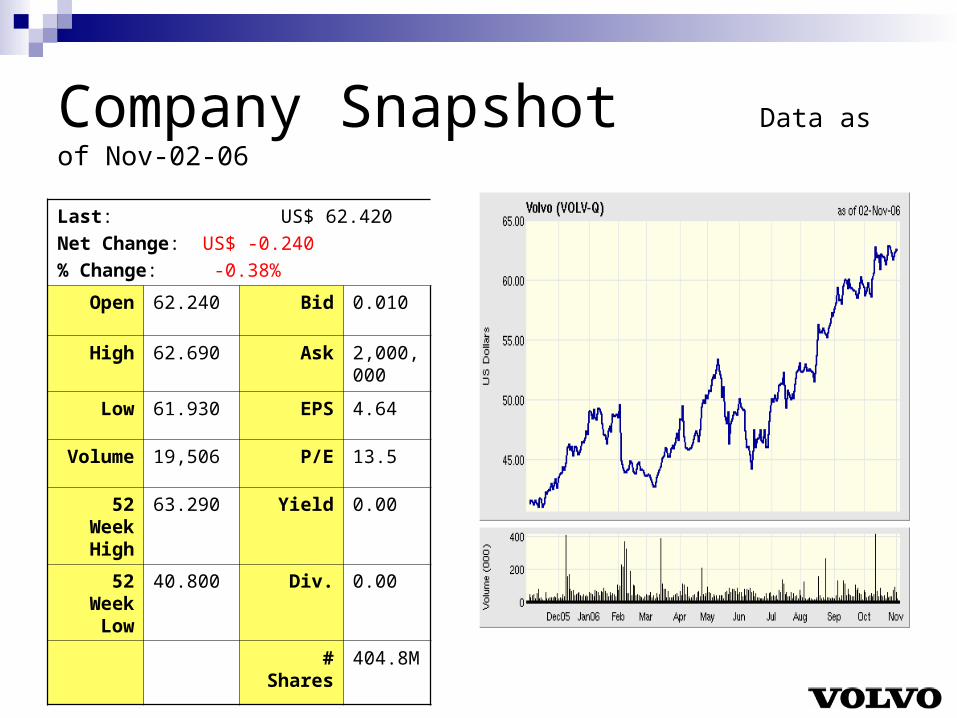
Company Snapshot Data as of Nov-02-06
Last: US$ 62.420
Net Change: US$ -0.240
% Change: -0.38%
Open 62.240 Bid 0.010
High 62.690 Ask 2,000,000
Low 61.930 EPS 4.64
Volume 19,506 P/E 13.5
52 Week High
63.290 Yield 0.00
52 Week Low
40.800 Div. 0.00
# Shares 404.8M
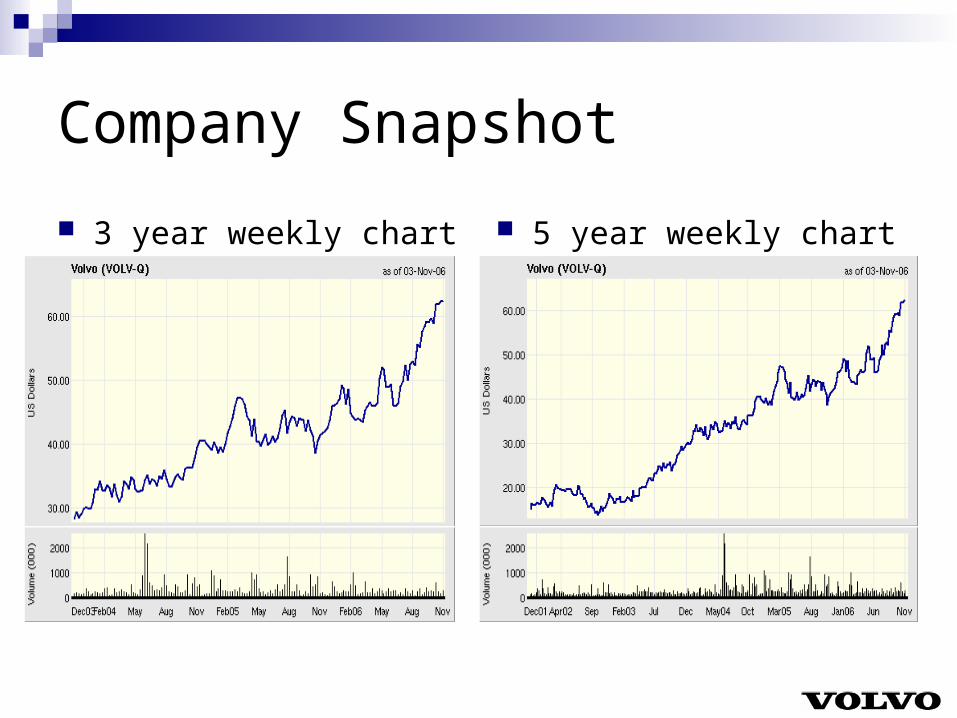
Company Snapshot
3 year weekly chart 5 year weekly chart
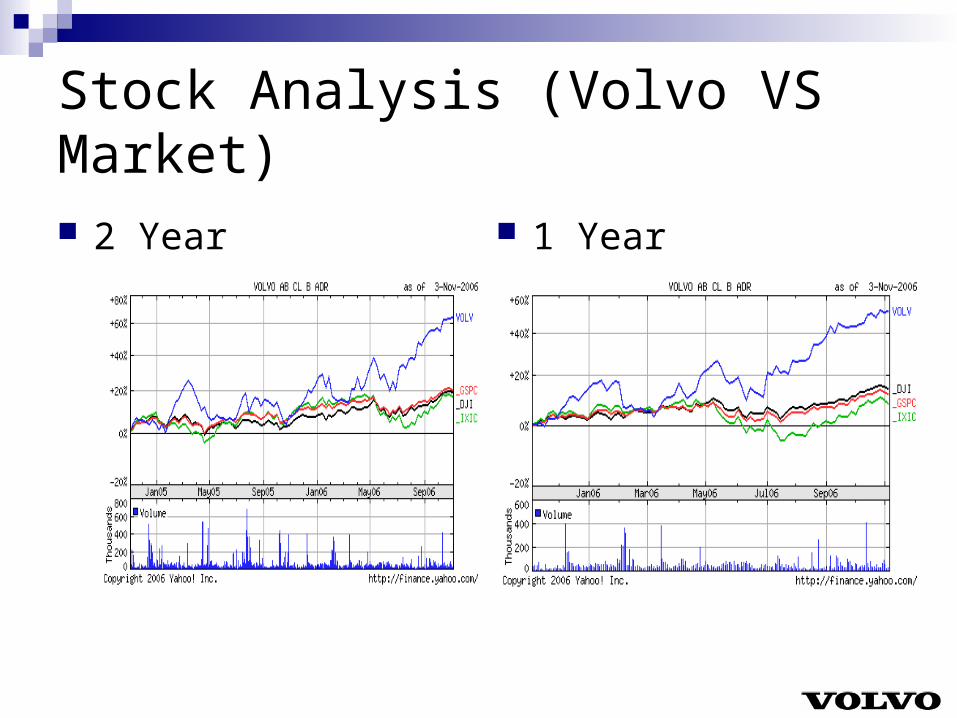
Stock Analysis (Volvo VS Market)
2 Year 1 Year
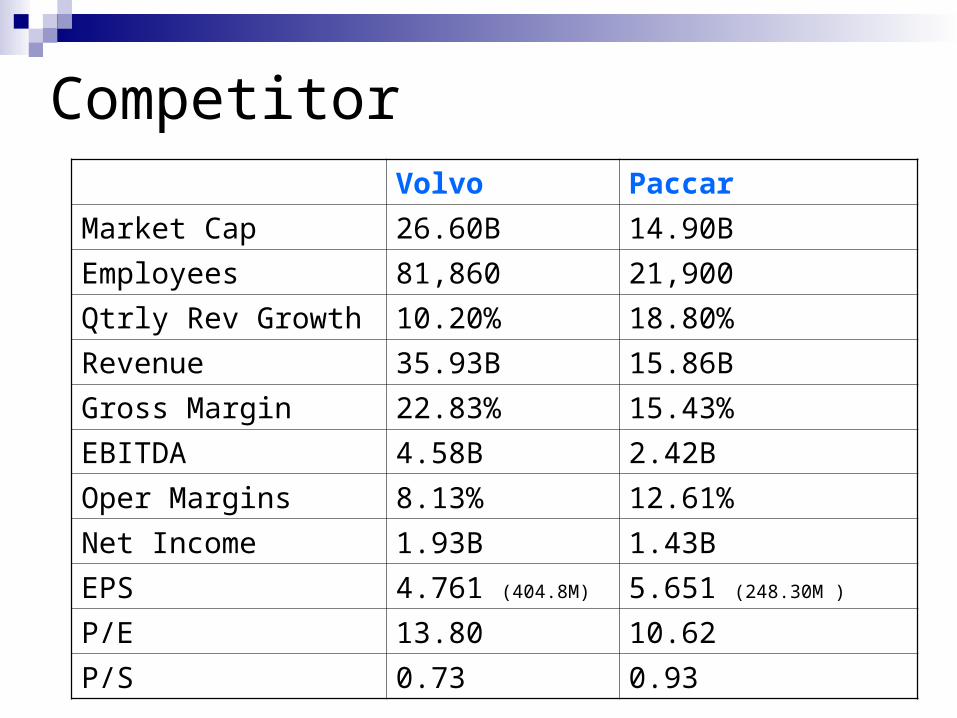
CompetitorVolvo Paccar
Market Cap 26.60B 14.90B
Employ ees 81,860 21,900
Qtrly Rev Growth 10.20% 18.80%
Revenue 35.93B 15.86B
Gross Margin 22.83% 15.43%
EBITDA 4.58B 2.42B
Oper Margins 8.13% 12.61%
Net Income 1.93B 1.43B
EPS 4.761 (404.8M) 5.651 (248.30M )
P/E 13.80 10.62
P/S 0.73 0.93
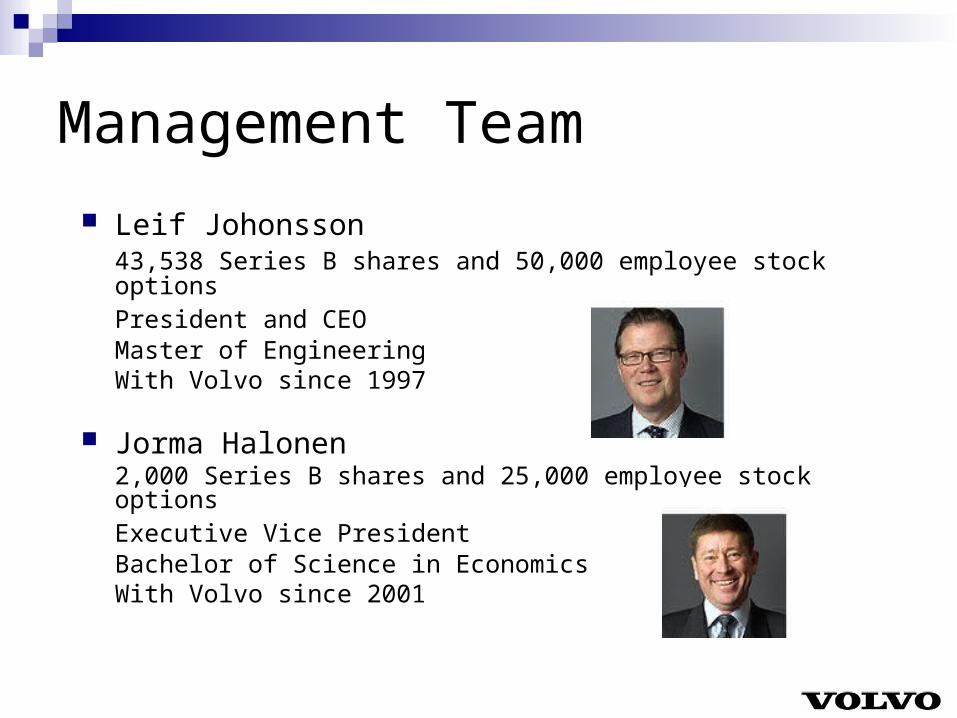
Management Team
Leif Johonsson 43,538 Series B shares and 50,000 employee stock options
President and CEOMaster of EngineeringWith Volvo since 1997
Jorma Halonen 2,000 Series B shares and 25,000 employee stock optionsExecutive Vice PresidentBachelor of Science in Economics With Volvo since 2001
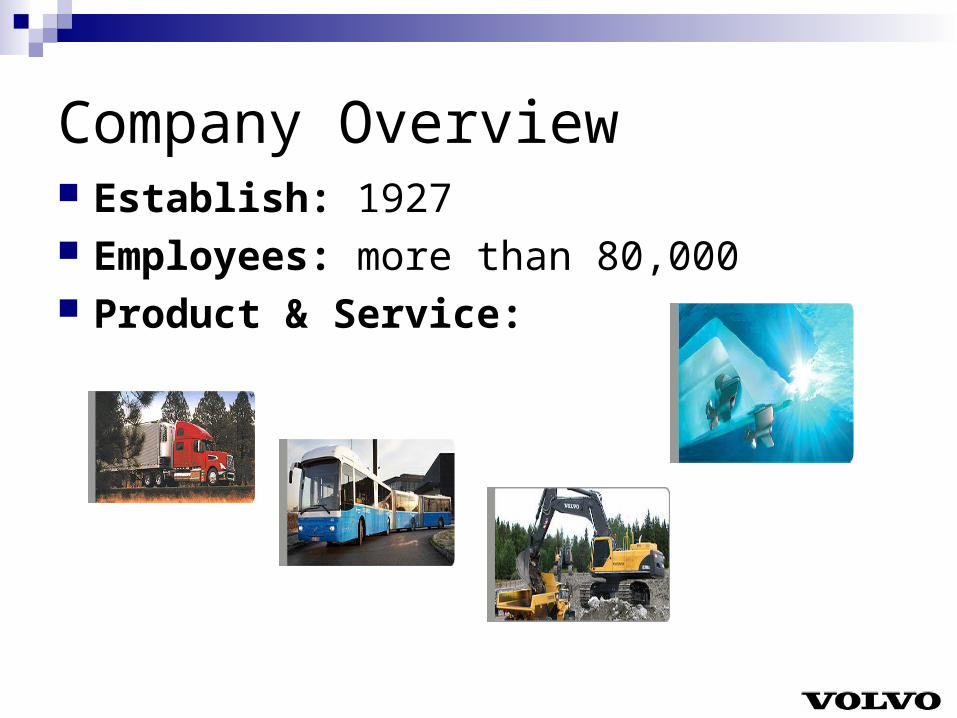
Company Overview Establish: 1927 Employees: more than 80,000 Product & Service:
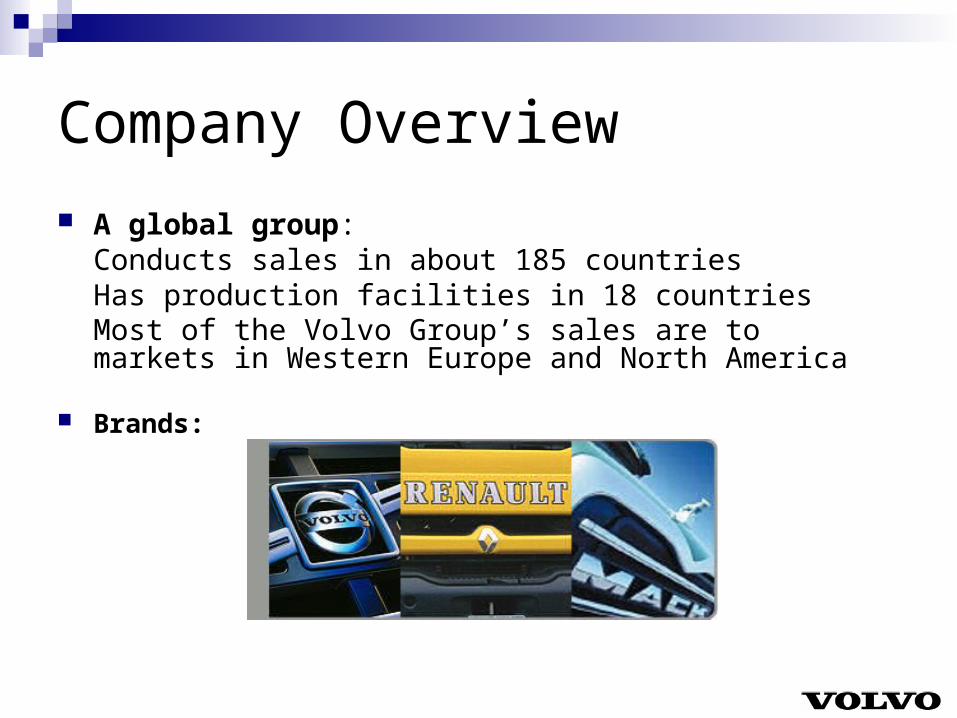
Company Overview
A global group: Conducts sales in about 185 countries
Has production facilities in 18 countries Most of the Volvo Group’s sales are to markets in Western Europe and North America
Brands:
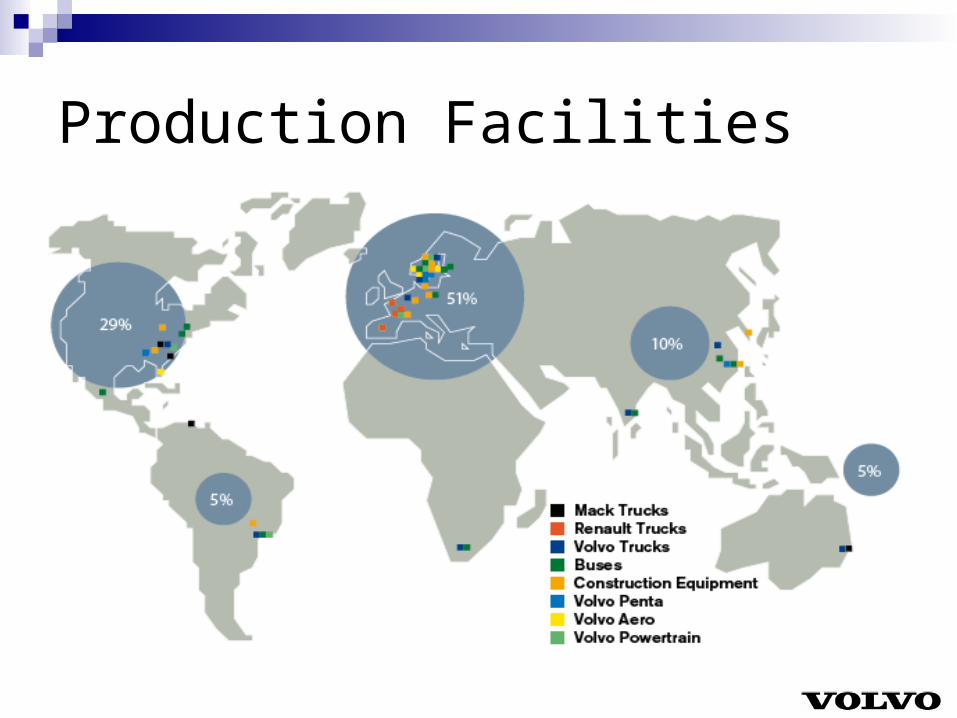
Production Facilities
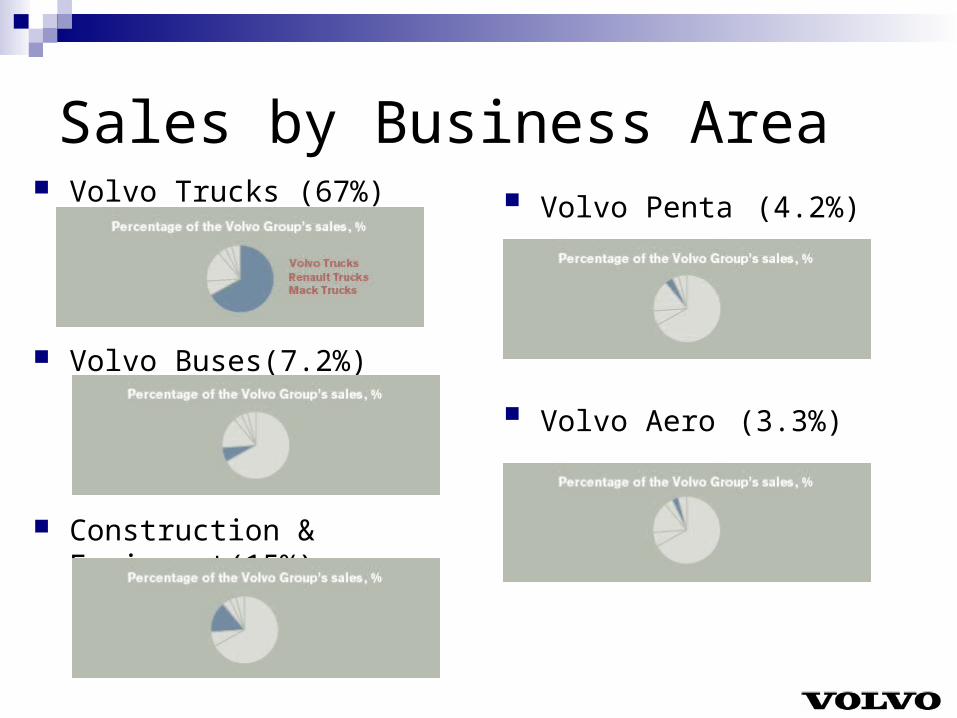
Sales by Business Area Volvo Trucks (67%)
Volvo Buses(7.2%)
Construction & Equipment(15%)
Volvo Penta (4.2%)
Volvo Aero (3.3%)
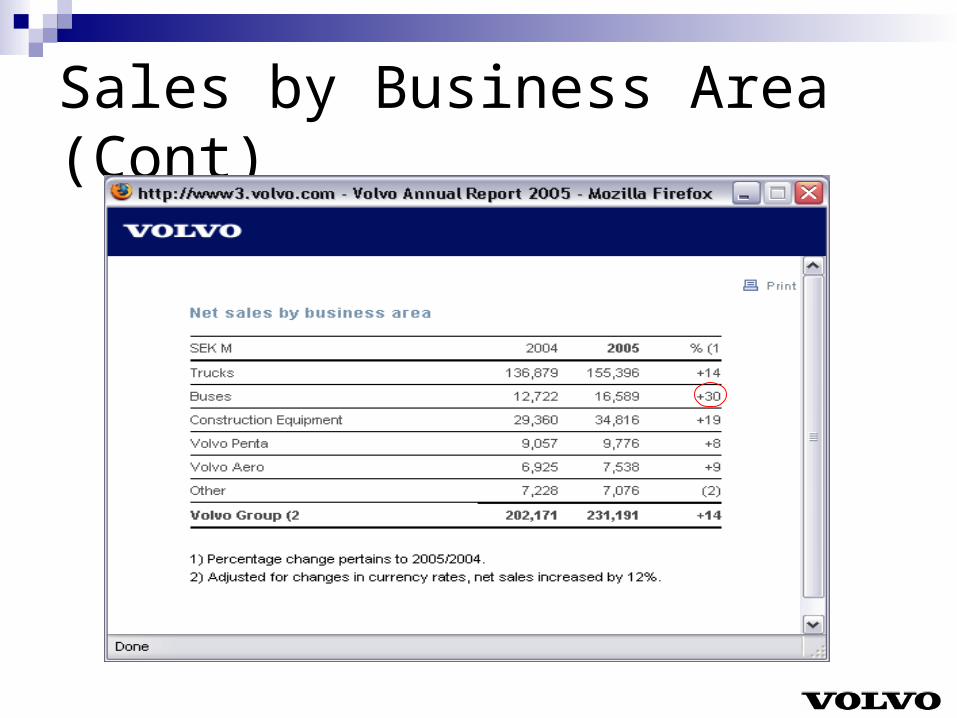
Sales by Business Area (Cont)
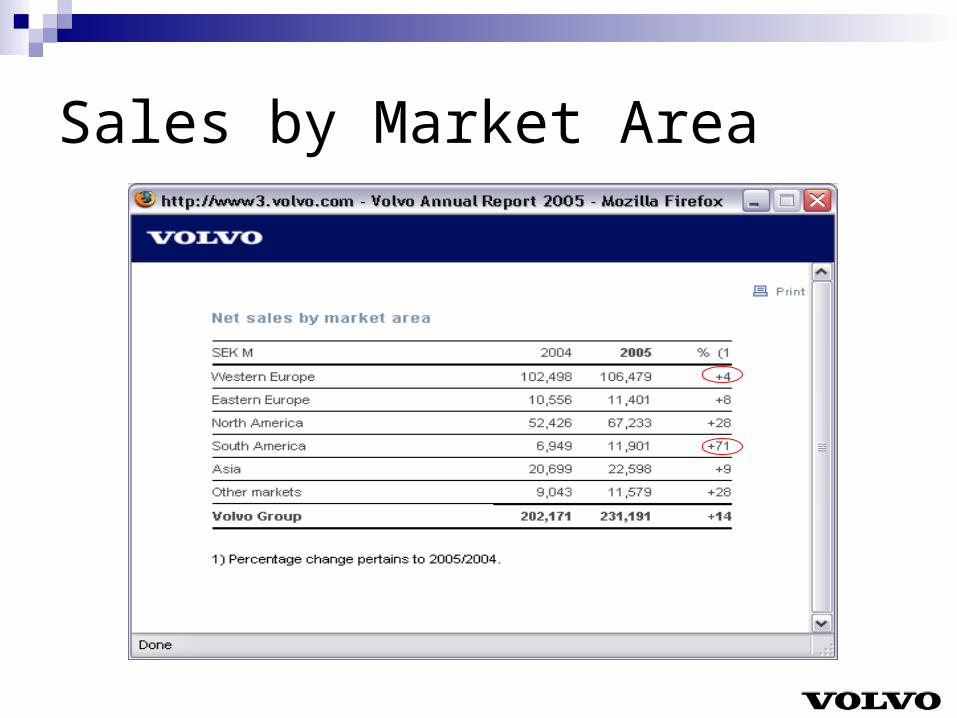
Sales by Market Area
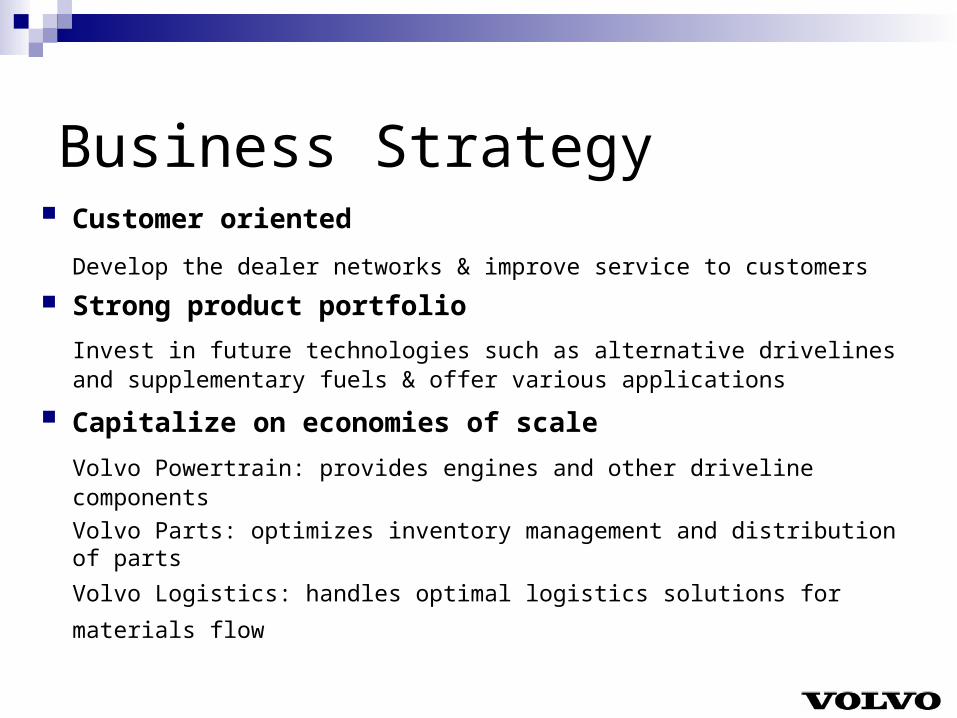
Business Strategy Customer oriented
Develop the dealer networks & improve service to customers Strong product portfolio
Invest in future technologies such as alternative drivelines and supplementary fuels & offer various applications
Capitalize on economies of scale Volvo Powertrain: provides engines and other driveline components
Volvo Parts: optimizes inventory management and distribution of parts
Volvo Logistics: handles optimal logistics solutions for materials flow
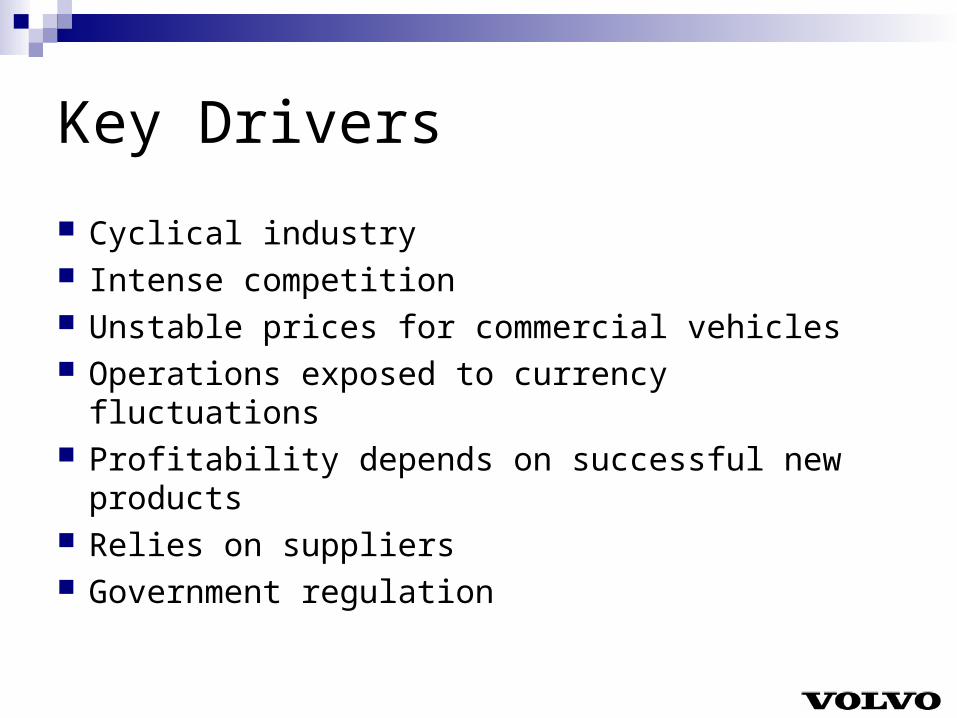
Key Drivers
Cyclical industry Intense competition Unstable prices for commercial vehicles Operations exposed to currency fluctuations Profitability depends on successful new products Relies on suppliers Government regulation
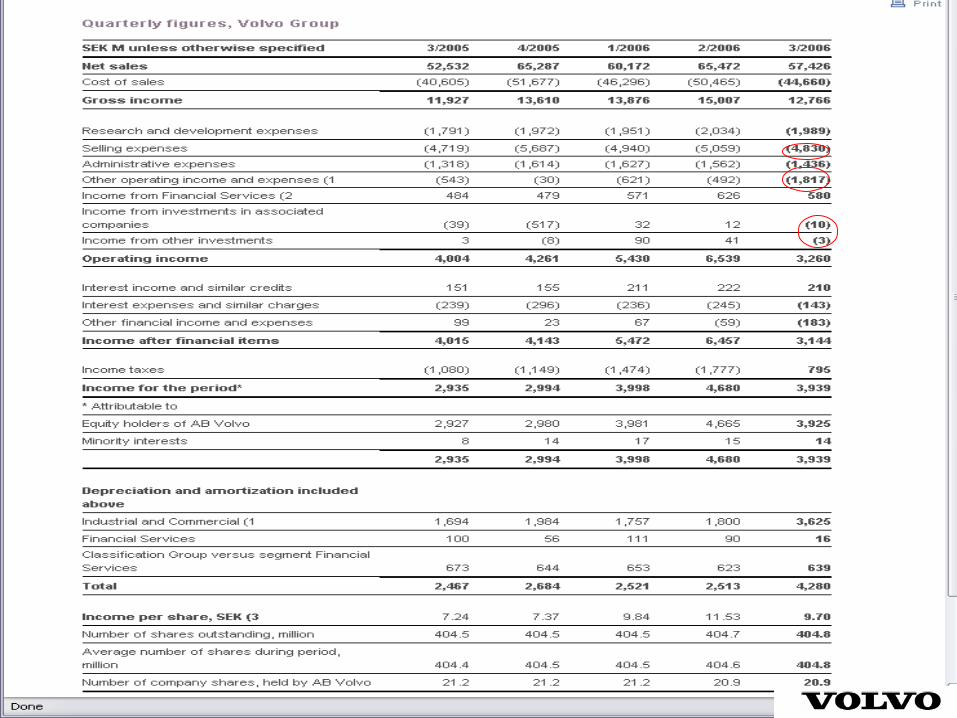
Quarterly Income Statement
3/2005 – 3/2006
(1 SEK=0.1398 USD)
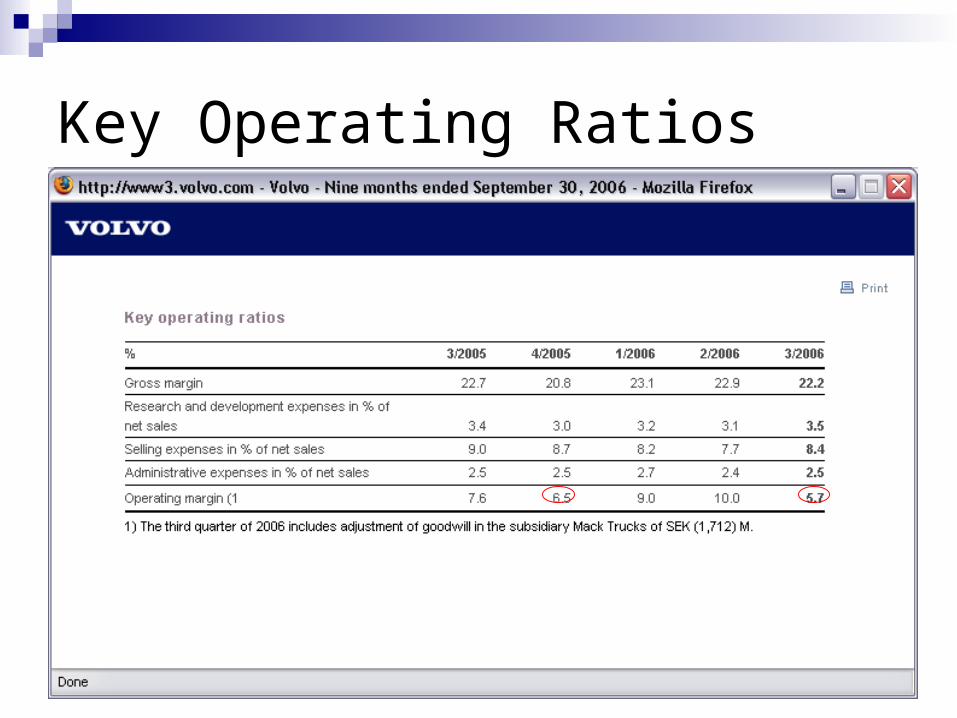
Key Operating Ratios
Nine Month Ended Report
Sep 30 2006
(1 SEK=0.1398 USD)
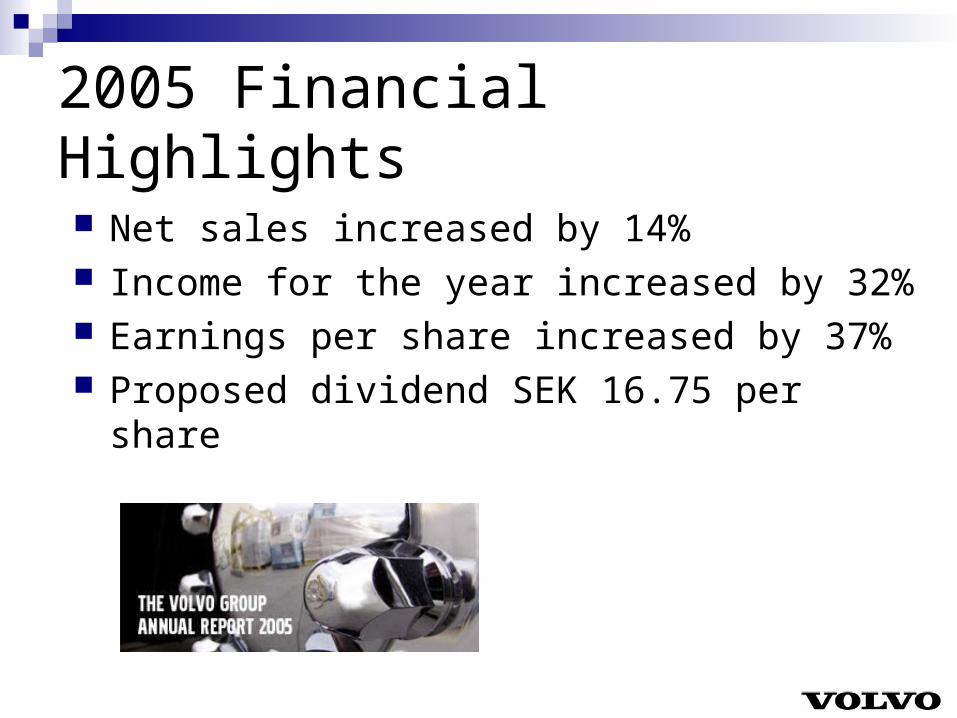
2005 Financial Highlights
Net sales increased by 14% Income for the year increased by 32% Earnings per share increased by 37% Proposed dividend SEK 16.75 per share
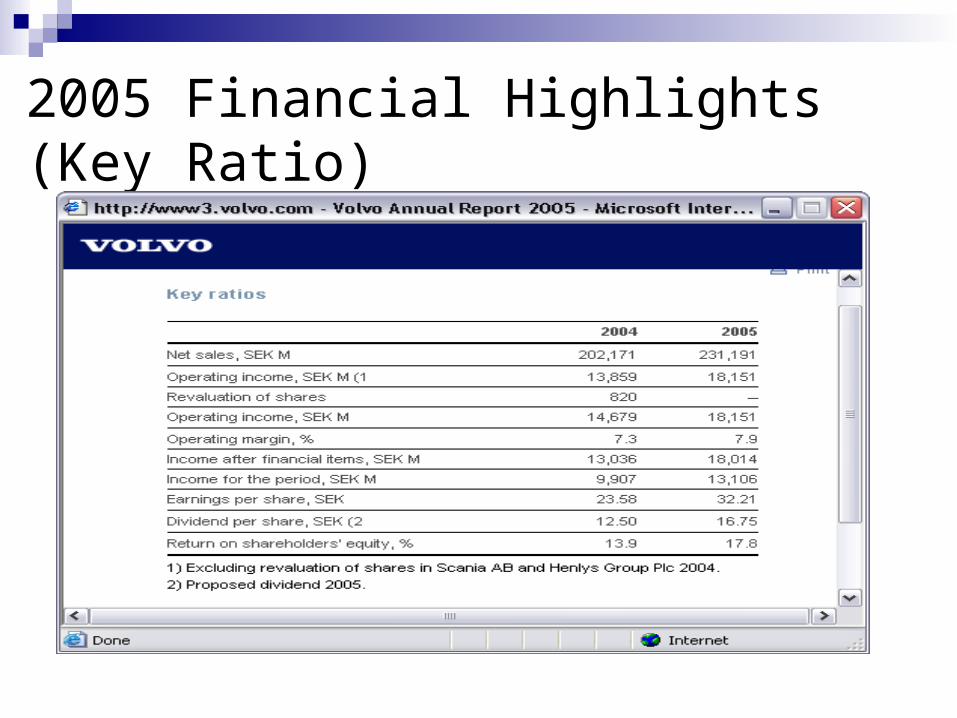
2005 Financial Highlights (Key Ratio)
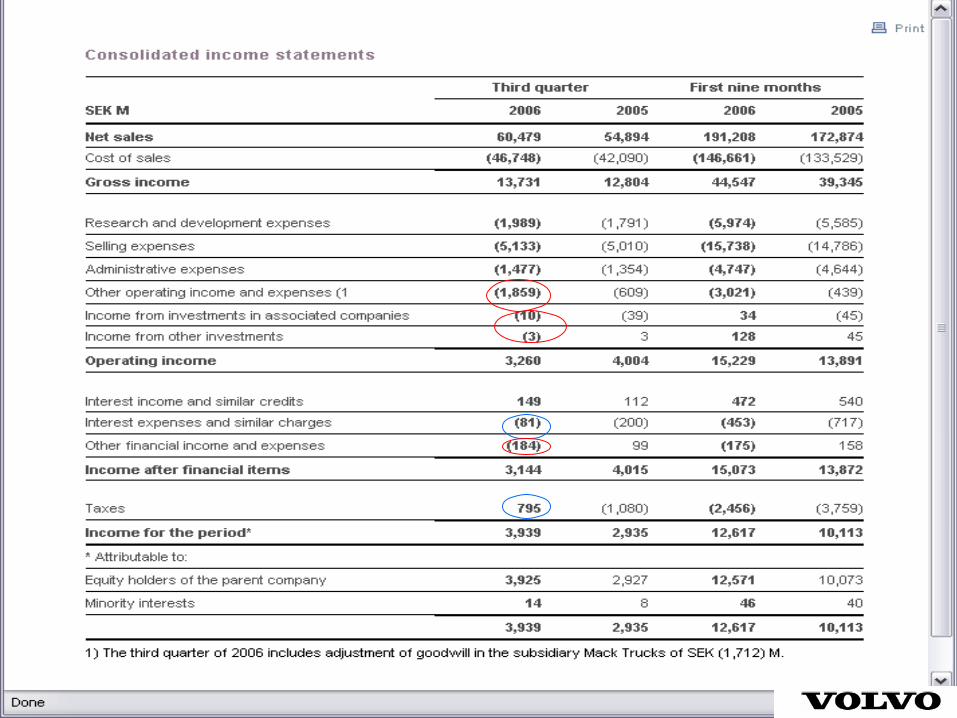
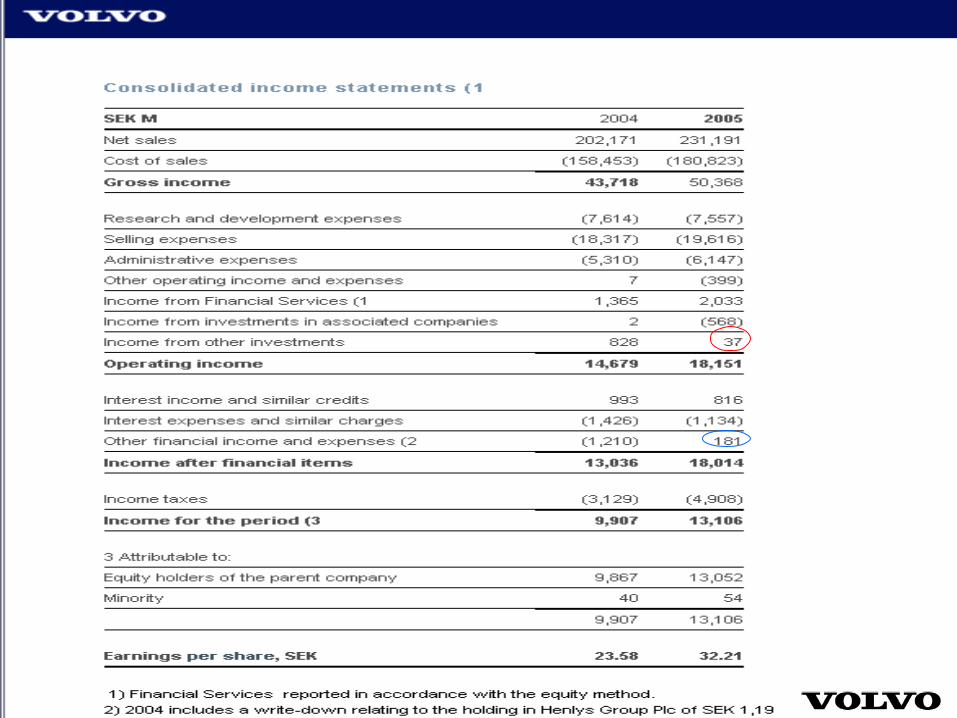
Consolidated Income Statement
(1 SEK=0.1398 USD)
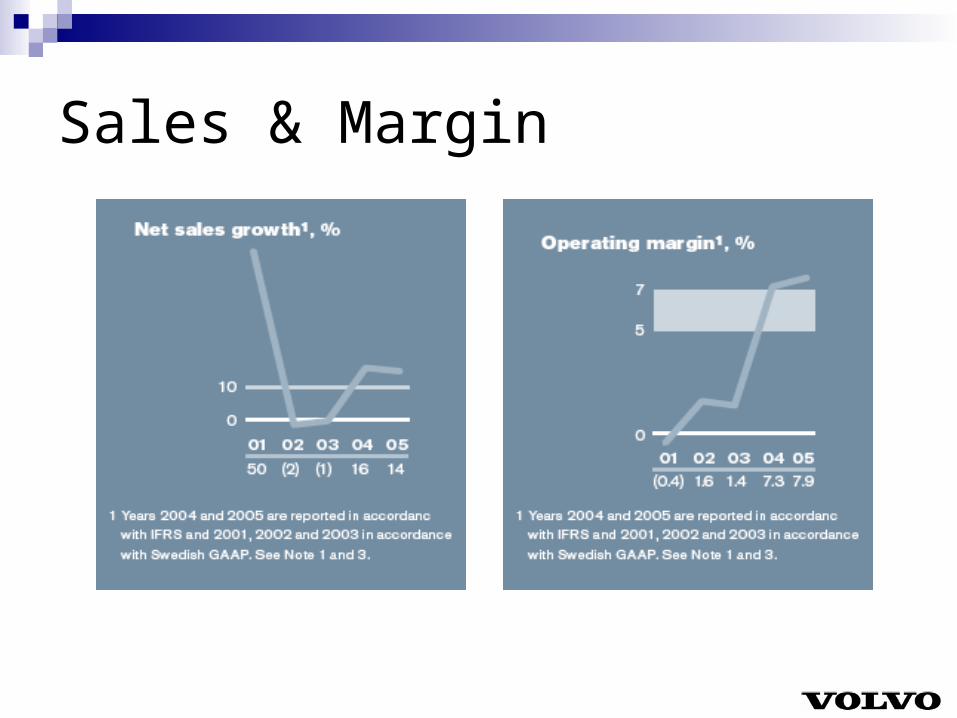
Sales & Margin
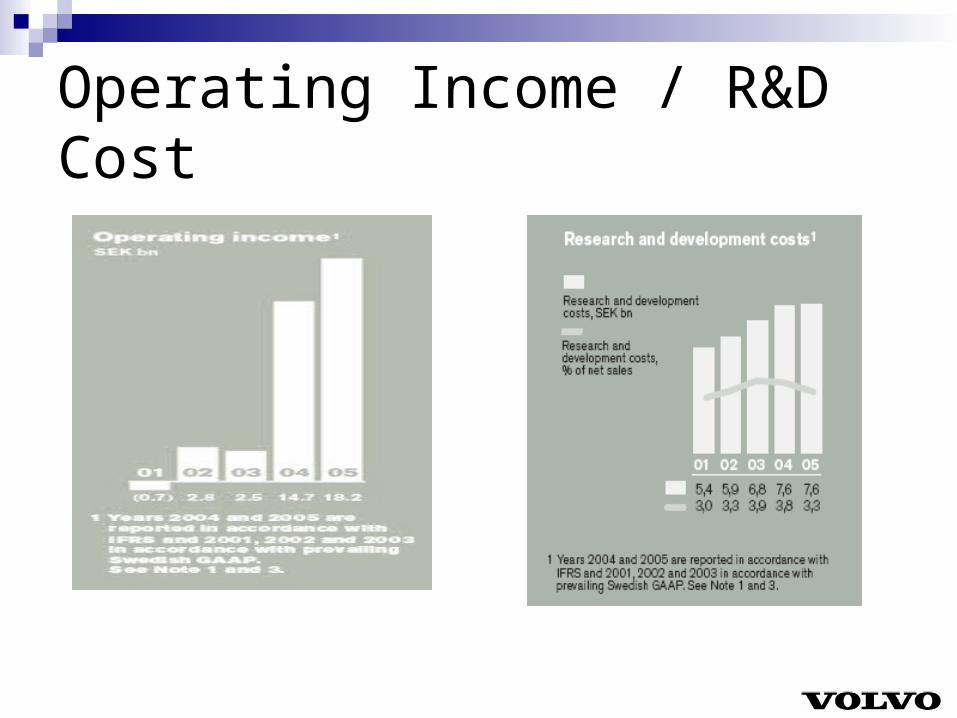
Operating Income / R&D Cost
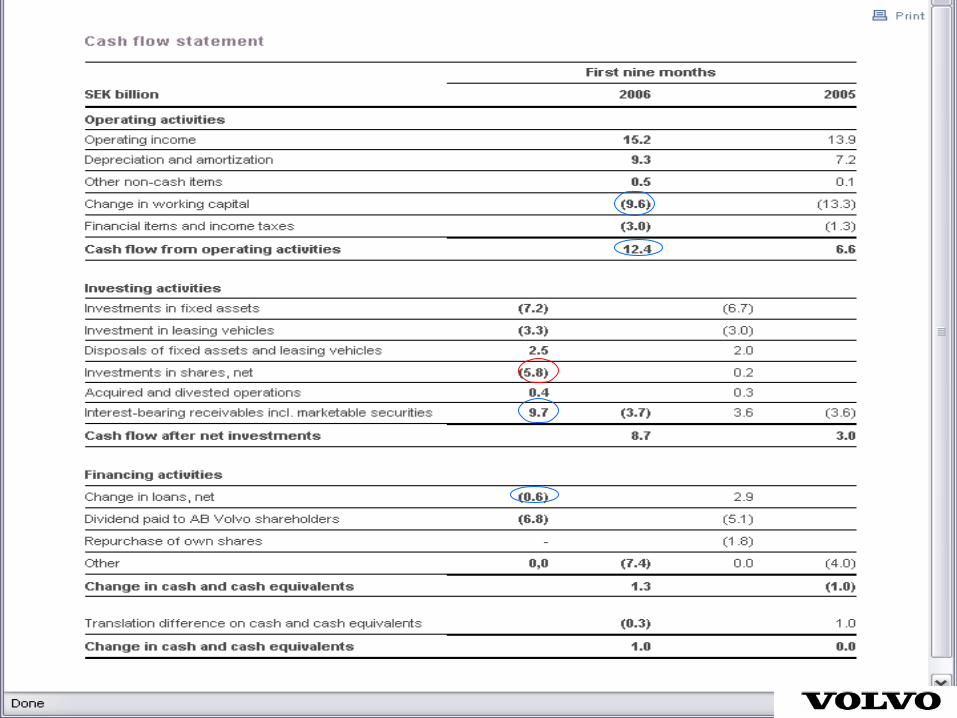
Consolidated Cash Flow Statement
(1 SEK=0.1398 USD)
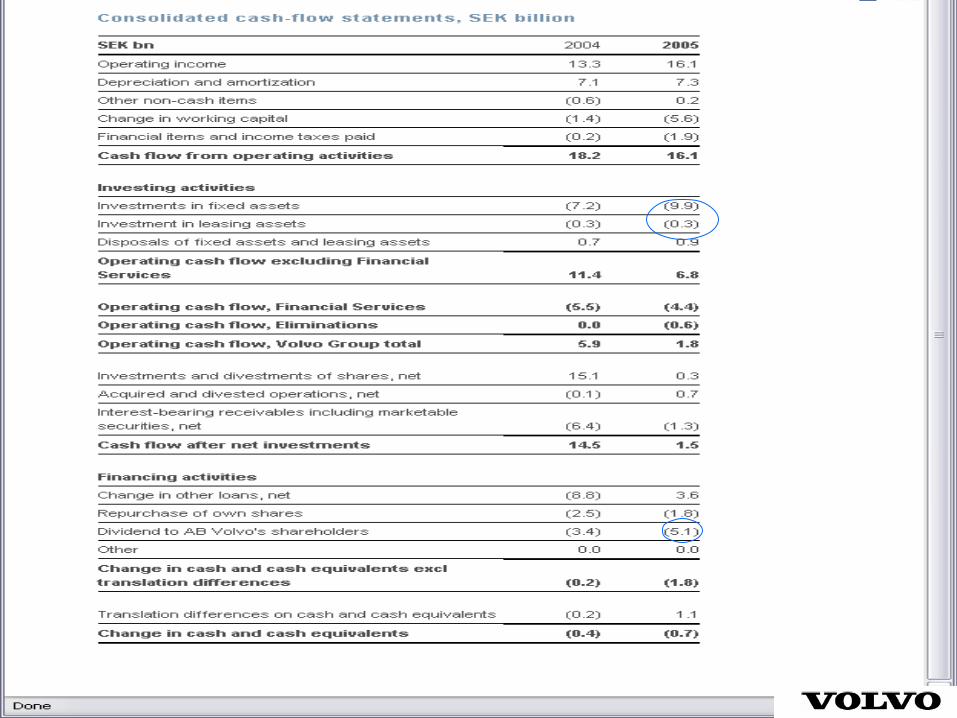
Cash Flow Statement 2005
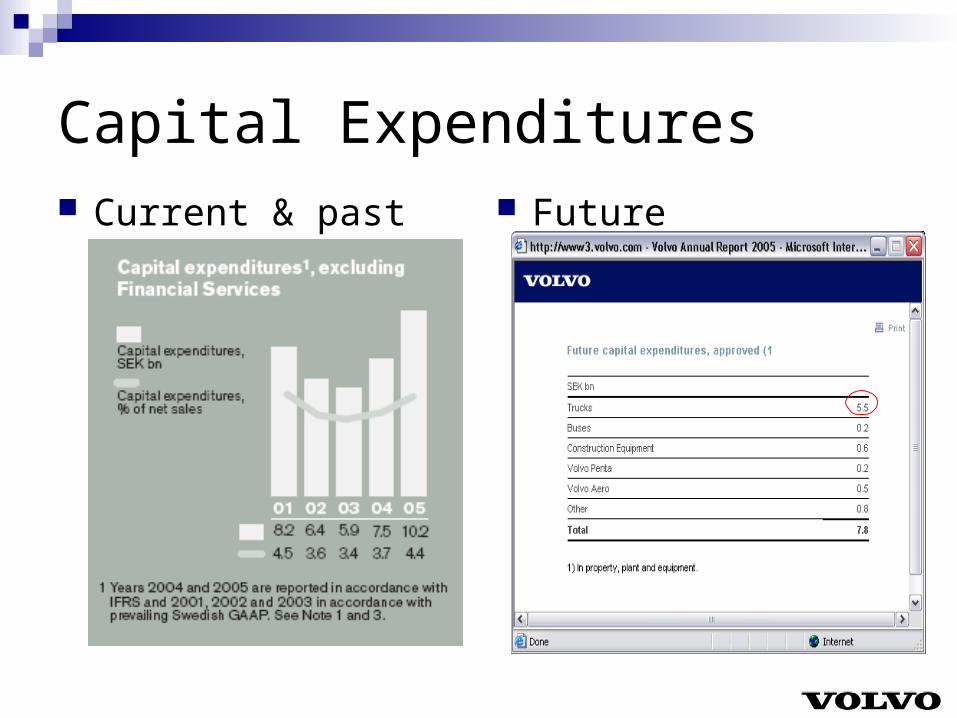
Capital Expenditures Current & past Future
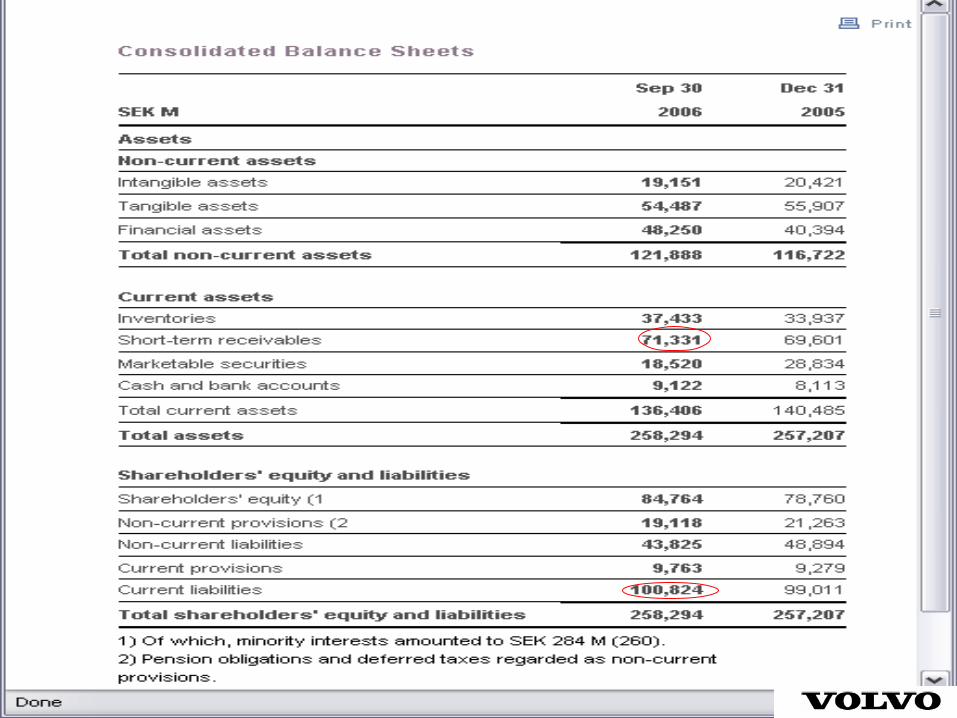
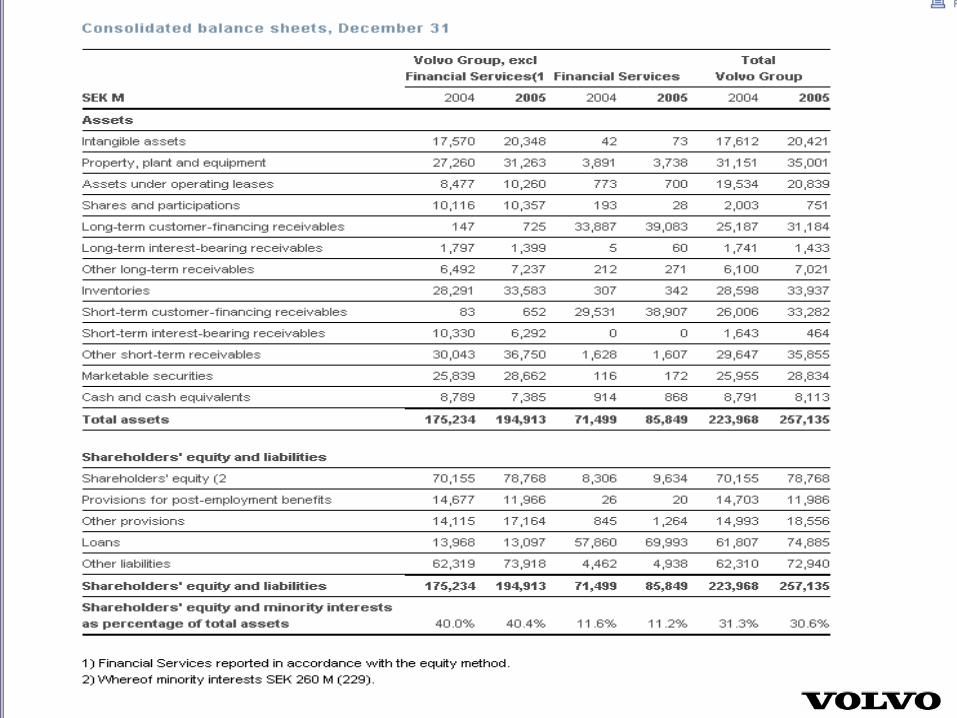
Consolidated Balance Sheet
(1 SEK=0.1398 USD)
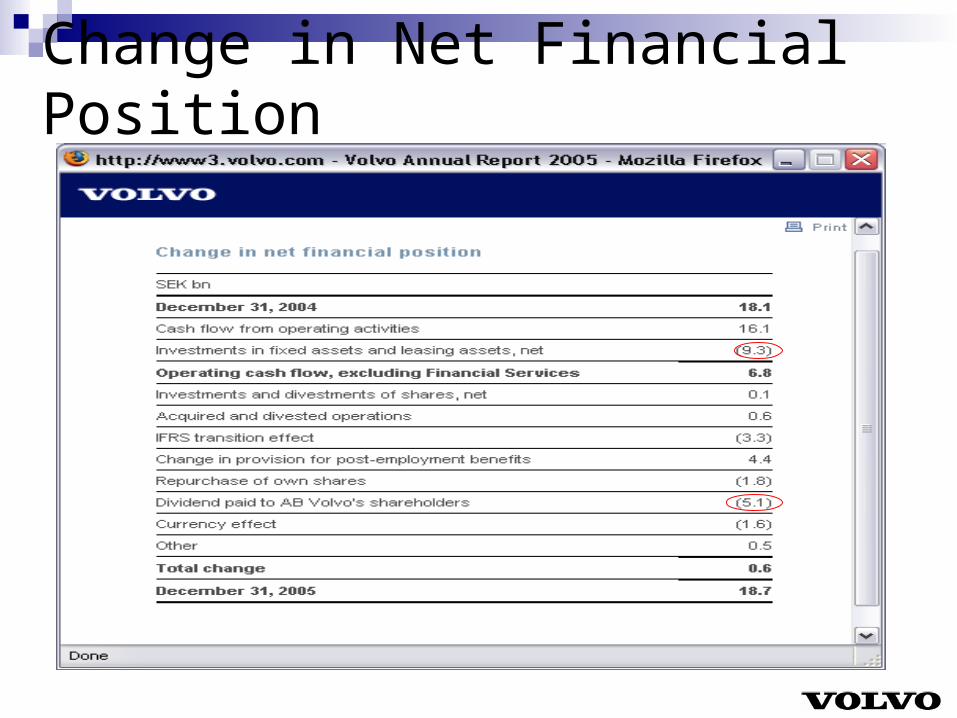
Change in Net Financial Position
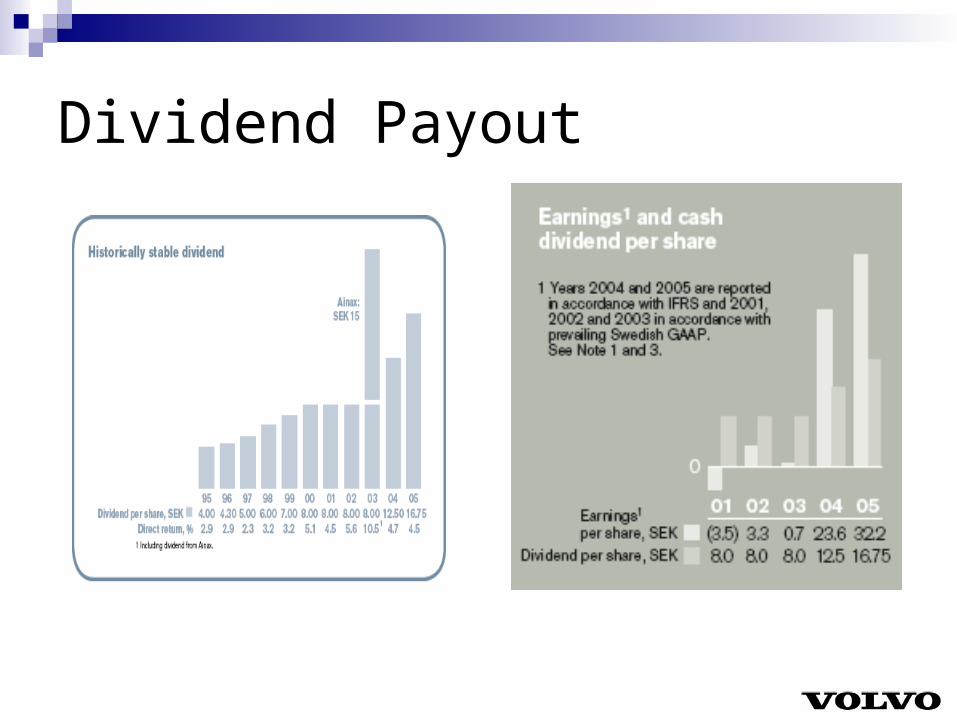
Dividend Payout
Recent News Strategic decision on closure of Volvo Aero’s
operations in Bromma Volvo initiates a Traffic Accident Research Centre
in China Volvo Aero Norway to be supplier to the
General Electric Engine for the Joint Strike Fighter
Volvo Trucks laying off 600 at Powertrain Plant in Hagerstown
Volvo Aero expands in US
Recent News (cont)
Volvo Construction Equipment invests in China Plans bus body cooperation in India
AB Volvo increases its holding in Nissan Diesel