Embed Size (px)
Citation preview

Global Climate Change: What Controversies?Bryan C. Weare
Atmospheric Science Program University of California, Davis


IPCC Fourth Assessment
Reports

Is the Global Temperature Really Increasing or is it Just “Cyclical”?

Global Temperature Changes Over the past 250 Years

Global Temperature Changes Over the past 1200 Years

November to March Surface Temperature Trends

Temperature Records Have Problems: Is There Other Evidence?


One of the most important aspects of climate change for
California is the impact on Snow Water Storage
Less snow, more rain in winter means:
1. More flooding in winter
2. Less water in reservoirs in summer for agriculture and cities

During the past 50 years peak spring stream flow has gotten earlier in the
season
CHANGES IN SNOWMELT RUNOFF TIMINGIN WESTERN NORTH AMERICA UNDER A ‘BUSINESS AS USUAL’CLIMATE CHANGE SCENARIOIRIS T. STEWART1, DANIEL R. CAYAN1, 2 and MICHAEL D. DETTINGER
More Rain and/or Earlier Melting Snow
October December April June
100
50
0
River Flow


Is the Global Temperature Tied to Human Activity or “Natural”?

Global climate is primarily controlled by the earth’s radiation budget

Human Climate Forcing ParametersCarbon Dioxide- increases primarily
from fossil fuel burning, deforestation
Methane- increases primarily from
intensive agriculture, poor natural gas
production practices
Nitrous Oxide- increases primarily
from vehicles, agriculture
Sulfur Aerosols (dust)- changes
primarily from volcanoes, fossil fuel
(coal) burning

Human Contribution to Climate Forcing in the Past 100 Years

But it’s the Sun, isn’t it?


Predictions for the Future Are Based on Models: Why Can We Trust Them?

©IPCC AR4 and BCW
4. Global Climate Models

How are these Model Verified?Comparisons of Means with Observations: Surface Temperature
©IPCC AR4

Comparisons of Means with
Observations: Precipitation
©IPCC AR4

Putting it All TogetherPutting it All Together
Climate models often Climate models often test their skill by test their skill by hind hind castingcasting observed observed climate from 1860 to climate from 1860 to the present.the present.
As the model As the model sophistication sophistication increases to include increases to include greenhouse gasses, greenhouse gasses, aerosols, and changes aerosols, and changes in solar radiation the in solar radiation the model has improved model has improved prediction.prediction.

What Do These Models Say About the Future?

Projecting Future Climate

Rapid riseModerate rise
Slow rise, then decline


Multi-Model Prediction

Future projections are for earlier steam flows

Future projections indicate less snow in April

“The message for the general public should be that this is a real problem, that climate change is happening.
It's projected to occur at a rate in the future that's unlike anything seen in the last 10,000 years, and that rate is likely therefore to be disruptive.”
Kevin Trenberth, Director Climate Division National Center for Atmospheric Research

Other Indicators of Global Climate Change
As lower atmosphere temperatures rise, the temperatures in the stratosphere fall. This is in agreement with basic theories of global warming
Stratospheric Temperature
Lower Atmospheric Temperature

Land Use Changes May Also be Influencing Climate
Urban and Irrigated Crops Have Often Replace Grasslands. This influence can be estimated using a
regional model.

Upward trends are strongest for the minimum temperatures in the Valley
Might this be related to increased irrigation?

ERA40
6
Grell
30km x 30km
Year runs
August 1995-Sept. 1996
MM5 Regional Modeling System

100 year trends from the UK Meteorological Office Model Regional Model Boundary Conditions

50403020100-10-20-30-40-50
0.10.080.060.040.020-0.02-0.04-0.06-0.08-0.1
100806040200-20-40-60-80-100
f : 1996-1901q2 % change
50403020100-10-20-30-40-50
0.5 ms-1
a : 1996-1901Tmax
b : No_Irrig-1901Tmax
d : 1996-1901Soil Moisture
e : 1996-1901Winds; SnowWater % change
c: 1996-1901LH

50403020100-10-20-30-40-50
0.10.080.060.040.020-0.02-0.04-0.06-0.08-0.1
100806040200-20-40-60-80-100
f : 1996-1901q2 % change
50403020100-10-20-30-40-50
0.5 ms-1
a : 1996-1901Tmax
b : No_Irrig-1901Tmax
d : 1996-1901Soil Moisture
e : 1996-1901Winds; SnowWater % change
c: 1996-1901LH

How Global Temperature Changes are Estimated
Local Observation at time t, T’=T-
Tmean
Average all “good” T’ s over a region
Average T’ s over all regions of the globe
A point on the curve at t

Distribution of Rainfall Stations
Averages over Parts of the Northern Hemisphere

Changes in Frequencies of Wet (top) and Dry (bottom) Spells: 1901 to 1998
More Wet Periods
Constant or Fewer Dry Periods
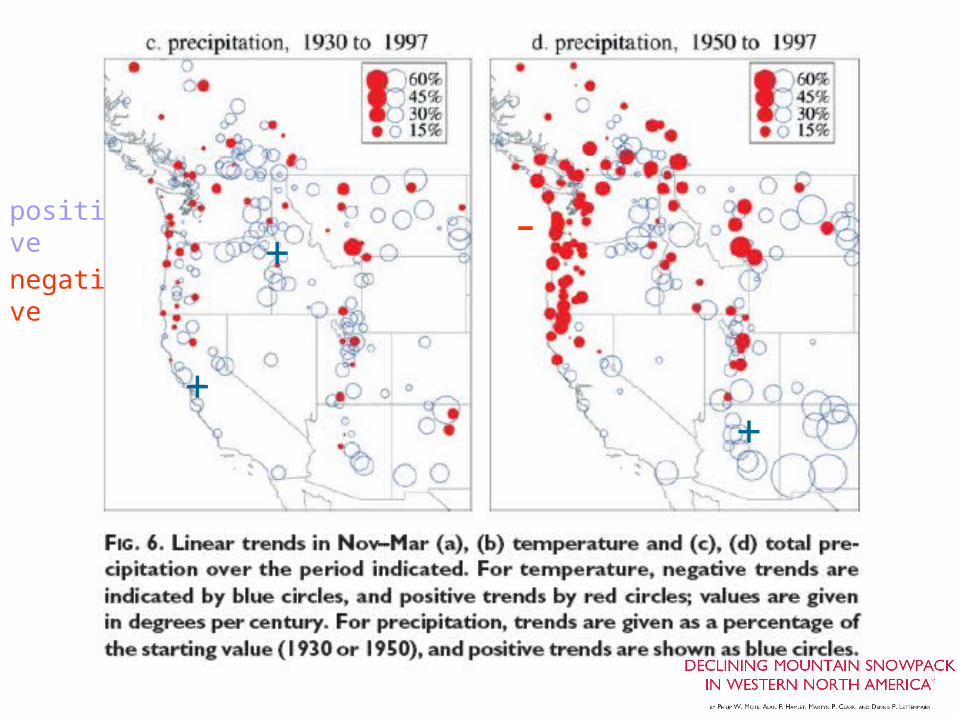
+
-
+
+positive
negative

Carbon Dioxide Emission Scenarios


![[2008] ZACC 20 MICHAEL WEARE First Applicant and](https://img.pdfslide.net/doc/110x75/620b97c257c1a67ba9634753/2008-zacc-20-michael-weare-first-applicant-and.jpg)