Embed Size (px)
Citation preview

Moscow
Global climate changes and associated changes in Russia
Igor I. MokhovA.M. Obukhov Institute of Atmospheric Physics RAS
Carnegie Moscow Center10. 11. 2011
Surface temperature annual-mean trends in Russia (1976-2010)(��/10 yrs)
�� ������GISS
by Roshydrometdata
����������� ���������� ����������� (��) �� ��������� ���������� 2001-2010 ��. ����������� 1951-1980 ��.)
�������������������������������������������������������� ���������������� ����������������������������������������
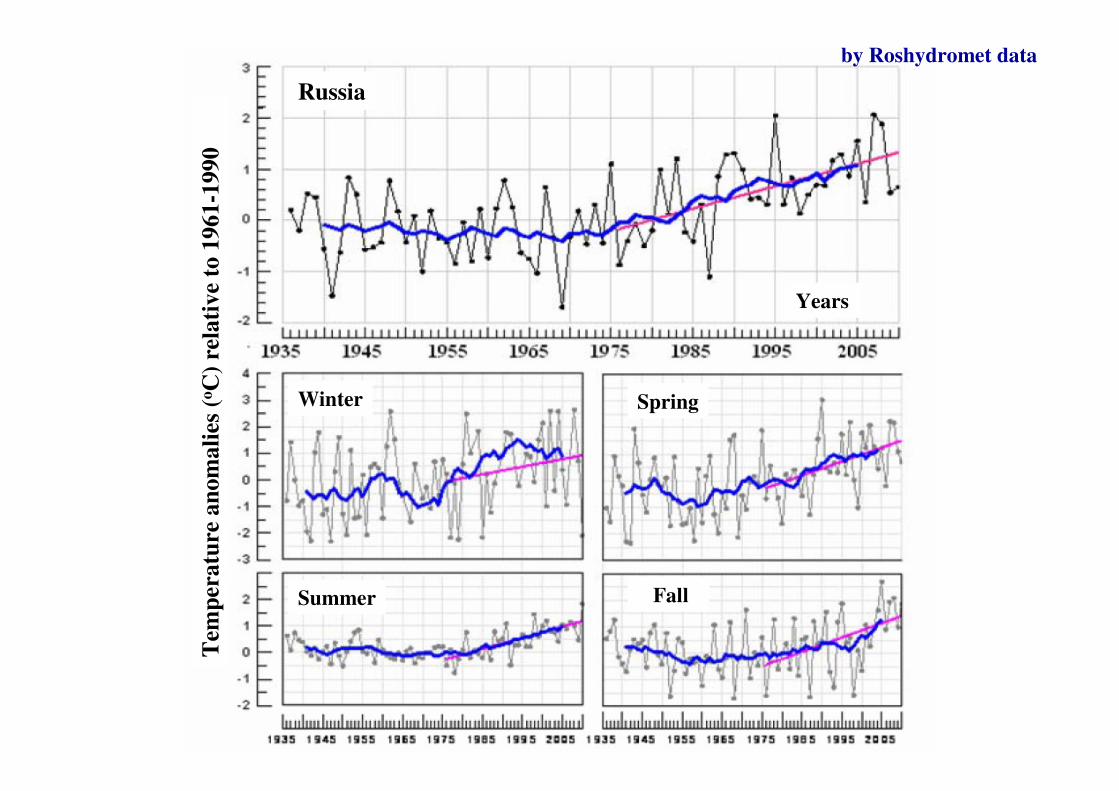
Russia
Tem
pera
ture
ano
mal
ies (
o C) r
elat
ive
to 1
961-
1990
Winter Spring
Summer Fall
Years
by Roshydromet data

Surface temperature annual-mean trends in Russia (1976-2010)(oC/10 yrs)
Winter Spring
Summer Fall
by Roshydromet data

Surface temperature annual-mean trends in Russia (1976-2010)
Surface temperature anomalies in January-2010 and July-2010 (relative to 1951-1980) by GISS data
by Roshydrometdata
oC/10 yrs

Blocking characteristics (X) from model simulations for different seasons and regions: Ratio X(2CO2) to X(1CO2)
April-JuneJanuary-MarchEuro-Atlantic region
1.11.2Total action
1.01.0Size
1.41.3Blocking days
0.81.0Intensity
0.91.1Duration
1.51.2Number
(Lupo, Oglesby and Mokhov, 1997; Mokhov, 2006)
4.64.1Total action
4.82.0Blocking days
0.91.3Size
1.11.2Intensity
1.21.4Duration
4.01.4Number
April-JuneJanuary March NH continents
y = 0.0625x - 104.35R2 = 0.0251
0
10
20
30
40
50
60
1890 1910 1930 1950 1970 1990 2010
D
y = -0.0226x + 98.279R2 = 0.0096
30
35
40
45
50
55
60
65
70
75
1890 1910 1930 1950 1970 1990 2010
Q
y = 0.0067x - 13.05R2 = 0.0489
-3
-2
-1
0
1
2
3
4
1890 1910 1930 1950 1970 1990 2010
dT
y = 10.859x + 16.457R2 = 0.7036
0
10
20
30
40
50
60
-3 -2 -1 0 1 2 3 4
dT
D
y = -4.0398x + 54.713R2 = 0.2875
30
35
40
45
50
55
60
65
70
75
-3 -2 -1 0 1 2 3 4
dT
Q
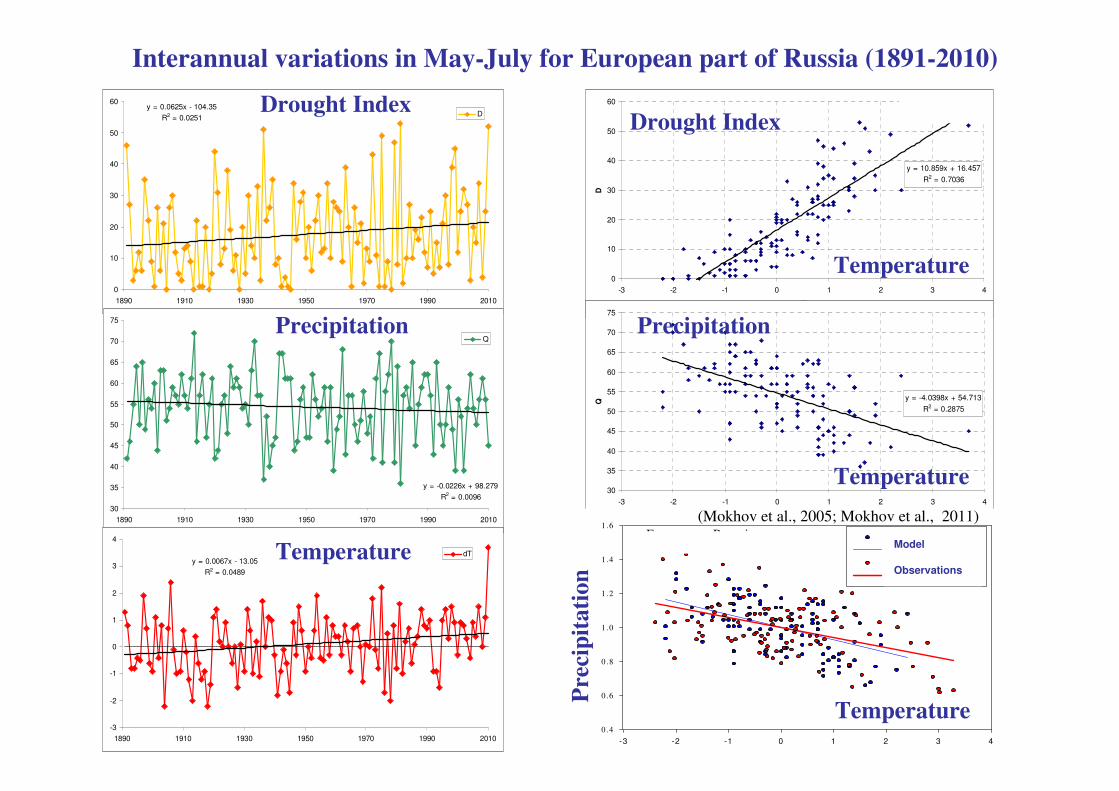
Interannual variations in May-July for European part of Russia (1891-2010)
Drought Index
Temperature
Precipitation
Drought Index
Temperature
Temperature
Precipitation
E u ro p ean R u ssia
S u rface tem p era tu re an o m alie s, K
-3 -2 -1 0 1 2 3 4
Nor
mili
zed
prec
ipita
tion
0 .4
0 .6
0 .8
1 .0
1 .2
1 .4
1 .6
IP S L -C M 2IP S L -C M 2 reg r.O b serva tion sO b serva tion s reg r.
m id d le la titu d es 1 8 91 -19 9 5M ay -Ju n e-Ju ly
Model
ObservationsPr
ecip
itatio
n
Temperature
(Mokhov et al., 2005; Mokhov et al., 2011)

Relative trends (%/100 yrs) in JJA (left column) and DJF (right column) precipitation(upper panels), precipitaion intensity (middle panels) and wet day probability (bottom
panels) by simulations for the 21st century with anthropogenic scenarioprecipitation
Intensity
Probability
DJFJJA
(Semenov, Bengtsson, 2002)
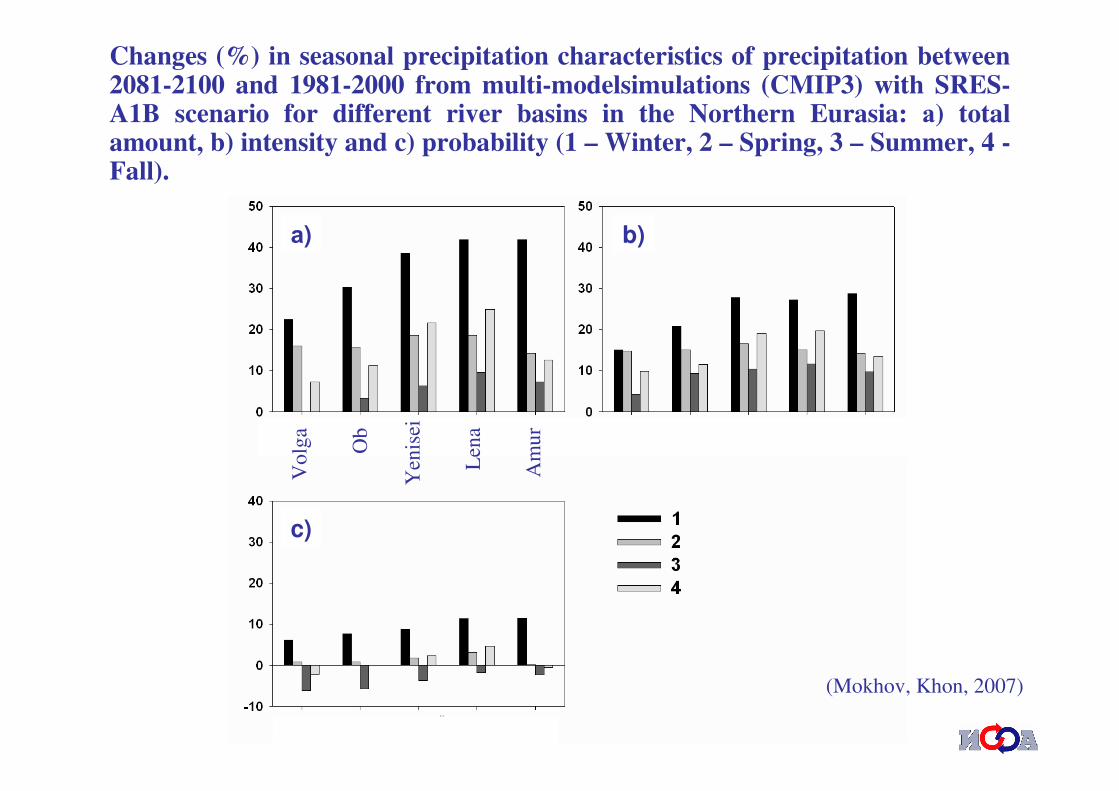
Changes (%) in seasonal precipitation characteristics of precipitation between 2081-2100 and 1981-2000 from multi-modelsimulations (CMIP3) with SRES-A1B scenario for different river basins in the Northern Eurasia: �) total amount, b) intensity and c) probability (1 – Winter, 2 – Spring, 3 – Summer, 4 -Fall).
(Mokhov, Khon, 2007)
b)�)
c)
Ob
Vol
ga
Yen
isei
Len
a
Am
ur

����
0
10
20
30
40
50
60
70
1960
1963
1966
1969
1972
1975
1978
1981
1984
1987
1990
1993
1996
1999
2002
2005
2008
2011
2014
2017
2020
2023
2026
2029
2032
2035
2038
2041
2044
2047
2050
2053
2056
2059
2062
2065
2068
2071
2074
2077
2080
2083
2086
2089
2092
2095
2098
A1B
A2
����=11=11ooI (SRESI (SRES--AIB and SRESAIB and SRES--A2)A2)
Blocking-days variations in summer over Euro-Atlantic region from model IPSL CM4 simulations (CMIP3) with different SRES scenarios (AIB
and A2) and with different modifications (I and II) of blocking identification method
����
0
10
20
30
40
50
60
70
80
1960
1963
1966
1969
1972
1975
1978
1981
1984
1987
1990
1993
1996
1999
2002
2005
2008
2011
2014
2017
2020
2023
2026
2029
2032
2035
2038
2041
2044
2047
2050
2053
2056
2059
2062
2065
2068
2071
2074
2077
2080
2083
2086
2089
2092
2095
2098
A1B
A2
����=7.5=7.5ooII (SRESII (SRES--A1B and SRESA1B and SRES--A2) A2)
2010
2010
(Mokhov et al., 2010; Mokhov et al., 2011)

Y e a r
1 9 0 0 1 9 5 0 2 0 0 0 2 0 5 0 2 1 0 0
D, %
0
2 0
4 0
6 0
8 0
E a s t e r n E u r o p e
Y e a r
1 9 0 0 1 9 5 0 2 0 0 0 2 0 5 0 2 1 0 0
D, %
0
1 0
2 0
3 0
4 0
5 0
6 0
Interannual variations of drought index D (%) in May-July for European part of Russia
from global climate model simulationswith anthropogenic scenario SRES-A2 for the 21st century
(Mokhov et al., 2005)

Relative changes between (1991-2000) and (2091-2100) (SRES-A2 scenario)
(1991-2000)
Forest Fire Risk (Nesterov Index) in Summerfrom Simulations with MGO Regional Climate Model
Mokhov, Chernokulsky and Shkolnik (2006, 2010)

Regional effects associated with El-Nino phenomena
1.061.07Blocking days
La-Nina yearsEl-Nino yearsEuro-Atlantic region
aC
aspi
an S
ea le
vel c
hang
es, m
b SO
I ind
ex a
nom
alie
s(X
II-I
II)
(3-y
ears��������� �������)
�
b
Changes in Caspian Sea basin
Anomalies in the blocking-days number and total blockings actionin Euro-Atlantic region in El-Nino/La-Nina years (like 2010)
(Wiedenmann, Lupo, Mokhov and Tikhonova, 2002)
1.15-1.191.02-1.04Total blockings action
La-Nina yearsEl-Nino yearsEuro-Atlantic region
(Mokhov, 2006)
(Arpe, Bengtsson, Golitsyn, Mokhov, Semenov, Sporyshev, 2000)

European region of RussiaCumulative distribution functions
for surface air temperature anomalies (��) and precipitation (%) in May-July in different phases of El-Nino/La-Nina (1891-2010)
(Mokhov et al., 2011)
surface air temperature anomalies precipitationafter (EN/LN/Neutral)
after (EN/LN/Neutral)before (EN/LN/Neutral)
before (EN/LN/Neutral)

European region of RussiaCumulative distribution functions
for drought index (D,%) in May-July in different phases of El-Nino/La-Nina (1891-2010)
(Mokhov et al., 2011)
after (EN/LN/Neutral)
before (EN/LN/Neutral)

Coherency of climate variations in European and West Asian Russian regions in May-July: �) temperature, b) precipitation, c) drought index
�) b)
c)
(Mokhov et al., 2011)
temperature precipitation
drought index

Thank you for attention!Thank you for attention!