Embed Size (px)
Citation preview
1 This work is licensed under a Creative Commons Attribution-ShareAlike 4.0 International License.
][
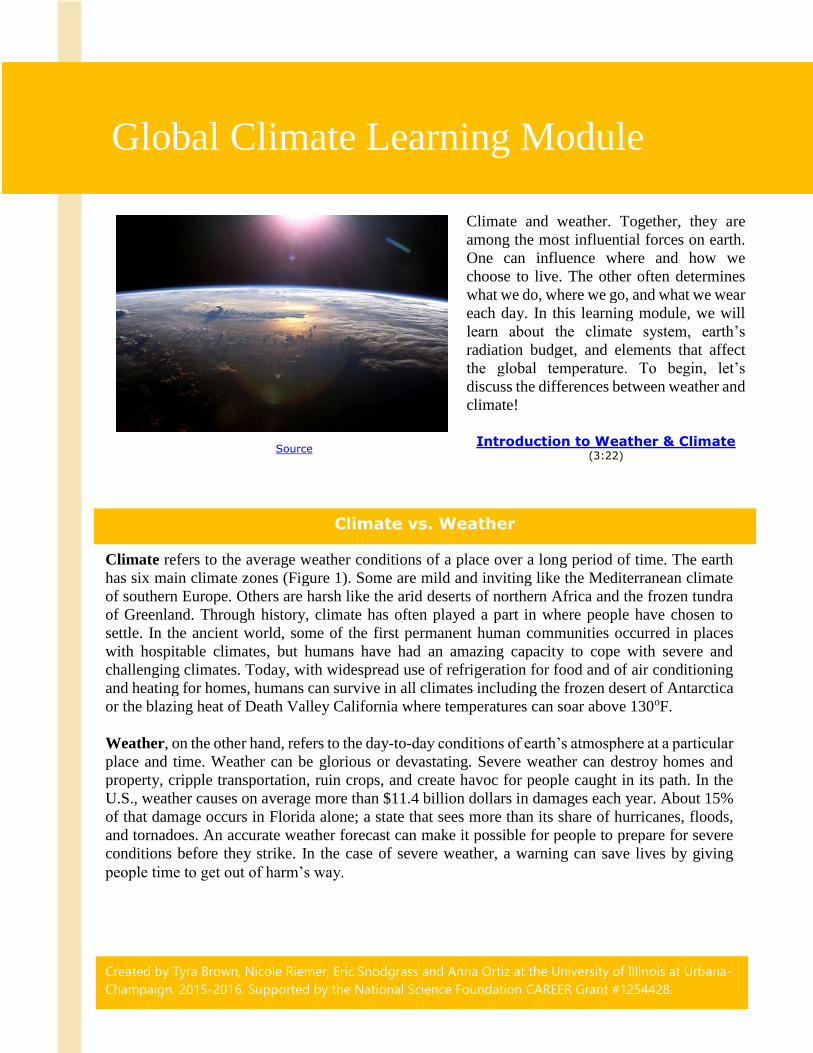
Global Climate Learning Module
Climate and weather. Together, they are
among the most influential forces on earth.
One can influence where and how we
choose to live. The other often determines
what we do, where we go, and what we wear
each day. In this learning module, we will
learn about the climate system, earth’s
radiation budget, and elements that affect
the global temperature. To begin, let’s
discuss the differences between weather and
climate!
Introduction to Weather & Climate (3:22)
Source
Created by Tyra Brown, Nicole Riemer, Eric Snodgrass and Anna Ortiz at the University of Illinois at Urbana-
Champaign. 2015-2016. Supported by the National Science Foundation CAREER Grant #1254428.
Climate refers to the average weather conditions of a place over a long period of time. The earth
has six main climate zones (Figure 1). Some are mild and inviting like the Mediterranean climate
of southern Europe. Others are harsh like the arid deserts of northern Africa and the frozen tundra
of Greenland. Through history, climate has often played a part in where people have chosen to
settle. In the ancient world, some of the first permanent human communities occurred in places
with hospitable climates, but humans have had an amazing capacity to cope with severe and
challenging climates. Today, with widespread use of refrigeration for food and of air conditioning
and heating for homes, humans can survive in all climates including the frozen desert of Antarctica
or the blazing heat of Death Valley California where temperatures can soar above 130oF.
Weather, on the other hand, refers to the day-to-day conditions of earth’s atmosphere at a particular
place and time. Weather can be glorious or devastating. Severe weather can destroy homes and
property, cripple transportation, ruin crops, and create havoc for people caught in its path. In the
U.S., weather causes on average more than $11.4 billion dollars in damages each year. About 15%
of that damage occurs in Florida alone; a state that sees more than its share of hurricanes, floods,
and tornadoes. An accurate weather forecast can make it possible for people to prepare for severe
conditions before they strike. In the case of severe weather, a warning can save lives by giving
people time to get out of harm’s way.
Climate vs. Weather

2 This work is licensed under a Creative Commons Attribution-ShareAlike 4.0 International License.
With so much at stake, atmospheric scientists called meteorologists are working with new
technologies to find better ways to forecast the weather. Powerful computers process atmospheric
information to create weather maps and models. Radar tracks storms on the move and can detect
rain up to 250 miles away. Weather satellites look down on earth from space monitoring everything
from cloud cover and precipitation to lightning strikes and fluctuations in the temperature of the
oceans. There are even research planes that fly into hurricanes to help scientists learn about the
inner workings of some of the planet’s most destructive storms. In some cases, meteorology can be
a nail-biting adventure as scientists risk their lives to study tornadoes. As scientists continue to
study weather patterns and behavior, we can expect to find more ways to predict its course and the
next time severe weather strikes, perhaps, we’ll be ready.
To understand more about the differences between weather and climate, watch this next video!
Weather vs. Climate (2:09)
Figure 1. The global climate zones
Source
Video Lecture Notes
o Weather ≠ Climate
o Climate is a long term average of weather (over at least 30 years). It is shaped by
global forces that alter the energy balance in the atmosphere such as changes in
the sun, tilt of the earth’s axis, amount of sunlight the earth reflects back to space,
and concentration of greenhouse gases in the atmosphere.
o Weather is what the atmosphere does in the short term, hour-to-hour and day-to-
day. Weather is chaotic, which means even a microscopic disturbance can lead to
large-scale changes.
o The average weather over the course of years reveals a pattern. That pattern is
climate and is much more predictable than our everyday weather.

3 This work is licensed under a Creative Commons Attribution-ShareAlike 4.0 International License.
Video Lecture Notes
o The climate has changed many times in the long history of earth, but always in
response to a global force. The strongest force driving climate change right now
is the increasing carbon dioxide (CO2) from the burning of fossil fuels, which is
trapping more heat from leaving earth’s atmosphere.
o All of that additional energy has to go somewhere. Some of it warms the air, but
most of it ends up in the oceans. All over the world, the oceans are getting
warmer.
The Climate System
Earth’s climate system consists of land, water in all its phases, air, and all living things (Figure 2).
It is all these elements that make modeling the climate system so complex. Our climate system is
driven by two things:
(1) The way energy from the sun moves in and out of the atmosphere
(2) The way heat is transported around the atmosphere and the oceans
To learn more about the climate system and the interactions that keep it working, check out this
next video! 1
Introduction to the Climate System (3:51)
Figure 2. Components of the global climate system
Source
4 This work is licensed under a Creative Commons Attribution-ShareAlike 4.0 International License.
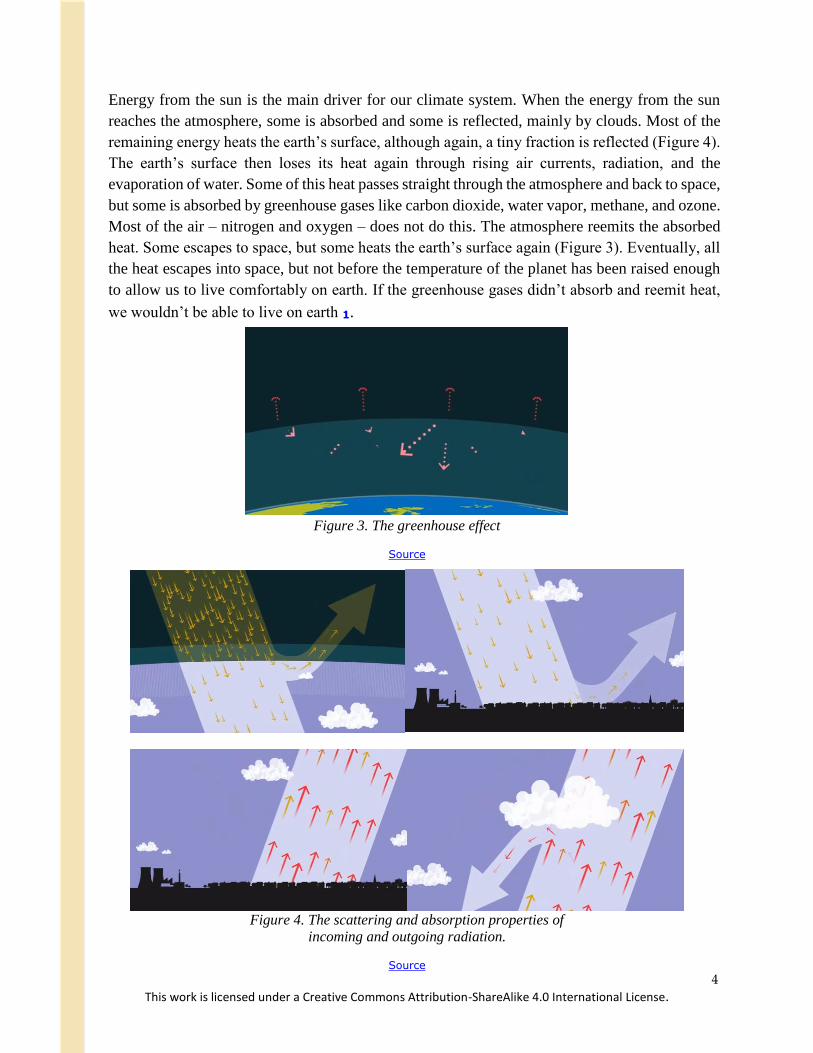
Energy from the sun is the main driver for our climate system. When the energy from the sun
reaches the atmosphere, some is absorbed and some is reflected, mainly by clouds. Most of the
remaining energy heats the earth’s surface, although again, a tiny fraction is reflected (Figure 4).
The earth’s surface then loses its heat again through rising air currents, radiation, and the
evaporation of water. Some of this heat passes straight through the atmosphere and back to space,
but some is absorbed by greenhouse gases like carbon dioxide, water vapor, methane, and ozone.
Most of the air – nitrogen and oxygen – does not do this. The atmosphere reemits the absorbed
heat. Some escapes to space, but some heats the earth’s surface again (Figure 3). Eventually, all
the heat escapes into space, but not before the temperature of the planet has been raised enough
to allow us to live comfortably on earth. If the greenhouse gases didn’t absorb and reemit heat,
we wouldn’t be able to live on earth 1.
Figure 3. The greenhouse effect
Source
Figure 4. The scattering and absorption properties of
incoming and outgoing radiation.
Source
5 This work is licensed under a Creative Commons Attribution-ShareAlike 4.0 International License.
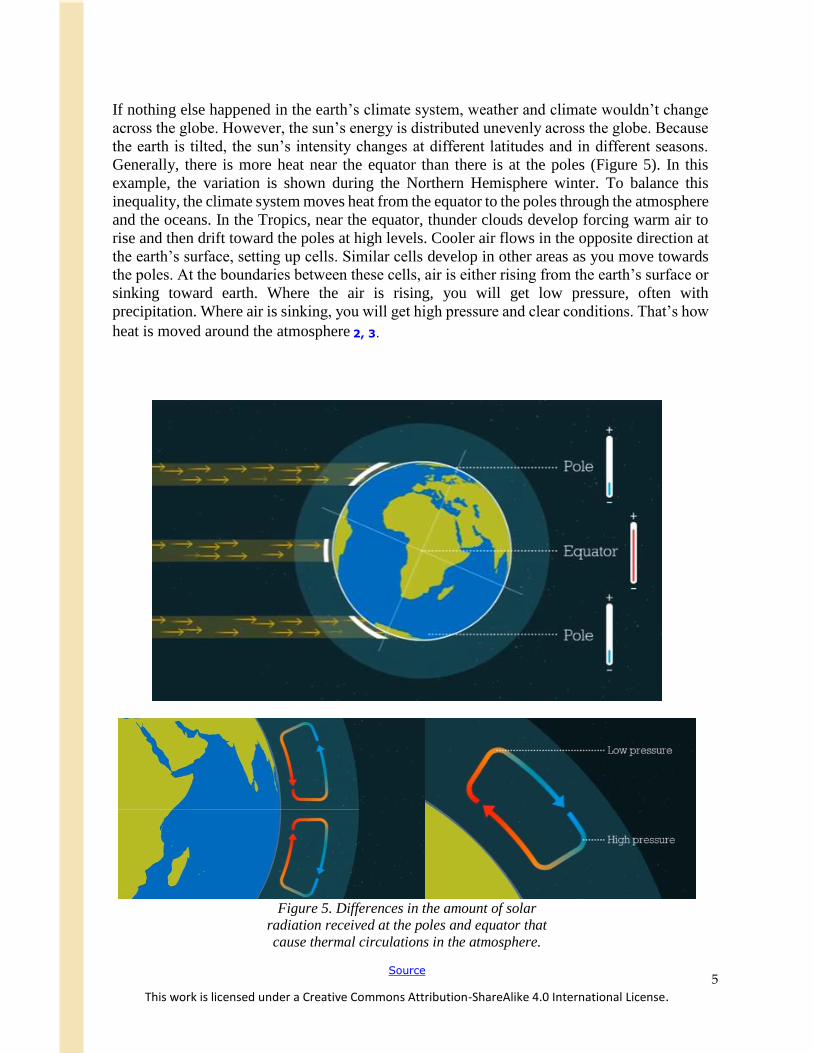
If nothing else happened in the earth’s climate system, weather and climate wouldn’t change
across the globe. However, the sun’s energy is distributed unevenly across the globe. Because
the earth is tilted, the sun’s intensity changes at different latitudes and in different seasons.
Generally, there is more heat near the equator than there is at the poles (Figure 5). In this
example, the variation is shown during the Northern Hemisphere winter. To balance this
inequality, the climate system moves heat from the equator to the poles through the atmosphere
and the oceans. In the Tropics, near the equator, thunder clouds develop forcing warm air to
rise and then drift toward the poles at high levels. Cooler air flows in the opposite direction at
the earth’s surface, setting up cells. Similar cells develop in other areas as you move towards
the poles. At the boundaries between these cells, air is either rising from the earth’s surface or
sinking toward earth. Where the air is rising, you will get low pressure, often with
precipitation. Where air is sinking, you will get high pressure and clear conditions. That’s how
heat is moved around the atmosphere 2, 3.
Figure 5. Differences in the amount of solar
radiation received at the poles and equator that
cause thermal circulations in the atmosphere.
Source

6 This work is licensed under a Creative Commons Attribution-ShareAlike 4.0 International License.
Now let’s see how it moves around the oceans. Changes in sea temperatures and saltiness (or
salinity) create ocean currents. For example, the Gulf Stream is one of the strongest currents in
the world (Figure 6). Surface water in the north Atlantic is cooled by winds from the Arctic.
Cold, dense, salty water sinks and travels toward the equator deep in the ocean. In turn, the Gulf
Stream moves warm water from the Gulf of Mexico northeastward at the surface to replace it.
This brings warmth to northwest Europe making the climate milder than any other place at the
same latitude. It is these interactions between the sun’s energy and how the atmosphere and
oceans move heat around the earth – which produce different climates in different parts of the
world and set up variations in our day-to-day weather. A warming world caused by increases in
greenhouse gases could upset the delicate balance of our climate system and have an impact on
our longer term climate 1.
Climate Change Mechanisms
The first method to change the global average temperature is to change the solar energy output. Both
the earth and sun go through cycles that can affect the amount of solar energy that earth receives.
To learn more watch this video! 4
Solar Energy Output (6:54)
Figure 6. The Gulf Stream
Source
Source
7 This work is licensed under a Creative Commons Attribution-ShareAlike 4.0 International License.
Video Lecture Notes 4
o Global average air temperature is 59oF (15oC), during the last ice age, the globally
average temperature was only 4oC cooler.
o Earth has warmed by 1oC since 1750.
o There are 3 methods to change the global average temperature:
(1) Change the solar energy output
(2) Change the Earth’s brightness (albedo)
(3) Change the composition of the atmosphere
o Energy output of the sun has increased slightly since 1750, but not enough to warm
the earth as much as we have seen recently.
o Sun spots are cool spots on the sun and their numbers are in an 11-year cycle.
o The Milankovitch cycles are changes that occur in a cycle due to changes in the tilt
of earth on its axis and changes in the earth’s orbital path. These changes lead to ice
ages and interglacial warm periods.
o According to the current phase of the Milankovitch cycles, our planet should be
heading (very slowly) to the next ice age.
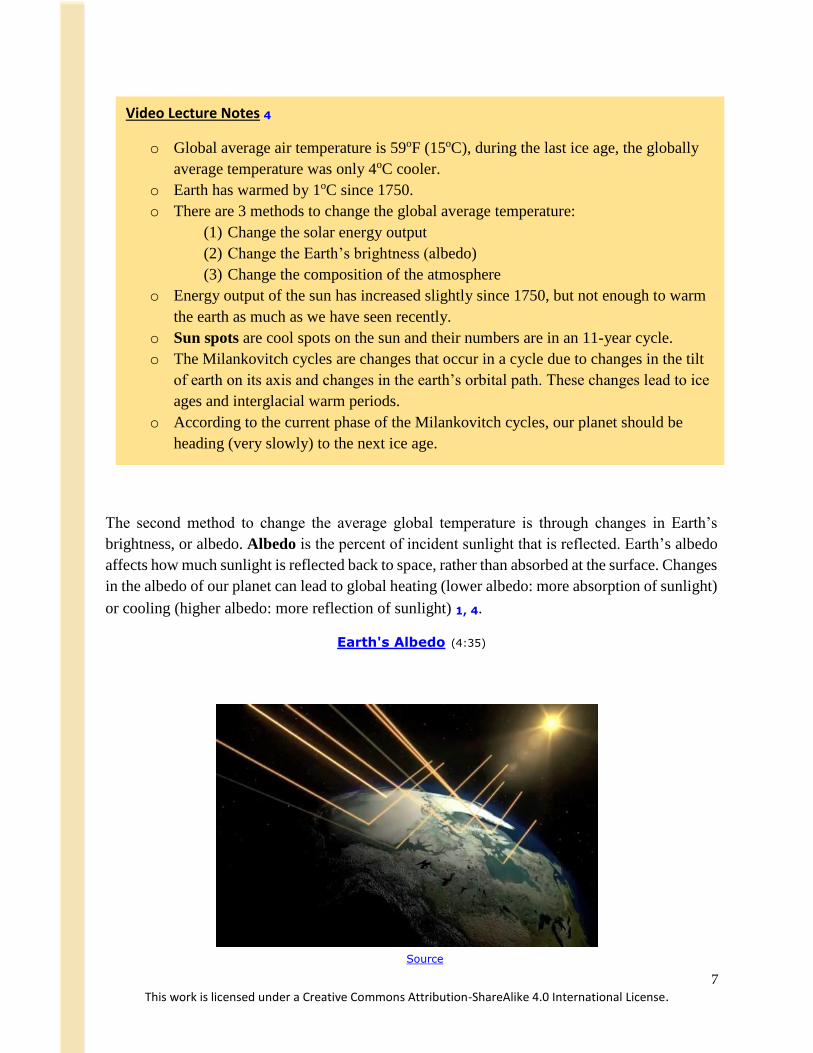
The second method to change the average global temperature is through changes in Earth’s
brightness, or albedo. Albedo is the percent of incident sunlight that is reflected. Earth’s albedo
affects how much sunlight is reflected back to space, rather than absorbed at the surface. Changes
in the albedo of our planet can lead to global heating (lower albedo: more absorption of sunlight)
or cooling (higher albedo: more reflection of sunlight) 1, 4.
Earth's Albedo (4:35)
Source
8 This work is licensed under a Creative Commons Attribution-ShareAlike 4.0 International License.
Video Lecture Notes 1, 4
o Albedo = reflected sunlight / incident sunlight
o The globally averaged albedo is approximately 30% (i.e., 30% is reflected back to
space).
o Bright surfaces have a high albedo and will reflect more incoming sunlight.
o Dark surfaces have a low albedo and will absorb more incoming sunlight.
o Ice albedo effect – As glaciers advance, the higher albedo over a larger area,
therefore, less light is absorbed and more is reflected, this leads to cooling, which
helps the ice advance further (a positive feedback loop).
o Volcanoes have a temporary cooling effect on the global climate.
o Over the last 200 years, our planet’s albedo has increased, which should have led
to global cooling.
The Greenhouse Effect
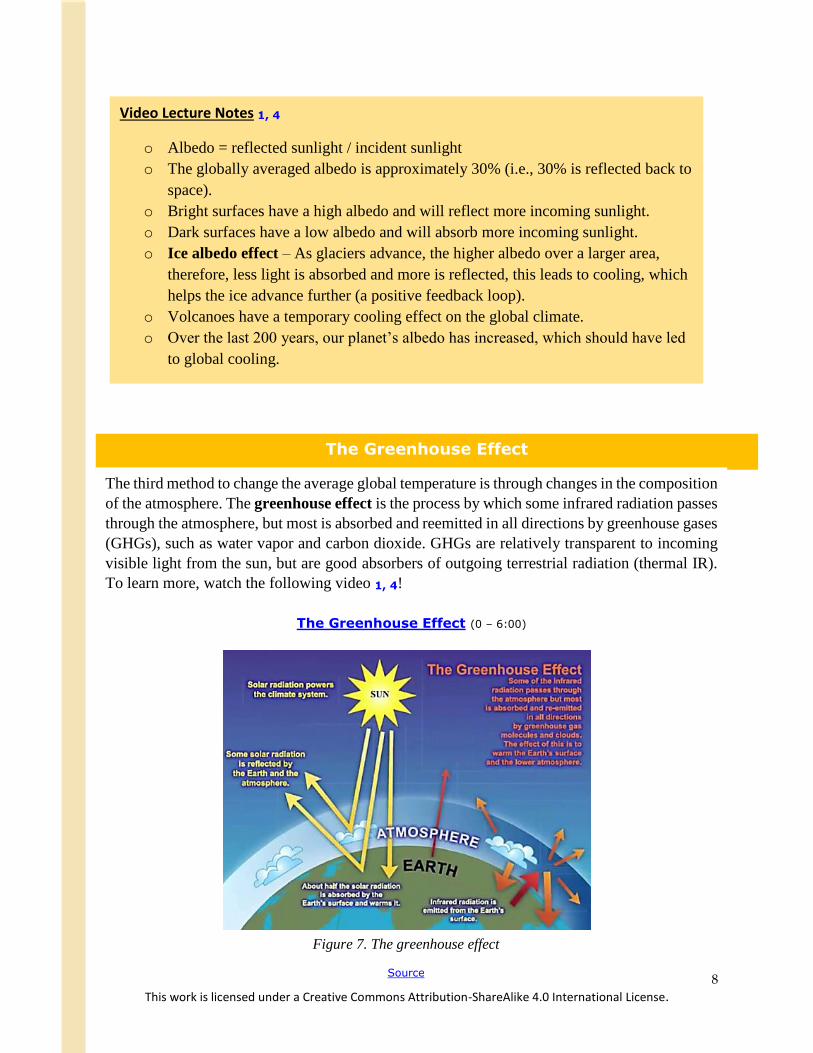
The third method to change the average global temperature is through changes in the composition
of the atmosphere. The greenhouse effect is the process by which some infrared radiation passes
through the atmosphere, but most is absorbed and reemitted in all directions by greenhouse gases
(GHGs), such as water vapor and carbon dioxide. GHGs are relatively transparent to incoming
visible light from the sun, but are good absorbers of outgoing terrestrial radiation (thermal IR).
To learn more, watch the following video 1, 4!
The Greenhouse Effect (0 – 6:00)
Figure 7. The greenhouse effect
Source
9 This work is licensed under a Creative Commons Attribution-ShareAlike 4.0 International License.
Video Lecture Notes 1, 4
o Water vapor is a “trace gas” and is the most abundant greenhouse gas (GHG) in
the Earth’s atmosphere (although it is a weak GHG).
o All gases are relatively transparent to visible light from the sun, but GHGs are
absorbing of outgoing terrestrial radiation (thermal IR).
o The greenhouse effect keeps the global average temperature at 59oF. Without
GHGs, the globally averaged temperature would be 0oF.
o As the planet warms, the amount of water vapor in the atmosphere increases.
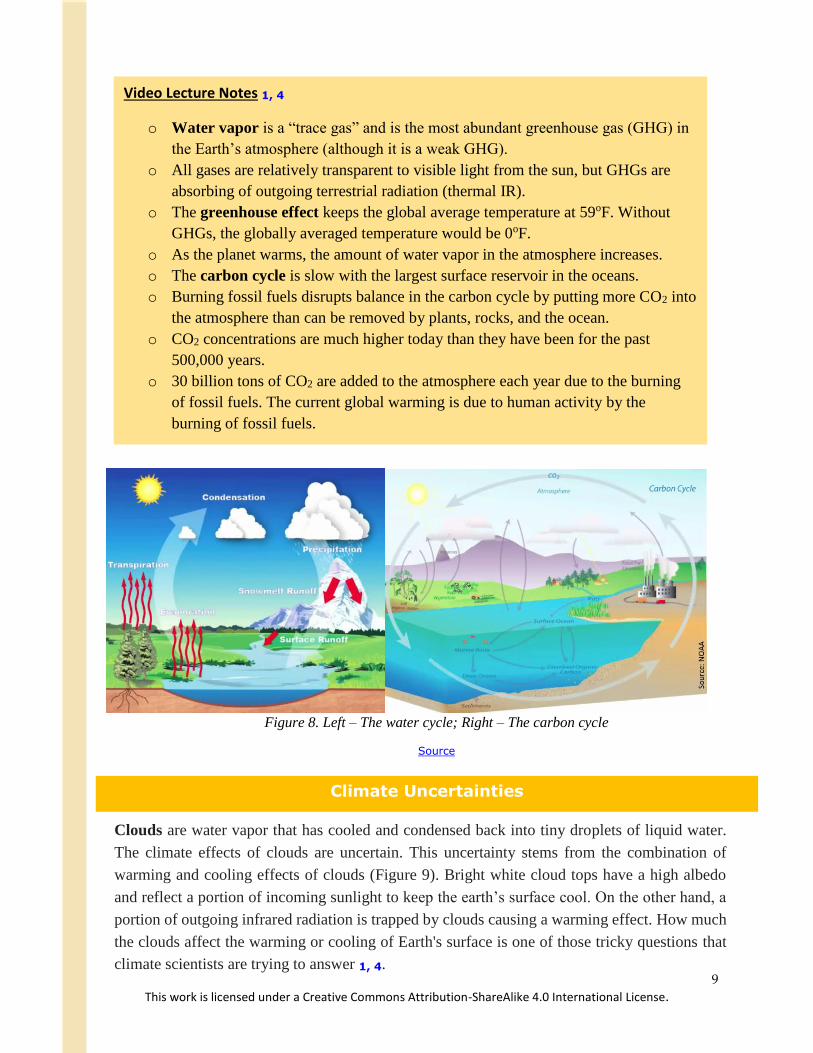
o The carbon cycle is slow with the largest surface reservoir in the oceans.
o Burning fossil fuels disrupts balance in the carbon cycle by putting more CO2 into
the atmosphere than can be removed by plants, rocks, and the ocean.
o CO2 concentrations are much higher today than they have been for the past
500,000 years.
o 30 billion tons of CO2 are added to the atmosphere each year due to the burning
of fossil fuels. The current global warming is due to human activity by the
burning of fossil fuels.
Climate Uncertainties
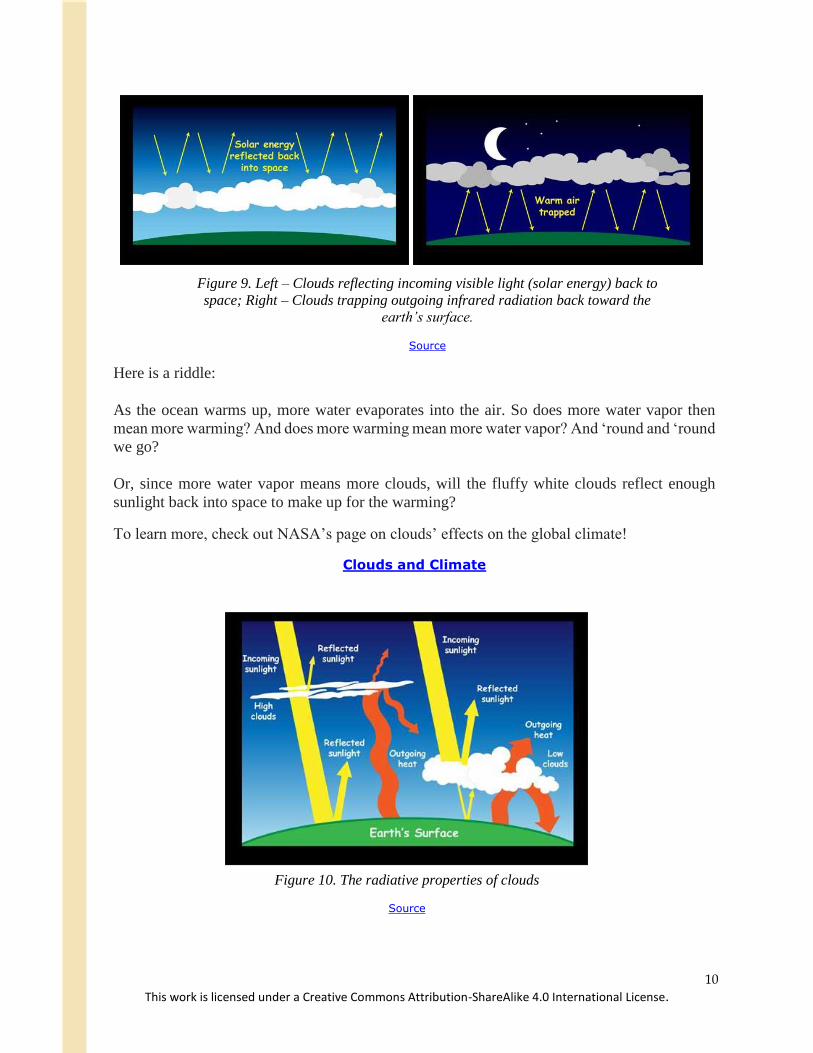
Clouds are water vapor that has cooled and condensed back into tiny droplets of liquid water.
The climate effects of clouds are uncertain. This uncertainty stems from the combination of
warming and cooling effects of clouds (Figure 9). Bright white cloud tops have a high albedo
and reflect a portion of incoming sunlight to keep the earth’s surface cool. On the other hand, a
portion of outgoing infrared radiation is trapped by clouds causing a warming effect. How much
the clouds affect the warming or cooling of Earth's surface is one of those tricky questions that
climate scientists are trying to answer 1, 4.
Figure 8. Left – The water cycle; Right – The carbon cycle
Source
10 This work is licensed under a Creative Commons Attribution-ShareAlike 4.0 International License.
Figure 9. Left – Clouds reflecting incoming visible light (solar energy) back to
space; Right – Clouds trapping outgoing infrared radiation back toward the
earth’s surface.
Source
Source
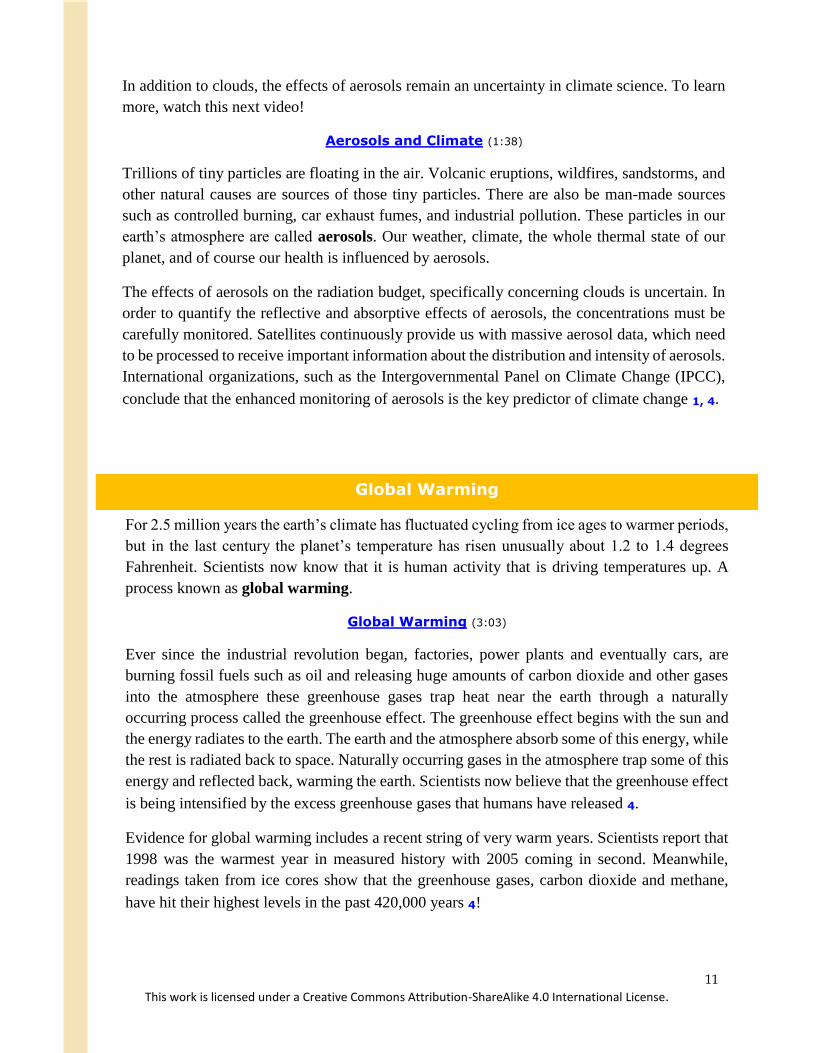
Here is a riddle:
As the ocean warms up, more water evaporates into the air. So does more water vapor then
mean more warming? And does more warming mean more water vapor? And ‘round and ‘round
we go?
Or, since more water vapor means more clouds, will the fluffy white clouds reflect enough
sunlight back into space to make up for the warming?
To learn more, check out NASA’s page on clouds’ effects on the global climate!
Clouds and Climate
Figure 10. The radiative properties of clouds
Source
11 This work is licensed under a Creative Commons Attribution-ShareAlike 4.0 International License.
In addition to clouds, the effects of aerosols remain an uncertainty in climate science. To learn
more, watch this next video!
Aerosols and Climate (1:38)
Trillions of tiny particles are floating in the air. Volcanic eruptions, wildfires, sandstorms, and
other natural causes are sources of those tiny particles. There are also be man-made sources
such as controlled burning, car exhaust fumes, and industrial pollution. These particles in our
earth’s atmosphere are called aerosols. Our weather, climate, the whole thermal state of our
planet, and of course our health is influenced by aerosols.
The effects of aerosols on the radiation budget, specifically concerning clouds is uncertain. In
order to quantify the reflective and absorptive effects of aerosols, the concentrations must be
carefully monitored. Satellites continuously provide us with massive aerosol data, which need
to be processed to receive important information about the distribution and intensity of aerosols.
International organizations, such as the Intergovernmental Panel on Climate Change (IPCC),
conclude that the enhanced monitoring of aerosols is the key predictor of climate change 1, 4.
Global Warming
For 2.5 million years the earth’s climate has fluctuated cycling from ice ages to warmer periods,
but in the last century the planet’s temperature has risen unusually about 1.2 to 1.4 degrees
Fahrenheit. Scientists now know that it is human activity that is driving temperatures up. A
process known as global warming.
Global Warming (3:03)
Ever since the industrial revolution began, factories, power plants and eventually cars, are
burning fossil fuels such as oil and releasing huge amounts of carbon dioxide and other gases
into the atmosphere these greenhouse gases trap heat near the earth through a naturally
occurring process called the greenhouse effect. The greenhouse effect begins with the sun and
the energy radiates to the earth. The earth and the atmosphere absorb some of this energy, while
the rest is radiated back to space. Naturally occurring gases in the atmosphere trap some of this
energy and reflected back, warming the earth. Scientists now believe that the greenhouse effect
is being intensified by the excess greenhouse gases that humans have released 4.
Evidence for global warming includes a recent string of very warm years. Scientists report that
1998 was the warmest year in measured history with 2005 coming in second. Meanwhile,
readings taken from ice cores show that the greenhouse gases, carbon dioxide and methane,
have hit their highest levels in the past 420,000 years 4!
12 This work is licensed under a Creative Commons Attribution-ShareAlike 4.0 International License.
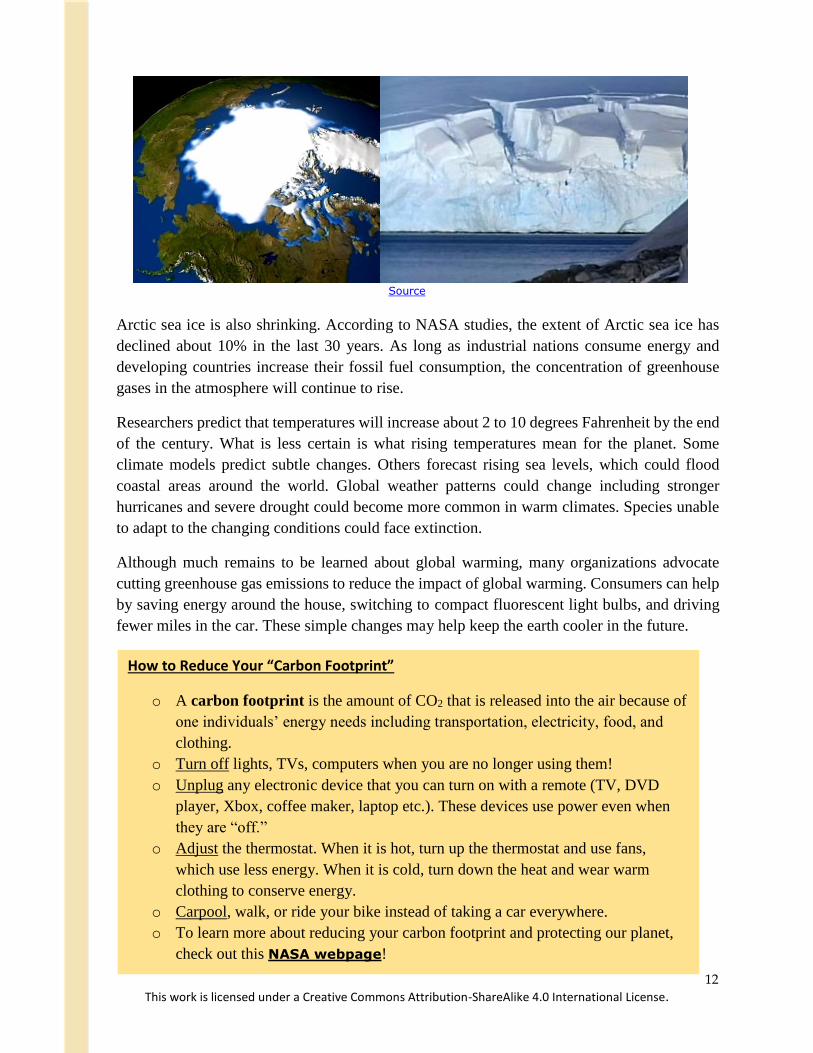
Arctic sea ice is also shrinking. According to NASA studies, the extent of Arctic sea ice has
declined about 10% in the last 30 years. As long as industrial nations consume energy and
developing countries increase their fossil fuel consumption, the concentration of greenhouse
gases in the atmosphere will continue to rise.
Researchers predict that temperatures will increase about 2 to 10 degrees Fahrenheit by the end
of the century. What is less certain is what rising temperatures mean for the planet. Some
climate models predict subtle changes. Others forecast rising sea levels, which could flood
coastal areas around the world. Global weather patterns could change including stronger
hurricanes and severe drought could become more common in warm climates. Species unable
to adapt to the changing conditions could face extinction.
Although much remains to be learned about global warming, many organizations advocate
cutting greenhouse gas emissions to reduce the impact of global warming. Consumers can help
by saving energy around the house, switching to compact fluorescent light bulbs, and driving
fewer miles in the car. These simple changes may help keep the earth cooler in the future.
How to Reduce Your “Carbon Footprint”
o A carbon footprint is the amount of CO2 that is released into the air because of
one individuals’ energy needs including transportation, electricity, food, and
clothing.
o Turn off lights, TVs, computers when you are no longer using them!
o Unplug any electronic device that you can turn on with a remote (TV, DVD
player, Xbox, coffee maker, laptop etc.). These devices use power even when
they are “off.”
o Adjust the thermostat. When it is hot, turn up the thermostat and use fans,
which use less energy. When it is cold, turn down the heat and wear warm
clothing to conserve energy.
o Carpool, walk, or ride your bike instead of taking a car everywhere.
o To learn more about reducing your carbon footprint and protecting our planet,
check out this NASA webpage!
Source
13 This work is licensed under a Creative Commons Attribution-ShareAlike 4.0 International License.
Pre-Class Activity 4, 5
Instructions: Before teaching about the global climate system, have the students answer the
questions below, followed by a question for in-class discussion between you and your students.
1. Which of the following is not a greenhouse gas?
a. Water vapor
b. Carbon dioxide
c. Oxygen
d. Methane
2. What are clouds made of?
a. Hail
b. Microscopic water droplets
c. Water vapor
d. Carbon dioxide
3. Climate is the average weather in a particular geographic location. T F
4. The greenhouse effect is a naturally occurring phenomenon. T F
5. Human activity is the primary cause of global warming. T F
Discussion Question: Your carbon footprint is the amount of carbon dioxide that is released
into the atmosphere because of your energy needs. What are some ways to reduce the amount
of energy you use every day at home? At school?
Supplemental Activity: Create and follow through with a plan for your classroom to use energy
more efficiently in order to reduce your carbon footprint. Make a poster or presentation to share
with other classes, your principal, or even the whole school!
14 This work is licensed under a Creative Commons Attribution-ShareAlike 4.0 International License.
In-Class Activity 5
Instructions: In this project, your group will explore the effects of global warming on Earth’s
climate system. Each group will choose one of Earth’s systems and complete the tasks written at
the end of each section.
1. The Atmosphere (air)
2. The Hydrosphere (water)
3. The Cryosphere (ice)
4. The Biosphere (life)
System: Earth’s Atmosphere 1, 4
Task #1: Measuring Temperature
1. What instrument do we use today to measure temperature?
2. Click here to learn about a method scientists use to estimate temperature before modern
technology. Summarize what you have learned.
3. What are three ways to change the global average temperature?

15 This work is licensed under a Creative Commons Attribution-ShareAlike 4.0 International License.
Task #2: Global Temperature Records
The plot shows temperatures worldwide from 1901 – 2014. Color bars indicate Earth’s surface
temperature where red represents temperatures above average and blue represents temperatures
below average. Answer the following questions.
1. Briefly explain how temperature trend has changed in the past 100 years.
2. How many degrees Fahrenheit above average was the temperature in 2014?
3. Do you expect temperatures in 2015 and 2016 to be above or below average?
4. If warming continues, what types of weather would you expect to be affected?
5. Do you think these events would occur more often and become more severe?
6. How would this affect the world’s population?

16 This work is licensed under a Creative Commons Attribution-ShareAlike 4.0 International License.
Task #3: Temperature Change
Click here to visualize how average temperatures have changed in different regions of the
world. Answer the following questions.
1. What is the latest temperature departure from average (‘Latest Measurement’) and when
was this measurement taken?
2. Watch the animation ‘Time Series: 1884 to 2015’ and determine where the most
significant warming is occurring beginning in 1920.
3. Briefly describe how things changed between the 1880’s and the 2000’s?
Task #4: Broadcast
As a scientist, it is important that you learn to properly convey weather information to the general
public. Your task is to create a 5-minute broadcast describing the effects of global warming on
Earth’s atmosphere using the tasks you have just completed. Be sure to address the following
topics in your broadcast:
1. Describe how climate researchers acquire temperature records.
2. Name the three processes by which the global average temperature can change.
3. Show the plot from Task #2.
4. Describe the temperature trend over the past century.
5. Explain how current weather events may be altered under a warmer climate.
6. Describe how global warming affects the global population.
7. Show the animation from Task #3.
8. Describe where the most intense warming is occurring.
Build this broadcast using presentation software (like PowerPoint) and be sure to supplement
everything you discuss with images. Be sure to be both informative and entertaining!
17 This work is licensed under a Creative Commons Attribution-ShareAlike 4.0 International License.
System: The Hydrosphere
Task #1: Sea Level
Click here to learn about the effects of global warming on sea level. Answer the following
questions.
1. What is the latest change in sea level from average (‘Latest Measurement’) and when was
this measurement taken?
2. What is the rate of change in millimeters per year?
3. Is the sea level increasing or decreasing?
4. What are the two primary factors by which sea level can change related to global
warming?
5. How would changes in the sea level affect human life?
Task #2: Sea Life
Click here to learn about the effects of global warming on our oceans. Answer the following
questions.
1. Briefly describe how climate change harms our planet’s oceans, specifically coral reefs.
2. What is this processed called?

18 This work is licensed under a Creative Commons Attribution-ShareAlike 4.0 International License.
3. What are four processes by which coral reefs can be destroyed?
4. What color does coral turn when it is destroyed?
5. Click here to learn about another way that climate change affects the ocean and briefly
describe that process.
6. How would these changes in the hydrosphere affect sea life?
Task #3: Broadcast
As a scientist, it is important that you learn to properly convey weather information to the general
public. Your task is to create a 5-minute broadcast describing the effects of global warming on
Earth’s hydrosphere using the tasks you have just completed. Be sure to address the following
topics in your broadcast:
1. Describe how sea levels have changed and discuss its rate of change.
2. Explain the two processes that causes changes in sea level.
3. Tell the audience how changes in sea level could affect humans.
4. Include the graphic from Task #2.
5. Describe how global warming is affecting ocean life.
6. Talk about changes to the coral reef and the processes by which it can be destroyed.
7. Discuss how changes to the hydrosphere can affect animals.
Build this broadcast using presentation software (like PowerPoint) and be sure to supplement
everything you discuss with images. Be sure to be both informative and entertaining!
19 This work is licensed under a Creative Commons Attribution-ShareAlike 4.0 International License.
System: The Cryosphere
Task #1: Arctic Sea Ice
Click here to learn about the effects of global warming on Arctic sea ice cover. Answer the
following questions.
1. What instrument is used to estimate sea ice extent?
2. What is the current average September extent of Arctic sea ice in millions of kilometers?
3. Which year had the lowest sea ice extent?
4. Has Arctic sea ice increased or decreased?
5. What is the rate of change per decade?
6. View the ‘Time Series: 1979 – 2015’ to visualize how sea ice has changed.
Task #2: Global Ice
Click here to learn about how global ice is changing. Answer the following questions.
1. What percent of Earth’s surface is covered by ice?
2. Name the three types of ice that are affected by climate change.
3. Click on ‘Glaciers’. How many billion tons of glacier have been lost since 1994?
4. Name two locations in the U.S. that are experienced glacier loss.
20 This work is licensed under a Creative Commons Attribution-ShareAlike 4.0 International License.
5. Click on ‘Greenland and Iceland’. How many billion metric tons of ice has been lost per
year?
6. Click on ‘Antarctica’. How many billion metric tons of ice has been lost per year?
7. How would these changes in the cryosphere affect humans? What about animals and sea
life?
Task #3: Broadcast
As a scientist, it is important that you learn to properly convey weather information to the general
public. Your task is to create a 5-minute broadcast describing the effects of global warming on
Earth’s cryosphere using the tasks you have just completed. Be sure to address the following topics
in your broadcast:
1. Describe how climate researchers acquire measurements of sea ice extent.
2. Explain how Arctic sea ice is changing.
3. Describe the rate of change per decade.
4. Show the animation from Task #1.
5. Tell the audience what percent of Earth’s surface is covered by ice.
6. Name the three types of ice that are affected by global warming.
7. Show the four regions discussed in Task #2.
8. Describe how changes in the cryosphere will affect humans, animals, and specifically,
sea life.
Build this broadcast using presentation software (like PowerPoint) and be sure to supplement
everything you discuss with images. Be sure to be both informative and entertaining!
21 This work is licensed under a Creative Commons Attribution-ShareAlike 4.0 International License.
System: The Biosphere
Task #1: Changes in the Biosphere
Click here to read about the effects on wildlife and habitat. Answer the following questions.
1. How does climate change affect wildlife?
2. What are four resources that wildlife depends on to maintain healthy habitats?
3. Name three species that are featured as being affected by climate change.
4. How has climate changed affected the food available for many species?
Task #2: Monitoring the Biosphere
Click Here to learn about how we monitor the biosphere. Answer the following questions.
1. What two parameters are used to monitor the biosphere?
2. Click between the years 1999 and 2008. Do you notice any changes?

22 This work is licensed under a Creative Commons Attribution-ShareAlike 4.0 International License.
Task #3: Broadcast
As a scientist, it is important that you learn to properly convey weather information to the general
public. Your task is to create a 5-minute broadcast describing the effects of global warming on
Earth’s biosphere using the tasks you have just completed. Be sure to address the following topics
in your broadcast:
1. Describe how climate change affects wildlife.
2. Explain the effects of climate change on habitats.
3. Name the four resources that wildlife depends on for healthy habitats.
4. List three species that are largely affected by changes in the climate system.
5. Describe how the food supply for some species changes.
6. Show a map from Task #2 and list the two parameters that are used to monitor the
biosphere.
7. Describe any changes from 1999 to 2008 from the animation in Task #2.
Build this broadcast using presentation software (like PowerPoint) and be sure to supplement
everything you discuss with images. Be sure to be both informative and entertaining!
23 This work is licensed under a Creative Commons Attribution-ShareAlike 4.0 International License.
Take Home Assignment 1
Part 1. Multiple Choice (Circle one)
1. What type of radiation is emitted by the Sun?
a. Infrared
b. Visible
c. Microwave
d. None of the above
2. What type of radiation is emitted from the Earth?
a. Infrared
b. Visible
c. Microwave
d. None of the above
3. At what latitude does the Earth receive the most energy?
a. 0o
b. 5o
c. 30o
d. 60o
4. Which of the following is the main driver of our climate system?
a. Distributions of land and ocean
b. The ozone layer
c. Ocean currents
d. Energy from the Sun
5. What is albedo?
a. The fraction of incoming sunlight that reaches Earth’s surface
b. The fraction of incoming sunlight that is trapped by greenhouse gases
c. The percentage of incoming sunlight that is reflected
d. The percentage of incoming sunlight that is absorbed by clouds
24 This work is licensed under a Creative Commons Attribution-ShareAlike 4.0 International License.
Part 2. Matching (Circle one) 1
Instructions: Determine whether changes in the following parameters cause the earth to warm or
cool, or whether the overall effects remain uncertain.
1. More Sun Spots Warm Cool Uncertain
2. Higher Albedo (Earth) Warm Cool Uncertain
3. Less CO2 Warm Cool Uncertain
4. More Clouds Warm Cool Uncertain
5. Less Aerosols Warm Cool Uncertain
6. More Water Vapor Warm Cool Uncertain
7. More Volcanic Eruptions Warm Cool Uncertain

25 This work is licensed under a Creative Commons Attribution-ShareAlike 4.0 International License.
Part 3. Greenhouse Gas Concentrations 4, 5
Instructions: Using the plot below, which shows the concentration of carbon dioxide, answer
the following questions.
Source
1. What is the current concentration of carbon dioxide in parts per million?
2. Looking at the plot and using your knowledge about greenhouse gases, what can you
infer about how the global average temperature has changed since 1950?
3. How do greenhouse gases such as CO2 cause climate change?
4. What has caused this disruption in carbon cycle?
26 This work is licensed under a Creative Commons Attribution-ShareAlike 4.0 International License.
5. What are potential effects of enhanced carbon dioxide levels in each of Earth’s systems?
Atmosphere:
Hydrosphere:
Cryosphere:
Biosphere:
6. List three things that humans can do to reduce their carbon footprint.
1. ________________________________________________
2. ________________________________________________
3. ________________________________________________
27 This work is licensed under a Creative Commons Attribution-ShareAlike 4.0 International License.
Student Evaluation 4
Instructions: After completing the lesson on climate, please have the students answer the
following questions.
1. Which of the following is not a mechanism to change the global average temperature?
a. Changing seasons
b. Changing solar energy output
c. Changing Earth’s albedo
d. Changing the composition of the atmosphere
2. Earth has warmed by _____ since 1750.
a. 0oC
b. 1oC
c. 5oC
d. 20oC
3. Current carbon dioxide levels have exceeded _______ parts per million.
a. 100
b. 200
c. 300
d. 400
4. Objects with a high albedo __________ solar radiation.
a. absorb
b. reflect
c. reemit
d. refract
5. Which greenhouse gas is most abundant in Earth’s atmosphere?
a. Carbon dioxide
b. Methane
c. Water vapor
d. Ozone
6. Change in the solar energy output is responsible for global warming. T F
7. Volcanoes have a temporary cooling effect on the global climate. T F
8. Understanding the carbon cycle in the atmosphere and ocean is essential for estimating
the effects that carbon dioxide has on our climate system. T F
28 This work is licensed under a Creative Commons Attribution-ShareAlike 4.0 International License.
9. Briefly explain the difference between weather and climate.
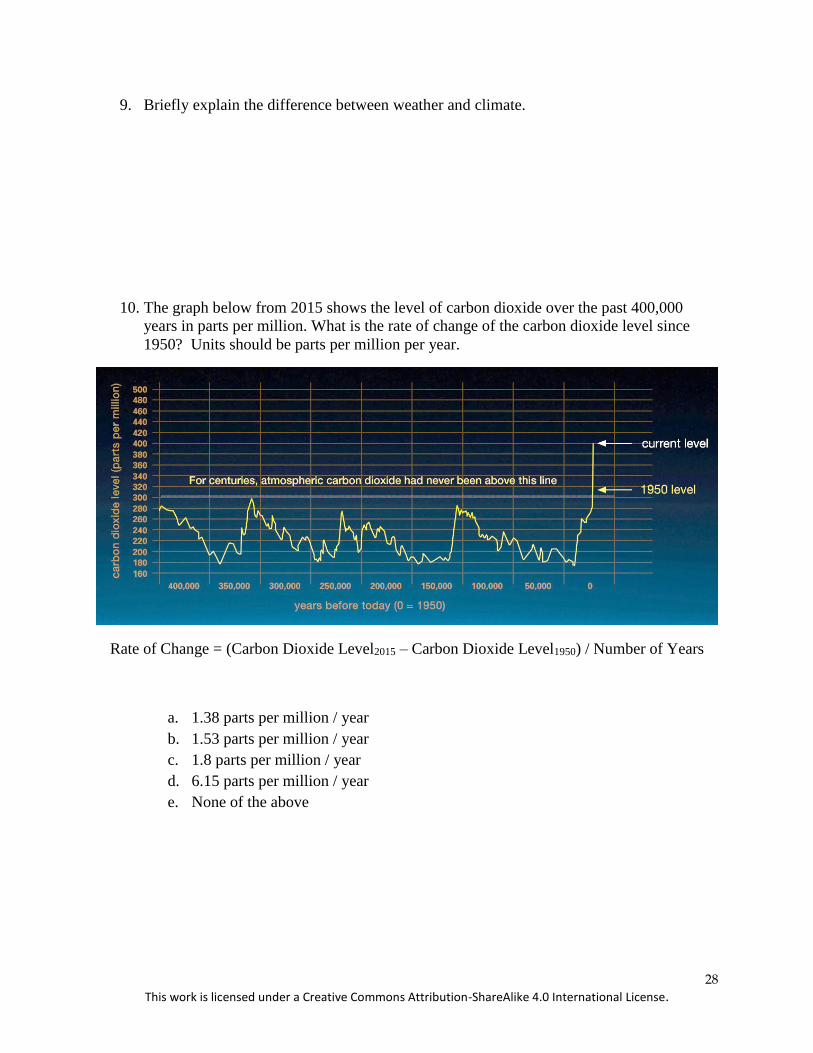
10. The graph below from 2015 shows the level of carbon dioxide over the past 400,000
years in parts per million. What is the rate of change of the carbon dioxide level since
1950? Units should be parts per million per year.
Rate of Change = (Carbon Dioxide Level2015 – Carbon Dioxide Level1950) / Number of Years
a. 1.38 parts per million / year
b. 1.53 parts per million / year
c. 1.8 parts per million / year
d. 6.15 parts per million / year
e. None of the above
29 This work is licensed under a Creative Commons Attribution-ShareAlike 4.0 International License.
Common Core State Standards (CCSS) Initiative
To learn more, visit http://www.corestandards.org
Next Generation Science Standards (NGSS)
To learn more, visit http://www.nextgenscience.org
Climate Literacy Standards
To learn more, visit http://oceanservice.noaa.gov/education/literacy/climate_literacy.pdf
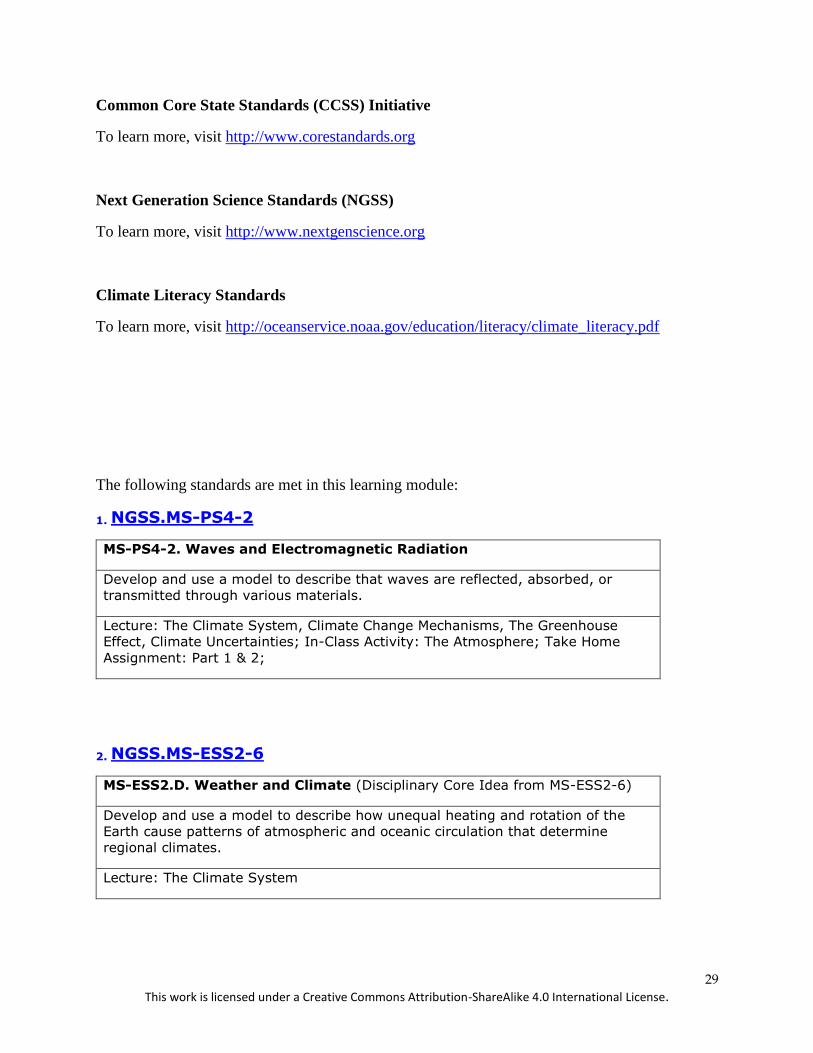
The following standards are met in this learning module:
1. NGSS.MS-PS4-2
MS-PS4-2. Waves and Electromagnetic Radiation
Develop and use a model to describe that waves are reflected, absorbed, or
transmitted through various materials.
Lecture: The Climate System, Climate Change Mechanisms, The Greenhouse
Effect, Climate Uncertainties; In-Class Activity: The Atmosphere; Take Home
Assignment: Part 1 & 2;
2. NGSS.MS-ESS2-6
MS-ESS2.D. Weather and Climate (Disciplinary Core Idea from MS-ESS2-6)
Develop and use a model to describe how unequal heating and rotation of the
Earth cause patterns of atmospheric and oceanic circulation that determine
regional climates.
Lecture: The Climate System
30 This work is licensed under a Creative Commons Attribution-ShareAlike 4.0 International License.
3. NGSS.MS-ESS2.5
MS-ESS2-5. Weather and Climate
Provide evidence for air pressure systems and resulting weather conditions.
Lecture: The Climate System
4. NGSS.MS-ESS3-5
MS-ESS3-5. Weather & Climate
Ask questions to clarify evidence of the factors that have caused the rise in
global temperatures over the past century.
Lecture: Climate Change Mechanisms, The Greenhouse Effect, Climate
Uncertainties, Global Warming; Pre-Class Activity; In-Class Activity: The
Atmosphere; Take Home Assignment: Part 3; Student Evaluation
5. NGSS.MS-ESS3-3
MS-ESS3-3. Human Impacts
Apply scientific principles to design a method for monitoring and minimizing a
human impact on the environment.
Pre-Class Activity: Supplemental Activity; In-Class Activity; Take Home
Assignment: Part 3
6. CCSS.ELA-LITERACY.RST.6-8.8
Grade 8: Science and Technical Subjects
Distinguish among facts, reasoned judgment based on research findings, and
speculation in a text.
Take Home Assignment: Part 2
31 This work is licensed under a Creative Commons Attribution-ShareAlike 4.0 International License.
7. CCSS.MATH.CONTENT.7.NS.A.1.c.d
Grade 7: The Number System
Apply properties of operations as strategies to add, subtract, multiply, and
divide rational numbers.
In-Class Activity:
8. CCSS.ELA-LITERACY.RST.6-8.4
Grade 6-8: Science and Technical Subjects
Determine the meaning of symbols, key terms, and other domain-specific
words and phrases as they are used in a specific science or technical context
relevant to grades 6-8 texts and topics.
Lectures:
9. CCSS.ELA-LITERACY.RST.6-8.7
Grade 6-8: Science and Technical Subjects
Integrate quantitative or technical information expressed in words in a text
with a version of that information expressed visually (e.g., in a flowchart,
diagram, model, graph, or table).
Video lectures