Embed Size (px)
Citation preview
COALMOD World
Global Coal-Phase-Out and the
International Coal Market:
A Focus on Demand-side Policies
in India
Ivo Kafemann, Franziska Holz, Casimir Lorenz, Roman Mendelevitch,
Pao-Yu Oei, Tim Scherwath
Vienna, 06.09.2017
Agenda
1. Global Coal Perspectives
2. Coal in India
3. Reference Scenarios
4. Model Structure
5. Results
6. Conclusion
Vienna, 06.09.2017A Focus on Demand-side and Supply-side Policies in India2
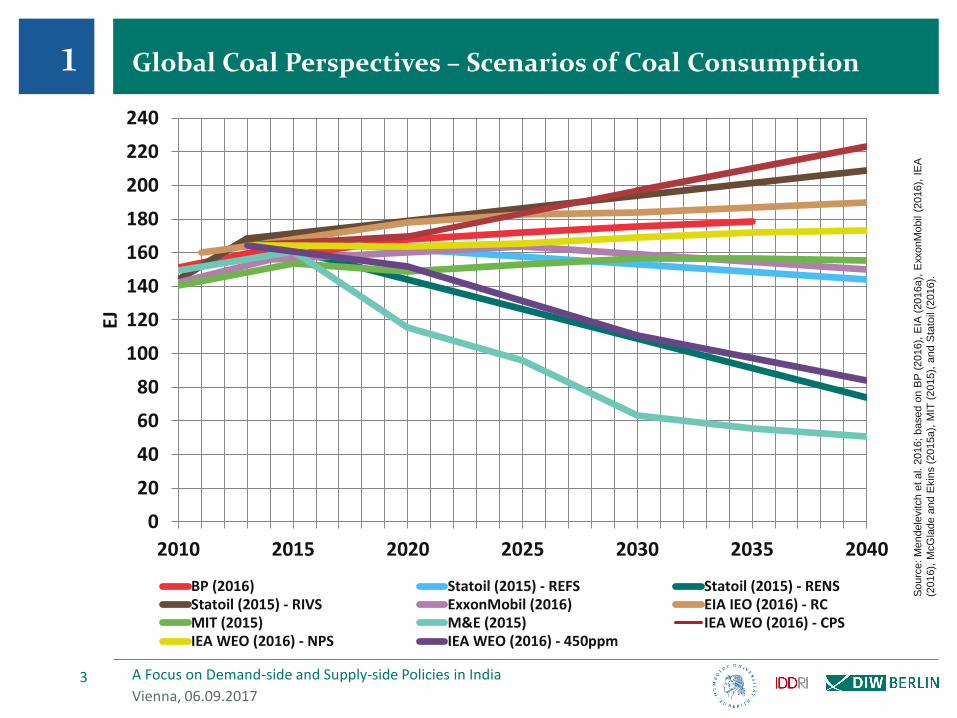
Global Coal Perspectives – Scenarios of Coal Consumption
Sourc
e:
Mendele
vitch e
t al. 2
016;
based o
n B
P (
2016),
EIA
(2016a),
ExxonM
obil
(2016),
IE
A
(2016),
McG
lade
and E
kin
s (
2015a),
MIT
(2015),
and S
tato
il (2
016).
Vienna, 06.09.2017
A Focus on Demand-side and Supply-side Policies in India3
0
20
40
60
80
100
120
140
160
180
200
220
240
2010 2015 2020 2025 2030 2035 2040
EJ
BP (2016) Statoil (2015) - REFS Statoil (2015) - RENSStatoil (2015) - RIVS ExxonMobil (2016) EIA IEO (2016) - RCMIT (2015) M&E (2015) IEA WEO (2016) - CPSIEA WEO (2016) - NPS IEA WEO (2016) - 450ppm
1
Global Coal Perspectives – Scenarios of Coal Consumption
Vienna, 06.09.2017A Focus on Demand-side and Supply-side Policies in India4
• Spread of projections illustrates uncertainty about future
coal consumption
• Major drivers for differences in scenarios:
• Potential of renewable energy sources and storage
• structural changes in the energy system (e.g. higher
electricity demand due to sector coupling)
• CCTS employment
• Macro-economic trends and total energy demand
• Policy measures (e.g. carbon price)
1
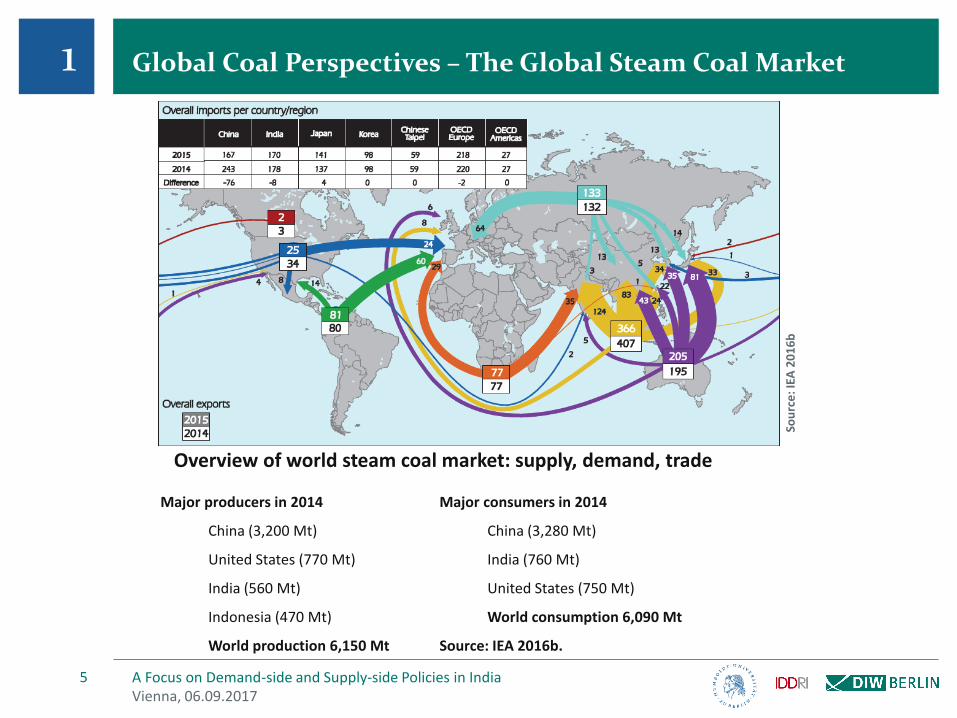
Global Coal Perspectives – The Global Steam Coal Market
Vienna, 06.09.2017A Focus on Demand-side and Supply-side Policies in India5
Sou
rce
: IEA
20
16
b
Major producers in 2014 Major consumers in 2014
China (3,200 Mt) China (3,280 Mt)
United States (770 Mt) India (760 Mt)
India (560 Mt) United States (750 Mt)
Indonesia (470 Mt) World consumption 6,090 Mt
World production 6,150 Mt Source: IEA 2016b.
1
Overview of world steam coal market: supply, demand, trade
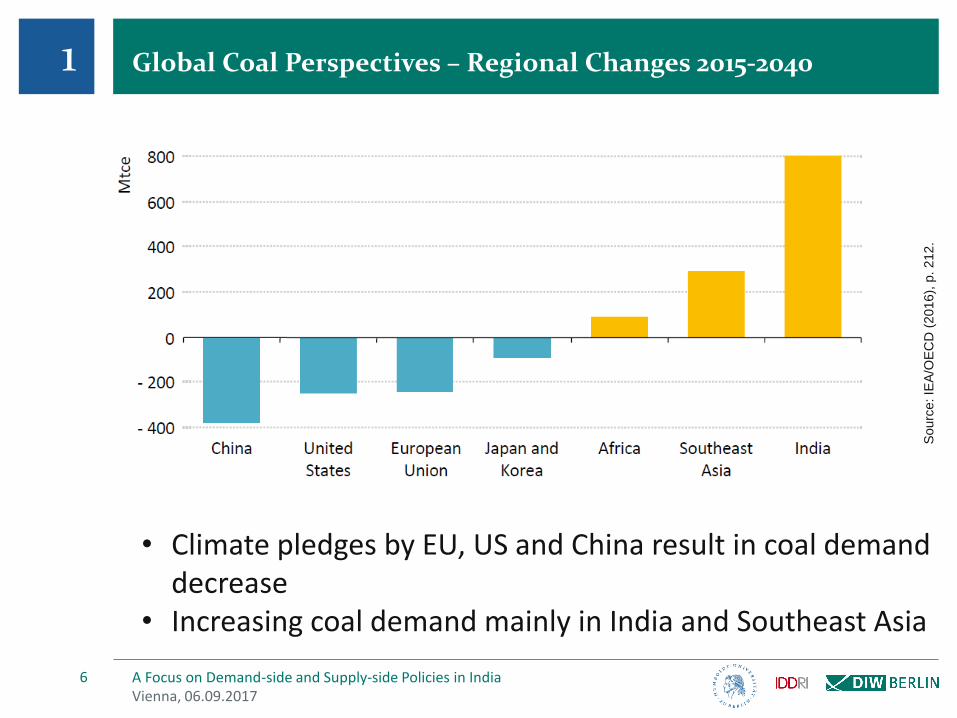
Global Coal Perspectives – Regional Changes 2015-2040
Vienna, 06.09.2017A Focus on Demand-side and Supply-side Policies in India6
Sourc
e: IE
A/O
EC
D (
2016),
p. 212.
• Climate pledges by EU, US and China result in coal demanddecrease
• Increasing coal demand mainly in India and Southeast Asia
1
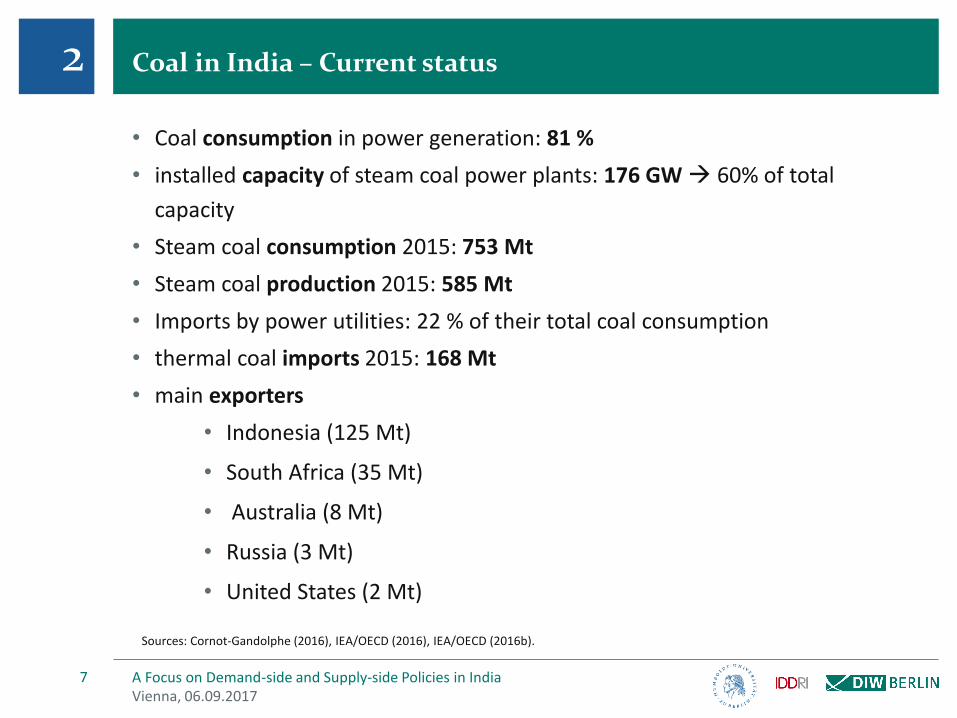
Coal in India – Current status
• Coal consumption in power generation: 81 %
• installed capacity of steam coal power plants: 176 GW 60% of total
capacity
• Steam coal consumption 2015: 753 Mt
• Steam coal production 2015: 585 Mt
• Imports by power utilities: 22 % of their total coal consumption
• thermal coal imports 2015: 168 Mt
• main exporters
• Indonesia (125 Mt)
• South Africa (35 Mt)
• Australia (8 Mt)
• Russia (3 Mt)
• United States (2 Mt)
Vienna, 06.09.2017A Focus on Demand-side and Supply-side Policies in India7
Sources: Cornot-Gandolphe (2016), IEA/OECD (2016), IEA/OECD (2016b).
2
Coal in India – Domestic Policies
Vienna, 06.09.2017A Focus on Demand-side and Supply-side Policies in India8
2
• „ […], it is more than ever environmental policies that determine
the evolution of regional coal demand.” (IEA (2016), p. 212)
• Specific policies also affect international steam coal trade
Vienna, 06.09.2017A Focus on Demand-side and Supply-side Policies in India9
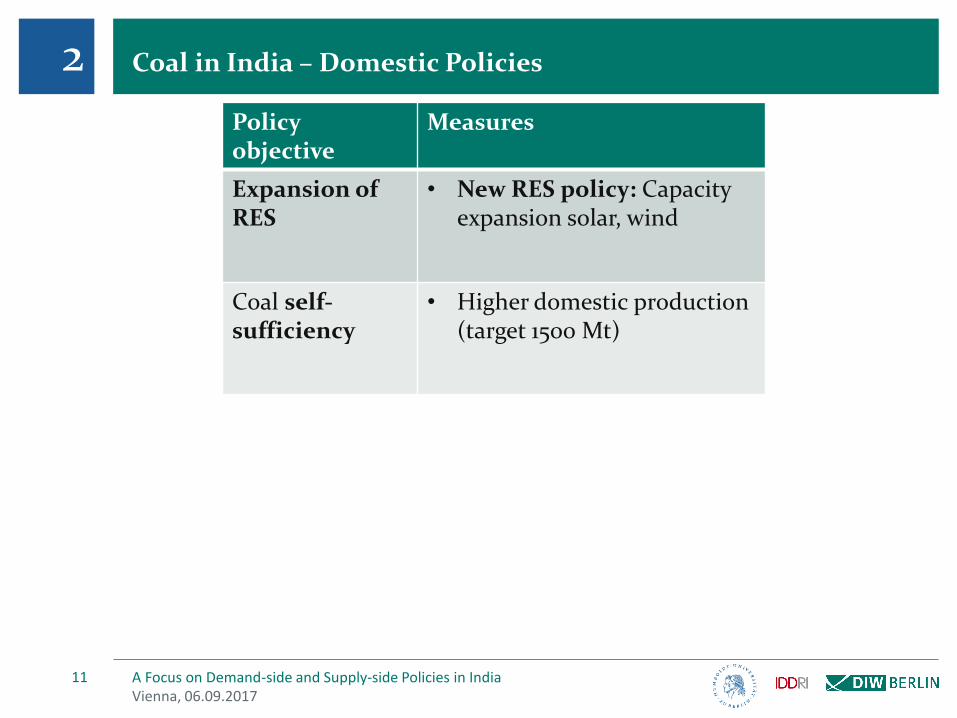
2 Coal in India – Domestic Policies
Policyobjective
Measures
Vienna, 06.09.2017A Focus on Demand-side and Supply-side Policies in India10
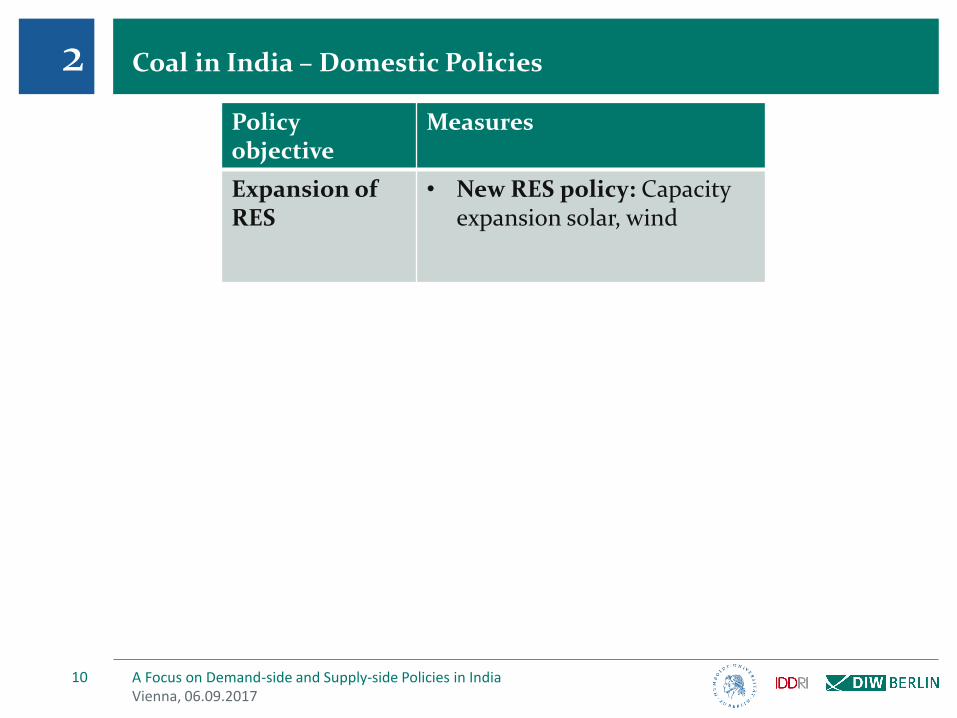
2 Coal in India – Domestic Policies
Policyobjective
Measures
Expansion ofRES
• New RES policy: Capacityexpansion solar, wind
Vienna, 06.09.2017A Focus on Demand-side and Supply-side Policies in India11
2 Coal in India – Domestic Policies
Policyobjective
Measures
Expansion ofRES
• New RES policy: Capacityexpansion solar, wind
Coal self-sufficiency
• Higher domestic production(target 1500 Mt)
Vienna, 06.09.2017A Focus on Demand-side and Supply-side Policies in India12
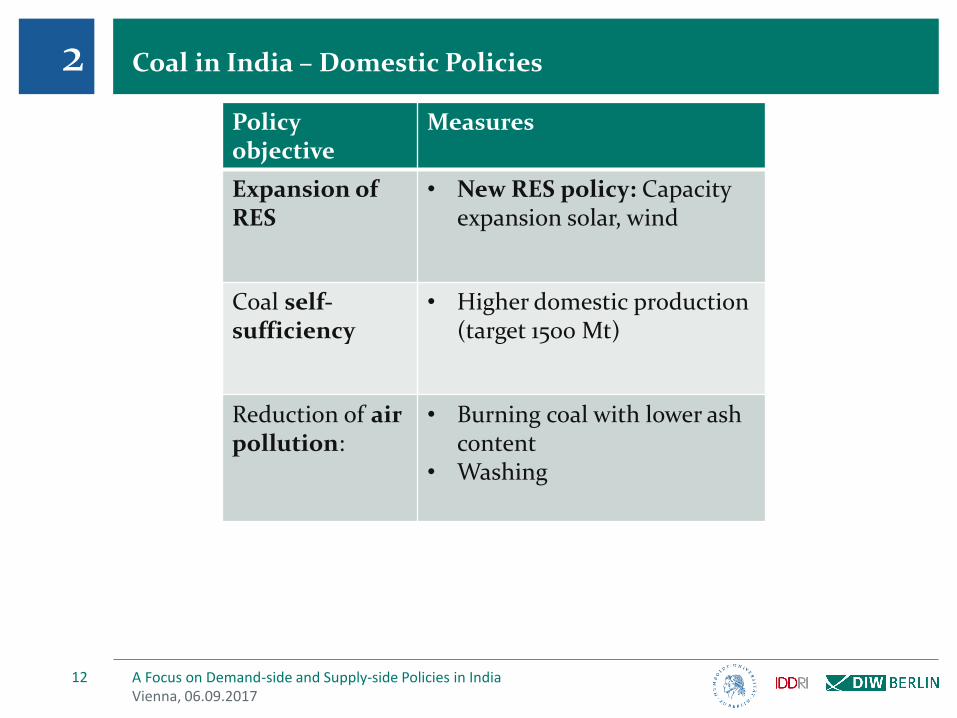
2 Coal in India – Domestic Policies
Policyobjective
Measures
Expansion ofRES
• New RES policy: Capacityexpansion solar, wind
Coal self-sufficiency
• Higher domestic production(target 1500 Mt)
Reduction of airpollution:
• Burning coal with lower ash content
• Washing
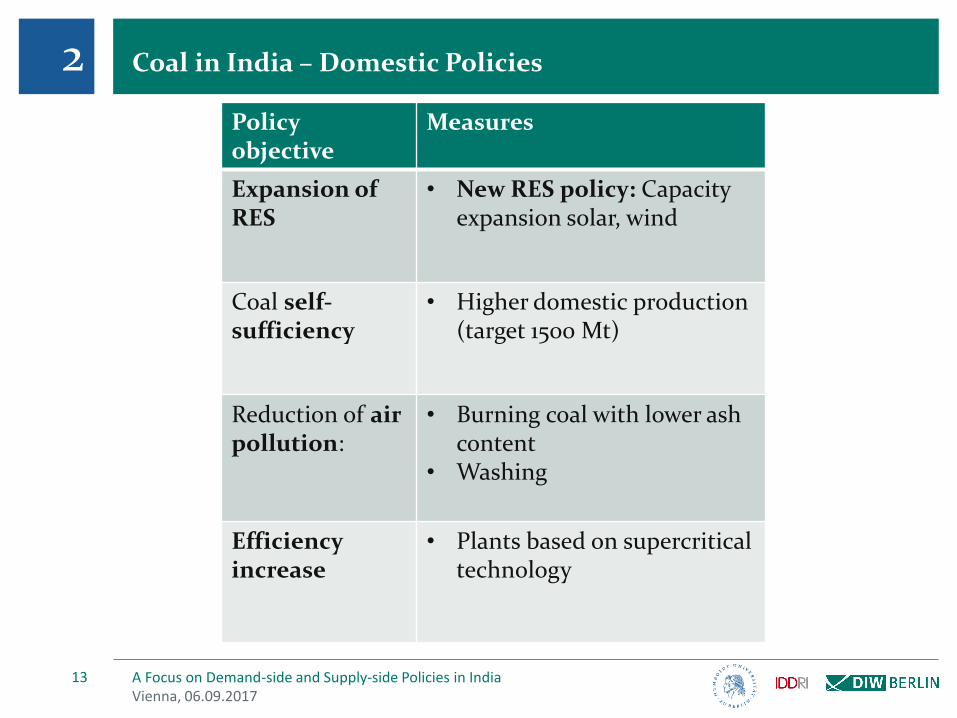
Coal in India – Domestic Policies
Policyobjective
Measures
Expansion ofRES
• New RES policy: Capacityexpansion solar, wind
Coal self-sufficiency
• Higher domestic production(target 1500 Mt)
Reduction of airpollution:
• Burning coal with lower ash content
• Washing
Efficiencyincrease
• Plants based on supercriticaltechnology
Vienna, 06.09.2017A Focus on Demand-side and Supply-side Policies in India13
2
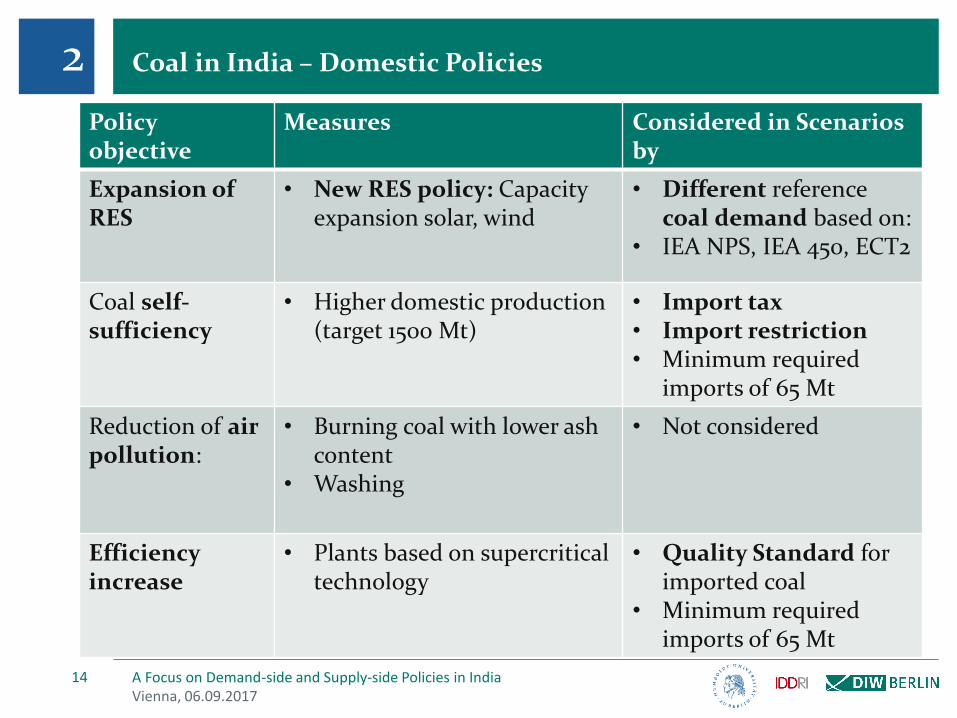
Coal in India – Domestic Policies
Policyobjective
Measures Considered in Scenarios by
Expansion ofRES
• New RES policy: Capacityexpansion solar, wind
• Different referencecoal demand based on:
• IEA NPS, IEA 450, ECT2
Coal self-sufficiency
• Higher domestic production(target 1500 Mt)
• Import tax• Import restriction• Minimum required
imports of 65 Mt
Reduction of airpollution:
• Burning coal with lower ash content
• Washing
• Not considered
Efficiencyincrease
• Plants based on supercriticaltechnology
• Quality Standard forimported coal
• Minimum requiredimports of 65 Mt
Vienna, 06.09.2017A Focus on Demand-side and Supply-side Policies in India14
2
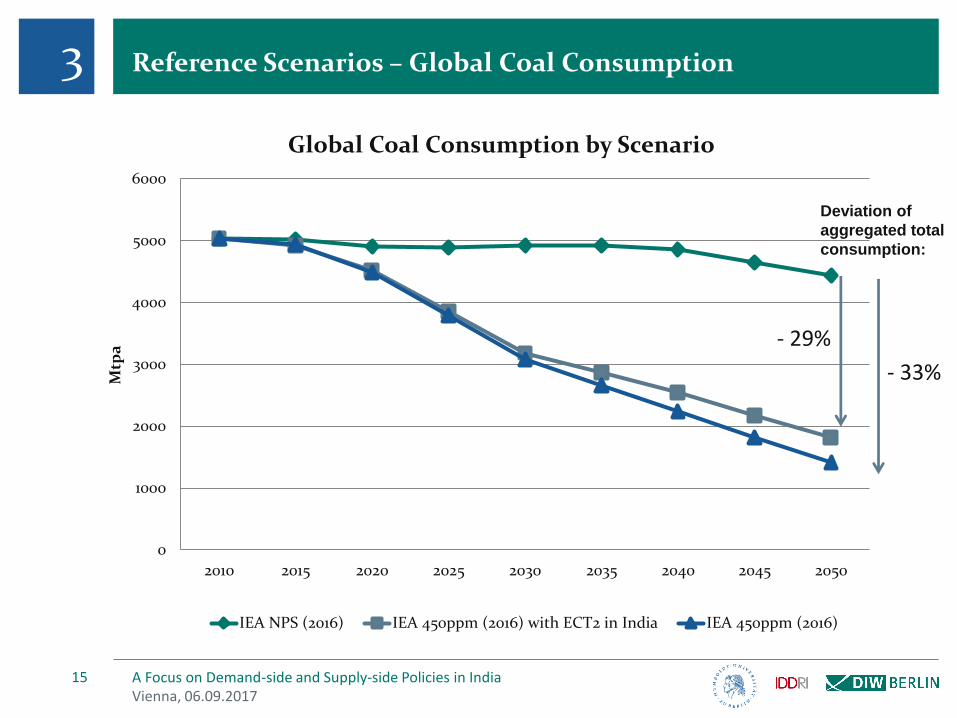
Reference Scenarios – Global Coal Consumption
Vienna, 06.09.2017A Focus on Demand-side and Supply-side Policies in India15
0
1000
2000
3000
4000
5000
6000
2010 2015 2020 2025 2030 2035 2040 2045 2050
Mtp
a
Global Coal Consumption by Scenario
IEA NPS (2016) IEA 450ppm (2016) with ECT2 in India IEA 450ppm (2016)
- 29%
3
- 33%
Deviation of
aggregated total
consumption:
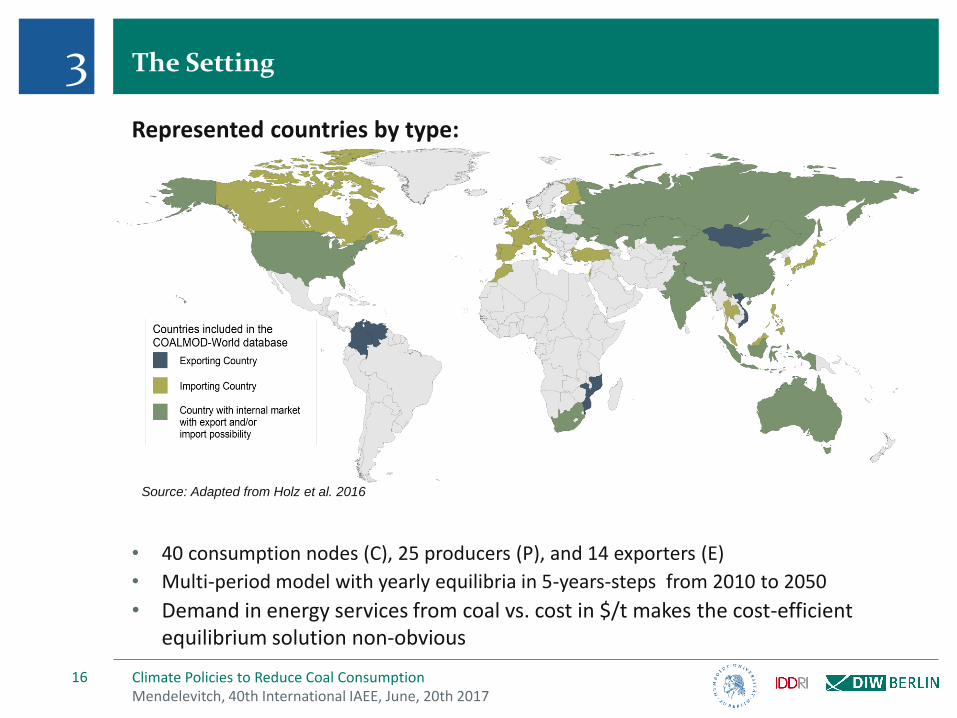
Represented countries by type:
• 40 consumption nodes (C), 25 producers (P), and 14 exporters (E)
• Multi-period model with yearly equilibria in 5-years-steps from 2010 to 2050
• Demand in energy services from coal vs. cost in $/t makes the cost-efficient equilibrium solution non-obvious
The Setting
Mendelevitch, 40th International IAEE, June, 20th 2017Climate Policies to Reduce Coal Consumption16
3
Source: Adapted from Holz et al. 2016
Vienna, 06.09.2017A Focus on Demand-side and Supply-side Policies in India18
5
Results
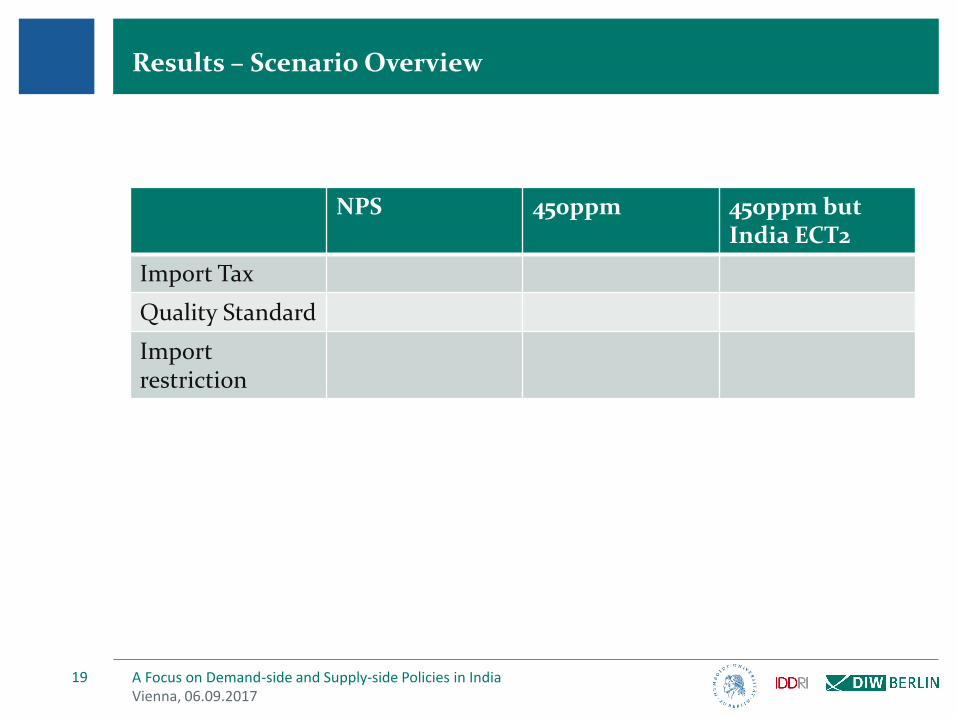
Results – Scenario Overview
NPS 450ppm 450ppm but India ECT2
Import Tax
Quality Standard
Import restriction
Vienna, 06.09.2017A Focus on Demand-side and Supply-side Policies in India19
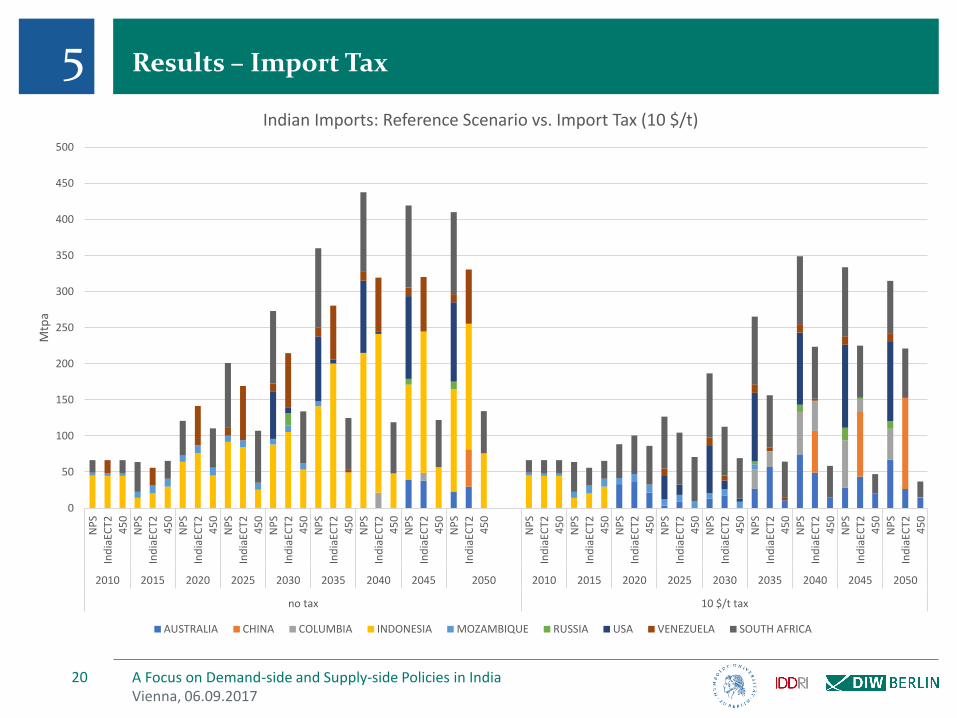
Results – Import Tax
Vienna, 06.09.2017A Focus on Demand-side and Supply-side Policies in India20
0
50
100
150
200
250
300
350
400
450
500
NP
S
Ind
iaEC
T2
45
0
NP
S
Ind
iaEC
T2
45
0
NP
S
Ind
iaEC
T2
45
0
NP
S
Ind
iaEC
T2
45
0
NP
S
Ind
iaEC
T2
45
0
NP
S
Ind
iaEC
T2
45
0
NP
S
Ind
iaEC
T2
45
0
NP
S
Ind
iaEC
T2
45
0
NP
S
Ind
iaEC
T2
45
0
NP
S
Ind
iaEC
T2
45
0
NP
S
Ind
iaEC
T2
45
0
NP
S
Ind
iaEC
T2
45
0
NP
S
Ind
iaEC
T2
45
0
NP
S
Ind
iaEC
T2
45
0
NP
S
Ind
iaEC
T2
45
0
NP
S
Ind
iaEC
T2
45
0
NP
S
Ind
iaEC
T2
45
0
NP
S
Ind
iaEC
T2
45
0
2010 2015 2020 2025 2030 2035 2040 2045 2050 2010 2015 2020 2025 2030 2035 2040 2045 2050
no tax 10 $/t tax
Mtp
a
Indian Imports: Reference Scenario vs. Import Tax (10 $/t)
AUSTRALIA CHINA COLUMBIA INDONESIA MOZAMBIQUE RUSSIA USA VENEZUELA SOUTH AFRICA
5
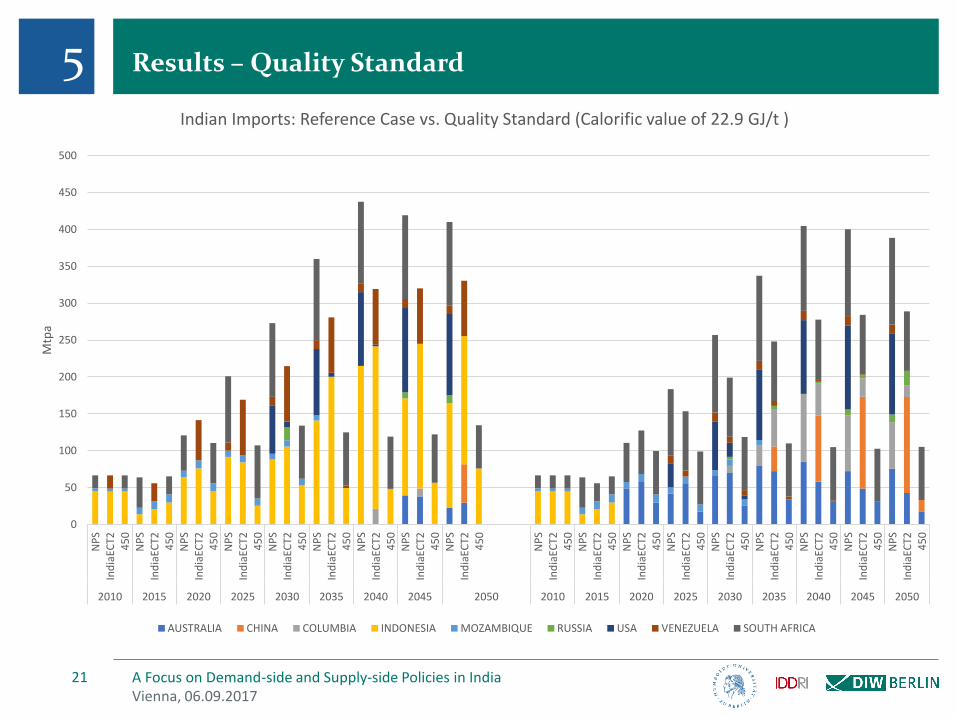
Results – Quality Standard
Vienna, 06.09.2017A Focus on Demand-side and Supply-side Policies in India21
0
50
100
150
200
250
300
350
400
450
500
NP
SIn
dia
ECT2
45
0N
PS
Ind
iaEC
T24
50
NP
SIn
dia
ECT2
45
0N
PS
Ind
iaEC
T24
50
NP
SIn
dia
ECT2
45
0N
PS
Ind
iaEC
T24
50
NP
SIn
dia
ECT2
45
0N
PS
Ind
iaEC
T24
50
NP
SIn
dia
ECT2
45
0
NP
SIn
dia
ECT2
45
0N
PS
Ind
iaEC
T24
50
NP
SIn
dia
ECT2
45
0N
PS
Ind
iaEC
T24
50
NP
SIn
dia
ECT2
45
0N
PS
Ind
iaEC
T24
50
NP
SIn
dia
ECT2
45
0N
PS
Ind
iaEC
T24
50
NP
SIn
dia
ECT2
45
0
2010 2015 2020 2025 2030 2035 2040 2045 2050 2010 2015 2020 2025 2030 2035 2040 2045 2050
Mtp
a
Indian Imports: Reference Case vs. Quality Standard (Calorific value of 22.9 GJ/t )
AUSTRALIA CHINA COLUMBIA INDONESIA MOZAMBIQUE RUSSIA USA VENEZUELA SOUTH AFRICA
5
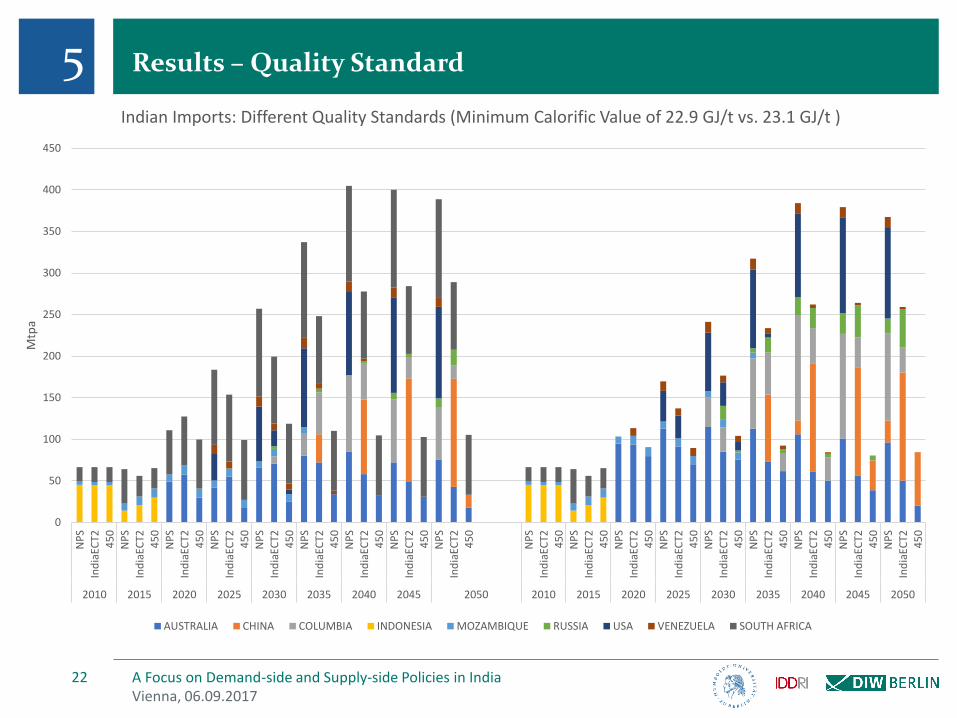
Results – Quality Standard
Vienna, 06.09.2017A Focus on Demand-side and Supply-side Policies in India22
0
50
100
150
200
250
300
350
400
450
NP
S
Ind
iaEC
T2
45
0
NP
S
Ind
iaEC
T24
50
NP
SIn
dia
ECT2
45
0
NP
SIn
dia
ECT2
45
0N
PS
Ind
iaEC
T2
45
0N
PS
Ind
iaEC
T24
50
NP
S
Ind
iaEC
T24
50
NP
SIn
dia
ECT2
45
0N
PS
Ind
iaEC
T24
50
NP
SIn
dia
ECT2
45
0
NP
SIn
dia
ECT2
45
0N
PS
Ind
iaEC
T2
45
0N
PS
Ind
iaEC
T24
50
NP
S
Ind
iaEC
T24
50
NP
SIn
dia
ECT2
45
0
NP
SIn
dia
ECT2
45
0N
PS
Ind
iaEC
T2
45
0N
PS
Ind
iaEC
T24
50
2010 2015 2020 2025 2030 2035 2040 2045 2050 2010 2015 2020 2025 2030 2035 2040 2045 2050
Mtp
a
Indian Imports: Different Quality Standards (Minimum Calorific Value of 22.9 GJ/t vs. 23.1 GJ/t )
AUSTRALIA CHINA COLUMBIA INDONESIA MOZAMBIQUE RUSSIA USA VENEZUELA SOUTH AFRICA
5
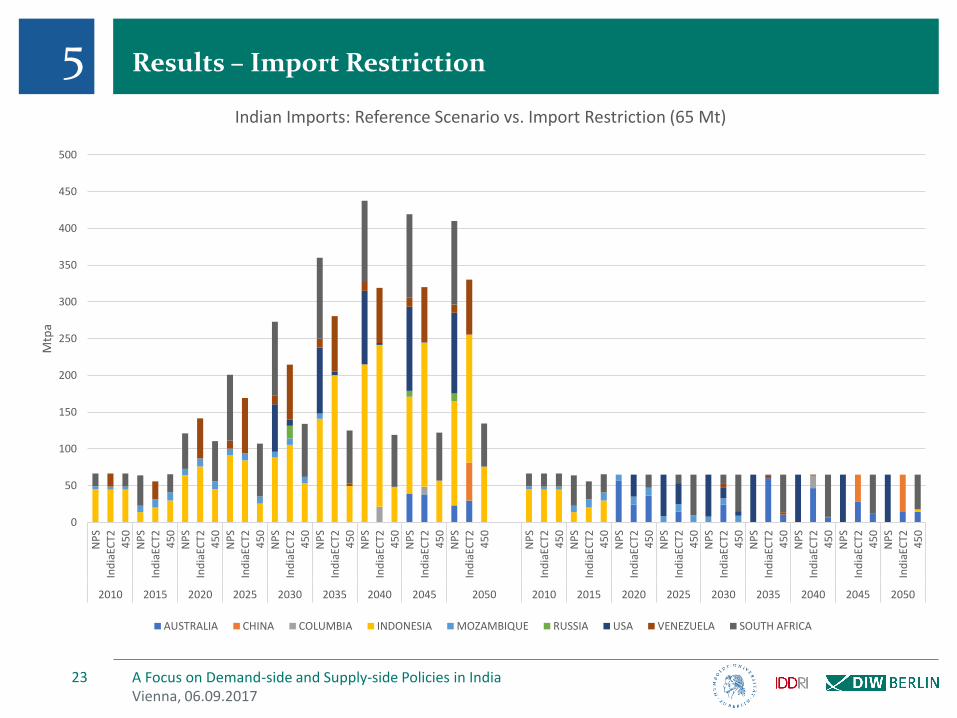
Results – Import Restriction
Vienna, 06.09.2017A Focus on Demand-side and Supply-side Policies in India23
0
50
100
150
200
250
300
350
400
450
500
NP
SIn
dia
ECT2
45
0N
PS
Ind
iaEC
T2
45
0N
PS
Ind
iaEC
T24
50
NP
SIn
dia
ECT2
45
0
NP
SIn
dia
ECT2
45
0N
PS
Ind
iaEC
T24
50
NP
SIn
dia
ECT2
45
0
NP
SIn
dia
ECT2
45
0N
PS
Ind
iaEC
T2
45
0
NP
SIn
dia
ECT2
45
0N
PS
Ind
iaEC
T24
50
NP
SIn
dia
ECT2
45
0N
PS
Ind
iaEC
T2
45
0N
PS
Ind
iaEC
T24
50
NP
SIn
dia
ECT2
45
0
NP
SIn
dia
ECT2
45
0N
PS
Ind
iaEC
T24
50
NP
SIn
dia
ECT2
45
0
2010 2015 2020 2025 2030 2035 2040 2045 2050 2010 2015 2020 2025 2030 2035 2040 2045 2050
Mtp
a
Indian Imports: Reference Scenario vs. Import Restriction (65 Mt)
AUSTRALIA CHINA COLUMBIA INDONESIA MOZAMBIQUE RUSSIA USA VENEZUELA SOUTH AFRICA
5
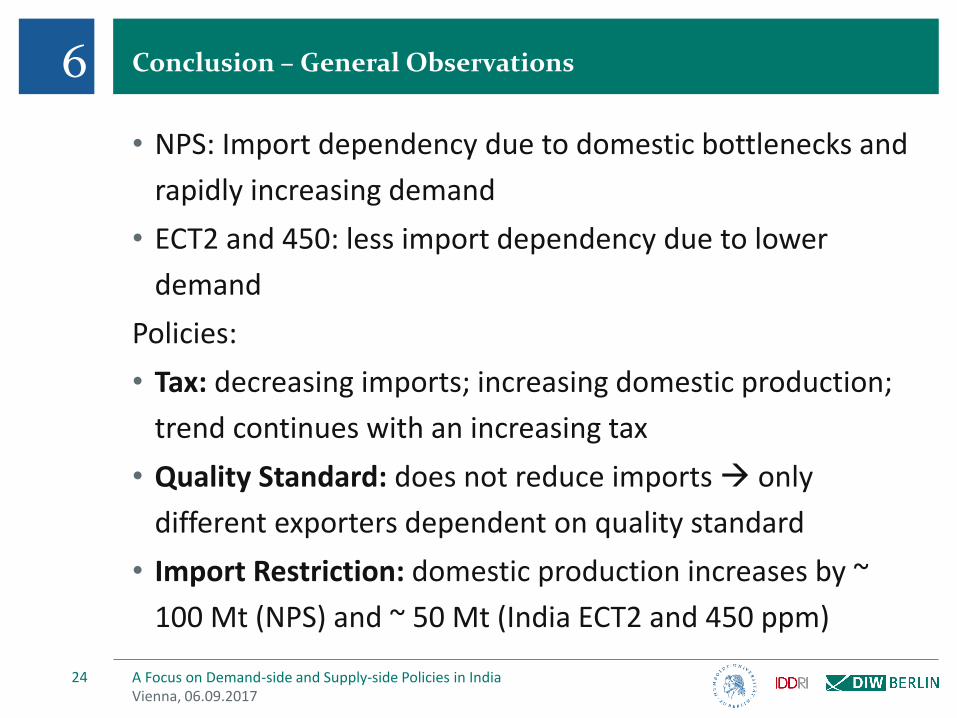
Conclusion – General Observations
• NPS: Import dependency due to domestic bottlenecks and
rapidly increasing demand
• ECT2 and 450: less import dependency due to lower
demand
Policies:
• Tax: decreasing imports; increasing domestic production;
trend continues with an increasing tax
• Quality Standard: does not reduce imports only
different exporters dependent on quality standard
• Import Restriction: domestic production increases by ~
100 Mt (NPS) and ~ 50 Mt (India ECT2 and 450 ppm)
Vienna, 06.09.2017A Focus on Demand-side and Supply-side Policies in India24
6
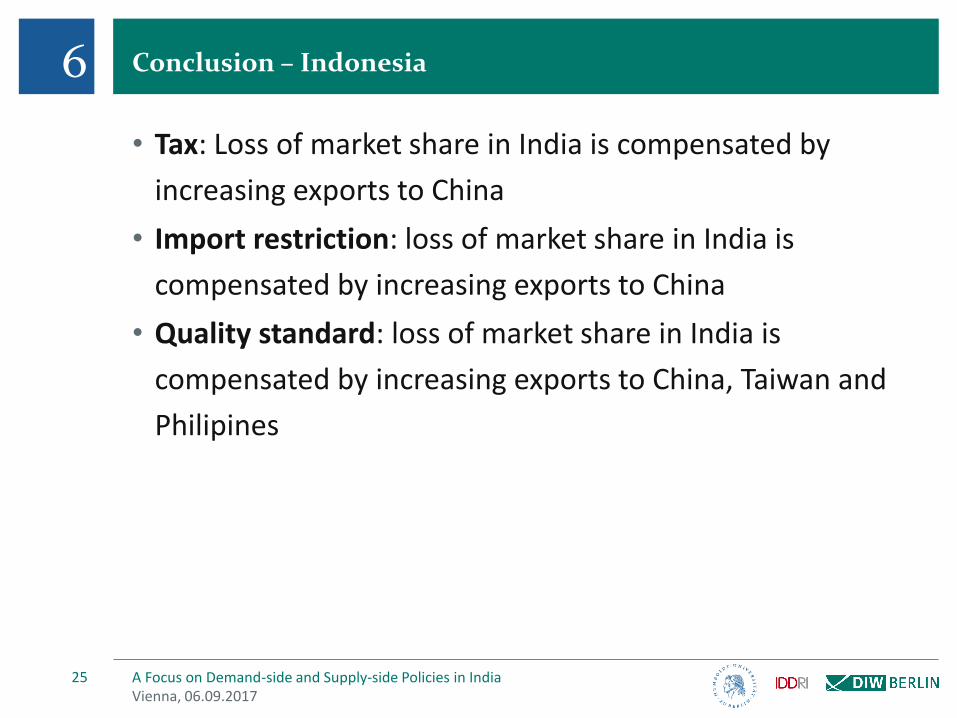
Conclusion – Indonesia
• Tax: Loss of market share in India is compensated by
increasing exports to China
• Import restriction: loss of market share in India is
compensated by increasing exports to China
• Quality standard: loss of market share in India is
compensated by increasing exports to China, Taiwan and
Philipines
Vienna, 06.09.2017A Focus on Demand-side and Supply-side Policies in India25
6
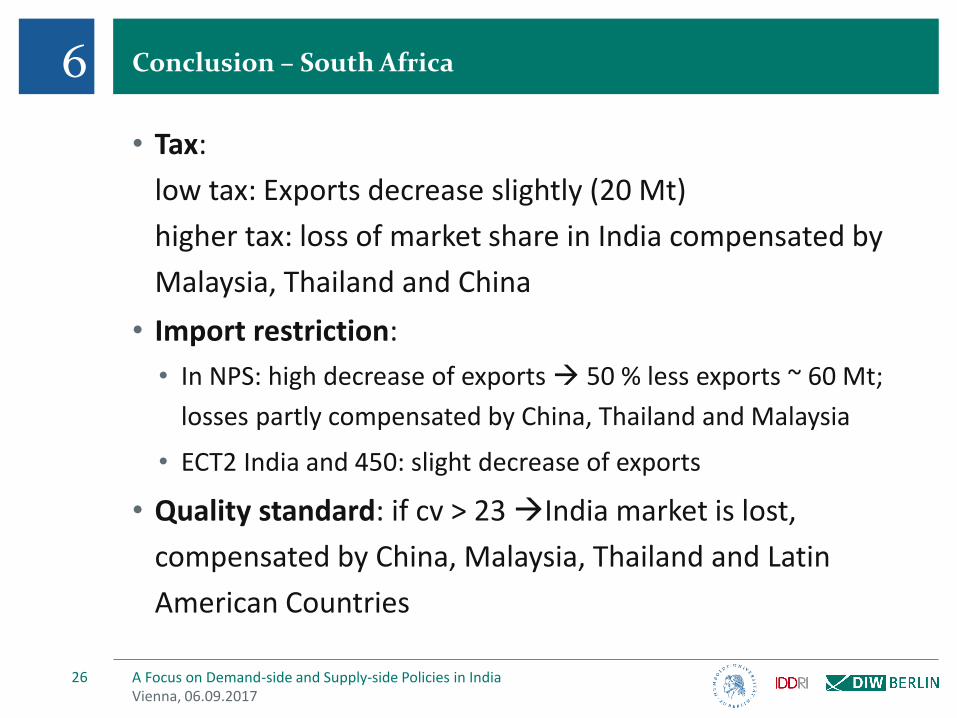
Conclusion – South Africa
• Tax:
low tax: Exports decrease slightly (20 Mt)
higher tax: loss of market share in India compensated by
Malaysia, Thailand and China
• Import restriction:
• In NPS: high decrease of exports 50 % less exports ~ 60 Mt;
losses partly compensated by China, Thailand and Malaysia
• ECT2 India and 450: slight decrease of exports
• Quality standard: if cv > 23 India market is lost,
compensated by China, Malaysia, Thailand and Latin
American Countries
Vienna, 06.09.2017A Focus on Demand-side and Supply-side Policies in India26
6
Vienna, 06.09.2017A Focus on Demand-side and Supply-side Policies in India28
Thank you
Vienna, 06.09.2017A Focus on Demand-side and Supply-side Policies in India29
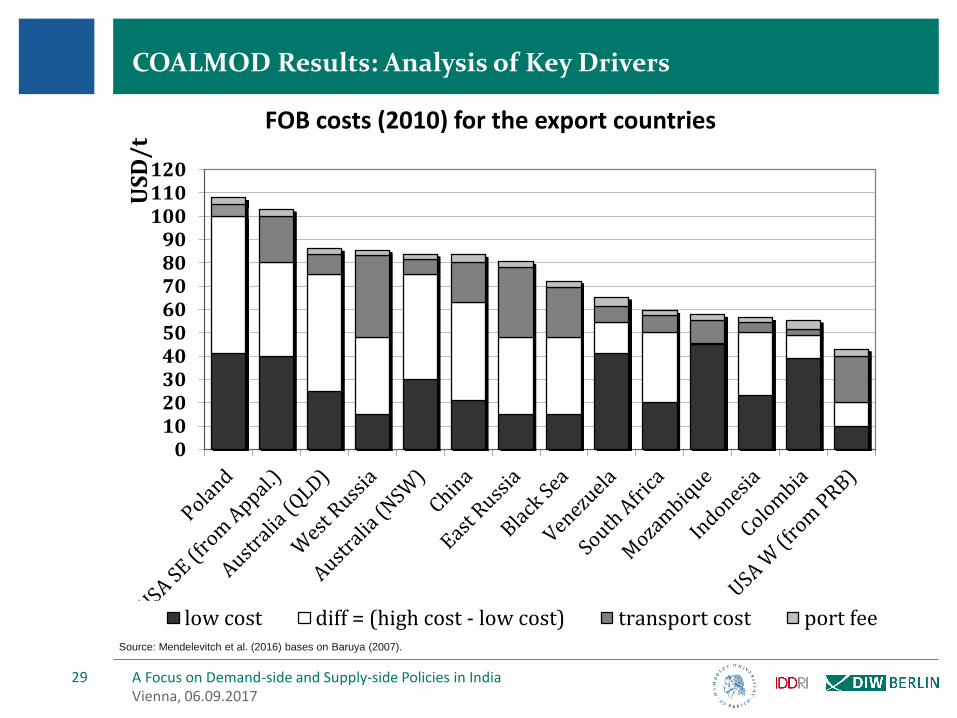
0102030405060708090100110120
USD/t
FOB costs (2010) for the export countries
low cost diff = (high cost - low cost) transport cost port feeSource: Mendelevitch et al. (2016) bases on Baruya (2007).
COALMOD Results: Analysis of Key Drivers
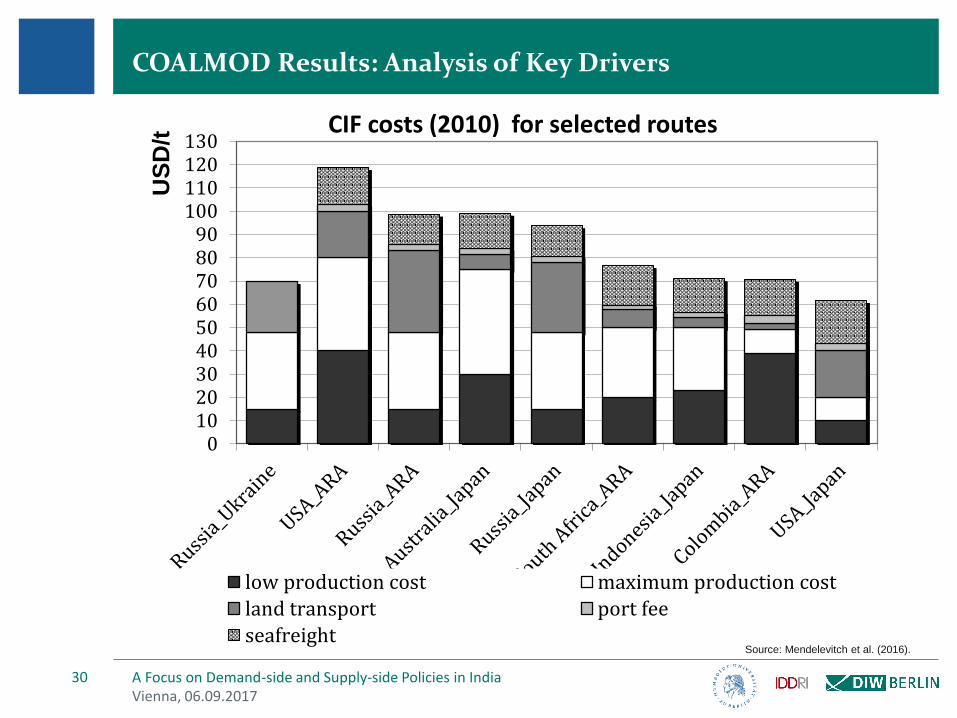
COALMOD Results: Analysis of Key Drivers
Vienna, 06.09.2017A Focus on Demand-side and Supply-side Policies in India30
0102030405060708090
100110120130
US
D/t
CIF costs (2010) for selected routes
low production cost maximum production cost
land transport port fee
seafreightSource: Mendelevitch et al. (2016).
References
Vienna, 06.09.2017A Focus on Demand-side and Supply-side Policies in India31
Adani Mining Pty Ltd (2013): Carmichael Coal Mine and Rail Project SEIS, Report for updated mine project describtionP. Graham, S. Thorpe, and L. Hogan (1999): Non-competitive market behaviour in the international coking coal market, Energy
Economics 21(3), 195-212.C. Haftendorn, F. Holz, C. Kemfert, and C. von Hirschhausen (2013): Global Steam Coal Markets until 2030 – Perspectives on
Production, Trade, and Consumption under Increasing Carbon Constraints. In: R. Fouquet (Ed.) “Handbook on Energy and Climate Change”, 103-122, Edward Elgar Publ.
C. Haftendorn, C. Kemfert, and F. Holz (2012): What about Coal? Interactions between Climate Policies and the Global Steam Coal Market until 2030. Energy Policy 48, 274-283.
C. Haftendorn (2012): Evidence of Market Power in the Atlantic Steam Coal Market Using Oligopoly Models with a Competitive Fringe. DIW Discussion Paper 1185.
C. Haftendorn, F. Holz, and C. von Hirschhausen (2012): The End of Cheap Coal? A Techno-economic Analysis Until 2030 using the COALMOD-World Model. FUEL 102, 305-325.
C. Haftendorn and F. Holz (2010): Modeling and Analysis of the International Steam Coal Trade. The Energy Journal 31 (4), 201-225.
IEA. 2012. Coal Information 2012. Coal information. OECD Publishing. http://www.oecd-ilibrary.org/energy/coal-information-2012_coal-2012-en.
IEA. 2016. World Energy Outlook 2016. Paris, France: International Energy Agency. http://www.oecd-ilibrary.org/energy/world-energy-outlook-2016_weo-2016-en.
F. Holz, C. Haftendorn, R. Mendelevitch, and C. von Hirschhausen (2015): COALMOD-World: A Model to Assess International Coal Markets Through 2030. In: M.C. Thurber and R.K. Morse (Eds.) “Asia and the Global Coal Market”, Cambridge Univ. Press.
R. Mendelevitch (2016): Testing Supply-Side Climate Policies for the Global Steam Coal Market – Can They Curb Coal Consumption?, DIW DP 1604.
R. Mendelevitch, F. Holz, C. von Hirschhausen, C. Haftendorn (2016): A Model of the International Steam Coal Market (COALMOD-World), DIW Data Doc 85.
P.M. Richter, F. Jotzo, and R. Mendelevitch (2015): Market Power Rents and Climate Change Mitigation: A Rationale for Coal Taxes?, DIW DP 1471.
J. Trueby (2013): Strategic Behaviour in International Metallurgical Coal Markets, Energy Economics, vol. 36(C), 147-157. J. Trueby and M. Paulus (2010): Have Prices of Internationally Traded Steam Coal been Marginal Cost Based? EWI Working Paper
2010-5.J. Trueby and M. Paulus (2012): Market Structure Scenarios in International Steam Coal Trade, The Energy Journal 33(3), 91-123.