Embed Size (px)
Citation preview
Global Competitiveness, Market Demand
and the US Plastics Processing Industry
Platts Asian Petrochemicals Markets Conference 2016
Grand Hyatt Pudong
Shanghai, China
August 30-31, 2016
Presented By:
Michael D. Taylor
Vice President, International Affairs and Trade
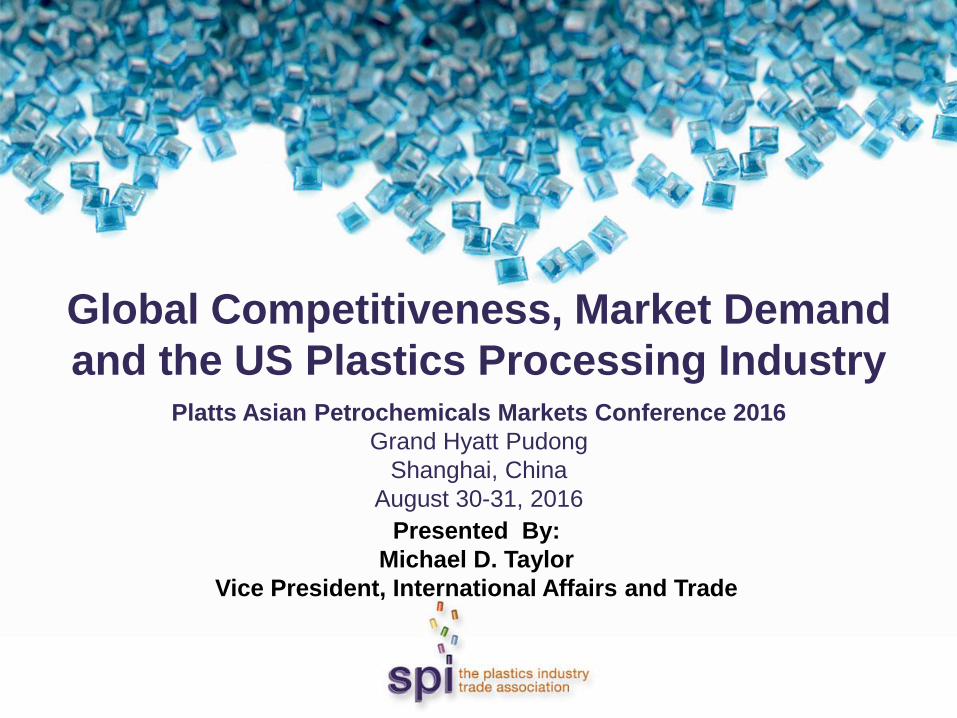
Agenda Introduction to SPI
Shale Gas – A Game Changer
Overview of the U.S. Plastics Industry
Trade Flows in Plastics
SPI Plastics Market Watch
Key End Market Demand
Global Manufacturing Competitiveness
Q&A
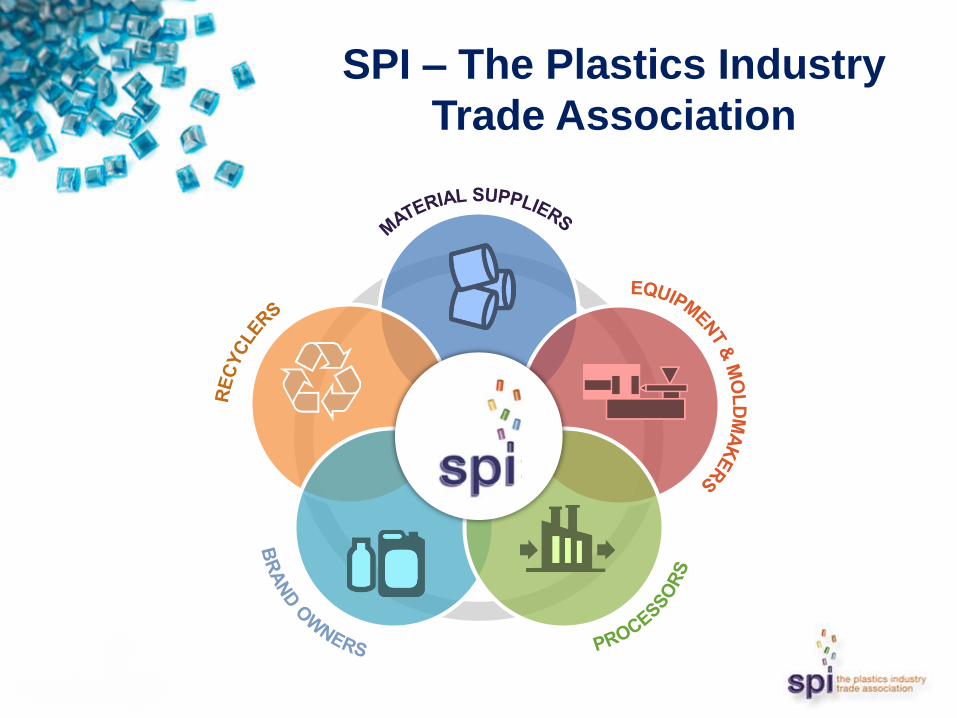
SPI – The Plastics Industry
Trade Association
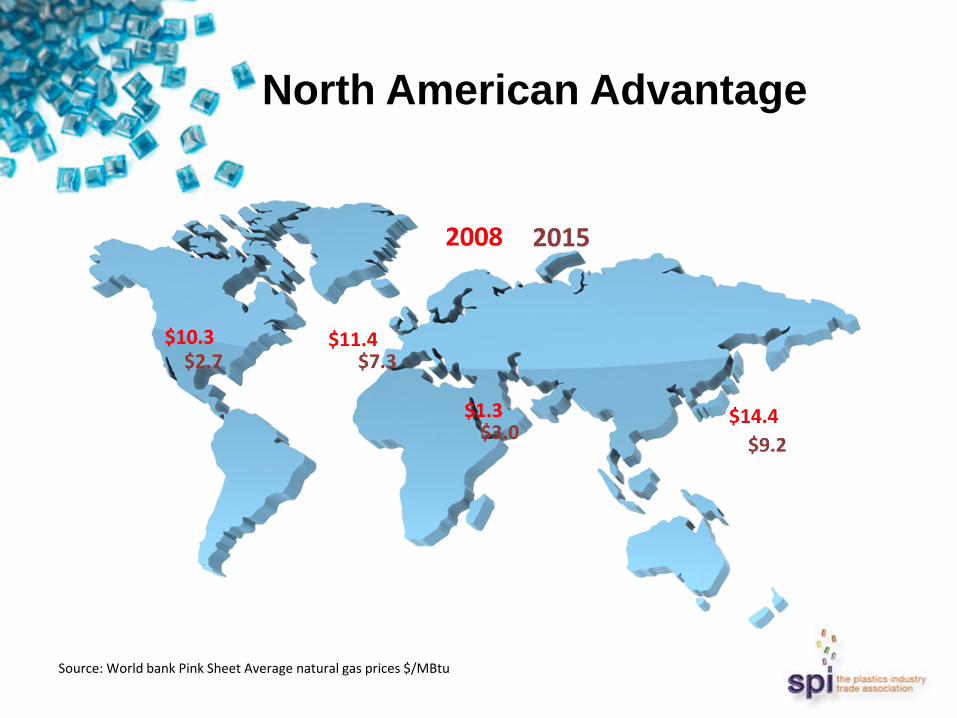
North American Advantage
Source: World bank Pink Sheet Average natural gas prices $/MBtu
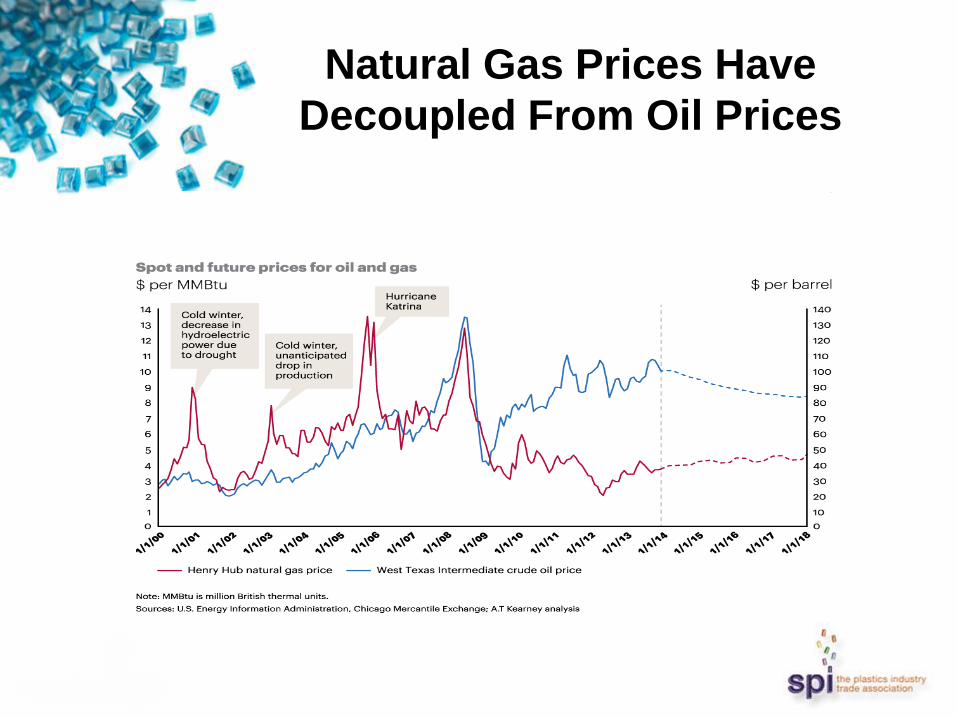
Natural Gas Prices Have
Decoupled From Oil Prices
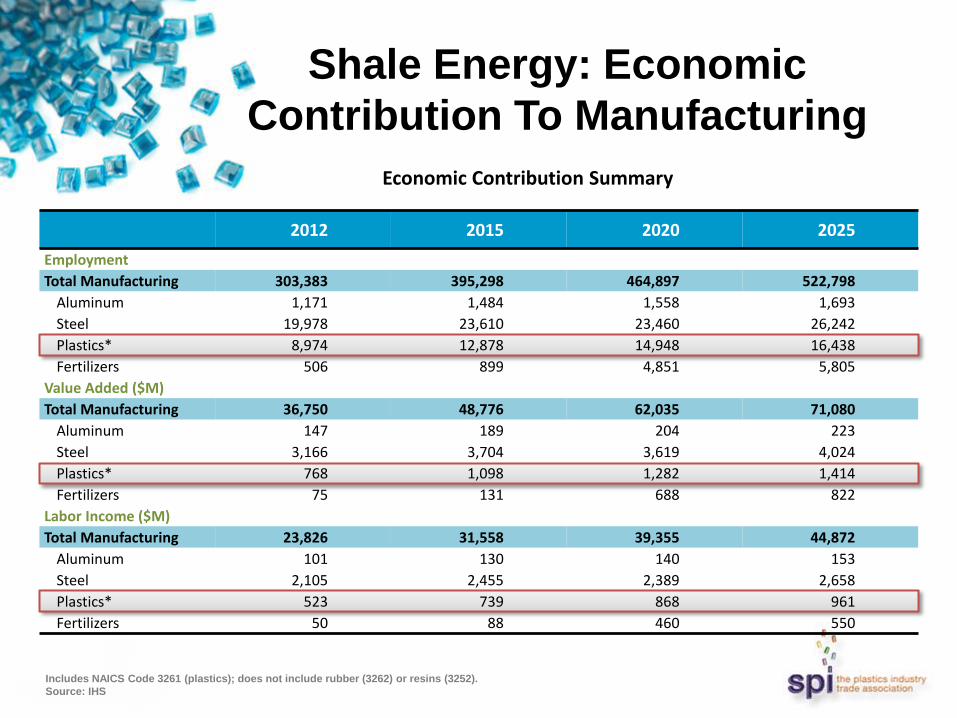
Shale Energy: Economic
Contribution To Manufacturing
2012 2015 2020 2025
Employment
Total Manufacturing 303,383 395,298 464,897 522,798
Aluminum 1,171 1,484 1,558 1,693
Steel 19,978 23,610 23,460 26,242
Plastics* 8,974 12,878 14,948 16,438
Fertilizers 506 899 4,851 5,805
Value Added ($M)
Total Manufacturing 36,750 48,776 62,035 71,080
Aluminum 147 189 204 223
Steel 3,166 3,704 3,619 4,024
Plastics* 768 1,098 1,282 1,414
Fertilizers 75 131 688 822
Labor Income ($M)
Total Manufacturing 23,826 31,558 39,355 44,872
Aluminum 101 130 140 153
Steel 2,105 2,455 2,389 2,658
Plastics* 523 739 868 961
Fertilizers 50 88 460 550
Economic Contribution Summary
Includes NAICS Code 3261 (plastics); does not include rubber (3262) or resins (3252).
Source: IHS
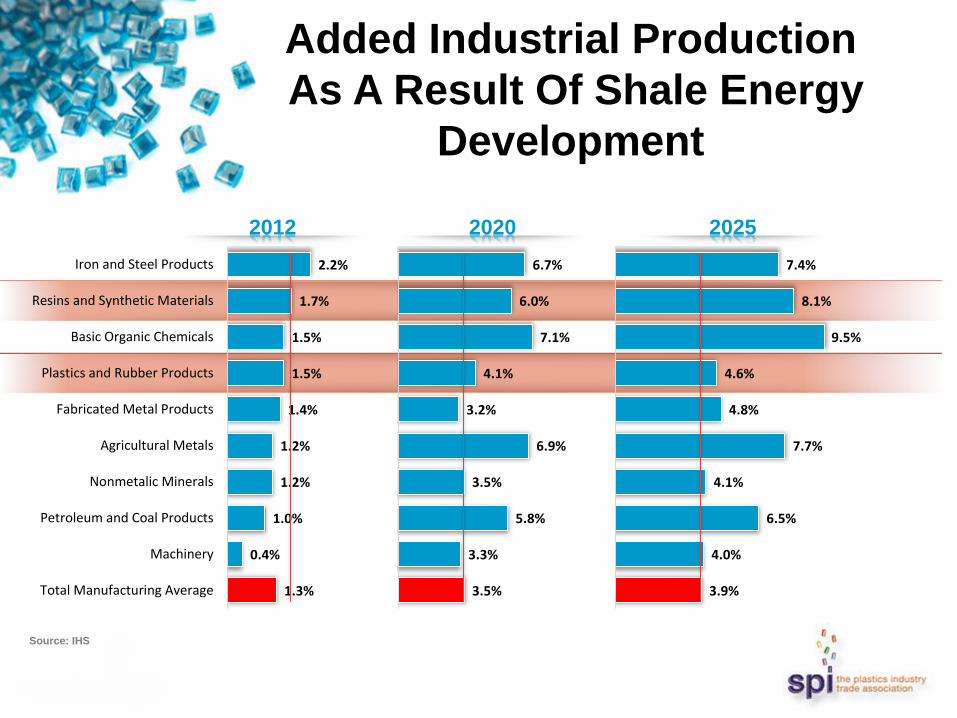
Added Industrial Production
As A Result Of Shale Energy
Development
Source: IHS
2.2%
1.7%
1.5%
1.5%
1.4%
1.2%
1.2%
1.0%
0.4%
1.3%
Iron and Steel Products
Resins and Synthetic Materials
Basic Organic Chemicals
Plastics and Rubber Products
Fabricated Metal Products
Agricultural Metals
Nonmetalic Minerals
Petroleum and Coal Products
Machinery
Total Manufacturing Average
2012
6.7%
6.0%
7.1%
4.1%
3.2%
6.9%
3.5%
5.8%
3.3%
3.5%
2020
7.4%
8.1%
9.5%
4.6%
4.8%
7.7%
4.1%
6.5%
4.0%
3.9%
2025
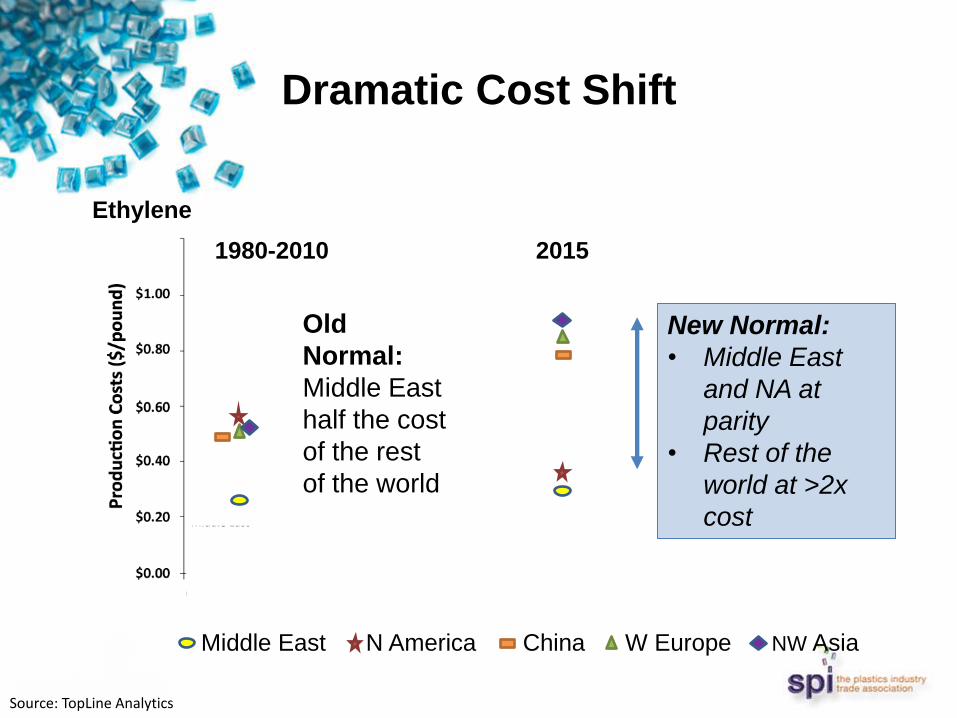
Dramatic Cost Shift
Ethylene
1980-2010
Middle East N America China W Europe NW Asia
Old
Normal:
Middle East
half the cost
of the rest
of the world
2015
New Normal:
• Middle East
and NA at
parity
• Rest of the
world at >2x
cost
Source: TopLine Analytics
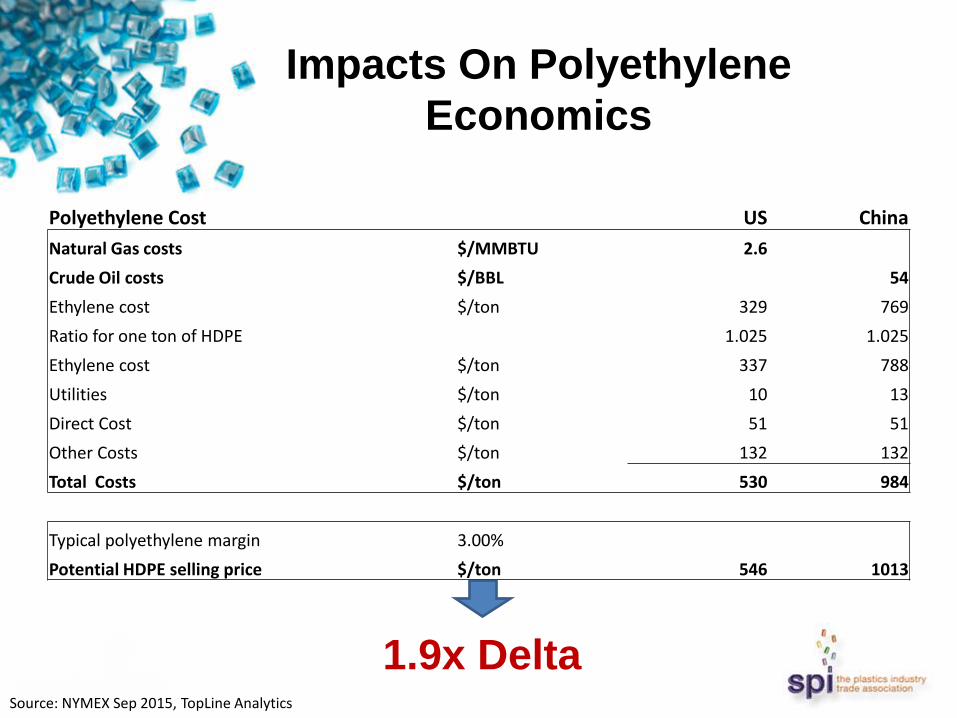
Impacts On Polyethylene
Economics
1.9x Delta Source: NYMEX Sep 2015, TopLine Analytics
Polyethylene Cost US China
Natural Gas costs $/MMBTU 2.6
Crude Oil costs $/BBL 54
Ethylene cost $/ton 329 769
Ratio for one ton of HDPE 1.025 1.025
Ethylene cost $/ton 337 788
Utilities $/ton 10 13
Direct Cost $/ton 51 51
Other Costs $/ton 132 132
Total Costs $/ton 530 984
Typical polyethylene margin 3.00%
Potential HDPE selling price $/ton 546 1013
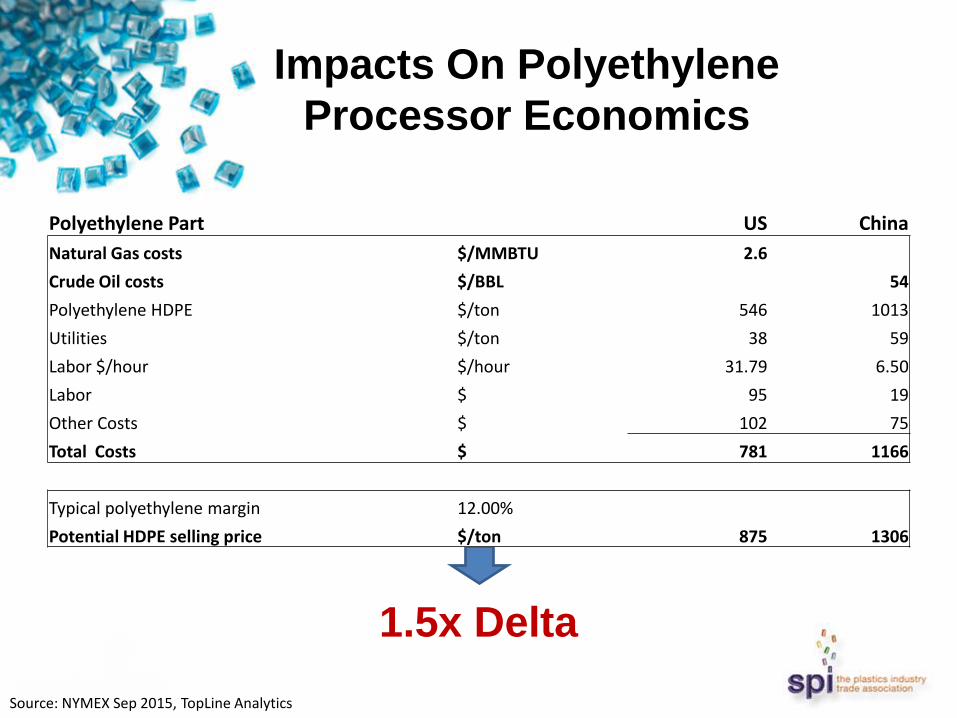
Impacts On Polyethylene
Processor Economics
1.5x Delta
Source: NYMEX Sep 2015, TopLine Analytics
Polyethylene Part US China
Natural Gas costs $/MMBTU 2.6
Crude Oil costs $/BBL 54
Polyethylene HDPE $/ton 546 1013
Utilities $/ton 38 59
Labor $/hour $/hour 31.79 6.50
Labor $ 95 19
Other Costs $ 102 75
Total Costs $ 781 1166
Typical polyethylene margin 12.00%
Potential HDPE selling price $/ton 875 1306
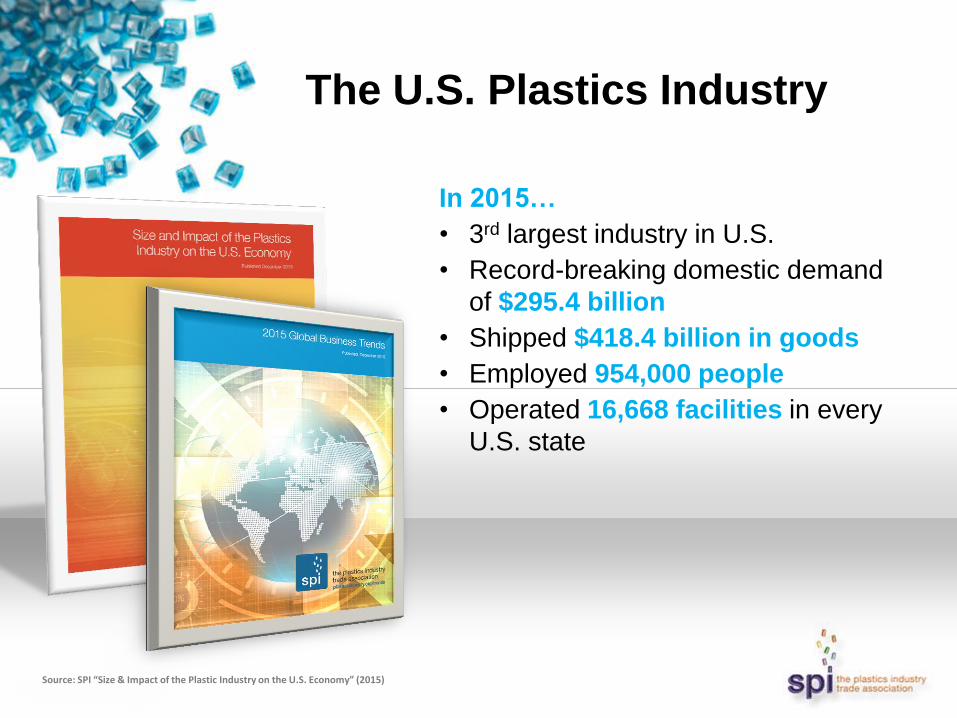
The U.S. Plastics Industry
In 2015…
• 3rd largest industry in U.S.
• Record-breaking domestic demand
of $295.4 billion
• Shipped $418.4 billion in goods
• Employed 954,000 people
• Operated 16,668 facilities in every
U.S. state
Source: SPI “Size & Impact of the Plastic Industry on the U.S. Economy” (2015)
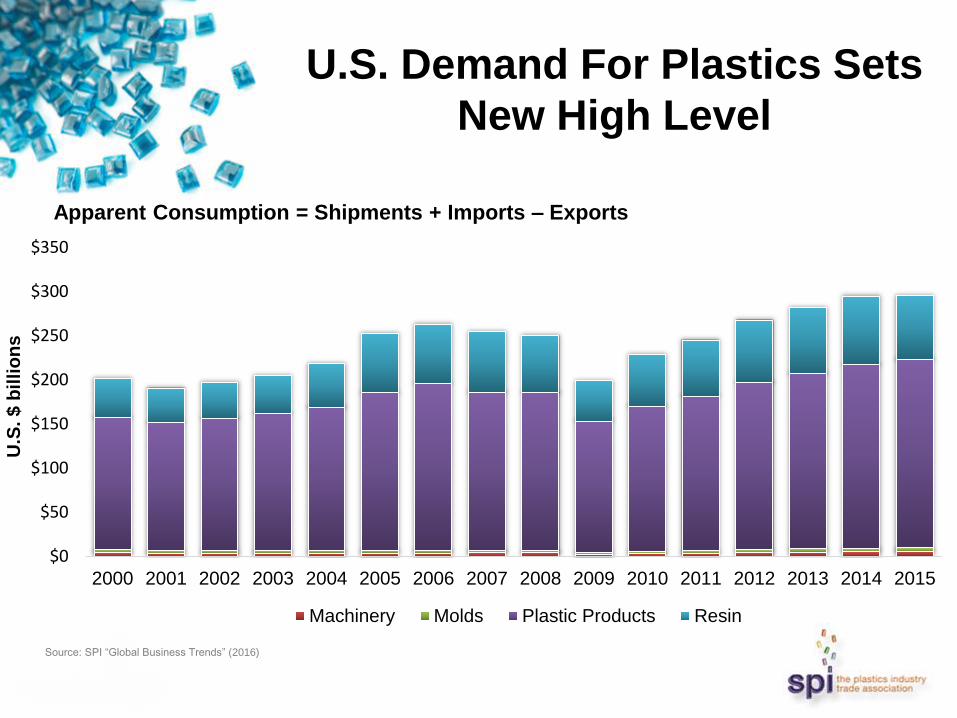
U.S. Demand For Plastics Sets
New High Level
$0
$50
$100
$150
$200
$250
$300
$350
2000 2001 2002 2003 2004 2005 2006 2007 2008 2009 2010 2011 2012 2013 2014 2015
U.S
. $
bil
lio
ns
Machinery Molds Plastic Products Resin
Apparent Consumption = Shipments + Imports – Exports
Source: SPI “Global Business Trends” (2016)
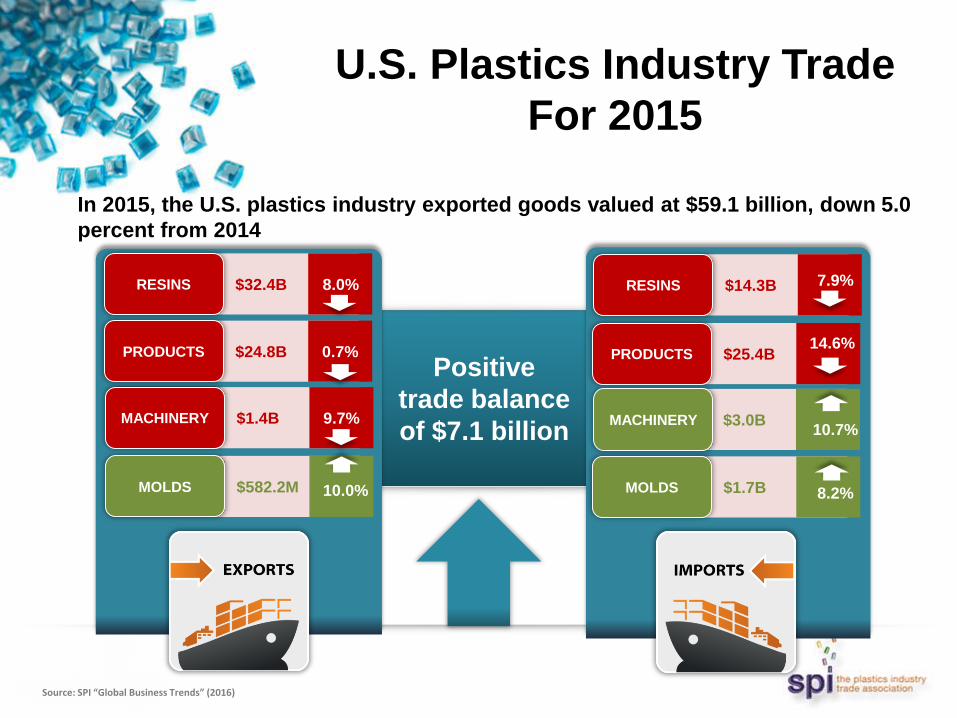
Positive
trade balance
of $7.1 billion
U.S. Plastics Industry Trade
For 2015
In 2015, the U.S. plastics industry exported goods valued at $59.1 billion, down 5.0
percent from 2014
$32.4B RESINS 8.0%
$24.8B PRODUCTS 0.7%
$582.2M MOLDS 10.0%
$1.4B MACHINERY 9.7%
$14.3B RESINS 7.9%
$25.4B PRODUCTS
$3.0B MACHINERY
$1.7B MOLDS
14.6%
10.7%
8.2%
Source: SPI “Global Business Trends” (2016)
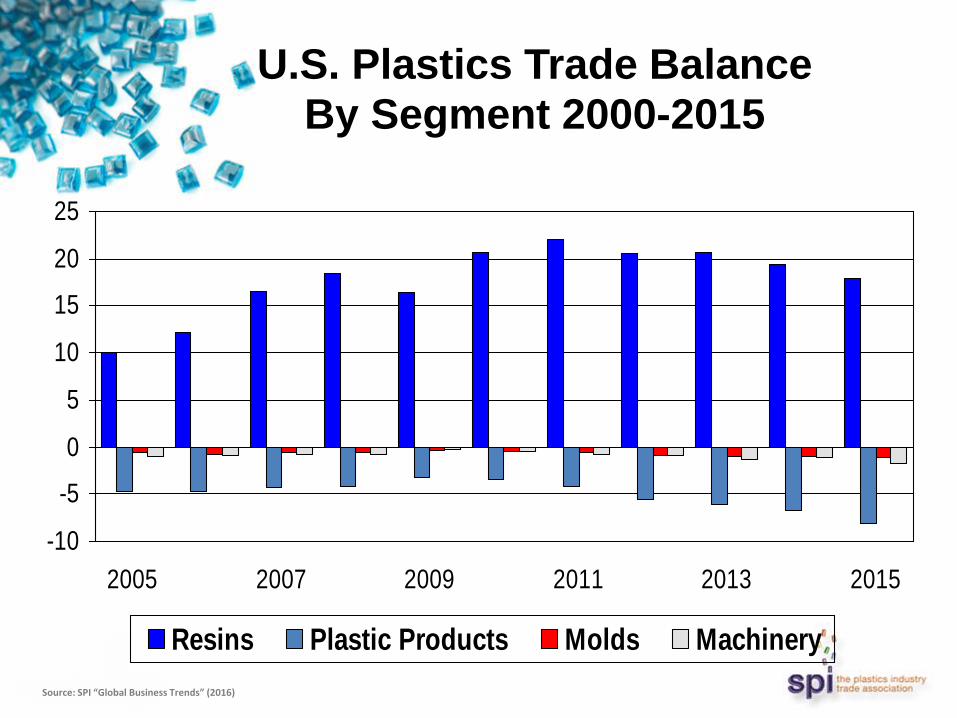
-10
-5
0
5
10
15
20
25
2005 2007 2009 2011 2013 2015
Resins Plastic Products Molds Machinery
U.S. Plastics Trade Balance By Segment 2000-2015
Source: SPI “Global Business Trends” (2016)
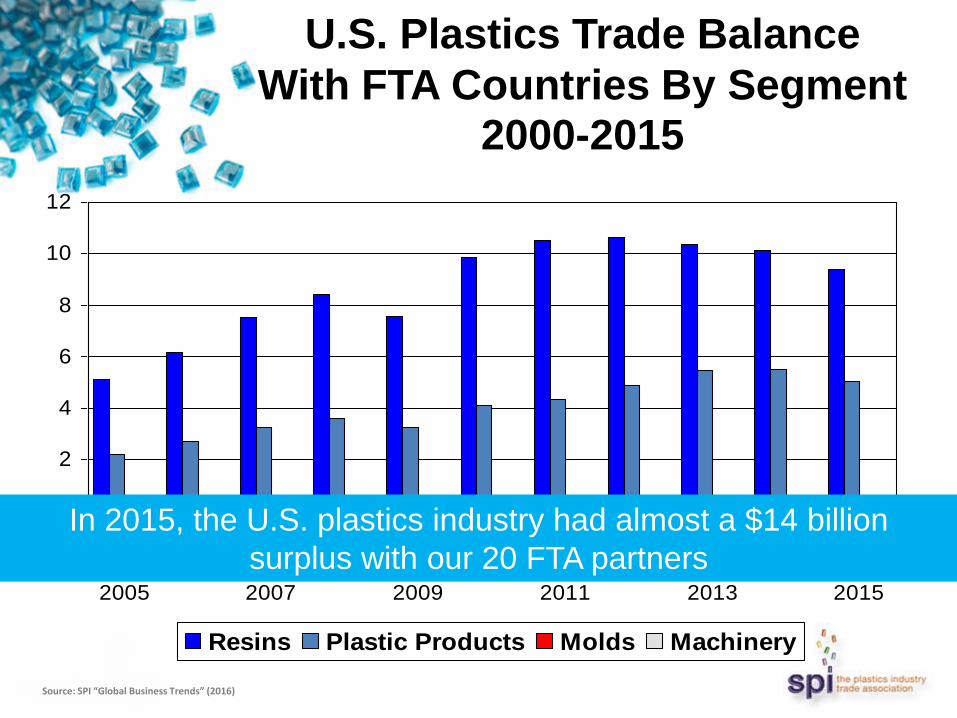
-2
0
2
4
6
8
10
12
2005 2007 2009 2011 2013 2015
Resins Plastic Products Molds Machinery
U.S. Plastics Trade Balance
With FTA Countries By Segment 2000-2015
In 2015, the U.S. plastics industry had almost a $14 billion
surplus with our 20 FTA partners
Source: SPI “Global Business Trends” (2016)
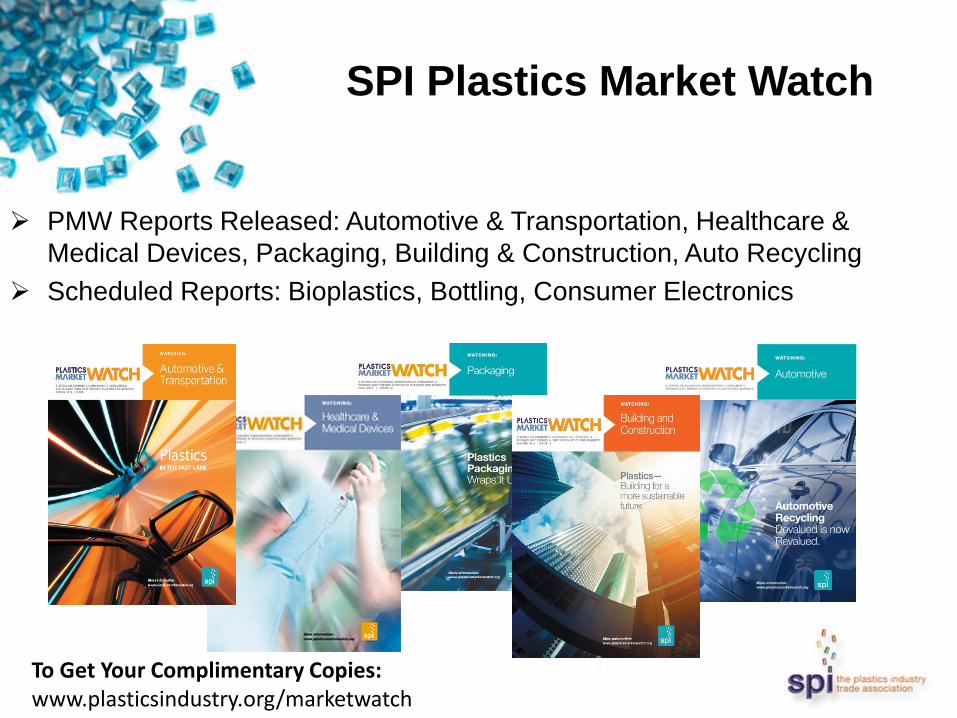
PMW Reports Released: Automotive & Transportation, Healthcare &
Medical Devices, Packaging, Building & Construction, Auto Recycling
Scheduled Reports: Bioplastics, Bottling, Consumer Electronics
SPI Plastics Market Watch
To Get Your Complimentary Copies: www.plasticsindustry.org/marketwatch
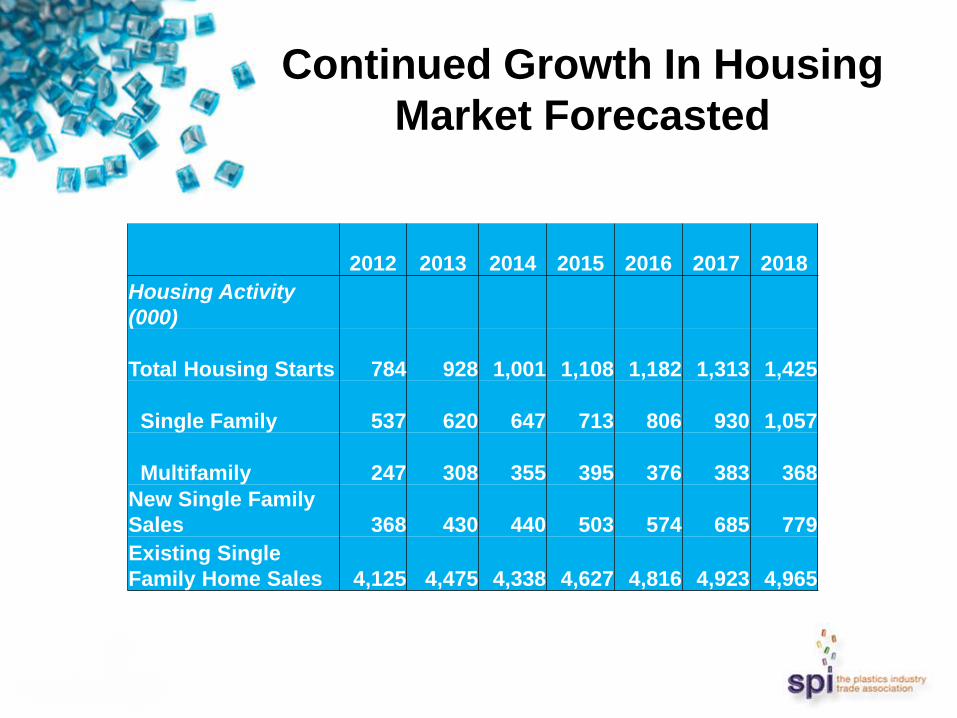
Continued Growth In Housing
Market Forecasted
2012 2013 2014 2015 2016 2017 2018
Housing Activity
(000)
Total Housing Starts 784 928 1,001 1,108 1,182 1,313 1,425
Single Family 537 620 647 713 806 930 1,057
Multifamily 247 308 355 395 376 383 368
New Single Family
Sales 368 430 440 503 574 685 779
Existing Single
Family Home Sales 4,125 4,475 4,338 4,627 4,816 4,923 4,965
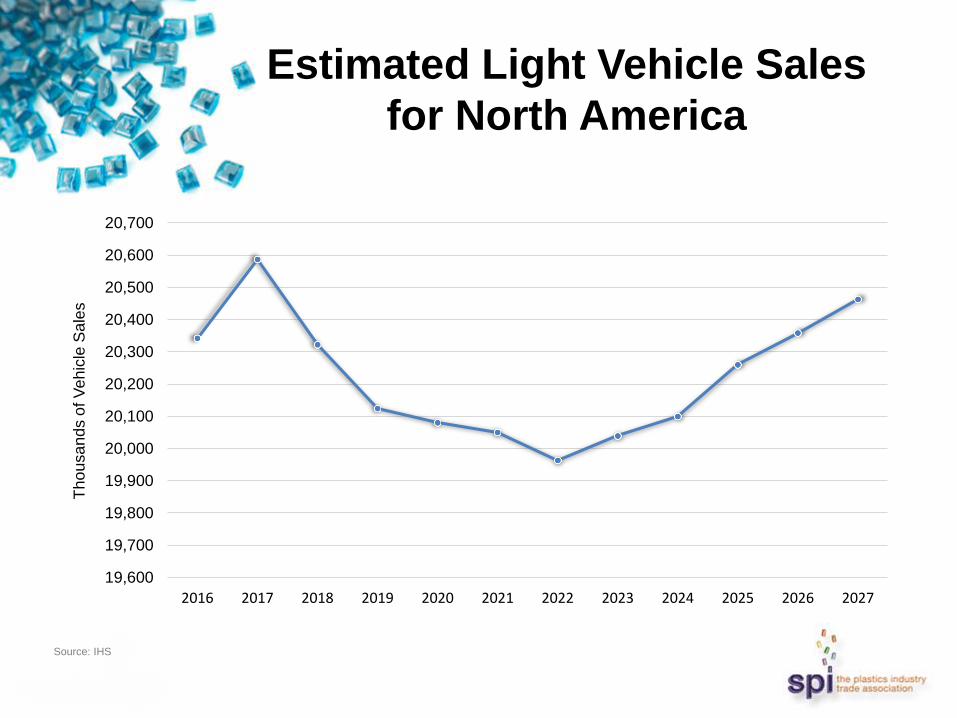
Estimated Light Vehicle Sales
for North America
19,600
19,700
19,800
19,900
20,000
20,100
20,200
20,300
20,400
20,500
20,600
20,700
2016 2017 2018 2019 2020 2021 2022 2023 2024 2025 2026 2027
Th
ou
sa
nd
s o
f V
eh
icle
Sa
les
Source: IHS
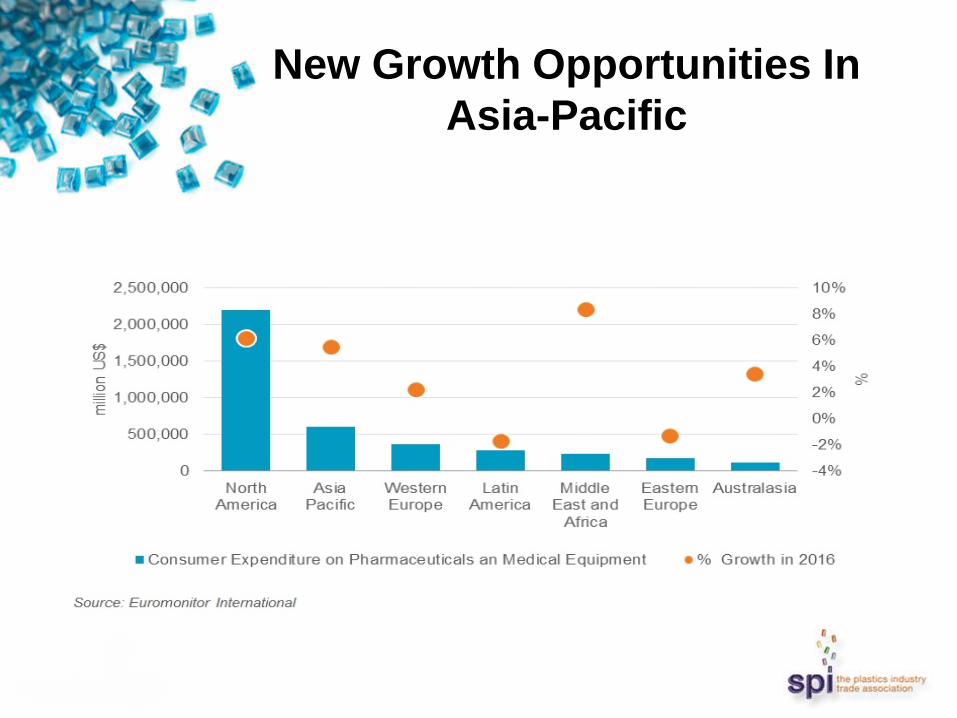
New Growth Opportunities In
Asia-Pacific
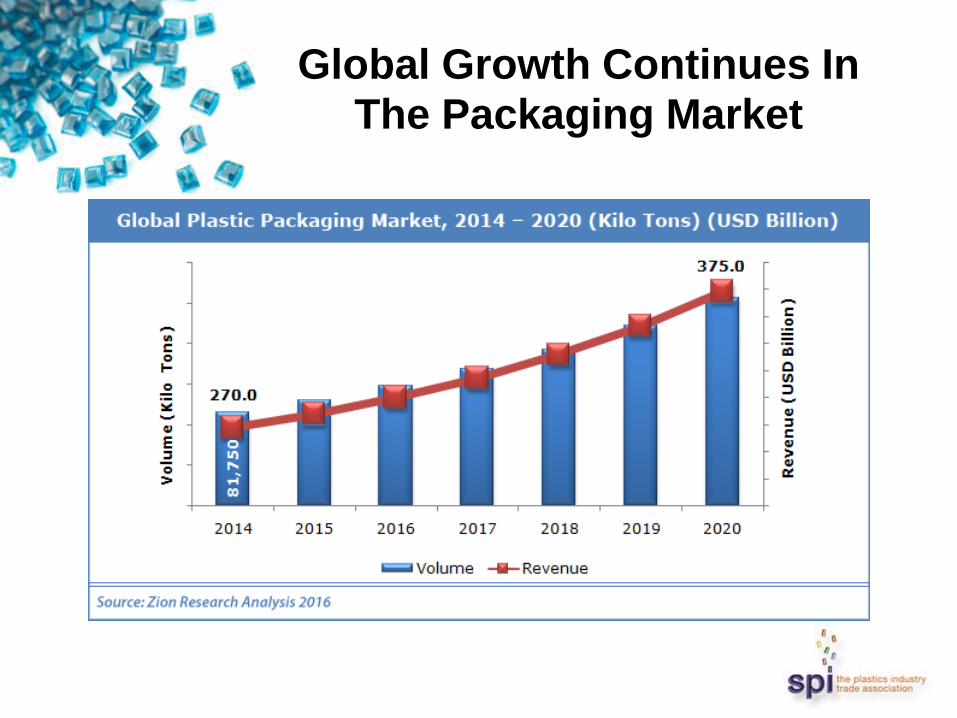
Global Growth Continues In The Packaging Market
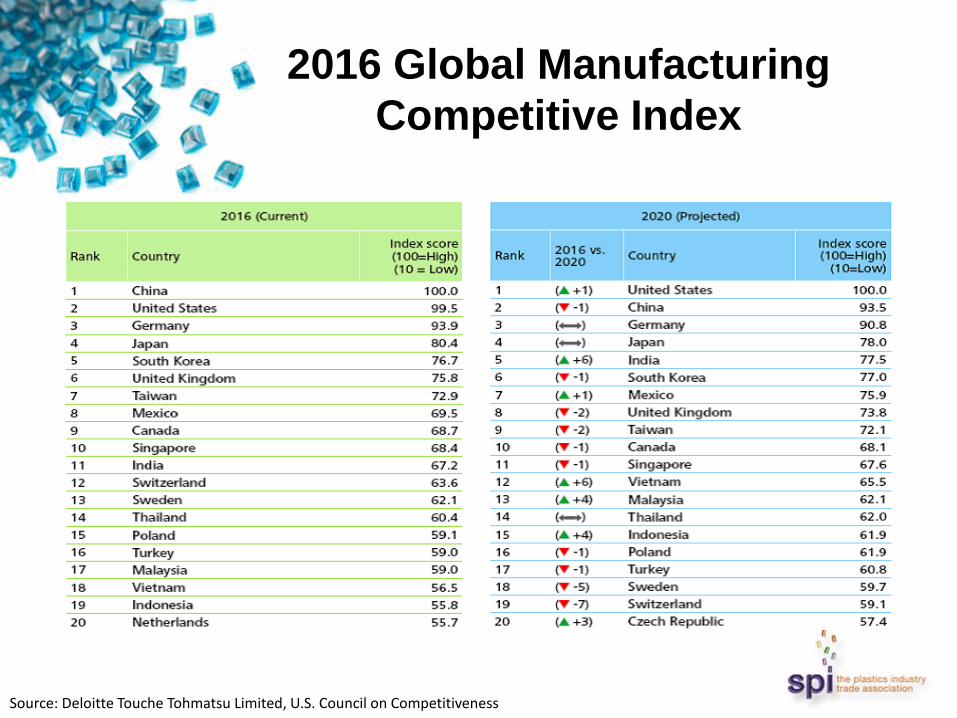
2016 Global Manufacturing
Competitive Index
Source: Deloitte Touche Tohmatsu Limited, U.S. Council on Competitiveness
Shifting Dynamics Among
Global Manufacturing Nations
• As the digital and physical worlds converge within
manufacturing, executives indicate the path to
manufacturing competitiveness is through advanced
technologies.
• Shift to higher value, advanced manufacturing tilts the
advantage to developed nations in the future.
• Two regional clusters of strength emerge.
• BRIC breaks down.
• The rise of the “Mighty Five“ (Malaysia, India, Thailand,
Indonesia and Vietnam or MITI-V).
Concluding Thoughts
• Manufacturing renaissance?
• Transformed global energy situation
• Reshoring
• Skilled labor shortage
• Advanced manufacturing, smart manufacturing, innovation, productivity
• Additive manufacturing
• Whither free trade?
• Risks – Known
– Unknown
Thank You!
谢谢 Merci Vielen Dank
Grazie ありがとうございました 감사합니다
Obrigado Спасибо Gracias Teşekkürler
Questions & Answers
Michael Taylor
Vice President, International Affairs & Trade
+1 202-974-5232